Embed Size (px)
Citation preview

CHAPTER TWO
2-1
Facility planning begins with a definition of demand that may reasonably be expected to occur during the useful life of its key components. In airport master planning, this involves projecting potential aviation activity over at least a twenty-year time-frame. For a general aviation reliever airport such as New Century AirCenter (IXD), forecasts of based aircraft and operations (takeoffs or landings) serve as the basis for facility planning.
FAA Advisory Circular 150/5070-6A, Airport Master Plans, outlines six standard steps involved in the forecast process, as follows:
1)
2)
3)
4)
5)
6)
AVIATIONDEMAND FORECASTS
Obtain existing FAA and other related forecasts for the area served by the airport.
Determine if there have been significant local conditions or changes in the forecast factors.
Make and document any adjustments to the aviation activity forecasts.
Where applicable, consider the effects of changes in uncertain factors affecting demand for airport services.
Evaluate the potential for peak loads within the overall forecasts of aviation activity.
Monitor actual activity levels over time to determine if adjustments are necessary in the forecasts.
2-2
Aviation activity can be affected bymany influences on the local, regional,and national level, making it virtuallyimpossible to predict year-to-yearfluctuations of activity over twentyyears with any certainty. Therefore, itis important to remember that forecastsare to serve only as guidelines, andplanning must remain flexible enoughto respond to a range of unforeseendevelopments.
The following forecast analysisexamines recent developments,historical information, and currentaviation trends to provide an updatedset of aviation-demand projections forIXD. The intent is to permit theJohnson County Airport Commission tomake planning adjustments asnecessary to ensure that the facilitymeets projected demands in an efficientand cost-effective manner.
FORECASTING APPROACH
The development of aviation forecastsproceeds through both analytical andjudgmental processes. A series ofmathematical relationships is tested toestablish statistical logic and rationalefor projected growth. However, thejudgement of the forecast analyst, basedupon professional experience,knowledge of the aviation industry, andassessment of the local situation, isimportant in the final determination ofthe preferred forecast.
The most reliable approach toestimating aviation demand is throughthe utilization of more than oneanalytical technique. Methodologies
frequently considered include trend lineprojections, correlation/regressionanalysis, and market share analysis.
Trend line projections are probablythe simplest and most familiar of theforecasting techniques. By fittinggrowth curves to historical demanddata, then extending them into thefuture, a basic trend line projection isproduced. A basic assumption of thistechnique is that outside factors willcontinue to affect aviation demand inmuch the same manner as in the past.As broad as this assumption may be,the trend line projection does serve as areliable benchmark for comparing otherprojections.
Correlation analysis provides ameasure of the direct relationshipbetween two separate sets of historicdata. Should there be a reasonablecorrelation between the data sets,further evaluation using regressionanalysis may be employed.
Regression analysis measures thestatistical relationship betweendependent and independent variablesyielding a “correlation coefficient.” Thecorrelation coefficient (Pearson’s “r”)measures the association betweenchanges in a dependent variable andindependent variable(s). If the r-squared (r2) value (coefficientdetermination) is greater than 0.90, itindicates good predictive reliability. Avalue below 0.90 may be used with theunderstanding that the predictivereliability is lower.
Market share analysis involves ahistorical comparison of airport activity

2-3
as a percentage, or share, of a largerregional, state, or national variable.These shares are then multiplied by theforecasts of the larger geographical areato produce a market share projection.This method has the same limitationsas trend line projections, but canprovide a useful check on the validity ofother forecasting techniques.
A number of additional sources foraviation forecasts were also consulted.The Mid-America Regional Council(MARC), which is the regionalMetropolitan Planning Organization(MPO), has developed a regionalaviation system plan. As New CenturyAirCenter is within the jurisdiction ofthe MPO, it is included in the systemplan. The consulted plan is the AirportsSystem Plan 2010 as published in May1991. The MPO is currently developinga revised system plan. Should thisinformation become available duringthe course of this master plan, it will beincorporated.
The FAA publishes the Terminal AreaForecast (TAF) which provides aviationforecasts for National Plan ofIntegrated Airport Systems (NPIAS)airports. This information is consultedand presented as a comparative forecastin the forecasts presented herein.
In 1988, a master plan was completedfor New Century AirCenter. Althoughthe aviation industry has experiencedunanticipated changes and events sincethat plan, the forecasts are presented asa point of comparison.
It is important to note that one shouldnot assume a high level of confidence in
forecasts that extend beyond five years.Facility and financial planning usuallyrequire at least a 10-year view, since itoften takes more than five years tocomplete a major facility developmentprogram. However, it is important touse forecasts which do not overestimaterevenue-generating capabilities orunderstate demand for facilities neededto meet public (user) needs.
A wide range of factors is known toinfluence the aviation industry and canhave significant impacts on the extentand nature of air service provided inboth the local and national markets.Technological advances in aviation havehistorically altered, and will continue tochange, the growth rates in aviationdemand over time. The most obviousexample is the impact of jet aircraft onthe aviation industry, which resulted ina growth rate that far exceededexpectations. Such changes aredifficult, if not impossible, to predict,and there is simply no mathematicalway to estimate their impacts. Using abroad spectrum of local, regional, andnational socioeconomic and aviationinformation, and analyzing the mostcurrent aviation trends, forecasts arepresented in the following sections.
NATIONAL AVIATIONTRENDS
Each year, the Federal AviationAdministration (FAA) publishes itsnational forecast. Included in thispublication are forecasts for large aircarriers, regional air carriers, generalaviation, along with FAA workloadmeasures. The forecasts are prepared

2-4
to meet budget and planning needs ofconstituent units of the FAA and toprovide information that can be used bystate and local authorities, the aviationindustry, and the general public. Thecurrent edition, when this chapter wasprepared, is FAA Aerospace Forecasts-Fiscal Years, 2005-2016. The forecastuses the economic performance of theUnited States as an indicator of futureaviation industry growth. Similareconomic analyses are applied to theoutlook for aviation growth ininternational markets.
In the seven years prior to the events of9/11, the U.S. civil aviation industryexperienced unprecedented growth indemand and profits. The impacts to theeconomy and aviation industry from theevents of 9/11 were immediate andsignificant. However, the economicclimate and aviation industry are bothexperiencing significant upturns. TheFAA expects the U.S. economy toexperience strong growth over the nextfew years, with moderate growththereafter. This will positivelyinfluence the aviation industry, leadingto passenger, air cargo, and generalaviation growth throughout the forecastperiod (assuming there will not be anynew successful terrorists’ incidentsagainst either U.S. or world aviation).
For the first time since 2000, thenumber of passenger enplanements onU.S. commercial carriers increased in2004. This is due, in large part, to theextremely strong growth of low-costcarriers such as Southwest Airlines andAirTran Airways, among others. A totalof 502.2 million passengers wereenplaned in 2004, up four percent from
2003, but still 10.6 percent below the2000 peak. Over the forecast period,enplanements are expected to grow 2.9percent annually.
Regional / commuter passengerenplanements are projected to increaseby 15.4 percent in 2005, 9.9 percent in2006, and 6.3 percent in 2007. Between2008 and 2016, enplanements areprojected to grow at an average rate of3.9 percent annually, reaching 245.5million by 2016. Over the entire 12-year forecast period, passengerenplanements are forecast to grow 5.5percent annually.
An additional measure of the health ofthe aviation system is the trend in aircargo as measured in revenue-ton-miles(RTM). The FAA projects air cargoRTMs to grow at 5.1 percent annually.
GENERAL AVIATION
In the 10 years since the passage of theGeneral Aviation Revitalization Act of1994 (federal legislation which limitsthe liability on general aviation aircraftto 18 years from the date ofmanufacture), it is clear that the Acthas successfully infused new life intothe general aviation industry. Thislegislation sparked an interest to renewthe manufacturing of general aviationaircraft due to the reduction in productliability, as well as renewed optimismfor the industry. Annual shipments ofnew aircraft rose every year between1994 and 2000.
The growth in the general aviationindustry slowed considerably from 2001
2-5
to 2003, having been negativelyimpacted by the events of 9/11.Thousands of general aviation aircraftwere grounded for weeks, due to “no-flyzone” restrictions imposed on operationsof aircraft in security-sensitive areas.Washington, D.C., continues toimplement these restrictions to thisday. This, in addition to the economicrecession taking place from 2001-03,had a negative impact on the generalaviation industry.
In 2004, the general aviation industryshowed a significant increase inactivity, returning to pre-9/11 levels formost indicators. The FAA forecastassumes that the regulatoryenvironment affecting general aviationwill not change dramatically. Theforecast also assumes that thefractional ownership market willcontinue to expand and bring newoperators and shareholders intobusiness aviation. It also assumes thatanother successful terrorist attack onaviation will not occur.
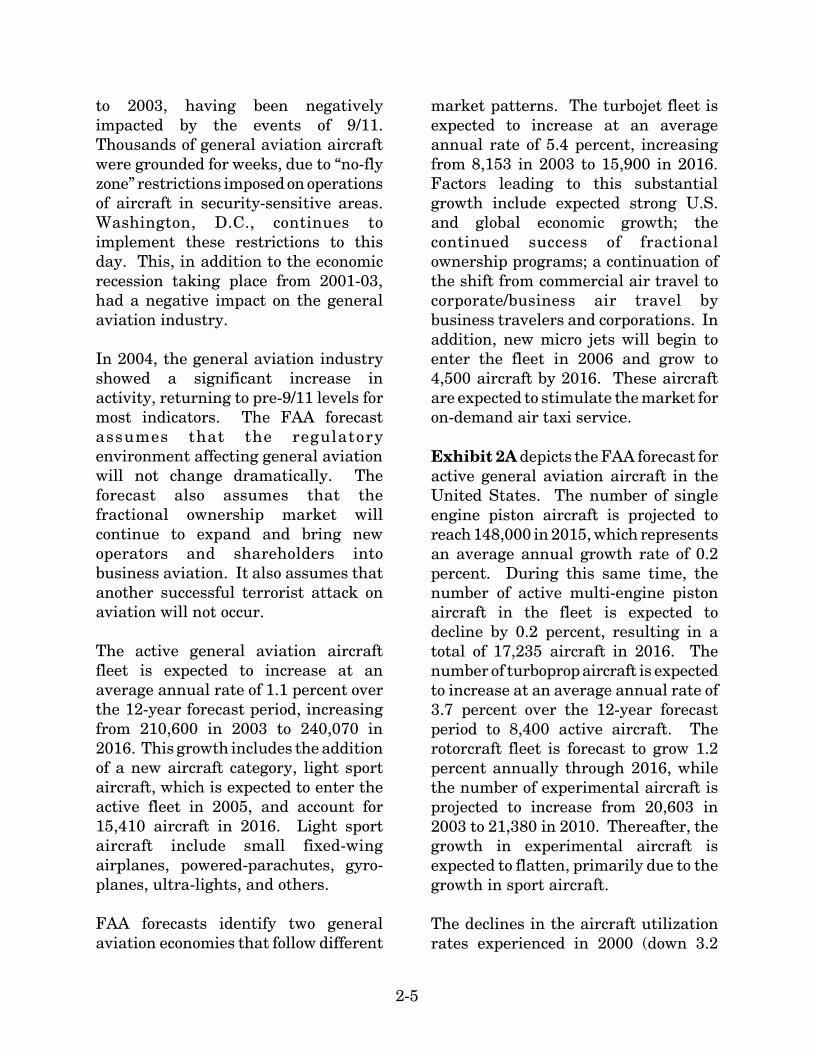
The active general aviation aircraftfleet is expected to increase at anaverage annual rate of 1.1 percent overthe 12-year forecast period, increasingfrom 210,600 in 2003 to 240,070 in2016. This growth includes the additionof a new aircraft category, light sportaircraft, which is expected to enter theactive fleet in 2005, and account for15,410 aircraft in 2016. Light sportaircraft include small fixed-wingairplanes, powered-parachutes, gyro-planes, ultra-lights, and others.
FAA forecasts identify two generalaviation economies that follow different
market patterns. The turbojet fleet isexpected to increase at an averageannual rate of 5.4 percent, increasingfrom 8,153 in 2003 to 15,900 in 2016.Factors leading to this substantialgrowth include expected strong U.S.and global economic growth; thecontinued success of fractionalownership programs; a continuation ofthe shift from commercial air travel tocorporate/business air travel bybusiness travelers and corporations. Inaddition, new micro jets will begin toenter the fleet in 2006 and grow to4,500 aircraft by 2016. These aircraftare expected to stimulate the market foron-demand air taxi service.
Exhibit 2A depicts the FAA forecast foractive general aviation aircraft in theUnited States. The number of singleengine piston aircraft is projected toreach 148,000 in 2015, which representsan average annual growth rate of 0.2percent. During this same time, thenumber of active multi-engine pistonaircraft in the fleet is expected todecline by 0.2 percent, resulting in atotal of 17,235 aircraft in 2016. Thenumber of turboprop aircraft is expectedto increase at an average annual rate of3.7 percent over the 12-year forecastperiod to 8,400 active aircraft. Therotorcraft fleet is forecast to grow 1.2percent annually through 2016, whilethe number of experimental aircraft isprojected to increase from 20,603 in2003 to 21,380 in 2010. Thereafter, thegrowth in experimental aircraft isexpected to flatten, primarily due to thegrowth in sport aircraft.
The declines in the aircraft utilizationrates experienced in 2000 (down 3.2
2-6
percent) and 2001 (down 7.2 percent)were due, in part, to higher fuel pricesand the 2001 U.S. economic recession.However, the restrictions placed ongeneral aviation in the aftermath of the9/11 events, contributed heavily to thedecline in utilization in 2001. A strongrecovery in the U.S. economy in 2004and 2005 has led to increasedutilization rates for most categories ofgeneral aviation aircraft.
The total pilot population is projected toincrease from an estimated 618,633 in2004, to 750,260 by 2016, whichrepresents an average annual growthrate of 1.6 percent. The student pilotpopulation increased 0.7 percent in2004, and is forecast to increase at anannual rate of 1.8 percent over the 12-year forecast period, reaching a total of108,800 in 2016. Growth rates for theother pilot categories over the forecastperiod are as follows: airline transportpilots, up 1.7 percent; recreationalpilots, up 1.6 percent; rotorcraft only, up1.2 percent; and glider only, up 0.2percent.
The General Aviation ManufacturersAssociation (GAMA) publishes a yearlyoutlook on the general aviationindustry. The most recent edition waspublished in early 2005. The year 2004was a year of strong recovery for thegeneral aviation industry. Totalbillings reached almost $12 billion,which is nearly 20 percent growth over2003. GAMA forecasts the industry willcontinue a strong growth trend.
Over the past several years, the generalaviation industry has launched a seriesof programs and initiatives whose main
goals are to promote and assure futuregrowth within the industry. “No Plane,No Gain” is an advocacy programcreated in 1992 by the GAMA and theNational Business Aircraft Association(NBAA) to promote acceptance andincreased use of general aviation as anessential, cost-effective tool forbusinesses.
Other programs are intended topromote growth in new pilot starts andintroduce people to general aviation.“Project Pilot,” sponsored by theAircraft Owners and Pilots Association(AOPA), promotes the training of newpilots in order to increase and maintainthe size of the pilot population. The “Bea Pilot” program is jointly sponsoredand supported by more than 100industry organizations. The NBAAsponsors “AvKids,” a program designedto educate elementary school studentsabout the benefits of business aviationto the community, and careeropportunities available to them inbusiness aviation. Over the years,programs such as these have played animportant role in the success of generalaviation and will continue to be vital toits growth in the future.
AIRPORT SERVICE AREA
The initial step in determining thegeneral aviation demand for an airportis to define its generalized service area.The airport service area is determinedprimarily by evaluating the location ofcompeting airports, their capabilitiesand services, and their relativeattraction and convenience. With thisinformation, a determination can be

U.S. ACTIVE GENERAL AVIATION AIRCRAFT (in thousands)
2004(Est.)
2008
2012
2016
144.0
145.5
147.0
148.0
7.3
7.7
8.1
8.4
6.2
6.1
5.9
5..8
211.3
227.7
233.9
240.1
Year
20.8
21.3
21.4
21.4
FIXED WING
Source: FAA Aerospace Forecasts, Fiscal Years 2005-2016.
Notes: An active aircraft is one that has a current registration and was flown at least one hour during the calendar year.
8.4
10.5
13.3
15.9
17.7
17.5
17.4
17.2
PISTON ROTORCRAFT
2.2
2.4
2.5
2.6
4.7
4.9
5.1.
5.3
TURBINESingleEngine Turboprop Other
N/A
10.8
13.2
15.4
SportAircraft TotalExperimentalTurbojet
Multi-Engine Piston Turbine
U.S. ACTIVE GENERAL AVIATION AIRCRAFTACTUALACTUAL FORECASTFORECASTACTUAL FORECAST
125
150
175
200
225
AIR
CR
AFT
(in
th
ousa
nds)
1980 1985 1990 1995 2000 2005YEAR
2010
250
120
2015
Exhibit 2AU.S. ACTIVE GENERAL AVIATION
AIRCRAFT FORECASTS
IXD
-04M
P19
-2A
-4/1
1/05

2-7
made as to what volume of aviationdemand would likely be accommodatedby a specific airport. It should be notedthat aviation demand often crossesgeographical and political boundaries.
The airport service area is ageographical area where there is apotential market for airport services.Access to general aviation airports,commercial a ir service, andtransportation networks enter into theequation to determine the size of aservice area, as well as the quality ofaviation facilities, distance, and othersubjective criteria. In largemetropolitan areas, a typical airportservice area will extend up to 20 miles,primarily due to the location ofcompeting airports. Depending onservices available, airports within 30miles may have an influence on theservice area as well.
As in any business enterprise, the moreattractive the facility is in services andcapabilities, the more competitive it willbe in the market. As the level ofattractiveness expands, so will theservice area. If an airport’sattractiveness increases in relation tonearby airports, so will the size of theservice area. If facilities are adequate,and rates and fees are competitive,some level of general aviation activitymight be attracted to the airport fromsurrounding areas.
In determining the aviation demand foran airport, it is necessary to identify therole of that airport. The primary role ofNew Century AirCenter is to serve theneeds of general aviation in the area.
General aviation is a term used todescribe a diverse range of aviationactivities which includes all segments ofthe aviation industry except commercialair carriers and military. This includesrecreational flying in single engineaircraft, up to corporate business jets.
REGIONAL AIRPORTS
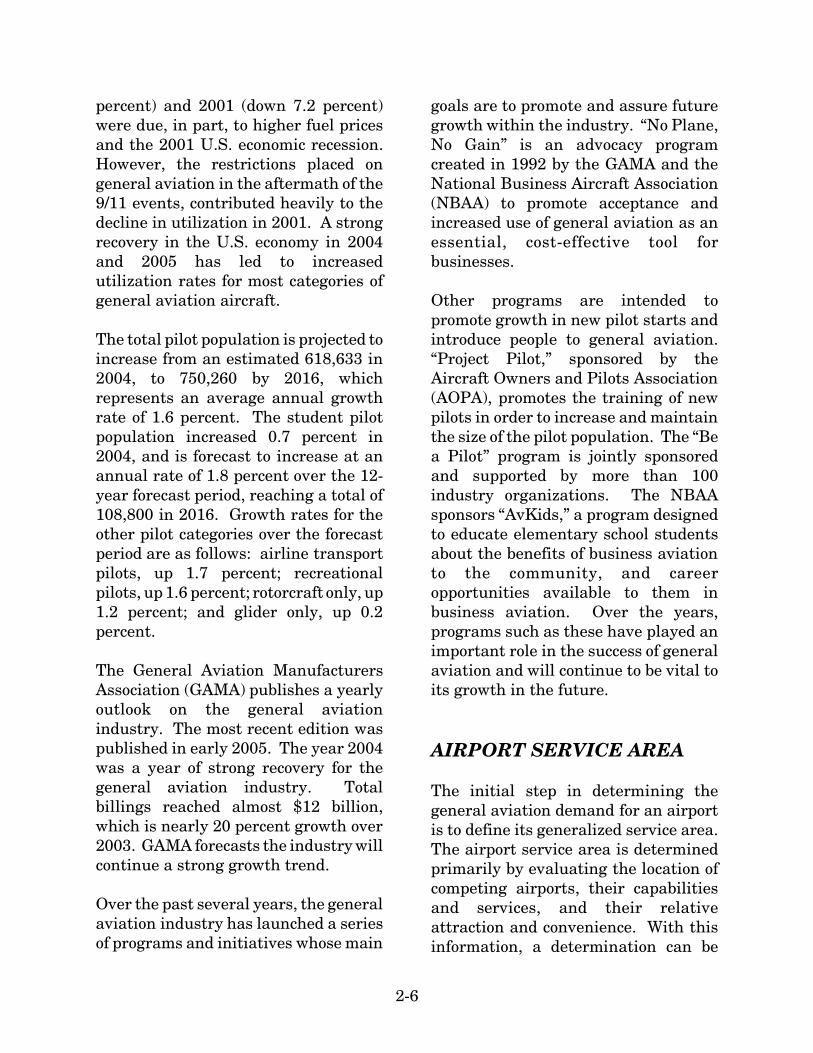
A review of public use airports within a20- and 30-nautical mile (nm) radius ofNew Century AirCenter was made toidentify and distinguish the types of airservice provided in the region. Theseairports are identified on Exhibit 2B.Information pertaining to each airportwas obtained from FAA Form 5010,Airport Master Record. Table 2A showsa summary of the regional public useairports.
Gardner Municipal Airport (K34) islocated three nm to the southwest ofIXD. The airport is owned and operatedby the City of Gardner. The airport hasone asphalt runway and two turfrunways. The paved runway, Runway8-26, is 2,960 feet long by 39 feet wide,is in good condition, with a pavementstrength rating of 6,000 pounds single-wheel loading (SWL). SWL refers to thedesign of certain landing gearconfigurations that have a single wheelon each main landing gear strut. Otherlanding gear configurations wouldinclude dual wheel (DWL), dual tandemwheel (DTL), and double dual tandem(DDTL). Each of these distributes moreof the aircraft weight on runway andtaxiway surfaces, and thus, the surfaceitself can support a greater total

2-8
aircraft weight. The airport reportsapproximately 90 based aircraft and
approximately 51,000 annualoperations.
TABLE 2AAirport Data for Public Use Airports Within 20 and 30 nmNew Century AirCenter
Airport NameFAA
ClassificationRegionalLocation
LongestRunway (ft.)
BasedAircraft
AnnualOperations
Gardner Municipal GeneralAviation 3 nm SW 2,960 90 51,000
Johnson CountyExecutive Reliever 7 nm E 4,098 263 90,000
Miami CountyGeneralAviation 17 nm S 3,400 23 6,500
Lawrence Municipal GeneralAviation 19 nm NW 5,700 62 33,000
Airports Within 30 nmCharles B. WheelerDowntown Airport Reliever 22 nm NE 7,002 300 144,000
Ottawa Municipal GeneralAviation 24 nm SW 4,500 25 5,000
Lee's Summit Reliever 25 nm E 4,015 170 104,000
HarrisonvilleGeneralAviation 29 nm E 4,000 58 12,000
Kansas CityInternational
CommercialService 30 nm NE 10,801 0 165,000
Source: FAA Form 5010, AirNav.com
Johnson County Executive Airport(OJC) is located seven nm to the east ofIXD and is also owned by JohnsonCounty and operated by the JohnsonCounty Airport Commission. Theairport has a single runway, Runway18-36, which is 4,098 feet long by 75feet wide, with a pavement strengthrating of 12,500 pounds SWL. Therunway is constructed of concrete andis in good condition. There areapproximately 263 based aircraft. Theairport averages approximately 90,000operations per year. There are anumber of instrument approaches, withthe lowest visibility minimum beingthree-quarters mile. Johnson CountyExecutive Airport is also a reliever
airport to Kansas City InternationalAirport.
Miami County Airport (K81) islocated 17 nm to the south of IXD. Theairport is owned and operated by MiamiCounty and is supported by an asphaltand a turf runway. The asphaltrunway, Runway 3-21, is 3,400 feet longby 60 feet wide and in fair condition.There are 23 based aircraft at theairport and 6,500 annual operations.
Lawrence Municipal Airport (LWC)is located 19 nm to the northwest andmaintains a dual runway system.Lawrence is home to the University ofKansas and is situated equidistant

04M
P19
-2B
-5/5
/05
Exhibit 2BGENERALIZED AIRPORT SERVICE AREA
R AYR AYR AY
C A S S
M I A M IM I A M I
F R A N K L I NF R A N K L I N
J O H N S O NJ O H N S O N
M I A M I
C L AYC L AYC L AY
J A C K S O NJ A C K S O NJ A C K S O N
P L AT T E
F R A N K L I N
D O U G L A SD O U G L A SD O U G L A S
J O H N S O N
L E AV E N W O R T HL E AV E N W O R T HL E AV E N W O R T H
W YA N D O T T EW YA N D O T T EW YA N D O T T E
Miami CountyMiami CountyMiami CountyOttawaOttawaMunicipalMunicipalOttawaMunicipal
New CenturyNew CenturyAirCenterAirCenterNew CenturyAirCenter
Lee's SummitLee's SummitMunicipalMunicipalLee's SummitMunicipal
Lawrence Smith MemorialLawrence Smith MemorialLawrence Smith Memorial
Johnson CountyJohnson CountyExecutiveExecutiveJohnson CountyExecutive
OttawaOttawaOttawa
GardnerGardnerGardner
LawrenceLawrenceLawrenceLenexaLenexaLenexa
ShawneeShawneeShawnee
Kansas CityKansas CityKansas CityIndependenceIndependenceIndependence
Lee's SummitLee's SummitLee's SummitOverland ParkOverland ParkOverland Park
GardnerGardnerMunicipalMunicipal
AirportAirport
GardnerMunicipal
Airport
LenexaLenexa
ShawneeShawnee
Overland ParkOverland Park
Lenexa
OlatheOlatheOlathe
Shawnee
GardnerGardnerGardner
Overland Park
35
35
7070
470435
29
Gardner MunicipalGardner MunicipalGardner Municipal
LawrenceLawrenceMunicipalMunicipalLawrenceMunicipal
Kansas CityKansas CityInternationalInternationalKansas CityInternational
Charles B. WheelerCharles B. WheelerDowntownDowntownCharles B. WheelerDowntown
35
435
NORTH
NOT TO SCALE
J O H N S O NJ O H N S O N
M I A M IM I A M I
J O H N S O N
M I A M I
JO
HN
SO
NJ
OH
NS
ON
DO
UG
LA
SD
OU
GL
AS
JO
HN
SO
N
DO
UG
LA
S
MIA
MI
MIA
MI
FR
AN
KL
INF
RA
NK
LIN
MIA
MI
FR
AN
KL
IN
New CenturyAir Center
Johnson CountyExecutive Airport
Airports
County Boundary
State Boundary
Interstate Highway
Water
Airport Service Area
Counties
LEGEND
2-9
between Kansas City and Topeka,Kansas, the state capitol. PrimaryRunway 15-33 is 5,700 feet long by 100feet wide. Crosswind Runway 1-19 is3,901 feet long by 75 feet wide. Thereare 62 based aircraft and an average of91 operations per day. In addition,Lawrence has an ILS (InstrumentLanding System) approach that enablesaircraft to utilize the airport in poorweather conditions. This airport limitsthe northwestern extent of the servicearea for IXD.
Charles B. Wheeler DowntownAirport (MKC) is located 22 nm to thenortheast of IXD in downtown KansasCity, Missouri. The airport is ownedand operated by the City of KansasCity. The airport is served by tworunways. Primary Runway 1-19 is7,002 feet long by 150 feet wide. It isconstructed of asphalt, grooved, in goodcondition, with a SWL of 100,000pounds. Crosswind Runway 3-21 is5,050 feet long by 150 feet wide. It isalso constructed of asphalt, grooved,and in good condition. This runway hasa SWL of 48,000 pounds. The airporthas approximately 300 based aircraftand experiences approximately 144,000annual operations. There are sixinstrument approach proceduresincluding an ILS on Runway 19 andRunway 3.
Lee’s Summit Municipal Airport(LXT) is located 25 nm to the east ofIXD in Missouri. This airport is also areliever to Kansas City InternationalAirport. The airport is owned andoperated by the City of Lee’s Summit.It is served by Runway 18-36 andRunway 11-29. Primary Runway 18-36
is 4,015 feet long by 75 feet wide,constructed of concrete, in goodcondition, with a SWL of 30,000 pounds.There are published instrumentapproach procedures for all runwaysexcept Runway 11, which is for visualflight rules (VFR) only. There are 170based aircraft at the airport. More than100,000 operations are reportedannually at the airport.
Lawrence Smith Memorial Airport(LRY) is located in Harrisonville,Missouri, 29 nm to the east. Thisairport primarily serves Cass County.This airport has a single, asphaltrunway, Runway 18-36, which isoriented in a north-south manner. Therunway is 4,000 feet long by 75 feetwide. There are 58 based aircraft andthe airport averages 33 operations perday. This airport, along with Lee’sSummit, effectively limits the servicearea of New Century AirCenter to theborder with Missouri.
Kansas City International Airport(MCI) is the commercial service airportserving the greater Kansas City areaand it is located approximately 30 nm tothe northeast. There are threerunways, the longest of which is morethan 10,800 feet in length. The runwaystrength is adequate to serve nearly allcommercial service jet. There are morethan 165,000 operations per year.
SERVICE AREA SUMMARY
The airport service area for NewCentury AirCenter will be influenced byseveral factors. First, the competingairports will influence the distribution

2-10
of the region’s aviation demand. Forsmall aircraft owners, the decision tobase at an airport will continue to bethe result of an airport’s availablehangars, hangar lease rates, and, mostimportantly, the proximity from theirresidence. Thus, the service area forsmall aircraft will be limited to thenorth and west by airports in Gardnerand Lawrence, and to the northeast andeast by Charles B. Wheeler Downtown,Johnson County Executive Airport, andLee’s Summit Airport. The southernboundary of the small aircraft servicearea will also be somewhat limited byMiami County Airport.
New Century AirCenter is wellpositioned to compete for corporateaviation. IXD provides the longestrunway in the region except for KansasCity International Airport. Charles B.Wheeler Downtown Airport has acomparable runway length to NewCentury AirCenter with 7,000 feetavailable. At 5,700 feet, LawrenceMunicipal Airport’s primary runwaycan also accommodate a wide range ofcorporate jets. Thus, the primarycompetitor for the full range ofcorporate aircraft demand at NewCentury AirCenter is Charles B.Wheeler Downtown Airport andLawrence Municipal Airport. JohnsonCounty Executive Airport and Lee’sSummit Municipal Airport also competefor the smaller corporate aircraftactivity. It should be noted that theCity of Lee’s Summit is consideringplans to extend their primary runway to5,500 feet, which would be capable ofsupporting most business jets.
The primary airport service area forNew Century AirCenter will be JohnsonCounty and portions of Douglas,Franklin, and Miami counties. Some ofthe county’s demand will be met bycompeting airports in the region,however, none provides the runwaylength and potential for futureimprovements as does New CenturyAirCenter. While the small aircraftdemand may consider other nearbyairports, high-end corporate aviationdemand in the region will focusprimarily at New Century AirCenter.Exhibit 2B depicts the generalizedservice area for the airport.
COMMERCIAL AVIATIONCONSIDERATIONS
New Century AirCenter currentlyserves as a general aviation airport.Moreover, the FAA has designated it asa reliever airport for Kansas CityInternational Airport (MCI). Thus, theairport serves two fundamental roles inthe regional aviation network. First, itserves the demands generated by thegeneral aviation and military operatorsdesiring air transportation facilities inthe southern portion of the Kansas Citymetropolitan area. It is in this capacitythat it also serves its role of capacityrelief for commercial service operationsat MCI.
In the past, consideration has beengiven to the possibility of attractingcommercial service operations at theairport. These analyses haveconsidered both commercial scheduled
2-11
passenger airline and air cargooperations. The primary reason fordesired passenger air service at IXD isthe perceived distance of MCI and thestrong soc ioeconomic growthexperienced in Johnson County. Aircargo has been analyzed from theperspective that it could be a potentialsupplement and/or catalyst for theairport’s industrial park and theregion’s growing commercial andindustrial base.
PASSENGER AIRLINESERVICE POTENTIAL
Due to growing interest in addingcommercial service at IXD, the JohnsonCounty Airport Commission conductedan air service feasibility study whichconcluded in 2001. The study wasconducted as a means to research andattempt to answer the followingquestions:
• What are the benefits ofobtaining scheduled services atNew Century AirCenter?
• What are the prospects forrealizing these benefits, based onthe probability for a successfulcampaign to attract services?
• What are the associated costs ofattracting services?
• What risks would the AirportCommission face in launching acampaign for scheduled airservices?
The study concluded with fourrecommendations that appear to remainapplicable today. First, the AirportCommission should not pursuescheduled air services at New CenturyAirCenter for the foreseeable future.Second, the Airport Commission shouldonly reopen the issue of scheduledservices if circumstances changematerially. Third, the AirportCommission should be receptive toother aviation uses for the airport, suchas a cargo facility. Fourth, the AirportCommission should continue to protectthe future of the airport by preventingland use conf l i cts . Theserecommendations followed thoroughinvestigation and knowledge of thecommercial airline industry.
As a part of the study, local travelagents and businesses were surveyedregarding the initiation of passengerservice at IXD. The responses indicatedthat while some may use airlineservices at IXD, demand was notsignificant. Furthermore, with theexception of those nearby IXD, themajority of Johnson County residentswould experience only a slightimprovement in airport commute times.
Regardless of the desires of localtravelers, the decision to initiate airlineservice at IXD would first requiresignificant financial expenditures by theAirport Commission to lure acommitment by an airline. The costswould include marketing campaignsand the development of an airlineterminal complex complete with aterminal building, automobile parking

2-12
facilities, and a new roadway structure.These expenditures would be in millionsof dollars and would be purelyspeculative.
Several reliever airports across thecountry have attempted to attractairline service and have failed. Anexample is Williams Gateway Airport inthe Phoenix metropolitan area. As a re-used military facility, the airport hasthree runways, two longer than 10,000feet. The Airport Authority hasdeveloped an airline terminal complexthat is utilized for some charter activity.
The airport has not been able to attractscheduled airline passenger service. Itshould be noted that Phoenix has nearlythree times the population base thandoes Kansas City and is served by anairport which is much more capacity-constrained than MCI.
The critical component in the analysisof airline feasibility is the state of theexisting airline industry. Severalairlines are on the verge of bankruptcyand others have reduced service on lowvolume and/or low profit routes.Moreover, MCI is currently served byall of the major airlines and several low-cost carriers. Virtually all airlineindustry trends oppose a fragmentationof services between airports in the samemarket area. The few exceptions havebeen the Chicago, Dallas, Houston, LosAngeles, Washington, D.C., and NewYork metropolitan area markets. Theseare six of the largest markets in thecountry and have a much largercommercial demand base than theKansas City market.
Given these factors, commercial serviceoperations are not likely at IXD withinthe planning period. If they were tooccur, they would likely be conducted bya start-up airline. These airlines aretypically constrained by limitedoperating capital and have had a poorrecord of success in the past. Moreover,the fares and markets served by thistype of airline would likely limit thepotential successes of airline operationsat IXD. Thus, the master plan will nolonger consider commercial passengerairline operations at IXD, as reasonablyviable.
COMMERCIALCARGO POTENTIAL
The Airport Commission also undertookan Air Cargo study in 1992. Similar tothe airline analysis, this studyconcluded that attracting significant aircargo operations to IXD would bechallenging. After thorough review ofthe document, it appears that theanalysis still applies to currentconditions.
The study process included an attemptto involve all major air cargo operators.The only participant which respondedwas FedEx. Their position was thattheir operation is well-suited at MCIand was not likely to relocate to IXD.FedEx did not rule out the potential oflimited service at IXD, however, but didindicate that they would not utilize IXDas a hub airport.
The potential for attracting air cargoservices at IXD is greater than

2-13
attracting passenger airline services.Moreover, the capital investmentswould be less significant and would notbe purely speculative. Most cargooperators will work with an airport todevelop facilities to suit their needsonce a decision to operate at the airportis made.
While air cargo operations are possibleat IXD, the level of operations wouldlikely be low. FedEX, UPS, and DHL(which recently acquired Airborne) areall currently operating at MCI. It isunlikely that these operators will electto leave MCI for IXD as a keycomponent of their operation is theability to transfer some freight on thecommercial airlines. Thus, future aircargo potential at IXD appears to belimited to sporadic operations or limiteddaily/weekly operations. The level ofprojected operations will likely beminimal and will not impact airportoperations significantly. For thisreason, the master plan study willconsider facility development whichcould support limited air cargooperations, however, will not specify acertain demand level. It is believedthat the potential level of cargooperations would not requiresubstantial facility developmentsbeyond facility needs similar to ageneral aviation commercial business.
SOCIOECONOMICPROJECTIONS
The socioeconomic conditions provide animportant baseline for preparingaviation demand forecasts. Localsocioeconomic variables such as
population, employment, and incomeare indicators for understanding thedynamics of the community and, inparticular, the trends in aviationgrowth. Analysis of the surroundingcities and the state will give a morecomprehensive understanding of thesocioeconomic situations affecting theregion which supports New CenturyAirCenter. The following is a summaryof the research and projectionspresented in Chapter One.
POPULATION
Table 2B summarizes historical andforecast population estimates forJohnson County, the cities of Olatheand Overland Park, and the State ofKansas. The analysis of JohnsonCounty population indicates an averageannual growth rate of 2.42 percentbetween 1990 and 2000. This was byfar the highest county growth rate inthe state over the period. Olathe andOverland Park are two of the fastestgrowing communities in Kansas.Olathe is projected to grow by morethan two percent annually through theplanning period, while Overland Park isprojected to grow by more than threepercent on an average annual basis.
Population forecasts for JohnsonCounty and the two cities are alsopresented. The population for JohnsonCounty is forecast to reach nearly700,000 by 2025. This projectionequates to an annual growth rate of1.76 percent and the addition of 246,000residents between 2000 and 2025. Theentire state of Kansas is projected toadd 420,000 persons. Thus, the

2-14
population projection for JohnsonCounty represents nearly 61 percent ofthe entire population growth within thestate over this 25-year period.
EMPLOYMENT
Historical and forecast employmentdata for Johnson County is alsopresented in Table 2B. Between 1990and 2000, Johnson County grew inemployment by 4.22 percent annually.This growth accounted for nearly124,000 new jobs over the 10-year
period, more than 42 percent of theemployment growth for the entire state.
Johnson County is expected to showcontinued strong employment growthover the planning period, with anaverage annual growth rate of 2.13percent between 2000 and 2025. At thisrate, Johnson County would add morethan 250,000 new jobs, representingnearly 45 percent of the employmentgrowth in Kansas. In addition,employment is forecast to outpacepopulation growth through the planningperiod.
TABLE 2BSocioeconomic Forecasts for the Airport Service AreaNew Century AirCenter
HISTORICAL FORECASTAnnual Growth
Rate
1990 2000 2010 2015 20251990 to
20002000 to
2025PopulationJohnsonCounty 355,021 451,086 550,904 595,893 697,193 2.42% 1.76%Olathe 63,832 93,757 127,200 131,665 154,277 3.92% 2.01%Overland Park 112,498 150,584 203,458 236,495 319,533 2.96% 3.06%Kansas 2,477,588 2,688,418 2,852,957 2,939,000 3,108,000 0.82% 0.58%EmploymentJohnsonCounty 241,291 364,721 487,210 536,235 617,542 2.51% 1.11%Kansas 1,383,650 1,675,358 1,872,460 1,986,104 2,237,995 1.93% 1.16%PCPIJohnsonCounty $31,448 $40,301 $44,961 $47,574 $53,146 4.22% 2.13%Kansas $21,227 $25,551 $29,442 $31,434 $35,804 1.87% 1.36%Sources: Mid-America Regional Council (MARC); Woods and Poole, CEDDS 2004. PCPI $1996.
PER CAPITA PERSONALINCOME (PCPI)
Table 2B also compares per capitapersonal income (adjusted to 1996dollars) for the county and the state.Johnson County’s average adjusted
PCPI for 2000 is $40,301 compared to$25,551 for the State of Kansas.Johnson County is not only an economicdriver for the state, it is also a fairlyaffluent county. Although the State ofKansas’ PCPI is projected to increase ata greater annual rate, Johnson County
2-15
PCPI is forecast to be 32 percent higherthan the state’s PCPI by 2025.
GENERAL AVIATIONFORECASTS
To determine the types and sizes offacilities that should be planned toaccommodate general aviation activity,certain elements of this activity must beforecast. Indicators of general aviationdemand include:
· Based Aircraft· Based Aircraft Fleet Mix· General Aviation Operations· Peaking Operations· Annual Instrument Approaches
The remainder of this chapter willexamine historical trends with regard tothese areas of general aviation andproject future demand for thesesegments of general aviation activity atthe airport.
JOHNSON COUNTYREGISTERED AIRCRAFTFORECAST
The number of based aircraft is themost basic indicator of general aviationdemand at an airport. By firstdeveloping a forecast of based aircraft,other demand segments can beprojected based upon this trend.
One method of forecasting basedaircraft is to first examine local aircraftownership by reviewing aircraftregistrations in the region. Table 2Cpresents the growth in registered
aircraft not only in Johnson County butalso in the Kansas City metropolitanregion as a point of comparison. Thecounties included in the Kansas Cityregion are Leavenworth, Wyandotte,and Johnson in Kansas, and Platte,Clay, Jackson, Cass, and Ray inMissouri.
Registered aircraft in Johnson Countyhave steadily increased over the past 15years. Aircraft registrations for themetropolitan region have alsoincreased, but there have been twonoticeable periods when the totalregistrations declined. The first wasbetween 1990 and 1993 when theregion’s registered aircraft went from1,768 to 1,709. The second period ofdecline was between 2001 and 2003.The region’s 2004 registered aircraftnumbers appear to be back in line witha positive growth rate.
Over the last 15 years, Johnson Countyaircraft registrations have declined justonce. In 1993, aircraft registrations inthe county decreased to 501 from theprevious year’s 508. There have beenyears of no-growth but the generaltrend has been increasing. Even whenthe region’s aircraft registrationsdeclined, Johnson County’s registeredaircraft regularly increased.Oftentimes, an area’s general aviationaircraft ownership trends reflect ormirror the strength of the local/regionaleconomy. Thus, Johnson Countyaircraft registration’s historic growthtrend is a validation of the County’seconomic strength, especially incomparison to the Kansas Citymetropolitan area as a whole.

2-16
TABLE 2CRegistered AircraftMarket Share Analysis
Kansas City Region Johnson County
Year
U.S. ActiveGeneral Aviation
AircraftRegistered
AircraftNationalShare %
RegisteredAircraft
RegionalShare %
1990 NA 1,768 NA 486 NA1991 NA 1,752 NA 488 NA1992 NA 1,746 NA 508 NA1993 177,120 1,709 0.965% 501 29.32%1994 172,935 1,740 1.006% 508 29.20%1995 188,089 1,955 1.039% 543 27.77%1996 191,129 1,961 1.026% 562 28.66%1997 192,414 1,904 0.990% 578 30.36%1998 204,711 1,949 0.952% 602 30.89%1999 219,464 1,973 0.899% 641 32.49%2000 217,533 2,113 0.971% 672 31.80%2001 211,447 2,088 0.987% 672 16.11%2002 211,244 2,083 0.986% 677 32.50%2003 210,600 2,058 0.977% 678 32.94%2004 211,295 2,069 0.979% 698 33.74%
Constant Share of Region with Increasing Share of County2010 230,000 2,252 0.979% 788 35.00%2015 239,000 2,340 0.979% 866 37.00%2025 253,000 2,477 0.979% 1,016 41.00%
Source: FAA Aircraft Registry Database (2004); FAA Long-Range Aerospace Forecasts Fiscal Years 2015, 2020, 2030
Table 2C depicts one projection ofregistered aircraft for both the regionand Johnson County. This projectionmaintained a constant share ofregistered aircraft for the Kansas Citymetropolitan area as a percentage of theU.S. active general aviation fleet, as hasbeen the trend over the last 15 years.
This projection assumes that JohnsonCounty registered aircraft as apercentage of the Kansas Citymetropolitan area will continue toincrease at similar rates as has beenthe case over the past 15 years.
As shown in the table, this projectionresults in 788, 866, and 1,016 registered
aircraft in Johnson County for the years2010, 2015, and 2025, respectively. Themarket share projection will becompared to additional forecastingmethodologies in an effort to determinea reasonable registered aircraft forecastfor the county.
The trend line analysis for JohnsonCounty registered aircraft (1993-2004)resulted in a very strong correlation,yielding an “r2" value of 0.95. Aspresented in Table 2D, a number ofadditional regression analyses were alsoperformed including multipleregressions. In nearly every case, the“r2" values were above 0.90 indicatingstrong positive correlations.
2-17
TABLE 2D Registered Aircraft ProjectionsJohnson County Kansas
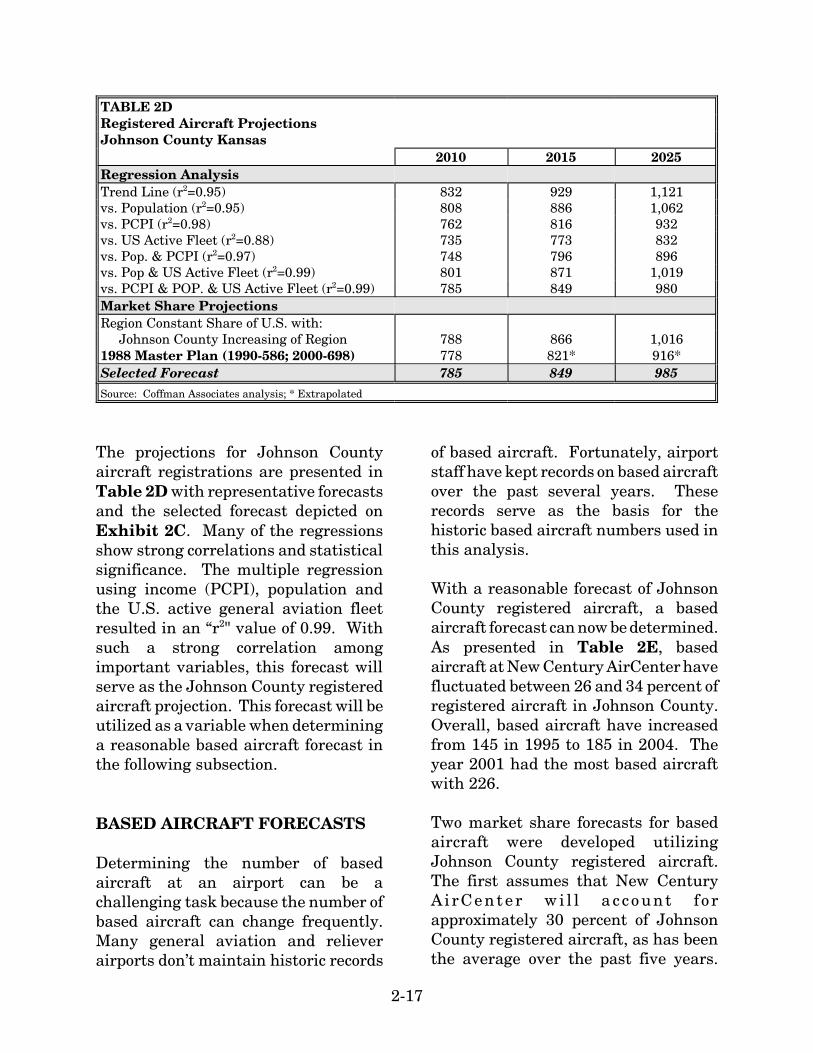
2010 2015 2025Regression AnalysisTrend Line (r2=0.95) 832 929 1,121vs. Population (r2=0.95) 808 886 1,062vs. PCPI (r2=0.98) 762 816 932vs. US Active Fleet (r2=0.88) 735 773 832vs. Pop. & PCPI (r2=0.97) 748 796 896vs. Pop & US Active Fleet (r2=0.99) 801 871 1,019vs. PCPI & POP. & US Active Fleet (r2=0.99) 785 849 980Market Share ProjectionsRegion Constant Share of U.S. with: Johnson County Increasing of Region 788 866 1,0161988 Master Plan (1990-586; 2000-698) 778 821* 916*Selected Forecast 785 849 985Source: Coffman Associates analysis; * Extrapolated
The projections for Johnson Countyaircraft registrations are presented inTable 2D with representative forecastsand the selected forecast depicted onExhibit 2C. Many of the regressionsshow strong correlations and statisticalsignificance. The multiple regressionusing income (PCPI), population andthe U.S. active general aviation fleetresulted in an “r2" value of 0.99. Withsuch a strong correlation amongimportant variables, this forecast willserve as the Johnson County registeredaircraft projection. This forecast will beutilized as a variable when determininga reasonable based aircraft forecast inthe following subsection.
BASED AIRCRAFT FORECASTS
Determining the number of basedaircraft at an airport can be achallenging task because the number ofbased aircraft can change frequently.Many general aviation and relieverairports don’t maintain historic records
of based aircraft. Fortunately, airportstaff have kept records on based aircraftover the past several years. Theserecords serve as the basis for thehistoric based aircraft numbers used inthis analysis.
With a reasonable forecast of JohnsonCounty registered aircraft, a basedaircraft forecast can now be determined.As presented in Table 2E, basedaircraft at New Century AirCenter havefluctuated between 26 and 34 percent ofregistered aircraft in Johnson County.Overall, based aircraft have increasedfrom 145 in 1995 to 185 in 2004. Theyear 2001 had the most based aircraftwith 226.
Two market share forecasts for basedaircraft were developed utilizingJohnson County registered aircraft.The first assumes that New CenturyAirCe n t e r w i l l a c co u n t forapproximately 30 percent of JohnsonCounty registered aircraft, as has beenthe average over the past five years.

04M
P19
-2C
-5/5
/05
Exhibit 2CREGISTERED AIRCRAFT FORECASTS
600
20252015 202020102005200019951990
400
200
0
800
1,000
1,200R
EG
IST
ER
ED
AIR
CR
AFT
YEARS
HISTORICALHISTORICAL FORECASTSFORECASTS
Regression Analysis Trend Line (r2=0.95) vs. PCPI (r2=0.98) vs. Population & PCPI (r2=0.97) vs. PCPI, Population, & U.S. Active Fleet (r2=0.99)Market Share ProjectionsRegion Constant Share of U.S. with: Johnson County Increasing Share of RegionSelected Forecast
LEGEND

2-18
This forecast results in 236, 255 and296 based aircraft for the years 2010,2015 and 2025 respectively.Considering the limited growthpotential at Johnson County Executive
Airport and the lack of facilities forlarger aircraft at Gardner MunicipalAirport, this forecast is considered a lowend projection.
TABLE 2EBased Aircraft vs. Johnson County Registered AircraftNew Century AirCenter
YearJohnson County Registered
AircraftBased
Aircraft% of County Registered
Aircraft 1995 543 145 26.7%1996 562 145 25.8%1997 578 192 33.2%1998 602 192 31.9%1999 641 213 33.2%2000 672 213 31.7%2001 672 226 33.6%2002 677 209 30.9%2003 678 201 29.6%2004 698 185 26.5%
Constant Market Share Projection2010 785 236 30.0%2015 849 255 30.0%2025 985 296 30.0%
Increasing Market Share Projection2010 785 232 29.5%2015 849 272 32.0%2025 985 350 35.5%
Sources: 1995-2000 FAA Form 5010 ('99 and '00 adjusted to 250 from 419); 2001-2004 Airport Records
The second forecast considers anincreasing market share of registeredaircraft in Johnson County. Thisforecast projects that New CenturyAirCenter will, over the next 20 years,increase from 29 percent to 36 percent,recapturing its share of Johnson Countyregistered aircraft. This projectionappears reasonable considering that in2001, the airport accounted for 34percent of the registered aircraft in thecounty. This forecast yields 232 basedaircraft in 2010, 272 in 2010 and 350 in2025.
Comparison Forecasts
On an annual basis, the FAA performsan airport inspection and based aircraftis one of the items tracked for inclusionin the Airport Master Record (FAAForm 5010). In many cases, the Form5010 provides a good starting pointwhen analyzing based aircraft but theFAA numbers should be validated withsupporting data and analysis. TheForm 5010 data is typically in theFAA’s Terminal Area Forecast (TAF).The TAF is the FAA’s tool forforecasting aviation activity for airportsacross the country.

2-19
The FAA TAF report projects 244, 267,and 347 based aircraft for the years2010, 2015, and 2025 (extrapolated),respectively. These are shown forcomparison purposes. The previousmaster plan, completed in 1988, has along term forecast of 270 based aircraftfor 2010.
Regression analysis was also conductedin order to determine if there has beena historical relationship betweenvariables and based aircraft. Historicalbased aircraft at New CenturyAirCenter were compared to time,population, U.S. active fleet, and PCPI.Multiple regression analysis wasconducted with PCPI and population ascompared to based aircraft. The resultsof all of these regressions yielded “r2"values below 0.7. Because there islimited reliability in the predictivevalue of “r2" values below 0.90, theregressions were not considered further.
Based Aircraft Conclusion
Table 2F shows the FAA TAF and the1988 master plan in comparison to themarket share of Johnson Countyregistered aircraft for the based aircraftprojections. It is anticipated that NewCentury AirCenter will experience alarger jump in based aircraft in thenear term (2010) and then level outthrough the longer term of the forecast(2025). Exhibit 2D depicts the trendlines for the forecast methods as well asthe selected based aircraft forecast.
Cost-effective, safe, efficient, andorderly development of an airportshould rely more upon actual demand atan airport than a time-based forecastfigure. Thus, in order to develop amaster plan that is demand-basedrather than time-based, a series ofplanning horizon milestones has beenestabl ished that takes intoconsideration the reasonable range ofbased aircraft projections.
TABLE 2FBased Aircraft ProjectionsNew Century AirCenter
2010 2015 2025Market Share of Johnson County Registered Aircraft Constant Share 236 255 296 Increasing Share 232 272 350Comparison Projections FAA TAF 244 267 347 1988 Master Plan 270Selected Forecast 235 270 340
The milestones are founded on thepotential of attracting additional basedaircraft to the airport and, moreimportantly, supporting those aircraftwith facilities. By providing a realistic
based aircraft forecast for New CenturyAirCenter and including a comparisonto the other two Johnson Countyairports, airport officials will be able torespond to unexpected changes in a

2-20
timely manner. As a result, thesemilestones provide flexibility, whilepotentially extending this plan’s usefullife if aviation trends slow over theperiod.
The most important reason for utilizingmilestones is that they allow the airportto develop facilities according to needgenerated by actual demand levels. Thedemand-based schedule providesflexibility in development, asdevelopment schedules can be slowed orexpedited according to actual demand atany given time over the planningperiod. The resultant plan providesairport officials with a financially-responsible and need-based program.The planning horizons for based aircraftthat will be utilized for the remainder ofthis master plan are as follows:
• Short Term 235• Intermediate Term 270• Long Term 340
Registered Aircraft Distribution
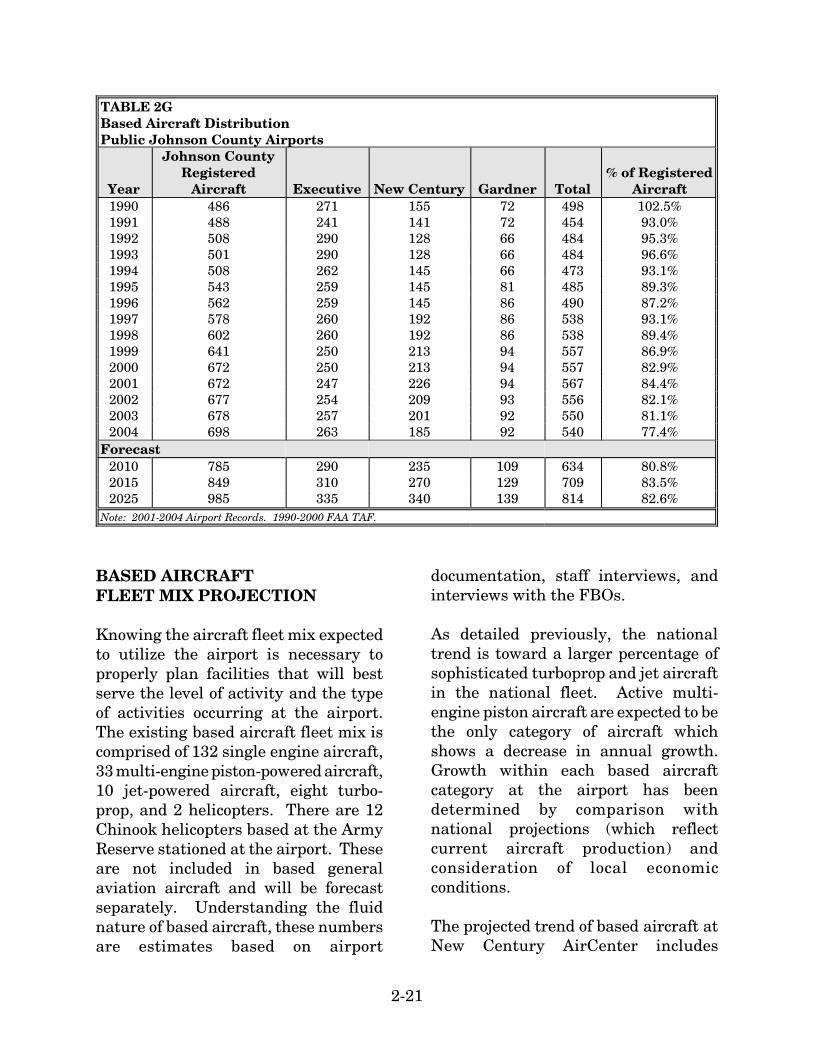
There are three public airports inJohnson County, Kansas. Each of themaccount for a portion of the registeredaircraft in the county, as presented inTable 2G. When determining thenumber of based aircraft for one airport,it is important to cross-check and makesure that the cumulative total of allbased aircraft, as a percentage of countyregistered aircraft, is reasonable.
Gardner Municipal Airport had amaster plan completed in 1998. In thatplan, based aircraft were anticipated togrow from 86 to 139 by 2017.Currently, Gardner has approximately92 based aircraft, which puts theirgrowth behind the projected numbers.In an effort to develop a reasonablebased aircraft distribution, Gardner’sbased aircraft forecast was adjusted to109, 129, and 139 representing theyears 2010, 2015, and 2025,respectively.
The Johnson County Executive AirportMaster Plan is being completedconcurrently with this one. Because ofthis, forecasts are allowed to be morefluid and adjusted based on each other.In the Johnson County ExecutiveAirport Master Plan can be founddetailed analysis and explanation of thebased aircraft forecast for that airport.
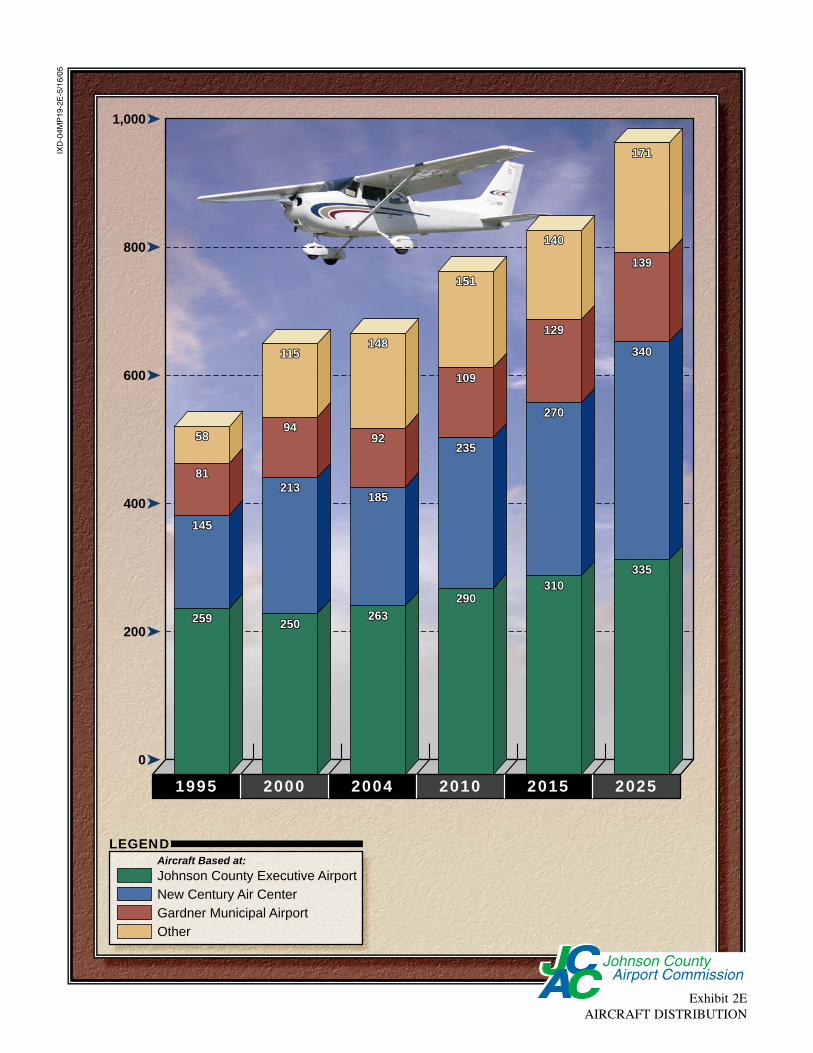
As shown in the Table 2G, the 2010forecast has 80.8 percent of JohnsonCounty registered aircraft basing at thethree county airports. This percentageincreases to 83.5 percent in 2015 anddrops slightly to 82.6 percent by 2025.The forecast aircraft distributionappears to be in line with thedistribution trend over the last tenyears.
Exhibit 2E graphically depicts theforecast aircraft distribution for thethree Johnson County airports.

IXD
-04M
P19
-2D
-5/1
7/05
Exhibit 2DBASED AIRCRAFT
400
20252015 20202010200520001995
350
300
250
200
150
100
50
0
YEARSYEARS
BA
SED
AIR
CR
AFT
BA
SED
AIR
CR
AFT
HISTORICALHISTORICAL FORECASTSFORECASTS
Market Share of Johnson County Registered Aircraft Constant Share Increasing ShareFAA Terminal Area ForecastSelected Based Aircraft Forecast
LEGEND
IXD
-04M
P19
-2E
-5/1
6/05
Exhibit 2EAIRCRAFT DISTRIBUTION
0
202520152010200420001995
200
400
600
800
1,000
Aircraft Based at:Johnson County Executive AirportNew Century Air CenterGardner Municipal AirportOther
LEGEND
8181
58589494
115115
145145
259259
213213
250250
9292
109109
290290
151151
139139
129129
340340
270270
335335310310
81
5894
115148148148
145
259
213185185185
250263263263
92235235235
109
290
151
140140140
171171171
139
129
340
270
335310
2-21
TABLE 2GBased Aircraft DistributionPublic Johnson County Airports
Year
Johnson CountyRegistered
Aircraft Executive New Century Gardner Total% of Registered
Aircraft1990 486 271 155 72 498 102.5%1991 488 241 141 72 454 93.0%1992 508 290 128 66 484 95.3%1993 501 290 128 66 484 96.6%1994 508 262 145 66 473 93.1%1995 543 259 145 81 485 89.3%1996 562 259 145 86 490 87.2%1997 578 260 192 86 538 93.1%1998 602 260 192 86 538 89.4%1999 641 250 213 94 557 86.9%2000 672 250 213 94 557 82.9%2001 672 247 226 94 567 84.4%2002 677 254 209 93 556 82.1%2003 678 257 201 92 550 81.1%2004 698 263 185 92 540 77.4%
Forecast2010 785 290 235 109 634 80.8%2015 849 310 270 129 709 83.5%2025 985 335 340 139 814 82.6%
Note: 2001-2004 Airport Records. 1990-2000 FAA TAF.
BASED AIRCRAFTFLEET MIX PROJECTION
Knowing the aircraft fleet mix expectedto utilize the airport is necessary toproperly plan facilities that will bestserve the level of activity and the typeof activities occurring at the airport.The existing based aircraft fleet mix iscomprised of 132 single engine aircraft,33 multi-engine piston-powered aircraft,10 jet-powered aircraft, eight turbo-prop, and 2 helicopters. There are 12Chinook helicopters based at the ArmyReserve stationed at the airport. Theseare not included in based generalaviation aircraft and will be forecastseparately. Understanding the fluidnature of based aircraft, these numbersare estimates based on airport
documentation, staff interviews, andinterviews with the FBOs.
As detailed previously, the nationaltrend is toward a larger percentage ofsophisticated turboprop and jet aircraftin the national fleet. Active multi-engine piston aircraft are expected to bethe only category of aircraft whichshows a decrease in annual growth.Growth within each based aircraftcategory at the airport has beendetermined by comparison withnational projections (which reflectcurrent aircraft production) andconsideration of local economicconditions.
The projected trend of based aircraft atNew Century AirCenter includes

2-22
significant growth in jet aircraft movingfrom 5.41percent to 9.12 percent by thelong term. Although the national trendindicates positive growth of singleengine aircraft, New Century AirCenteris projected to maintain a near constantpercentage because Gardner MunicipalAirport is expected to add only singleengine aircraft to its fleet mix. Some of
those that would base at New CenturyAirCenter will likely instead base atGardner. Along with national trends,multi-engine piston aircraft areprojected to decline as a percentage.The based aircraft fleet mix projectionfor New Century AirCenter issummarized in Table 2H.
TABLE 2HBased Aircraft Fleet Mix Projections New Century AirCenter
EXISTING FORECAST
Aircraft Type 2004 PercentShortTerm Percent
Inter.Term Percent
LongTerm Percent
Single Engine 132 71.35% 170 72.34% 193 71.48% 238 70.00%Multi-Engine 33 17.84% 35 14.89% 37 13.70% 41 12.06%Turbo-Prop 8 4.32% 11 4.68% 14 5.19% 21 6.18%Turbo-Jet 10 5.41% 15 6.38% 20 7.41% 31 9.12%Helicopters/Others 2 1.08% 4 1.70% 6 2.22% 9 2.65%Totals 185 100.00% 235 100.00% 270 100.00% 340 100.00%Source: Airport Commission; Coffman Associates analysis
ANNUAL OPERATIONS
The airport traffic control tower (ATCT)located on the airport collectsinformation regarding aircraftoperations (takeoffs and landings).Aircraft operations are reported in fourgeneral categories: air carrier, air taxi,general aviation, and military. Aircarrier operations are certified underFederal Aviation Regulations (F.A.R.)Part 121. Air taxi operations consist ofthe use of general aviation aircraft forthe “on-demand” commercial transportof persons and property in accordancewith F.A.R. Part 135. General aviationoperations include a wide range ofactivity from personal to business andcorporate uses. Military operationsinclude those operations conducted byvarious branches of the U.S. military.
Aircraft operations are furtherclassified as local and itinerant. A localoperation is a takeoff or landingperformed by an aircraft that operateswithin sight of the airport, or whichexecutes simulated approaches ortouch-and-go operations at the airport.Generally, local operations arecharacterized by training operations.Itinerant operations are thoseperformed by aircraft with a specificorigin or destination away from theairport. Typically, itinerant operationsincrease with business and commercialuse since business aircraft are usedprimarily to transport passengers fromone location to another.
Table 2J summarizes historicaloperations at New Century AirCenteras tracked by the ATCT since 1995.

2-23
Operations have varied with a low of53,593 in 2004, to a high of 74,345 in2001, with an average of 63,000operations per year. During theprevious 10-year period, from 1985 to1994, there was an average of morethan 75,000 operations annually. Thisrepresents a 15 percent decline in
operations at the airport from oneperiod to the next. It should be notedthat the 1997 local general aviation(GA) count has been adjusted to 30,000from 46,263 because the ATCTinadvertently added overflights into thecount.
TABLE 2JHistorical General Aviation OperationsNew Century AirCenter
Itinerant Operations Local OperationsPeriod Air Taxi GA Military Total GA Military Total Total
1995 106 26,143 1,410 27,659 26,718 2,413 29,131 56,7901996 72 32,985 1,786 34,843 29,809 2,132 31,941 66,7841997 53 34,245 1,294 35,592 30,000 2,374 32,374 67,9661998 231 35,587 1,375 37,193 25,709 1,788 27,497 64,6901999 459 27,462 983 28,904 24,807 1,343 26,150 55,0542000 680 27,101 1,211 28,992 27,902 1,599 29,501 58,4932001 1,513 28,632 1,274 31,419 41,088 1,838 42,926 74,3452002 1,438 27,575 1,225 30,238 35,585 2,027 37,612 67,8502003 1,407 27,503 768 29,678 30,012 1,214 31,226 60,9042004 1,511 27,113 1,061 29,685 23,306 602 23,908 53,593
Source: Airport Tower Records/TAF
From 1995 to 1998, itinerant operationsgrew significantly from 27,700 to37,200. After this period of growth,itinerant operations have slowedconsiderably, averaging approximately30,000 annually. Local operations haveremained steady at approximately30,000 annually except for 2001 and2002, when an average of 40,000operations occurred. Interviews withflight school staff indicate that thesetwo years were periods of heavytraining activity, with many newstudents.
GENERAL AVIATIONOPERATIONS
General aviation operations constitutethe largest share of operations at NewCentury AirCenter. Of thoseoperations, roughly half have been localand the other half have been itinerantover the previous 10 years.
Distinguishing between local anditinerant operations is an importantconsideration for future facilityplanning. An airport with a large

2-24
percentage of local operations may be inneed of more aircraft storage units orfuel facilities. A high level of itinerantoperations may be an indicator of aneed for more transient apron parking,more overnight covered storage, orimproved navigational aids.
There are a number of acceptedmethods for forecasting annualoperations at an airport. Perhaps themost common method is to take thenumber of forecast based aircraft andmultiply that number by industryaccepted operations totals based on thetype of airport.
For a reliever airport with flightschools, a planning standard of between400 and 500 operations per basedaircraft can be expected. Thus, for thecurrent year, one might expect 74,000operations (400 x 185). A high endwould be nearly 93,000 operations.These trends have not been realized forquite some time. Because of thisreality, multiple forecasts will bedeveloped for both itinerant and localgeneral aviation operations and then areasonable forecast will be selected.
Itinerant Operations
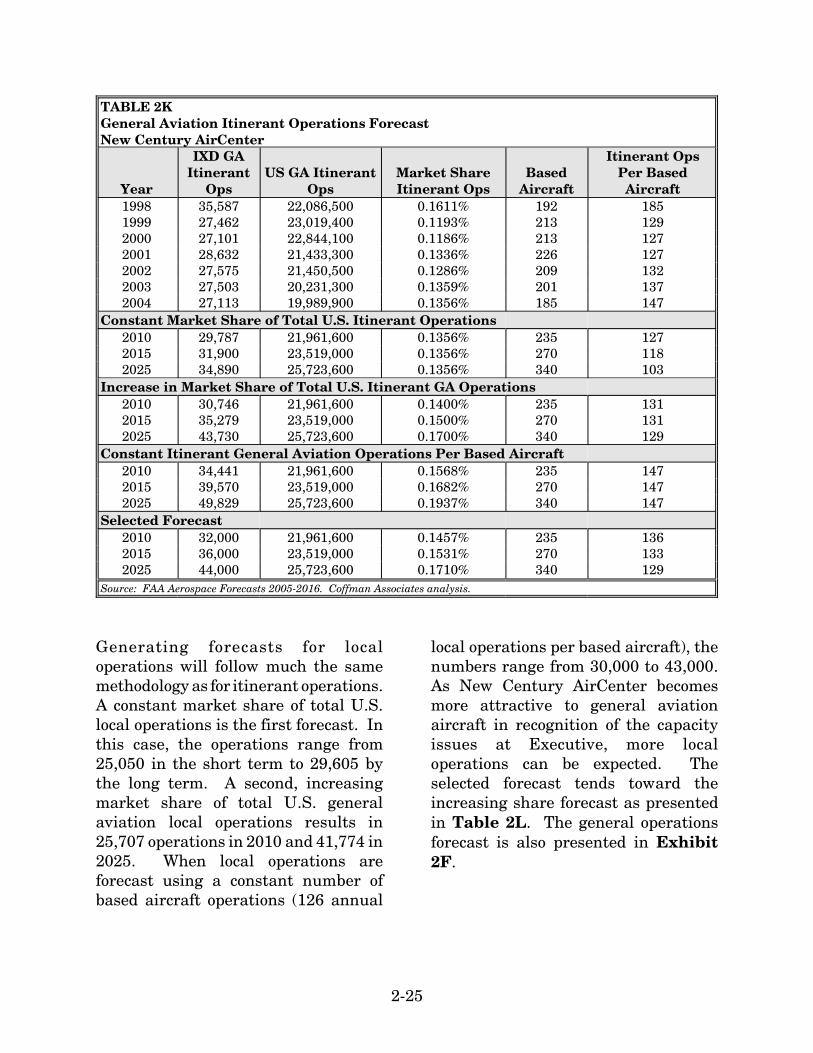
Itinerant operations have generallyfluctuated between 27,000 and 36,000annually between 1998 and 2004. Themarket share of itinerant operations forNew Century AirCenter, as apercentage of general aviation itinerantoperations at all towered airports, hasremained fairly constant since 2001. In1998, New Century’s market share was
0.16 percent and by 2004 that percent-age had decreased to 0.13 percent. Theforecasts are presented in Table 2K.
The first forecast maintains a constantshare (0.1356%) of itinerant operationsfor the airport. This results in 34,890annual itinerant operations by the longterm planning period. The secondforecast considers a market shareprojection reflecting an increasing shareof itinerant operations by the airport.This results in 30,746 itinerantoperations in the short term and 43,730operations by the long term. A thirdforecast maintains the number ofitinerant operations per based aircraft(147) through the planning period. Thisresults in 34,441 itinerant operations inthe short term and 49,829 annualitinerant operations by the long term.The selected forecast represents a trendnear the average of each of theforecasts.
Local Operations
Local operations have also fluctuatedover the past seven years, ranging froma low of 24,000 in 2004, to a high of41,000 in 2001. In 1998, New Century’smarket share of local operations at alltowered airports was 0.1611 percent. In2001, it was 0.2537 percent, then, in2004, that number had taken asignificant drop to 0.1559 percent. Itcan be expected that this number willgrow if general aviation is attracted tothe airport, and even more if asignificant flight school were to base atthe airport.
2-25
TABLE 2KGeneral Aviation Itinerant Operations ForecastNew Century AirCenter
Year
IXD GAItinerant
OpsUS GA Itinerant
OpsMarket ShareItinerant Ops
BasedAircraft
Itinerant OpsPer BasedAircraft
1998 35,587 22,086,500 0.1611% 192 1851999 27,462 23,019,400 0.1193% 213 1292000 27,101 22,844,100 0.1186% 213 1272001 28,632 21,433,300 0.1336% 226 1272002 27,575 21,450,500 0.1286% 209 1322003 27,503 20,231,300 0.1359% 201 1372004 27,113 19,989,900 0.1356% 185 147
Constant Market Share of Total U.S. Itinerant Operations2010 29,787 21,961,600 0.1356% 235 1272015 31,900 23,519,000 0.1356% 270 1182025 34,890 25,723,600 0.1356% 340 103
Increase in Market Share of Total U.S. Itinerant GA Operations2010 30,746 21,961,600 0.1400% 235 1312015 35,279 23,519,000 0.1500% 270 1312025 43,730 25,723,600 0.1700% 340 129
Constant Itinerant General Aviation Operations Per Based Aircraft2010 34,441 21,961,600 0.1568% 235 1472015 39,570 23,519,000 0.1682% 270 1472025 49,829 25,723,600 0.1937% 340 147
Selected Forecast2010 32,000 21,961,600 0.1457% 235 1362015 36,000 23,519,000 0.1531% 270 1332025 44,000 25,723,600 0.1710% 340 129
Source: FAA Aerospace Forecasts 2005-2016. Coffman Associates analysis.
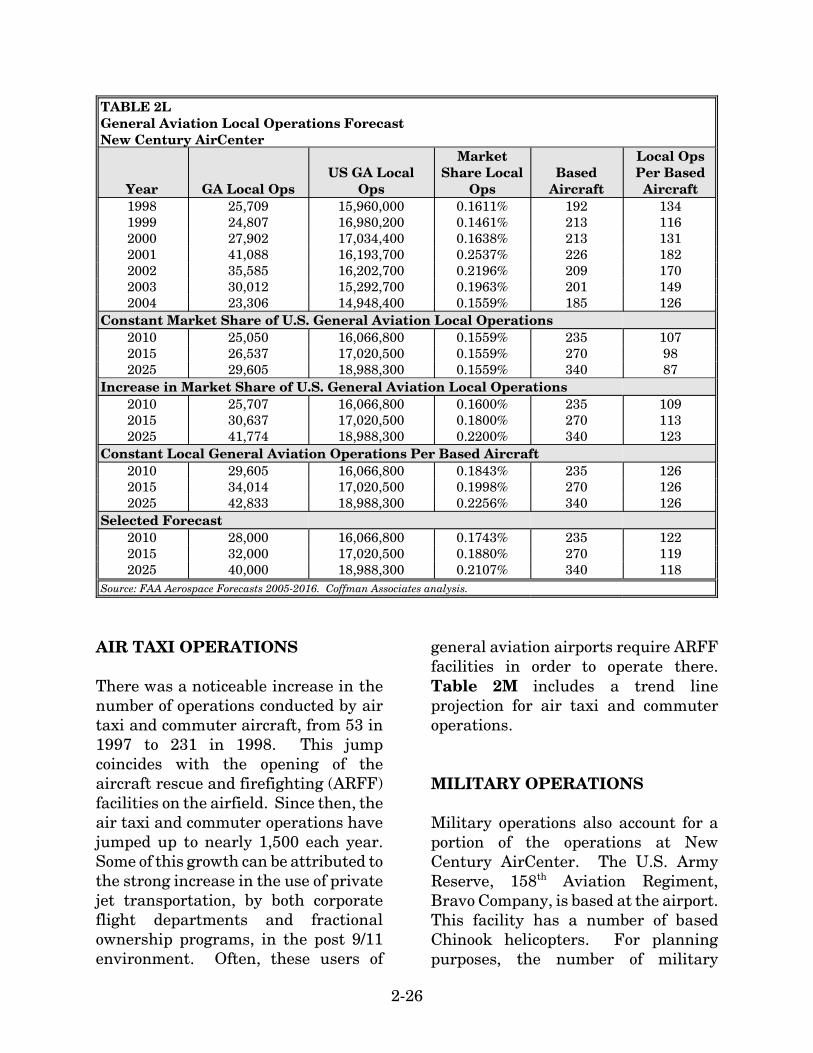
Generating forecasts for localoperations will follow much the samemethodology as for itinerant operations.A constant market share of total U.S.local operations is the first forecast. Inthis case, the operations range from25,050 in the short term to 29,605 bythe long term. A second, increasingmarket share of total U.S. generalaviation local operations results in25,707 operations in 2010 and 41,774 in2025. When local operations areforecast using a constant number ofbased aircraft operations (126 annual
local operations per based aircraft), thenumbers range from 30,000 to 43,000.As New Century AirCenter becomesmore attractive to general aviationaircraft in recognition of the capacityissues at Executive, more localoperations can be expected. Theselected forecast tends toward theincreasing share forecast as presentedin Table 2L. The general operationsforecast is also presented in Exhibit2F.
2-26
TABLE 2LGeneral Aviation Local Operations ForecastNew Century AirCenter
Year GA Local OpsUS GA Local
Ops
MarketShare Local
OpsBased
Aircraft
Local OpsPer BasedAircraft
1998 25,709 15,960,000 0.1611% 192 1341999 24,807 16,980,200 0.1461% 213 1162000 27,902 17,034,400 0.1638% 213 1312001 41,088 16,193,700 0.2537% 226 1822002 35,585 16,202,700 0.2196% 209 1702003 30,012 15,292,700 0.1963% 201 1492004 23,306 14,948,400 0.1559% 185 126
Constant Market Share of U.S. General Aviation Local Operations2010 25,050 16,066,800 0.1559% 235 1072015 26,537 17,020,500 0.1559% 270 982025 29,605 18,988,300 0.1559% 340 87
Increase in Market Share of U.S. General Aviation Local Operations2010 25,707 16,066,800 0.1600% 235 1092015 30,637 17,020,500 0.1800% 270 1132025 41,774 18,988,300 0.2200% 340 123
Constant Local General Aviation Operations Per Based Aircraft2010 29,605 16,066,800 0.1843% 235 1262015 34,014 17,020,500 0.1998% 270 1262025 42,833 18,988,300 0.2256% 340 126
Selected Forecast2010 28,000 16,066,800 0.1743% 235 1222015 32,000 17,020,500 0.1880% 270 1192025 40,000 18,988,300 0.2107% 340 118
Source: FAA Aerospace Forecasts 2005-2016. Coffman Associates analysis.
AIR TAXI OPERATIONS
There was a noticeable increase in thenumber of operations conducted by airtaxi and commuter aircraft, from 53 in1997 to 231 in 1998. This jumpcoincides with the opening of theaircraft rescue and firefighting (ARFF)facilities on the airfield. Since then, theair taxi and commuter operations havejumped up to nearly 1,500 each year.Some of this growth can be attributed tothe strong increase in the use of privatejet transportation, by both corporateflight departments and fractionalownership programs, in the post 9/11environment. Often, these users of
general aviation airports require ARFFfacilities in order to operate there.Table 2M includes a trend lineprojection for air taxi and commuteroperations.
MILITARY OPERATIONS
Military operations also account for aportion of the operations at NewCentury AirCenter. The U.S. ArmyReserve, 158th Aviation Regiment,Bravo Company, is based at the airport.This facility has a number of basedChinook helicopters. For planningpurposes, the number of military

IXD
-04M
P19
-2F
-5/1
7/05
Exhibit 2FLOCAL & ITINERANT
OPERATIONS FORECASTS
10
2025202020152010200520001995
20
30
40
Gene
ral
Avia
tion
Ope
rati
ons
(x 1
,000
)
Years
50
0
60
HISTORICALHISTORICAL FORECASTSFORECASTSHISTORICAL FORECASTS
Historical
Market Share of U.S. Itinerant Operations Constant Increasing
Operations Per Based Aircraft Projection Constant
Selected Forecast
Historical
Market Share of U.S. Local Operations Constant Increasing
Operations Per Based Aircraft Projection Constant
Selected Forecast
2-27
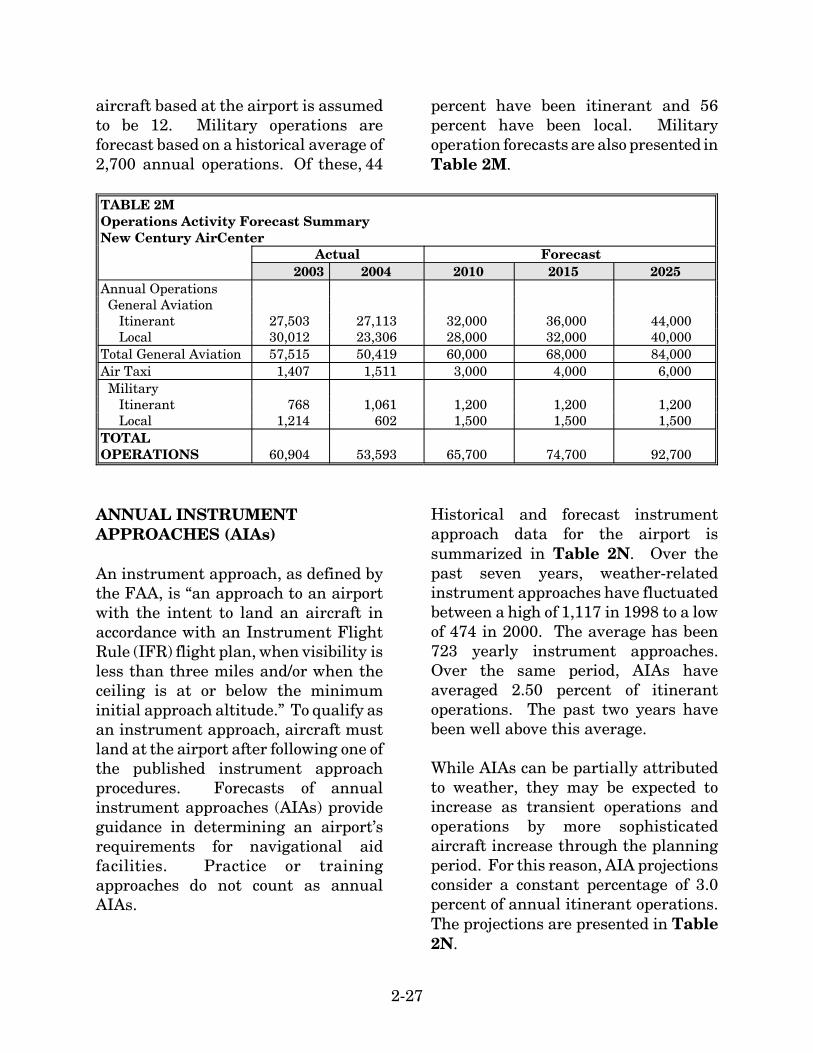
aircraft based at the airport is assumedto be 12. Military operations areforecast based on a historical average of2,700 annual operations. Of these, 44
percent have been itinerant and 56percent have been local. Militaryoperation forecasts are also presented inTable 2M.
TABLE 2MOperations Activity Forecast SummaryNew Century AirCenter
Actual Forecast2003 2004 2010 2015 2025
Annual Operations General Aviation Itinerant 27,503 27,113 32,000 36,000 44,000 Local 30,012 23,306 28,000 32,000 40,000Total General Aviation 57,515 50,419 60,000 68,000 84,000Air Taxi 1,407 1,511 3,000 4,000 6,000 Military Itinerant 768 1,061 1,200 1,200 1,200 Local 1,214 602 1,500 1,500 1,500TOTALOPERATIONS 60,904 53,593 65,700 74,700 92,700
ANNUAL INSTRUMENTAPPROACHES (AIAs)
An instrument approach, as defined bythe FAA, is “an approach to an airportwith the intent to land an aircraft inaccordance with an Instrument FlightRule (IFR) flight plan, when visibility isless than three miles and/or when theceiling is at or below the minimuminitial approach altitude.” To qualify asan instrument approach, aircraft mustland at the airport after following one ofthe published instrument approachprocedures. Forecasts of annualinstrument approaches (AIAs) provideguidance in determining an airport’srequirements for navigational aidfacilities. Practice or trainingapproaches do not count as annualAIAs.
Historical and forecast instrumentapproach data for the airport issummarized in Table 2N. Over thepast seven years, weather-relatedinstrument approaches have fluctuatedbetween a high of 1,117 in 1998 to a lowof 474 in 2000. The average has been723 yearly instrument approaches.Over the same period, AIAs haveaveraged 2.50 percent of itinerantoperations. The past two years havebeen well above this average.
While AIAs can be partially attributedto weather, they may be expected toincrease as transient operations andoperations by more sophisticatedaircraft increase through the planningperiod. For this reason, AIA projectionsconsider a constant percentage of 3.0percent of annual itinerant operations.The projections are presented in Table2N.

2-28
TABLE 2NAnnual Instrument Approach (AIAs) ProjectionsNew Century AirCenter
Year AIAsItinerant
Operations Ratio1998 1,117 35,587 3.14%1999 571 27,462 2.08%2000 474 27,101 1.75%2001 511 28,632 1.78%2002 675 27,575 2.45%2003 909 27,503 3.31%2004 807 27,113 2.98%
FORECASTSShort Term 960 32,000 3.00%Intermediate Term 1,080 36,000 3.00%Long Term 1,320 44,000 3.00%Source: FAA Terminal Area Forecast - Approach Operations
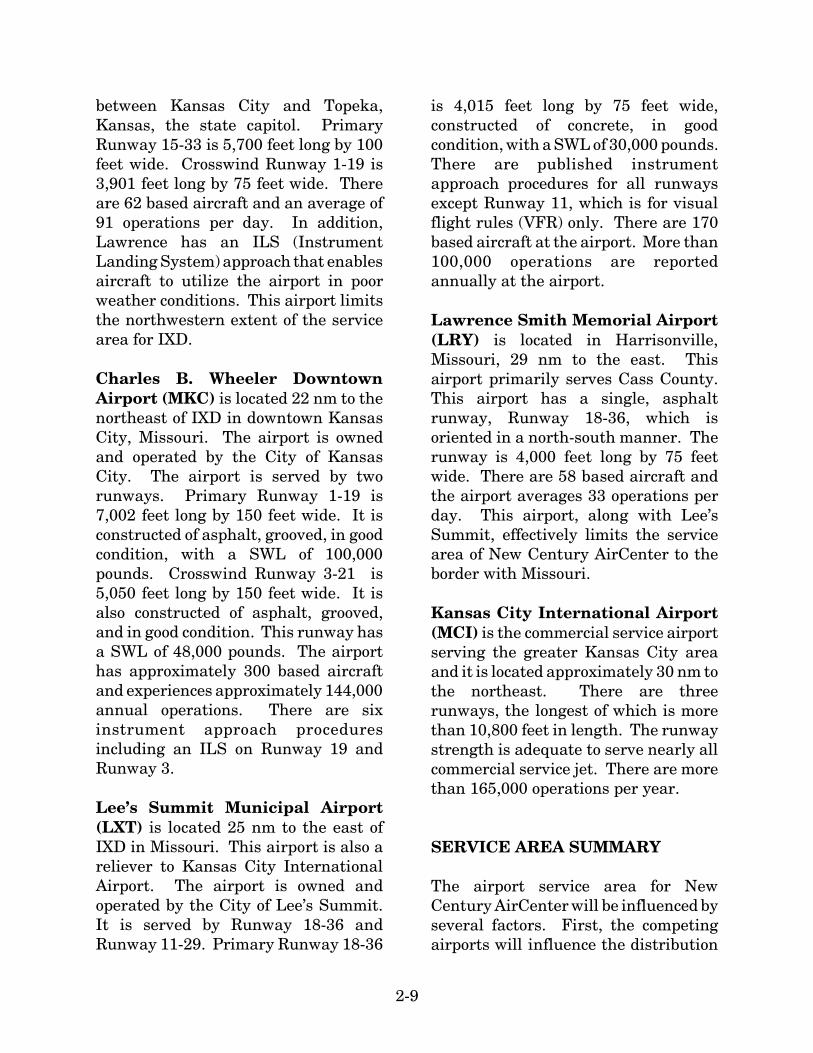
SUMMARY
This chapter has provided demand-based forecasts of aviation activity atNew Century AirCenter over the next20 years. An attempt has been made todefine the projections in terms of short,intermediate and long termexpectations. Elements such as localsocioeconomic indicators, anticipatedregional development, and historicalaviation data, as well as national
aviation trends, were all consideredwhen determining future conditions.
The next step in the master planningprocess will be to assess the capacity ofthe existing facilities, their ability tomeet forecast demand, and to identifychanges to the airfield and/or landsidefacilities which will create a morefunctional aviation facility. A summaryof aviation forecasts is depicted onExhibit 2G.

IXD
-04M
P19
-2G
-5/1
6/05
Exhibit 2GFORECAST SUMMARY
INTERMEDIATETERMCATEGORY
Peak MonthBusy DayDesign DayDesign Hour
5,600261187
33
7,398345247
43
8,411393280
49
BASED AIRCRAFT FORECASTS
SUMMARY OF AVIATION ACTIVITY FORECASTSSUMMARY OF AVIATION ACTIVITY FORECASTS
Itinerant Air Taxi General Aviation MilitaryTotal ItinerantLocal General Aviation MilitaryTotal Local
Total Operations
1,51127,1131,061
29,685
23,306602
23,908
53,593
3,00032,000
1,20036,200
28,0001,500
29,500
65,700
4,00036,000
1,20041,200
32,0001,500
33,500
74,700
10,438487348
61
Single EngineMulti-EngineTurbo-PropTurbo-JetHelicopters/Others
Total Based Aircraft
13233
810
2
185
170351115
4
235
193371420
6
270
238412131
9
340
6,00044,000
1,20051,200
40,0001,500
41,500
92,700
OPERATIONS FORECASTS
PEAK OPERATIONS
807 960 1,080 1,320AIA's
LONG TERMSHORT TERM2004
Operations Forecasts
Ope
rati
ons
(x 1
,000
)
150
Long TermIntermediateTerm
ShortTerm
2004
350
300
250
120
90
60
30
Based Aircraft Forecasts
Long TermIntermediateTerm
ShortTerm
2004
200
150
100
50
0
Bas
ed A
ircr
aft