Embed Size (px)
Citation preview

CHAPTER 7. TOWARD GREATER ACCESS TO PHARMACEUTICALS IN AZERBAIJAN
7.1 Introduction
Public expenditure on pharmaceuticals in Azerbaijan i s one of the lowest in the region. As a share of total healthcare expenditures, however, it is one of the highest. This seeming inconsistency is due to the fact that a very large proportion of pharmaceutical purchases are made out-of-pocket. Healthcare expenditures in Azerbaijan as a percentage o f GDP are the lowest in the region, as are expenditures o n pharmaceuticals (see Table 7.1). However, the data do not fully account for formal and informal private spending on healthcare and pharmaceuticals.
The decline in the GDP in the 1990s, together with decreasing public expenditures on healthcare, resulted in households bearing an increasing amount o f their healthcare expenditures out-of-pocket (OOP), including for pharmaceuticals. In a 2004 national representative sample survey, annual household OOP expenditures for medical goods and dispensed drugs was estimated at AZM 242,875 per capita, or approximately 70.7 percent o f total OOP health expenditures per capita. The annual per capita payment for medicines procured outside o f health service providers was estimated at AZM 19,763, or 31.9 percent o f total hospital per capita expenditure^.'^^ These estimates should be viewed in the context o f a general deterioration o f health due to increases in communicable diseases, environmental pollution, stress related to economic difficulties and a l i festyle characterized by high levels o f alcohol consumption and smoking-all o f which increase the need for healthcare and pharmaceuticals.
Another study estimated that purchases o f pharmaceuticals comprised almost 6 1 percent o f total healthcare expenditures, with a considerable proportion o f such purchases made o u t - ~ f - p o c k e t . ’ ~ ~ Using information from a pharmaceutical wholesale company that has a 5 percent market share, i t can be estimated that total pharmaceutical sales on the Azeri market are between US$120 and US$lSO mil l ion. These figures are higher than U.S. State Department estimates o f about US$SO million,’6s computed on the basis o f official government estimates o f US$37 million, an allowance for underreporting o f import and customs data, and black market estimates. Although the actual size o f the Azeri pharmaceutical sector i s difficult to fully ascertain, especially the ratio o f public to private spending, the latter i s thought to account for most expenditures on medicines.
‘63 G&G Consulting, “Health Financing Study,” 2005. G&G Consulting, “Health Expenditure Analysis,” 2004. 164
165 U.S. and Foreign Commercial Services and US. Department o f State, “Market Snapshot: Pharmaceuticals Market in Azerbaijan,” http://www.bisnis.doc.gov/bisnis/bisdoc/O11012AZPharm.htm, 2003.
160
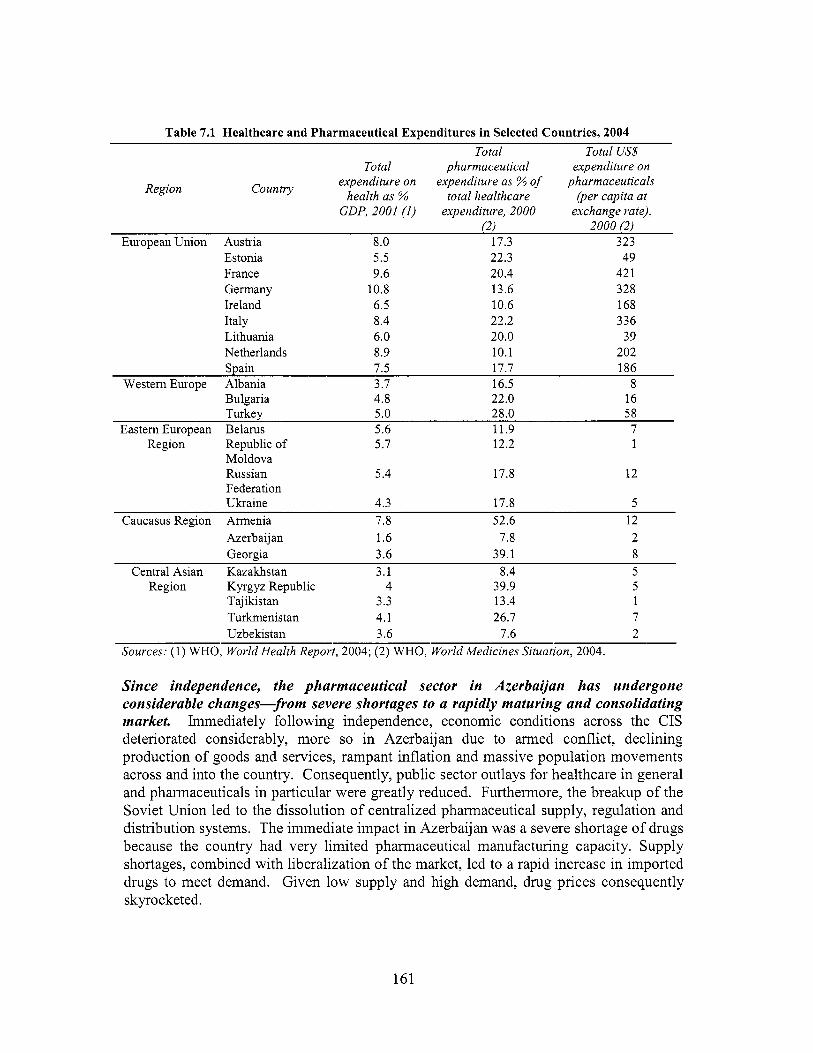
Table 7.1 Healthcare and Pharmaceutical Expenditures in Selected Countries, 2004 Total Total US$
Total pharmaceutical expenditure on Countly expenditure on expenditure as % of pharmaceuticals
Region health as % total healthcare (per capita at GDP, 2001 (1) expenditure, 2000 exchange rate),
(2) 2000 (2) European Union Austria 8.0 17.3 323
Estonia 5.5 22.3 49 France 9.6 20.4 42 1 Germany 10.8 13.6 328 Ireland 6.5 10.6 168 Italy 8.4 22.2 336 Lithuania 6.0 20.0 39 Netherlands 8.9 10.1 202 Spain 7.5 17.7 186
Westem Europe Albania 3.7 16.5 8 Bulgaria 4.8 22.0 16 Turkey 5.0 28.0 58
Eastem European Belarus 5.6 11.9 7 Region Republic o f 5.7 12.2 1
Moldova Russian 5.4 17.8 12 Federation Ukraine 4.3 17.8 5
Caucasus Region Armenia 7.8 52.6 12 Azerbaijan 1.6 7.8 2 Georgia 3.6 39.1 8
Central Asian Kazakhstan 3.1 8.4 5 Region Kyrgyz Republic 4 39.9 5
Tajikistan 3.3 13.4 1 Turkmenistan 4.1 26.7 7 Uzbekistan 3.6 7.6 2
Sources: (1) WHO, World Health Report, 2004; (2) WHO, World Medicines Situation, 2004.
Since independence, the pharmaceutical sector in Azerbaijan has undergone considerable changes-from severe shortages to a rapidly maturing and consolidating market. Immediately fol lowing independence, economic conditions across the CIS deteriorated considerably, more so in Azerbaijan due to armed conflict, declining production o f goods and services, rampant inflation and massive population movements across and into the country. Consequently, public sector outlays for healthcare in general and pharmaceuticals in particular were greatly reduced. Furthermore, the breakup o f the Soviet Union led to the dissolution o f centralized pharmaceutical supply, regulation and distribution systems. The immediate impact in Azerbaijan was a severe shortage o f drugs because the country had very limited pharmaceutical manufacturing capacity. Supply shortages, combined with liberalization o f the market, led to a rapid increase in imported drugs to meet demand. Given l o w supply and high demand, drug prices consequently skyrocketed.
161

Privatization o f the pharmaceutical sector in Azerbaijan began after the enactment o f the Law on Pharmaceutical Act iv i ty in 1997. Private importers, wholesalers and pharmacies began to enter the market, and a wider range o f drugs were imported that resulted in gradual withdrawal o f the state in providing pharmaceuticals, limiting its involvement to regulation and quality control o f the market. As a result, the availability o f drug supplies began to gradually improve. At present, some 70 domestic and foreign companies are supplying the Azeri market with 3,000 mainly generic drugs. An influx o f unregistered and counterfeit drugs, particularly from Russia, Turkey and India, means that the drug quality control system must be modemized and efforts to monitor the drug supply strengthened, both o f which are critical steps in tackling the problem o f counterfeit drugs in the country.
7.2 Supply of, Access to and Quality o f Pharmaceuticals
Affordability of drugs is a major concern. Although a wide range o f pharmaceutical products is, in principle, available on the market, these drugs are not necessarily affordable. Public funding allocations for drugs cover only minimal needs and are limited either to inpatient care or diseases with public health consequences, such as tuberculosis, malaria or other chronic diseases. As a result, the burden o f paying for almost al l outpatient drugs falls squarely on the patient. Even people who are supposedly eligible for free drugs are often unable to access them.
In 2000, per capita expenditure on pharmaceuticals in Azerbaijan was estimated at US$2.0, the lowest ranking in the region, only slightly above the worldwide average o f US$1.1 among low-income countries.'66 Even Georgia, which has a lower per capita income than Azerbaijan, spent US$8 per capita on pharmaceuticals that same year, the average for middle-income countries. Turkey, on the other hand, spent US$58 per capita on pharmaceuticals during that same period (see Table 7.1). European Union countries spent significantly more per capita than the rest o f the world, ranging f rom a low US$39 by new EU member Lithuania to a high US$421 by France. Azerbaijan i s now working with international donors to improve both access to and rational use o f drugs.
Most drugs are imported and remain expensive by local standards. Imports are estimated to account for at least 60 percent o f the local drug market in Azerbaijan. The perception that imported products are o f higher quality than those produced domestically or in neighboring countries drove the shift to imported products. After the Russian currency crisis in 1998 and the devaluation o f the Azeri Manat, imports o f West European drugs decreased because they became prohibitively expensive. Subsequently, the market shifted to low-price suppliers from India and Turkey. A large share o f the current supply o f pharmaceuticals also comes from Russia, Ukraine and Iran. Products that enjoy a reputation for quality, such as those from the USA, France, Germany and other European countries, are often able to maintain higher prices. A growing number o f foreign pharmaceutical f i r m s have a local presence, often represented by a physician who promotes their drugs.
WHO, World Medicines Situation, 2004.
162

Domestic production in Azerbaijan remains limited. W h i l e there are nominally two production facilities in Azerbaijan, only one plant i s currently in operation. The functioning plant, Azerphann (Farmsintez), was established in 2000. Shares o f the company are held by MOH and private Azeri, Turkish and Iranian interests. The M O H acts on behalf o f the Azeri shares. The Turkish partners supply technology and equipment, while the Iranian partners provide bulk raw materials for production.
In i t s four manufacturing facilities, Farmsintez produces drugs in many formulations, including liquids, tablets, ointments and creams. The firm currently produces 86 generic products, some o f which are well-known internationally, mostly in small volumes. None o f these facilities i s compliant with good manufacturing practices (GMP). Farmsintez sells its products mainly through the M O H and local wholesalers. The manufacturing facilities are currently operating at less than 25 percent o f their capacity, with annual estimated sales o f US$450,000. The potential for export i s limited as the company is not GMP-compliant. In addition, importation o f expensive raw materials would make Azeri prices uncompetitive in international markets.
There i s a large and unregulated informal market in pharmaceutical products in Azerbaijan. Sales o f unregulated market traders are estimated to account for as much as 50 percent o f market volume. Although several laws govem the import o f pharmaceuticals and inspection o f imports has improved, anecdotal evidence indicates that up to 70 percent o f imports do not pass through customs or undergo inspection. Quality control has recently been instituted through the introduction o f a “hologram seal o f approval,” but pharmaceuticals without this seal are s t i l l widely available and distributed. The absence o f the “hologram seal” i s often explained by saying that retail drugs came from old stocks distributed prior to the new system, or that the seal was affixed only to the wholesale bulk package, not to retail packages. Thus, many drugs are easily available for purchase at numerous private outlets, but their quality i s often dubious.
7.3 Distribution of Pharmaceuticals
Drug distribution in Azerbaijan was privatized for the most part following enactment o f the Law o n Pharmaceutical Activi ty in 1997. This law privatized most warehouse, distribution and retail pharmacy facilities in the country. During the Soviet era, state- owned wholesaling companies in Azerbaijan imported pharmaceuticals and distributed them to state-owned pharmacies. With most wholesale companies now transformed into private companies, these f i r m s presently operate on a commercial basis independent o f state control. There are an estimated 50 drug importers andor wholesalers in the country.
163

7000
GOOW
5000
4000
300Q
2000
moo 0
tltc, iil
by pharmacists who are reportedly properly qualified. There are also about five public warehouses for medicines, but these facilities are in poor condition and do not have proper stock management tools, save those located in Baku. Despite poor conditions, the distribution system continues to function with the support o f MOH.
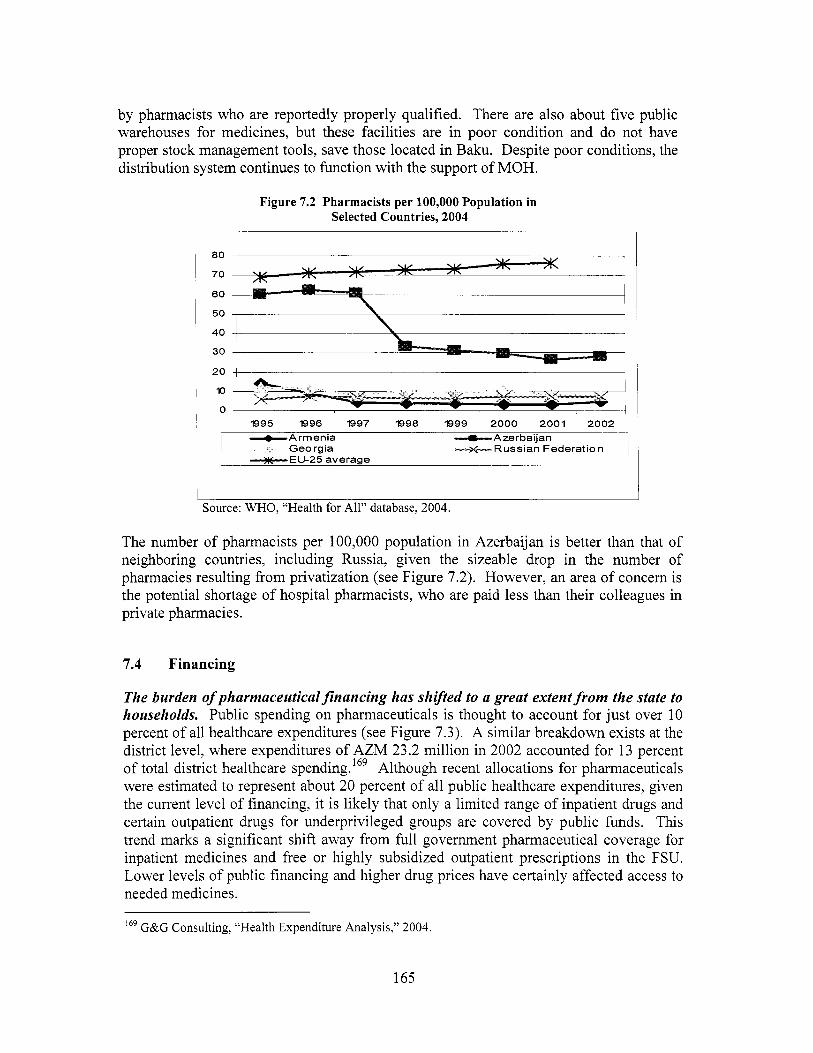
Figure 7.2 Pharmacists per 100,000 Population in Selected Countries, 2004
80
~ 70
60
~ 50 40
30
10
0 7995 7996 I997 7998 7999 2000 2001 2002
Azerbaijan I -Armenia Georgia Russian Federation 1 --m--.EU-25 average
, I
Source: WHO, “Health for All” database, 2004.
The number o f pharmacists per 100,000 population in Azerbaijan i s better than that o f neighboring countries, including Russia, given the sizeable drop in the number o f pharmacies resulting f rom privatization (see Figure 7.2). However, an area o f concern i s the potential shortage o f hospital pharmacists, who are paid less than their colleagues in private pharmacies.
7.4 Financing
The burden of pharmaceutical financing has shifted to a great extent from the state to households. Public spending on pharmaceuticals i s thought to account for just over 10 percent o f al l healthcare expenditures (see Figure 7.3). A similar breakdown exists at the district level, where expenditures o f AZM 23.2 mi l l ion in 2002 accounted for 13 percent o f total district healthcare spending. 169 Although recent allocations for pharmaceuticals were estimated to represent about 20 percent o f a l l public healthcare expenditures, given the current level o f financing, it i s likely that only a limited range o f inpatient drugs and certain outpatient drugs for underprivileged groups are covered by public funds. This trend marks a significant shift away from full government pharmaceutical coverage for inpatient medicines and free or highly subsidized outpatient prescriptions in the FSU. Lower levels o f public financing and higher drug prices have certainly affected access to needed medicines.
169 G&G Consulting, “Health Expenditure Analysis,” 2004.
165

Figure 7.3 Composition of Healthcare Spending, 2004 (as O h of total)
1 0 2995 2996 2997 2998 2999 2000 2001
-e- lnpat ient care (YO) +Pharmaceuticals (%) __ _1
Capital investment (%)
Source: Holley, Akhundov and Nolte, "Healthcare Systems in Transition," 2004.
Given current funding arrangements, historic expenditure patterns continue to determine current allocations, including those for pharmaceuticals. Hospitals often attempt to increase the amount requested for pharmaceuticals and other areas o f expenditure, but l i t t le if any increase i s seen from year to year. Most hospital budgets go to staff salaries and benefits. In some cases, even a portion o f the meager budget allocation for pharmaceuticals i s reallocated toward salaries. Patients are often requested to purchase the drugs they wil l need in hospitals out-of-pocket f rom private pharmacies. Although M O H does have a central supply system, there has been little effort to systematically and competitively leverage scale through bulk procurement o f basic drugs. At present, such purchases are estimated to cover only about 6 to 8 percent o f the hospital market .
The shortfall in public healthcare budgets has reduced the number of people eligible for public drug coverage, as well as the number of products covered. Although private pharmacies are supposed to supply drugs free to certain defined vulnerable groups, they rarely do so. Private pharmacies generally turn away subsidized patients because o f delays in government reimbursement. Community-based health councils, moreover, determine which families are exempt, leading to large variations in their number. Some districts have been reluctant to identify too many exempt families so as not to spend too much money. Humanitarian donations played a role in meeting this demand, particularly during the early stages o f the transition, but few such initiatives remain. Some rehabilitated primary-care facilities financed by donors have been stocked with basic drugs. However, given limited budgets, restocking these facilities will be difficult.
166

Due to current levels of public funding, patients currently pay for most or all of their pharmaceutical needs out-of-pocket. The 2002 Household Budget Survey o f the State Statistical Committee estimated that pharmaceuticals were one o f the main areas o f out- of-pocket health expenditure. 170 According to the survey, almost one-quarter o f all household expenditures on healthcare are for medicine. Although average per capita monthly household expenditures o n medicines were less than expenditures in other areas o f healthcare, the incidence o f expenditures on medicines far exceeded that for other areas o f treatment (see Figure 7.4). O f note, the richest Azeri households spend four times more per month on medicines than do the poorest households (see Figure 7.5). This finding indicates that there are wide disparities in households' ability to secure needed medicines. The need for affordable drugs thus continues to drive demand for counterfeit drugs, despite concerns about their quality.
Figure 7.4 Household Spending on Medicines and Healthcare, 2002
40,000
35,000
20 30,000
25
QI 0 c 25,000 p QI 15 c E 0 20,000 5 c -
10 15,000
10,000
5,000 5
0 0
Incidence of Households Spending on Health Care
+Average Monthly Household Health Exp per Capita
Source: SSC, Household Budget Survey, 2002.
I 7 O World Bank, PA, 2003.
167

Figure 7.5 Average Monthly Household Expenditure on Medicines per Capita
8,000
7,000
6,000
3 5,000
4,000
3,000
2,000
1,000
0
m c
1- 2 3 4 5- Income Quintile richest poorest
Source: SSC, Household Budget Survey, 2002.
A more recent national sample survey carried out in 2004 reported similar trends in household incidence o f pharmaceutical expenditures. 17’ Approximately 3 1.9 percent o f OOP per capita expenditures for hospital treatment are for drugs procured outside o f the providing facility. Annual per capita outpatient expenditures for prescribed and over-the- counter (OTC) medicines are approximately 52 percent o f total outpatient expenditures.
An earlier study estimated that direct drug payments range from 46.2 to 49.8 percent o f OOP health expenditures o f household^.'^^ The relatively high incidence o f expenditure on pharmaceuticals by Azeri households seems consistent with the estimate o f local experts that the current level o f public coverage o f pharmaceuticals i s approximately 10 percent o f demand.
7.5 Rational Drug Use (RDU)
Irrational prescribing of drugs continues to undermine the quality of healthcare in Azerbaijan. This practice is an inheritance o f the former Soviet health system, in which al l treatments were free and consultations created the expectation o f a prescription. Anecdotal evidence points to a high number o f prescribed products per visit, over-use and irrational prescribing o f antibiotics and overuse o f injections (for example, Vitamin C injections). Antibiotics are among the top-selling drugs in Azerbaijan, along with
G&G Consulting, “Health Financing Study,” 2005. G&G Consulting, “Health Expenditures Analysis,” 2004.
171
168

analgesics, cardiovascular drugs and gastrointestinal products.’73 This trend raises concerns about antibiotic resistance, as wel l as the cost and safety o f drugs that are being prescribed (oral formulations are not only safer. but less expensive than injectable formulations).
While there have been limited efforts to promote rational prescribing practices among physicians, many factors inhibit wider adoption o f these practices. The rapid influx o f previously unavailable medicines has, moreover, impeded the development o f rational prescribing because physicians often lack independent, unbiased information needed to prescribe rationally. As a result, physicians often have to rely on the manufacturers for information.
Since many drugs are available over-the-counter, people often bypass physicians and go directly to the pharmacy. Potent pharmaceuticals, including antibiotics, can be purchased without a prescription. Drugs available by prescription in Europe are often available over-the-counter in a number o f CIS countries. Even if a requirement stipulates that a drug be dispensed only by physician prescription, the requirement may not be strictly enforced. Patients, for example, often go directly to a pharmacist in order to avoid paying a physician consultation fee.
The development o f drug monitoring and evaluation systems for both prescribing and dispensing i s essential to improve rational drug use. Physicians, however, lack the tools for adequate prescribing: guidelines, a formulary, recent and unbiased drug information, plus other supporting tools. Furthermore, health centers often reflect the preferences o f their chief physician rather than basing prescriptions o n evidence-based practice. Rational drug use training o f primary-care physicians between 2002 and 2004 reportedly led to better compliance with modern prescribing principles, compared to that o f physicians who did not undergo such training.
Retraining o f physicians in some districts has led to some degree o f success, particularly among physicians working in hospitals. Those working in remote areas with l i t t le access to drugs often continue to write extensive prescriptions to be fulfilled in private pharmacies. A multifaceted approach i s needed to combat such practices, including formulation o f a standard drug l ist, revision o f treatment standards and education o f physicians and patients. Progress in this area wil l greatly benefit the poor, who cannot afford the cost o f extra prescriptions. Altering these practices will also improve the quality o f healthcare by reducing the number o f unnecessary drugs. However, such efforts wil l require a systematic, coordinated process at the national level.
With the support o f the World Health Organization (WHO) and the Wor ld Bank, MOH has started to develop treatment protocols for selected common diseases, linked to modifications of the essential drug list. At present, the only standardized drug l i s t i s that used for patients who are eligible for free care. Even that l i s t contains a range o f drugs that do not meet WHO standards. An essential drug list (EDL) i s being finalized by MOH and may be adopted before the end o f 2005. A modern national drug formulary
U.S. and Foreign Commercial Services, “Market Snapshot,” 2003. 173
169

that uses internationally recognized drug classifications ( A T C D D D ) i s also expected to be adopted, together with revised standard treatment protocols (STP).
Even with such efforts, additional strategies wil l st i l l be needed. Addressing the problem o f irrational drug use requires well-defined communication with the general public to address patient expectations. The formulary i s a useful source o f information and can become a useful tool in prescribing practices and training. Based on available information, a drug utilization study could be conducted to create the basis for continual monitoring o f prescribing practices. I t i s a well-known fact that confronting physicians with their own prescribing data i s one o f the most effective tools in changing prescribing patterns.
7.6 Legal and Regulatory Framework
The National Law on Pharmaceutical Act iv i ty o f 1997 i s the main legislation related to the pharmaceutical sector in Azerbaijan. This law provides the legal basis for registration, licensing and renewals, and a code o f practice for the Central Drug Control Laboratory (CDCL). Certain other technical details are defined by the MOH on an ongoing basis.
Quality control and assurance need to be further strengthened. Despite the 1997 law, the process o f developing a national drug pol icy has only commenced recently. Poor regulatory monitoring and law enforcement contributes to the problems o f drug quality and the availability o f unregistered drugs. In the Soviet Union, product registration and quality control was undertaken by Moscow. Equivalent institutions in Azerbaijan are therefore newly established. The country has taken steps to bring i t s national drug legislation and market authorization process in l ine with internationally accepted standards. However, the situation i s complicated by an ineffective judicial system and limited financial resources, which lead to inadequate salaries for enforcement staff. Concems over product quality and safety extend to the locations where drugs are sold. I t i s not uncommon for drugs to be traded in unlicensed pharmacies, where prescription requirements are often overlooked.
The Central Drug Control Laboratory o f Azerbaijan was extensively modemized in 2003 and now has four functional units for: (i) medicine quality control; (ii) examination o f medicines; (iii) food safety; and (iv) sanitary and epidemiological surveillance. Drug registration takes approximately 36 months for new drugs; registrations must be renewed every 5 years. If a drug i s the generic equivalent o f one already on the market and i s registered in Western Europe, a copy o f the existing registration certificate can be used. The cost o f registering a drug i s US$500. As a way to combat corruption, fees were increased in 2003 to increase staff salaries. However, there i s s t i l l scope for strengthening the inspection function.
With the rising number o f drugs in the country, i t has been a challenge for the C D C L to keep pace with drug registration. At the end o f 2004, there were approximately 2,602 drugs officially registered. However, anecdotal evidence suggests that almost 50 percent
170

o f current supply remains outside o f legal channels. This finding raises considerable concern about the quality and effectiveness o f the drug supply.
Experts from M O H and the MU’S Department o f Pharmacology have concluded that i t i s imperative to improve the present system o f drug registration to make it understandable and effective. The new National Drug Register wil l systematize the use o f International Non-proprietary Names (INN) for pharmaceuticals and differentiate brand names from INN, as we l l as generic drugs from brand products.
To improve public confidence in the quality o f drugs, the C D C L has introduced several measures to tackle unregistered drugs sold on the market. First, it has instituted a requirement for testing each batch o f drugs put o n the market. Hologram stickers are affixed to the packages o f drugs that pass inspection. The idea i s to indicate to the patient that the drug has been approved by quality control. In theory, these stickers are supposed to be very difficult to copy, but C D C L also has introduced a hotline that enables patients to call and check whether a given batch number has passed quality control. Since their introduction, these efforts have been responsible for stopping some o f the trade in counterfeit products. Although these are important steps in tackling counterfeit drugs, the magnitude o f the problem and the insufficient capacity o f the C D C L make it unlikely that C D C L adequately controls the entire market.
7.7 Key Issues, Options and Recommendations
W h i l e Azerbaijan appears to spend a l o w amount o n drugs, expenditures on pharmaceuticals constitute a significant percentage o f a l l health expenditures. This discrepancy can partly be explained by relatively l ow wages in the healthcare system, relative to other types o f expenditures, including pharmaceuticals, which are influenced by international prices. Most important, insufficient evidence exists to assess whether the amounts spent on pharmaceuticals buy good value and produce better health. Further economic studies are needed to document the extent to which drug use i s appropriate, safe and cost-effective in the country.
O n the production side, availability o f pharmaceuticals has greatly improved, and the market has matured in terms of pricing, importation, wholesale, distribution, retail and quality control functions. However, there i s a need for further action by the state to improve access to, and the safety and quality of, pharmaceuticals, as well as the appropriate use o f drugs. Based on available data and dialogue with key stakeholders in the healthcare sector, the fol lowing recommendations are offered:
Azerbaijan needs a comprehensive national drug policy, the objective o f which would be to improve the population’s access to high-quality, safe and effective drugs in accordance with the burden o f disease and the priorities o f the national health sector. Areas o f emphasis include pricing o f brand and generic drugs, an essential drug l i s t and standard treatment protocols for most common diseases.
171

Such a pol icy document should review progress to date o n legislation and regulation, identify areas where further legislation and regulation i s needed, as we l l as weaknesses in existing institutional and human resources for enforcement, quality assurance and control. More specifically, such a pol icy document should: (i) maintain and improve the quality, safety and efficiency of pharmaceuticals production in the country; (ii) establish efficient pricing and reimbursement policies; (iii) secure the uninterrupted supply o f and access to drugs in critical therapeutic classes in accordance with disease prevalence, morbidity rates and available financial resources; and (iv) build a system for the rational use o f medications.
Crucial goals include the pricing of brand and generic drugs, creation of an essential drug list and standard treatment protocols for most common diseases. Present efforts to develop and adopt an EDL suitable to Azerbaijan should be pursued to completion. In additional to an EDL, work on a national drug formulary and standardized treatment protocols (STP), together with a program for rational drug use (RDU), should be completed as expeditiously as possible. Expansion o f STPs to cover additional areas should be on the immediate horizon, using present momentum to update the body o f medical knowledge in the country. Ongoing work to improve the National Drug Register must be maintained to ensure systematic documentation that meets international standards. Training (pre and in-service) for al l practitioners also needs to be conducted on a regular basis. Most importantly, a public education and information campaign should be carried out o n the EDL, STPs and RDU.
Quality control and assurance need to be further strengthened. Despite a great deal o f progress, especially with regard to licensing and the use o f holograms, good manufacturing practices and good laboratory practices (GLP) in the manufacture and testing o f both imported and locally produced drugs need to be introduced. Effective law enforcement to prevent importation or manufacturing o f counterfeit or low-quality drugs should be scaled up. All these initiatives require significant investment in human resource development, as wel l as in production and testing facilities, not to mention the education o f the general public.
Affordability of drugs can be improved under current circumstances. W h i l e the adoption o f an EDL would be a step in the right direction, the government also needs to review the pricing o f drugs on the EDL and i t s own payment and reimbursement policies so as to better target the poor and chronically ill. These changes would lead to the revision o f state budgetary allocations for pharmaceuticals procurement. Targeting mechanisms used for social assistance could also be used for this purpose. Another method o f potential cost containment i s for the state to become an active bulk purchaser of, at the very least, drugs used in public facilities or distributed free (or at l ow cost) to eligible patients. Albania introduced precisely such a mechanism, resulting in lower prices and a higher quality o f publ icly procured drugs.
Appropriate use of drugs begins with good prescribing practices of physicians. W h i l e the introduction o f STP would be a step in the right direction, i t i s unrealistic to expect that all medical practice could be covered by such protocols. W h i l e a more holistic
172
family medicine model i s likely to increase time spent with patients, and consequently decrease both the number o f prescriptions and the number o f drugs per prescription, in- service physician training could, in the short run, result in more appropriate prescribing, as seen in pi lot districts o f the World Bank-financed health project in the country. Current training efforts must be, however, scaled up considerably.
A monitoring and evaluation system (M&E) is urgently needed. Admittedly, the amount, reliability and validity o f data on pharmaceuticals remain very limited for sound policymaking and regulation in a sector known for its dynamism, private-sector involvement and consequences for health and safety. In its ever increasing stewardship role, MOH should build i t s own M&E system to collect timely and accurate data on the production, importation, distribution, pricing, quality control and retailing o f pharmaceutical products, as well as the prescribing patterns o f providers. In addition, feedback mechanisms should be put in place, such as the Central Drug Control Laboratory hotline for user complaints, to improve the quality o f pharmaceuticals sold in the country.
173