Embed Size (px)
Citation preview

Statistical Annex
34
Chapter Three
chapter three
The Digital Opportunity Index (DOI)
35World Information Society Report 2007
3.1 UsingtheDigitalOpportunityIndex(DOI)
The Digital Opportunity Index (DOI) has been designed to as a tool for tracking progress in bridging the digital divide and the implementa-tion of the outcomes of the World Summit on the Information Society (WSIS). As such, it provides a powerful policy tool for exploring the global and regional trends in infrastructure, opportu-nity and usage that are shaping the Information Society.1 As explained in Chapter one, the DOI is one of two tools adopted by WSIS as part of an agreed implementation methodology. It has a focus on the adoption of new technologies, such as broadband and mobile Internet. A time series has been developed to monitor implementation of WSIS targets since the first phase of WSIS and will continue until the WSIS review in 2015 (see Data Table 3).2 The DOI thus complements the other WSIS-endorsed composite index—the ICT Opportunity Index—which has a stronger focus on traditional ICTs, such as fixed-lines and televi-sions, as well as on measures of literacy and edu-cational achievement.3
This chapter explores key trends in the Information Society. Section 3.2 explains the structure of the DOI and indicators that are used to assess dig-ital opportunity. Section 3.3 examines the latest DOI scores and rankings, for 2005/06. Section 3.4 reviews trends in the DOI over time. Section 3.5 uses the DOI to examine the key trends shaping the Information Society. It shows that many parts of the developing world are making strong gains in mobile telephony. By the end of 2008, over half the world’s population should have access to a mobile phone. Meanwhile, however, developed countries are forging ahead with new technolo-gies and ever-faster access. As shown in Chapter two, the digital divide is changing from inequali-ties in basic availability of ICTs to differences in the quality of the user experience. Policy-makers need to adjust their policy responses to take account of “quality”, not just the “quantity” of access to ICTs.
3.2 StructureoftheDOI
The DOI is a composite index comprising eleven separate indicators, grouped in three clusters of Opportunity, Infrastructure and Utilization (Figure 3.1d).4 The choice of indicators is notable, as:
» The DOI includes price data for mobile telephony and Internet access relative to local
incomes to reflect the affordability of ICTs and whether consumers can pay for mobile phone or Internet access in different countries. The DOI is the only index to date that includes price data for 181 economies, which is vital in assessing effective market demand.
» The DOI uses household penetrations (rather than per capita penetrations) for fixed lines, Personal Computers (PCs) and Internet access, as access to ICTs often begins in the home. Household penetration is appropriate for fixed lines, as they are provided on a house-hold basis, while home access to the Internet is significant in many countries (Figure 3.7). Using household penetrations reflects more accurately the true state of access to ICTs in developing countries, where average family size is larger, so per capita penetrations appear artificially suppressed and are lower.
» The DOI includes measures of more advanced technologies in broadband access (for both fixed broadband access and mobile broad-band or 3G). This means that the DOI can reflect the startling growth in these markets. It can also be used to assess market maturity, in the proportion of Internet and mobile sub-scriptions that have migrated to high-speed broadband access (see Figure 3.4 on the “New Substitution”).
Indicators in various data series are standardized on a scale of zero to one, by indexing relative to a reference value (data series and reference values are given in the Annex to this Chapter). For most indicators, this is 100 per cent, making the DOI simple and straightforward to calculate (simply dividing the indicator value by 100). Index scores in the three clusters are then averaged by simple average to give the overall DOI score for a country, between zero and one (no country achieves the upper or lower limit scores). Scores are directly comparable between countries and between years.
The results are remarkably straightforward and easy to use. Access to and the affordability of ICTs is condensed into a single index number between one and zero, permitting comparison of countries’ scores in any one year, as well as over time. A time series has been established, stretching back to the start of the WSIS process in 2000/01. This Report presents the latest results for the DOI 2006 (Data Table 1 in the Statistical Annex). As explored in the next section, results for the DOI show strong gains in digital opportunity around the world.

Statistical Annex
36
Chapter Three
Figure 3.1a: Digital Opportunity Index 2005/06 – World
Infr
astr
uct
ure
Op
po
rtu
nit
yU
seKorea (Rep.)
Japan
Denmark
Iceland
Singapore
Netherlands
Taiwan, China
Hong Kong, China
Sweden
United Kingdom
Finland
Norway
Luxembourg
Israel
Macao, China
Switzerland
Canada
Austria
Germany
United States
Spain
Australia
Belgium
Estonia
New Zealand
France
Barbados
Italy
Bahamas
Slovenia
Ireland
Portugal
Lithuania
Malta
Bahrain
Hungary
United Arab Emirates
Qatar
Cyprus
Antigua & Barbuda
Chile
Czech Republic
Brunei Darussalam
Slovak Republic
St. Kitts & Nevis
Latvia
Bulgaria
Croatia
Greece
Romania
Russia
Turkey
Poland
Argentina
Jamaica
Dominica
Malaysia
Mauritius
Trinidad & Tobago
Kuwait
1
2
3
4
5
6
7
8
9
10
11
12
13
14
15
16
17
18
19
20
21
22
23
24
25
26
27
28
29
30
31
32
33
34
35
36
37
38
39
40
41
42
43
44
45
46
47
48
49
50
51
52
53
54
55
56
57
58
59
60
0 0.10 0.20 0.30 0.40 0.50 0.60 0.70 0.80 0.90
Economy Rank DOI score
0.80 0.77
0.76 0.74
0.72 0.71
0.71 0.70 0.70
0.69 0.69 0.69 0.69 0.69 0.69 0.69 0.67
0.67 0.66 0.66 0.65 0.65 0.65 0.65 0.65 0.64 0.64 0.63
0.63 0.62
0.61 0.61 0.61 0.60
0.60 0.59
0.59 0.58
0.57 0.57 0.57 0.57 0.56 0.55 0.54
0.54 0.54 0.53
0.53 0.52
0.52 0.52 0.51 0.51 0.51 0.51 0.50 0.50 0.50 0.50 N
otes
: 1
) Fig
ures
3.1
a, b
and
c u
se d
iffer
ent s
cale
s.
2) H
ighe
r sco
re m
eans
bet
ter d
igit
al o
ppor
tuni
ty.
Sou
rce:
ITU
/UN
CTA
D/K
AD
O D
igit
al O
pp
ort
un
ity
Plat
form
.

37World Information Society Report 2007
Montenegro
Seychelles
Uruguay
Bosnia
Brazil
Mexico
Macedonia
Morocco
St. Vincent
Serbia
Grenada
Maldives
St. Lucia
Costa Rica
Saudi Arabia
Venezuela
China
Belarus
Jordan
Colombia
Oman
Thailand
Algeria
Belize
Dominican Republic
South Africa
Tunisia
Georgia
Panama
Ukraine
Egypt
Tonga
Lebanon
Kazakhstan
El Salvador
Peru
Ecuador
Palestine
Fiji
Botswana
Azerbaijan
Philippines
Gabon
Syria
Iran
Senegal
Albania
Guatemala
Libya
Suriname
Moldova
Paraguay
Namibia
Sri Lanka
Cape Verde
Indonesia
Armenia
Guyana
Bolivia
Swaziland
61
62
63
64
65
66
67
68
69
70
71
72
73
74
75
76
77
78
79
80
81
82
83
84
85
86
87
88
89
90
91
92
93
94
95
96
97
98
99
100
101
102
103
104
105
106
107
108
109
110
111
112
113
114
115
116
117
118
119
120
0 0.10 0.20 0.30 0.40 0.50 0.60
Economy Rank DOI score
0.490.480.480.480.48
0.470.470.470.470.470.47
0.460.460.460.460.460.45
0.450.450.450.44
0.430.42
0.420.420.420.41
0.410.410.410.41
0.410.400.400.400.400.400.400.39
0.380.380.38
0.370.370.370.370.370.37
0.360.360.35
0.350.35
0.350.34
0.340.33
0.330.330.32
Figure 3.1b: Digital Opportunity Index 2005/06 – World
Infr
astr
uct
ure
Op
po
rtu
nit
yU
seSo
urc
e: IT
U/U
NC
TAD
/KA
DO
Dig
ital
Op
po
rtu
nit
y Pl
atfo
rm.
Not
es:
1) F
igur
es 3
.1a,
b a
nd c
use
diff
eren
t sca
les.
2
) Hig
her s
core
mea
ns b
ette
r dig
ital
opp
ortu
nity
.

Statistical Annex
38
Chapter Three
Mongolia
Nicaragua
Uzbekistan
India
Samoa
Vietnam
Pakistan
Yemen
Cuba
Honduras
Equatorial Guinea
Djibouti
Lesotho
Bangladesh
Kyrgyzstan
Sudan
Cameroon
Angola
Turkmenistan
Bhutan
Vanuatu
Ghana
Tajikistan
Gambia
Côte d'Ivoire
Benin
Nepal
Papua New Guinea
Cambodia
Lao PDR
Togo
Congo
Kenya
Mauritania
Nigeria
Comoros
Zimbabwe
Uganda
S. Tomé & Principe
Haiti
Guinea
Tanzania
Zambia
Rwanda
Burkina Faso
Solomon Islands
Madagascar
Mozambique
Mali
Timor-Leste
Sierra Leone
Ethiopia
Burundi
Central African Rep.
Malawi
Congo, D.R.
Eritrea
Guinea-Bissau
Myanmar
Chad
Niger
121
122
123
124
125
126
127
128
129
130
131
132
133
134
135
136
137
138
139
140
141
142
143
144
145
146
147
148
149
150
151
152
153
154
155
156
157
158
159
160
161
162
163
164
165
166
167
168
169
170
171
172
173
174
175
176
177
178
179
180
181
0 0.05 0.10 0.15 0.20 0.25 0.30 0.35
Economy Rank DOI score
0.32 0.31 0.31 0.31 0.29
0.29 0.29 0.28
0.28 0.27
0.27 0.26
0.26 0.25
0.25 0.24
0.24 0.23
0.22 0.22 0.21
0.21 0.21 0.21 0.20
0.19 0.19 0.19
0.18 0.18
0.17 0.17 0.17 0.17 0.17
0.17 0.16
0.16 0.15
0.15 0.15
0.15 0.14
0.14 0.14 0.13
0.12 0.12 0.12
0.11 0.11 0.10
0.09 0.09
0.09 0.08
0.07 0.04
0.04 0.04 0.03
Figure 3.1c: Digital Opportunity Index 2005/06 – World
Infr
astr
uct
ure
Op
po
rtu
nit
yU
seSo
urc
e: IT
U/U
NC
TAD
/KA
DO
Dig
ital
Op
po
rtu
nit
y Pl
atfo
rm.
Not
es:
1) F
igur
es 3
.1a,
b a
nd c
use
diff
eren
t sca
les.
2
) Hig
her s
core
mea
ns b
ette
r dig
ital
opp
ortu
nity
.

39World Information Society Report 2007
Figu
re 3
.1d:
How
Dig
ital O
ppor
tuni
ty re
late
s to
nat
iona
l eco
nom
ic p
erfo
rman
ce
The
char
t sho
ws
the
rela
tion
ship
bet
wee
n D
OI a
nd n
atio
nal w
ealt
h, a
s in
dica
ted
by G
DP
per c
apit
a, u
sing
a lo
gari
thm
ic s
cale
.
0.0
0.2
0.4
0.6
0.8
1.0
2.5
33.
54
4.5
5$1
00$1
,000
$10,
000
$100
,00
Log
Gro
ss N
atio
nal
Inco
me
(lo
gar
ith
mic
sca
le)
Digital Opportunity Index
Bu
run
di
Rw
and
a
Vie
tnam
Pak
ista
n
Sen
egal
Mo
rocc
oJa
mai
ca
Bu
lgar
iaCh
ile
Esto
nia
Lith
uan
ia
Taiw
an, C
hin
aSi
ng
apo
re
Jap
anD
enm
ark
Ko
rea
(Rep
.)
Nig
erC
had
Tim
or-
Lest
e
Cu
ba
Equ
ato
rial
Gu
inea
Om
an
Ku
wai
t
Qat
ar
Van
uat
u
Not
e:
Econ
omie
s sh
own
abov
e th
e lin
e ha
ve a
hig
her D
OI s
core
than
wou
ld b
e pr
edic
ted
by th
eir G
DP
per c
apit
a.
Eco
nom
ies
belo
w th
e lin
e ha
ve a
low
er D
OI s
core
than
wou
ld b
e pr
edic
ted
by th
eir G
DP
per c
apit
a.So
urc
e: IT
U/U
NC
TAD
/KA
DO
Dig
ital
Op
po
rtu
nit
y Pl
atfo
rm.
Log
GD
P p
er c
ap
ita
(lo
gar
ith
mic
sca
le)0

Statistical Annex
40
Chapter Three
DIG
ITA
L O
PP
OR
TU
NIT
Y I
ND
EX
UTILIZATION
INFRASTRUCTURE
OPPORTUNITY
1 Percentage of population covered by mobile cellular telephony
2 Internet access tariffs as a percentage of per capita income
3 Mobile cellular tariffs as a percentage of per capita income
4 Proportion of households with a fixed line telephone
5 Proportion of households with a computer
6 Proportion of households with Internet access at home
7 Mobile cellular subscribers per 100 inhabitants
8 Mobile Internet subscribers per 100 inhabitants
9 Proportion of individuals that used the Internet
10 Ratio of fixed broadband subscribers to total Internet subscribers
11 Ratio of mobile broadband subscribers to total mobile subscribers
Figure 3.1e: Structure of the Digital Opportunity Index
Source: ITU/UNCTAD/KADO Digital Opportunity Platform.
Note: The indicators are averaged within each category and categories are averaged to obtain the Digital Opportunity Index value.
3.3 DigitalOpportunityaroundtheworld
The average DOI score worldwide in 2005/20065 was 0.40, up from 0.37 a year earlier (an increase of 8 per cent: See Data Table 3). However, there are big disparities, with low-income economies averaging less than half of this, at 0.18. In contrast, the average DOI score for high-income economies is more than three times the low-income score at 0.65 (Figure 3.2, left). Basic access to telecom-munications and affordability are the main areas of achievement for most countries (the purple area in Figure 3.2, left), especially for low-income countries. High- and upper-middle income coun-tries have made the strongest gains in digital opportunity since 2004, mainly through growth in high-speed broadband infrastructure and use of advanced technologies (Figure 3.2, right). However, small increases in average income have a much greater impact in raising digital oppor-tunity at lower levels of income – a ‘logarithmic’ relationship (Figure 3.1e). This is similar to the relationship observed with Internet user penetra-tion and average income (Figure 2.8). The larger gains achieved by the higher income groupings6
since 2004 suggest that absolute inequality7 (measured in percentage points) in digital oppor-tunity may be growing.
DOI scores are also sharply differentiated accord-ing to region (Figure 3.3, left). Europe and the Americas have average DOI scores higher than the world average, Asia’s is equal to the world average, while Africa has an average DOI score of 0.22, mainly due to limited utilization and fixed line infrastructure. Europe has achieved the larg-est overall gain in digital opportunity over the last two years, followed by the Americas, which made especially remarkable progress in 2006. Asia and Africa have witnessed smaller gains in digital opportunity (Figure 3.3, right). The implications for the digital divide are clear: digital opportunity is becoming more sharply divided by region, not less.
3.3.1EconomieswithHighDOIscores(0.49+)–SurgeinHigh-SpeedAccess
Economies with high DOI scores are mostly devel-oped economies in Europe, North America, East Asia and the Pacific. They include all 30 OECD member states except Mexico. These economies

41World Information Society Report 2007
Figure 3.2: Digital Opportunity by income grouping
Source: ITU/UNCTAD/KADO Digital Opportunity Platform.
Average DOI by income, 2006
Growth in overall digital opportunity by region, 2004-2006
Average DOI by region, 2006
Source: ITU/UNCTAD/KADO Digital Opportunity Platform.
Growth in overall digital opportunity by income grouping, 2004-2006
Figure 3.3: Digital Opportunity worldwide
0.65
0.49
0.40 0.38
0.18
Highincome
UpperMiddle
World Lowermiddle
Lowincome
UtilizationInfrastructureOpportunity
0.14
0.330.35
0.42
0.59
0.65
0.49
0.40 0.38
0.18
Highincome
UpperMiddle
World Lowermiddle
Low
2006
2005
2004
Gain in digital opportunity, 2004-6+0.05 +0.05+0.07+0.06 +0.04
income
0.58
0.450.40 0.40
0.22
Europe Americas Asia World Africa
UtilizationInfrastructureOpportunity
0.18
0.350.360.39
0.51
0.58
0.450.40 0.40
0.22
Europe Americas Asia World Africa
2006
2005
2004
+0.07 +0.06 +0.04 +0.04+0.05Gain in digital opportunity, 2004-6
provide good digital opportunity for most of their inhabitants, with varied and extensive infrastruc-ture, relatively low prices and widespread use of new technologies. Virtually all high-DOI econo-mies have high Opportunity, in excess of 0.99, except for a few Caribbean island states (Antigua & Barbuda, St. Kitts & Nevis and Dominica, with somewhat lower mobile coverage). High-DOI economies generally also have widely available infrastructure, with an average Infrastructure index of 0.54.
The factor that continues to set this group of countries apart, however, is their high Utilization averaging 0.33 (up from 0.25 last year), due to their high Internet usage and broadband sub-scriber penetrations. The Rep. of Korea stands out with an overall DOI score of 0.80, ahead of Japan at 0.77 and Denmark at 0.75. Japan and Denmark have made strong gains in digital opportunity and, if their current growth rates continue, it is likely that they will overtake the Rep. of Korea in digital opportunity in 2006/07.

Statistical Annex
42
Chapter Three
6.66.26.16.05.9
7.27.5
11.012.213.3
16.224.0
30.173.2
83.1United StatesChinaJapan
GermanyUnited Kingdom
FranceKorea (Rep.)
ItalyCanada
BrazilNetherlands
SpainIndia
AustraliaTaiwan, China
Broadband
Narrowband
Total number of Internet subscribers 9.3
6.06.4
11.412.011.9
11.110.0
6.2
3.2
1.40.3
0
5
10
15
2001 2002 2003 2004 2005 2006
Dial-upBroadband
Source: ITU/UNCTAD/KADO Digital Opportunity Platform (left chart); OFCOM (UK), “The Communications Market 2006”, at: www.ofcom.org.uk/research/cm/cm06/ (right chart). See also Table 10 in the Statistical Annex.
Type of Internet connections in the United Kingdom, total in millions, 2001-2006
Top economies by total number of Internet subscribers, in millions, 2005
Figure 3.4: The New Substitution
The top 25 economies in the DOI have been remarkably stable over the period 2004-2006. Indeed, the only economy to drop out of the top twenty-five was Slovenia, replaced by Estonia (studied further in Chapter four, Section 4.2.2). Rankings within the top twenty-five are consist-ent (suggesting the index is robust), with gener-ally changes of only a few places up or down – the only exceptions are the United Kingdom (which rose eight places due to strong gains in broad-band, with subscribers renouncing their dial-up connection – see Figure 3.4, right chart), and Canada (which falls seven places, due to its rela-tively weak cellular mobile penetration). Mauritius is the highest-ranking African economy, at 59th. Chile remains the highest-ranking Latin American country at 41st, followed by Argentina at 54th. The Gulf States continue to do well (including Bahrain at 35th place, the United Arab Emirates in 37th rank and Qatar in 38th rank), as do the Caribbean and other small island states.
Evolution in Internet subscriptions depends on both growth in the total size of the market, as well as the speed (quality) of connections. 2005 was a year of startling Internet growth in many countries, thanks to the boost from broadband, although the United States still remains the largest Internet market in terms of number of subscribers (Figure 3.4, left). Growth rates in Internet subscriptions are lower in high-DOI economies, but substitution is strong, with subscribers exchanging narrowband dial-up for a broadband connection. One example is the substitution of broadband for dial-up in the United Kingdom (Figure 3.4, right). In the United States, some 60 per cent of all Internet connec-
tions are now broadband, while in Japan and Spain, efforts by operators to encourage consum-ers towards broadband have resulted in three-quarters of Internet subscribers now using broad-band. In the Rep. of Korea and Canada, virtually all Internet users are already broadband subscribers and enjoy access to faster, advanced services such as video, teleconferencing, multiplayer gaming and triple play. Substitution of broadband for dial-up has also been observed in Qatar, where broad-band now accounts for two-thirds of all Internet accounts.8
3.3.2EconomieswithMediumDOIscores(0.30-0.49)–Roundedgrowth
The group with medium DOI scores comprises diverse economies from Latin America and the Caribbean, Asia and North Africa. Notably, it includes the developing country giants of China, Brazil, Egypt and Indonesia, as well as India, which joins the medium-DOI countries for the first time in this year’s release of the DOI. It also includes the upper-middle income African states of South Africa, Botswana and Gabon, as well as Namibia and Senegal (Box 3.1). Non-OECD European coun-tries generally also have medium-DOI scores (e.g., Albania, Belarus, Bosnia and Ukraine). China and the Maldives are the highest-ranked developing countries from Asia in the group. Medium-DOI countries have high average Opportunity at around 0.89, due to good mobile coverage and relatively low prices. What distinguishes this group from the low-DOI economies is their reasonable infrastruc-
43World Information Society Report 2007
ture and growing use of advanced technologies, but only at levels around a third of those achieved by high-DOI economies. They are also growing very fast - Brazil is now the tenth-largest Internet market in the world, while India appears in the top fifteen largest Internet markets for the first time.
One interesting observation among the medium-DOI group is that there are a growing number of countries where Utilization scores exceed Infrastructure. Last year, Utilization exceeded Infrastructure scores in only six economies.9 This year, Utilization exceeds Infrastructure scores in nineteen economies, thirteen of which are medium-DOI economies. The strong growth in broadband worldwide means that some econo-mies are successfully leveraging their investments in infrastructure to yield more rounded growth and more advanced forms of usage across a broad Information Society. For example, in Morocco, broadband now accounts for 98 per cent of all Internet connections in 2006 due to an aggressive marketing campaign between operators fight-ing for market share, resulting in high utilization
more than twice its infrastructure index (Box 3.2). This may represent a new form of technologi-cal ‘leapfrogging’, where operators investing in Internet infrastructure are able to adopt the latest technologies.
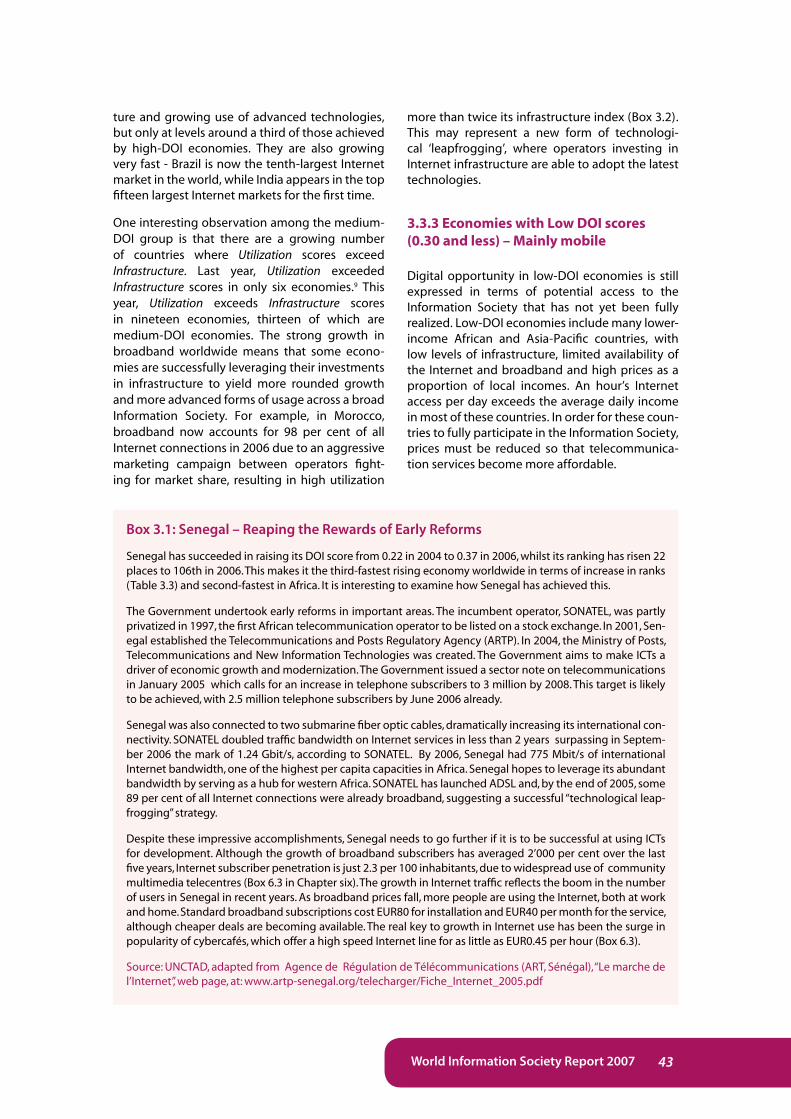
3.3.3EconomieswithLowDOIscores(0.30andless)–Mainlymobile
Digital opportunity in low-DOI economies is still expressed in terms of potential access to the Information Society that has not yet been fully realized. Low-DOI economies include many lower-income African and Asia-Pacific countries, with low levels of infrastructure, limited availability of the Internet and broadband and high prices as a proportion of local incomes. An hour’s Internet access per day exceeds the average daily income in most of these countries. In order for these coun-tries to fully participate in the Information Society, prices must be reduced so that telecommunica-tion services become more affordable.
Box 3.1: Senegal – Reaping the Rewards of Early Reforms
Senegal has succeeded in raising its DOI score from 0.22 in 2004 to 0.37 in 2006, whilst its ranking has risen 22 places to 106th in 2006. This makes it the third-fastest rising economy worldwide in terms of increase in ranks (Table 3.3) and second-fastest in Africa. It is interesting to examine how Senegal has achieved this.
The Government undertook early reforms in important areas. The incumbent operator, SONATEL, was partly privatized in 1997, the first African telecommunication operator to be listed on a stock exchange. In 2001, Sen-egal established the Telecommunications and Posts Regulatory Agency (ARTP). In 2004, the Ministry of Posts, Telecommunications and New Information Technologies was created. The Government aims to make ICTs a driver of economic growth and modernization. The Government issued a sector note on telecommunications in January 2005 which calls for an increase in telephone subscribers to 3 million by 2008. This target is likely to be achieved, with 2.5 million telephone subscribers by June 2006 already.
Senegal was also connected to two submarine fiber optic cables, dramatically increasing its international con-nectivity. SONATEL doubled traffic bandwidth on Internet services in less than 2 years surpassing in Septem-ber 2006 the mark of 1.24 Gbit/s, according to SONATEL. By 2006, Senegal had 775 Mbit/s of international Internet bandwidth, one of the highest per capita capacities in Africa. Senegal hopes to leverage its abundant bandwidth by serving as a hub for western Africa. SONATEL has launched ADSL and, by the end of 2005, some 89 per cent of all Internet connections were already broadband, suggesting a successful “technological leap-frogging” strategy.
Despite these impressive accomplishments, Senegal needs to go further if it is to be successful at using ICTs for development. Although the growth of broadband subscribers has averaged 2’000 per cent over the last five years, Internet subscriber penetration is just 2.3 per 100 inhabitants, due to widespread use of community multimedia telecentres (Box 6.3 in Chapter six). The growth in Internet traffic reflects the boom in the number of users in Senegal in recent years. As broadband prices fall, more people are using the Internet, both at work and home. Standard broadband subscriptions cost EUR80 for installation and EUR40 per month for the service, although cheaper deals are becoming available. The real key to growth in Internet use has been the surge in popularity of cybercafés, which offer a high speed Internet line for as little as EUR0.45 per hour (Box 6.3).
Source: UNCTAD, adapted from Agence de Régulation de Télécommunications (ART, Sénégal), “Le marche de l’Internet”, web page, at: www.artp-senegal.org/telecharger/Fiche_Internet_2005.pdf

Statistical Annex
44
Chapter Three
0
20
40
60
80
100
0
0.1
0.2
0.3
0.4
0.5
0.6
Fixed DOI Mobile DOI DOI score
Nig
erC
had
Gu
inea
-Bis
sau
Erit
rea
Co
ng
o, D
.R.
Mal
awi
CA
RB
uru
nd
iEt
hio
pia
Sier
ra L
eon
eM
ali
Mo
zam
biq
ue
Mad
agas
car
Bu
rkin
a Fa
soR
wan
da
Zam
bia
Tan
zan
iaG
uin
eaS.
To
mé
& P
rin
cip
eU
gan
da
Zim
bab
we
Co
mo
ros
Nig
eria
Mau
rita
nia
Ken
yaC
on
go
Tog
oB
enin
Cô
te d
'Ivo
ire
Gam
bia
Gh
ana
An
go
laC
amer
oo
nSu
dan
Leso
tho
Djib
ou
tiEq
uat
ori
al G
uin
eaSw
azila
nd
Cap
e V
erd
eN
amib
iaLi
bya
Sen
egal
Gab
on
Bo
tsw
ana
Egyp
tTu
nis
iaSo
uth
Afr
ica
Alg
eria
Mo
rocc
oSe
ych
elle
sM
auri
tiu
s
%
Figure 3.5: The Mobile Information Society in Africa
Strength in mobile is the main driver of digital opportunity in Africa, where the mobile sector (represented by the pale yellow area) accounts for over half of total digital opportunity (purple line) in the majority of African countries, 2005.
Source: ITU/UNCTAD/KADO Digital Opportunity Platform.
For many developing countries, wireless commu-nications are driving digital opportunity. Many low-DOI economies are in sub-Saharan Africa. As a region, Africa’s mobile market was the fast-est-growing market over the last five years, with a 50 per cent annual average growth rate over 2000-2005, more than twice the global aver-age over the same period (24 per cent). Mobile phones now outnumber fixed phones by nearly five to one in Africa, with some 137.2 million mobile subscribers by the end of 2005. This ratio is even higher in Sub-Saharan Africa, where nine out of every ten subscribers are using a mobile. African mobile penetration doubled from 6.5 per 100 inhabitants in 2003 to 13.1 per 100 inhabitants in 2005.
The DOI can be used to compare the fixed and mobile sectors separately, allowing policy-makers, especially in developing countries, to adapt national policies to their own national cir-cumstances, as called for by Para 28 of the Geneva Plan of Action.10 The economies where mobile components contribute the highest share towards the overall DOI score are mostly in Africa, where the mobile sector can account for as much as four-fifths of digital opportunity, although DOI scores remain generally low overall at around 0.22 (Figure 3.5). Prepaid has been a major driver
in Africa’s mobile growth, with some 92 per cent of African subscribers using a prepaid package in 2005. Large African mobile strategic inves-tors (such as Celtel, MTN and Vodacom) have emerged (Table 3.1), enjoying subscriber growth rates far greater those found in mature mobile markets. These pan-African operators have been able to exploit the growing demand for mobile telephony across many countries to build large-scale operations with significant economies of scale, negotiating group-wide purchases of equipment at lower costs.
Figure 3.5 also implies that, for African countries with strong mobile sectors, cell phones could be leveraged to also provide Internet access. There is substantial work within the industry to promote mobile Internet use beyond simple applications for chatting, email or simple browsing:
“A cellphone, despite its small screen size, 12-digit keypad (in most cases), and potentially slower connection speed, has the ability to provide the most popular web-based services. According to Jupiter Research, the most popu-lar online activities are sending and receiving e-mails, researching and purchasing products online, obtaining local news, listings, maps and traffic information, using instant messaging,

45World Information Society Report 2007
Table 3.1: Africa’s mobile strategic investors
Strategic investor
Subscribers (000s) 2006
Subscribers(000s) 2005
% change2005/06
Revenue(m US$)
2005
% change 2004/05
Yearly ARPU (US$)*
African Countries where the Investor has
Operations
MTN 24’300(Mar 2006)
15’600(Mar 2005)
56% $4’ 545(Mar
2005)
21% $291 Afghanistan, Benin, Cameroon, -, Congo, Ghana, Guinea, Guinea-Bissau, Liberia Nigeria, Rwanda, South Africa, Swaziland, Sudan, Syria, Uganda, Yemen.
Vodacom 23’520(Mar 2006)
15’483(Mar 2005)
52% $5’328(Mar
2006)
25% $227 Congo (DR), Lesotho, Mozambique, Mauritius, South Africa, Tanzania
Orascom 21’128 Africa (total
46’522)
17’500(total
30’383)
53%(total)
$3’216 -0.30% $69 Algeria, Egypt, Iraq, Pakistan, Tunisia, Zimbabwe.
Celtel 15’270(Sept 2006)
5’375(Sept 2005)
184% $953 60% $62 Burkina Faso, Chad, Congo, Congo (DR), Gabon, Kenya, Niger, Nigeria, Madagascar, Malawi, Sierra Leone, Sudan, Tanzania, Uganda, Zambia.
Orange n/a 5’188(Sept 2005)
n/a n/a n/a n/a Botswana, Cameroon, Côte d’Ivoire, Egypt, Eq. Guinea, Madagascar, Mali, Mauritius, Reunion, Senegal.
Millicom 12’800(Sept 2006)
8’929(Sept 2005)
43% $1’084 6% $85 Chad, Congo (DR), Ghana, Mauritius, Senegal, Sierra Leone, Tanzania.
Etisalat n/a 4’534 n/a $3’512 +23% $775 Benin, Burkina Faso, Central African Rep., Côte d’Ivoire, Gabon, Niger, Pakistan, Qatar, Saudi Arabia, Sudan, Tanzania, Togo, UAE.
Total 97’018 72’609 n/a $18’638 18% $145
* Estimated by ITU – not operators’ official figures.Source: ITU, abridged from company reports.
utilizing search portals, banking and reading news. Most of these activities can be done fairly easily on the average cellphone with a data con-nection today. Cellphones do not require a con-sistent power supply, can be charged every few
days, and can be carried securely in a pocket, an important feature in developing countries. Moreover, data and voice can be purchased in small increments.”11
Source: rcrnew.com

Statistical Annex
46
Chapter Three
Source: ITU/UNCTAD/KADO Digital Opportunity Platform.
Note: O = Opportunity; I = Infrastructure; U = Utilization sub-index. A driver is defined as a sub-index where there is an improvement of score of 0.15 or more over the period 2001-2006.
Table 3.2: Top Ten Gainers in the Digital Opportunity Index, 2004-2006
Economy DOI 2004 DOI 2006 Rank 2004 Rank 2006 Δ ranks Drivers
1 Morocco 0.33 0.47 104 68 +36 U
2 Russian Federation 0.38 0.52 78 51 +27 I,U
3 Senegal 0.22 0.37 128 106 +22 O,U
4 Ghana 0.10 0.21 161 142 +19 O
5 Antigua & Barbuda 0.44 0.57 58 40 +18 I,U
6 Gabon 0.26 0.37 121 103 +18 O
7 Belize 0.34 0.42 100 84 +16 U
8 Bhutan 0.12 0.22 155 140 +15 O
9 Cote d'Ivoire 0.12 0.20 158 145 +13 O
10 Romania 0.42 0.52 63 50 +13 U
Average (top 10) 0.27 0.39 113 93 + 20
Average (world) 0.35 0.4
3.4GrowthinDigitalOpportunityovertime
As emphasized in Chapter one, the main purpose of the DOI is to track progress towards bridging the digital divide and meeting the WSIS targets. This release of the DOI includes a three-year time series for 181 economies from 2004-2006. As shown in Figure 3.2, scores in the Digital Opportunity Index have been increasing steadily over the last couple of years. Virtually every economy has succeeded in improving access to ICTs in some way. It is only by making international comparisons that it is pos-sible to identify those policies that have been the most effective resulting in above average growth. For this reason, an approach based on compara-tive rankings is more meaningful than one that uses absolute growth rates.12
Table 3.3 lists the top ten gainers in terms of increases in ranks (see also Data Table 3). Economies with lower ranks tend to exhibit more mobility in the index (both up and down). Analysis of changes in DOI scores over time shows that economies are gaining in strength in differ-ent areas. Five of the top ten gainers come from Africa (Table 3.2). Morocco has the greatest over-all gain in rankings this year due to its remarkable improvements in Utilization (Box 3.2). Senegal has also made strong inroads in broadband access,
with 89 per cent of all Internet subscribers sub-scribing to broadband in 2005 (Box 3.1), as well as widespread Internet access through multimedia telecentres (Box 6.3 in Chapter Six).13 The other African economies in the top ten (Ghana, Gabon and Côte d’Ivoire) have witnessed increased mobile coverage and greater access to telecom-munications at reduced prices.
Other major gainers in the DOI include the Russian Federation and Romania, which have made strong gains in Utilization, mainly through growth in Internet usage and broadband access. Only the Russian Federation and Antigua and Barbuda have succeeded in boosting Infrastructure by an increase of more than 15 percentage points over the three-year period, suggesting that improved infrastructure is a longer-term goal for most econ-omies. Overall, however, Table 3.2 suggests that improvements in the DOI are not limited to any particular region – varied countries with different profiles in the development of their Information Society have enjoyed gains in digital opportunity.
In many countries, growth in digital opportunity is being driven by reductions in price of telecommu-nication services. ITU has measured the price of different telecommunication services since 2002 notably for mobile, Internet and broadband serv-ices. Prices for mobile, Internet and broadband services have fallen since 200314, due to grow-
47World Information Society Report 2007
ing liberalization and more competitive markets. For example, in South Africa in February 2007, the operator MTN increased data capacity and reduced broadband prices by up to 20 per cent, seeking “to bring mobile data within reach of a larger proportion of our population”.15 Broadband providers in South Africa are innovating with a
greater range of packages, pay-as-you-go or con-tract options for broadband, extended contracts and ‘shaped’ or ‘unshaped’ offers (prioritizing traffic according to consumers’ specific needs) to attract customers. In some countries, reductions in prices for telecommunication services have directly resulted in a growing number of subscrib-
Box 3.2: Morocco – An African Success Story
Morocco initiated market liberalization relatively early. In mobile communications, it became one of the first North African countries to introduce competition when it licensed a second mobile operator, Médi Telecom, in July 1999. A few months later in December 1999, the government sold 35 per cent of incumbent Maroc Telecom to Vivendi of France (see Box 4.2 in Chapter four). Intense competition between the two operators led to mobile phones overtaking fixed lines in August 2000, just six months after the second operator had launched its network. By June 2001, Médi had 755’000 customers and a population coverage of 70 per cent. Maroc Telecom responded by investing US$ 275 million in its network and innovating with its price strategy. It achieved a client base of one million customers in June 2000, two million in November 2000 and three million by May 2001. The recent growth in Morocco has significantly surpassed all its North African neighbours.
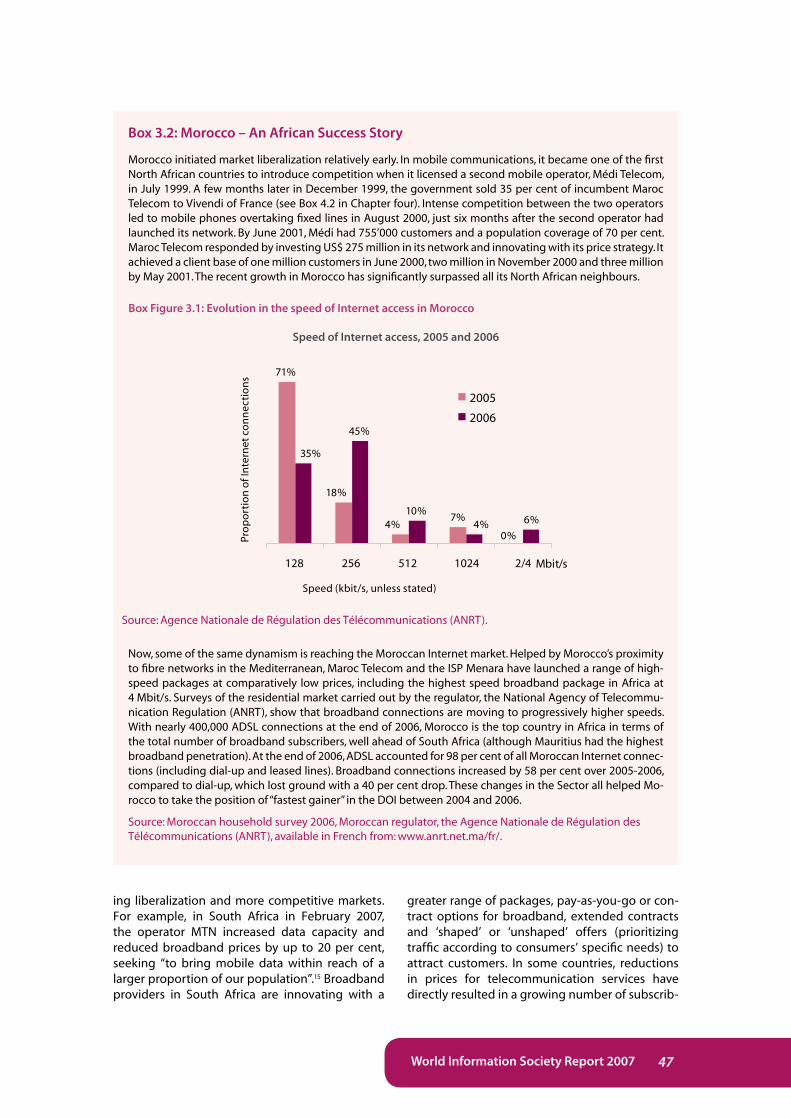
Now, some of the same dynamism is reaching the Moroccan Internet market. Helped by Morocco’s proximity to fibre networks in the Mediterranean, Maroc Telecom and the ISP Menara have launched a range of high-speed packages at comparatively low prices, including the highest speed broadband package in Africa at 4 Mbit/s. Surveys of the residential market carried out by the regulator, the National Agency of Telecommu-nication Regulation (ANRT), show that broadband connections are moving to progressively higher speeds. With nearly 400,000 ADSL connections at the end of 2006, Morocco is the top country in Africa in terms of the total number of broadband subscribers, well ahead of South Africa (although Mauritius had the highest broadband penetration). At the end of 2006, ADSL accounted for 98 per cent of all Moroccan Internet connec-tions (including dial-up and leased lines). Broadband connections increased by 58 per cent over 2005-2006, compared to dial-up, which lost ground with a 40 per cent drop. These changes in the Sector all helped Mo-rocco to take the position of “fastest gainer” in the DOI between 2004 and 2006.
Source: Moroccan household survey 2006, Moroccan regulator, the Agence Nationale de Régulation des Télécommunications (ANRT), available in French from: www.anrt.net.ma/fr/.
71%
18%
4%7%
35%
45%
10%4% 6%
128 256 512 1024 2/4 Mbit/s
Speed (kbit/s, unless stated)
Pro
po
rtio
n
of
Inte
rnet
co
nn
ecti
on
s
2005
2006
0%
Source: Agence Nationale de Régulation des Télécommunications (ANRT).
Box Figure 3.1: Evolution in the speed of Internet access in Morocco
Speed of Internet access, 2005 and 2006

Statistical Annex
48
Chapter Three
0
20
40
60
80
100
1990 1995 1998 2001 2003
Fixed Mobile
Fixed
only7%
Both
46%
Mobile
only
47%
Figure 3.6: Abandoning fixed lines
Source: Adapted from Statistics Finland (left) and Eurobarometer (right).
Proportion of Finnish households with telephones Proportion of Finnish households with fixed lines, mobile phones and both, 2005
ers: the UAE incumbent Etisalat reports that after rates of its high-speed Internet service Al Shamil were reduced by 46 per cent in 2005, the number of subscribers grew by 140 per cent.16 Greater choice of products, pricing and access platforms has fuelled growth in broadband in the UK.17
3.5 KeyTrendsintheInformationSociety
3.5.1 Cuttingthecord
The DOI measures the proportion of households with access to fixed lines (widely available from surveys or by derivation, i.e., residential telephone lines per 100 households). Fixed lines have histori-cally been important for voice, faxes, text and data communications. The DOI shows that fixed lines in homes are declining, mainly in response to the rise of mobile communications. This trend makes it likely that countries will never achieve 100 per cent fixed household penetration.
A good example is Finland, which has seen a dra-matic drop in the proportion of homes with fixed telephones from 94 per cent in 1990 to 64 per cent in 2003 (Figure 3.6) and an estimated 57 per cent by 2005.18 Nearly all Finnish from homes that do not have a fixed line nevertheless own a mobile phone or have access to one. Remarkably, over 80 per cent of Finnish homes with a fixed telephone
line are connected to DSL broadband service - many Finns are keeping their fixed telephone line mainly for broadband access.
Given the preference of many users for mobile rather than fixed telephony, this indicator could be adapted to measure the existence of a tele-phone in the household, regardless of whether it is fixed or mobile. However, the DOI already meas-ures mobile penetration through a per capita sub-scription indicator, since mobile telephones are personal and are less likely to be shared. While mobile telephone networks are evolving in their ability to offer higher-speed Internet access, high-speed wireless networks have yet to be widely launched around the world. There are, in general, only a small proportion of households that cur-rently use high-speed mobile networks to access the Internet, although fixed usage of 3G wireless for broadband Internet service is increasing. One example is the Czech Republic, where more than a third of the one million broadband subscribers at the end of December 2006 were using fixed wireless broadband.19 Despite this reduction in fixed lines in developed nations and lower rates of growth in developing ones, an indicator meas-uring the availability of telephony and poten-tial home access to the Internet is vital for policy analysis.
The growing use of Voice over Internet Protocol (VoIP) worldwide suggests that over time, fixed voice services will be provided over broadband

49World Information Society Report 2007
0
10
20
30
40
50
60
70
80
90
100
Leb
ano
n
Jord
an
Pale
stin
e
Para
gu
ay
Mex
ico
Bra
zil
Lith
uan
ia
Latv
ia
Esto
nia
%
Figure 3.7: Household Internet Access
Source: ITU/UNCTAD/KADO Digital Opportunity Platform, adapted from national statistical office data and ITU World Telecommunication Indicators Database.
Ratio of household computers with Internet access, selected economies by region,
2005
Household Internet and PC penetration for the economies with highest household penetrations,
2005
677070707274747475757678798081
8489%
% households with Internet % households with PCs
IcelandDenmark
JapanSweden
Korea (Rep.)Netherlands
Taiwan, ChinaMacao, ChinaLuxembourg
SwitzerlandSingapore
NorwayNew Zealand
Hong Kong, ChinaGermany
CanadaAustralia
0 100%
connections.20 In the future, it would be interesting to include subscriptions to connections capable of providing broadband access to the household. This would include not only fixed telephone lines, but also cable television and suitable equipped wireless connections, such as third generation mobile or fixed wireless access.
3.5.2 GettingconnectedtotheInternet
The price of computers remains a major obsta-cle to wider household penetration, especially in developing nations. However, one would assume that, having bought a computer, most households would then want to connect it to the Internet. In developed economies, access to the Internet is more likely to be from home than from the work-place, with high household Internet and PC pene-trations in all high-DOI economies (Figure 3.7, left). Iceland leads the world, with a household pene-tration of Internet access at 84 per cent and PCs at 89 per cent. In many developing countries, home is not the main place of access for users. There has been an explosive growth in public Internet facili-ties in many countries to cater to those without home Internet access (see the examples given in Chapter six). In fact, access from public facilities may be so successful that it may even be con-straining growth in home Internet access in devel-oping nations.
However, intriguingly, not all home computers are connected to the Internet. The ratio of home com-puters with Internet access differs widely. The ratio of home computers connected to the Internet ranges from 95 per cent in Estonia to 20 per cent in Lebanon (Figure 3.7, right). In the Baltic nations, Estonia and Latvia have computer to Internet ratios of some 95 per cent, yet in Lithuania, only 50 per cent of computers are connected to the Internet. Average income in Lithuania is lower than the other two countries, but Internet tariffs are cheaper and access is more affordable (See Data Table 9 in the Statistical Annex). Therefore, it is unclear why Lithuania has such a lower ratio of computers with Internet access. In Latvia, the ratio was just below 100 per cent in 2005 and exceeded it in 2006. The national statistical office reported that many households were accessing the Internet through mobile phones.
Japan has a high proportion of households with PCs without Internet (Figure 3.7, left) – partly due to the popularity of mobile Internet access in Japan. Mobile Internet access could result in relatively limited functionality in the passive web experience of cell phones, instead of positive par-ticipation in online web intelligence. These dif-ferent patterns of Internet usage could result in the development of different skill sets and could shape the Information Society differently, accord-ing to the type, speed and capacity of Internet access available.

Statistical Annex
50
Chapter Three
81
113133
145
166 170
2002 2003 2004 2005 2006 start2007
0
2
4
6
8
10
12
256
512
1'02
4
2'04
8
4'09
6
Speed (kbps)
Nu
mb
er o
f co
un
trie
s
2003200420052006
2005
2006
Figure 3.8: Internet access, at home and elsewhere, in Mexico
Source: Adapted from INEGI.
Distribution of Internet users by location of use, 2002-2006
Proportion of homes with Internet connection, 2002-2006
Note (right chart): Maximum advertised broadband speeds may not be always available, depending on network congestion, latency, routing of data etc.
Figure 3.9: Growth of broadband
Source: ITU/UNCTAD/KADO Digital Opportunity Platform.
Growth in maximum broadband speeds in Africa, 2003-2006
Number of economies with commercial broadband at speeds of 256 kbit/s or more, 2002-March 2007
0
20
40
60
80
100
20062005200420032002
54.7 63.5 61.5 68.3 66.4
Home Outside the home
20062005200420032002
6.1
7.48.7 9.0
10.1
In Latin America, Brazil and Mexico had the same household computer penetration of 18 per cent in 2005, yet in Brazil, 74 per cent of computers were connected to the Internet. In Mexico, only 9.4 per cent of homes had Internet access. In terms of affordability, Mexico’s per capita income is twice as large as in Brazil and Internet costs con-sume a smaller proportion of income in Mexico. Furthermore, the home Internet penetration rate in Mexico grew only very slowly from 2002-2006
(Figure 3.8). Further, most new Internet users in Mexico access the Internet from outside the home. While home and outside-home use was roughly equal in 2001, two-thirds of all Mexican Internet users now access the Internet from public facili-ties (i.e., Internet cafes and schools). Mexico has flat-rate local call pricing, whereas in Brazil, local calls are charged on a timed usage basis. From an economic perspective, there should be more Mexican households connected to the Internet

51World Information Society Report 2007
0
10
20
30
40
50
60
70
02/2
000
06/2
000
10/2
000
02/2
001
06/2001
10/2001
02/2002
06/2002
10/2002
02/2
003
06/2
003
10/2
003
02/2
004
06/2
004
10/2004
02/2005
06/2005
10/2005
%
Figure 3.10: Ratio of broadband to total Internet subscribers, Hong Kong, SAR
Source: Adapted from Office of the Telecommunications Authority (OFTA), Hong Kong, SAR.
Pro
po
rtio
n o
f to
tal s
ub
scri
be
rs
than Brazilian ones, but this is not the case. More research is needed on the reasons why people living in households with computers may not con-nect to the Internet.
While the explosion of public facilities offering Internet access is admirable (see Chapter six), policy-makers should focus on the benefits of each household having its own, regular Internet access.
3.5.3 Thedeathofdial-up?
The Digital Opportunity Index tracks access to new and advanced technologies, including fixed and wireless broadband. The telecommunication industry reached a key milestone in 2005, when broadband subscribers exceeded dial-up for the first time as the primary way of accessing the Internet. By the end of 2005, there were nearly 218 million broadband subscribers around the world, accounting for 53 per cent of all Internet subscrip-tions. At current rates of growth, the vast majority of Internet subscriptions should be at broadband speeds (equal to or greater than 256 kbit/s) by the end of this decade.
There is a widespread perception that broadband is less relevant for developing countries, but this is not the case. Broadband is increasingly available in developing countries. By the start of 2007, ADSL at speeds of 256 kbit/s and above was available in 170
economies (Figure 3.9, left). DSL was rolled out in Ghana21 and Libya22 during 2006. In 2007, Telecom Lesotho will introduce ADSL to improve Internet services and has submitted its proposed tariffs to the Lesotho Telecommunications Authority, which launched a Public Consultation on ADSL tariffs23, with a pilot project to be launched in Maseru.24 As long ago as December 2003, Macedonia became the last unserved European country to introduce broadband, with an ADSL service. However, due to Maktel’s monopoly over access to Internet bandwidth, Macedonia is focusing on wireless broadband, for example, for USAID’s school con-nectivity project to connect 461 schools.25
Meanwhile, the speed and choice of services available are growing. Maroc Telecom launched Internet Protocol Television (IPTV) over DSL in May 200626 and has recently launched the first four Mbit/s broadband package in Africa27 (Figure 3.9, right). Qtel (Qatar) is one of the first telecom-munication operators in the Middle East to have introduced a triple play offering over ADSL.28 Meanwhile, for many developing countries, wire-less broadband offers an attractive way of reach-ing greater number subscribers at reduced costs. In 2006, Africa Online Uganda introduced broad-band wireless with a wider coverage, designed to suit both business and home users. Wireless broadband can be much cheaper compared to leased lines, as bills are based on usage, rather than fixed monthly payments.29

Statistical Annex
52
Chapter Three
0 5 10 15 20
Japan
Korea (Rep.)
Italy
UK
USA
Germany
France
Spain
Portugal
Australia
CDMA 1x EV-DO
W-CDMA
Figure 3.11: Expansion of mobile broadband and 3G mobile
Source: ITU/UNCTAD/KADO Digital Opportunity Platform and ITU Internet Report 2006: digital.life.
Number of economies with mobile broadband technologies, 2001-2006
Top ten 3G mobile markets, 2005
5 924
7
2632
2511
20
30
2 2
12
79
61
42
2001 2002 2003 2004 2005 2006
CDMA 1x EV-DO
W-CDMA only
W-CDMA+HSDPA
Total
Some economies are taking longer to convert their Internet subscriber base to broadband, however, especially where there is a competitive market and tariffs are relatively low. In Hong Kong SAR, the broadband market boomed after 2000 with the ratio of broadband to total Internet subscrib-ers increasing by around one per cent a month (Figure 3.10).30 However, broadband growth has stagnated recently and the ratio of broadband to total Internet subscribers only increased by four per cent in 2005 to 63 per cent.
What explains this resistance to broadband?31 One factor is that even though broadband prices have dropped dramatically and bandwidth has risen, dial-up is still often cheaper in many economies, particularly those, such as Hong Kong SAR, that do not charge for local calls. Also, some users do not like the always-on feature of broadband, fearing it makes them more vulnerable to cyber-intrusion (an issue examined in Chapter five). Some users simply do not need broadband since they use mostly low-bandwidth applications such as email. Finally, there are users who do not have access to broadband because they live in remote areas, outside of the range of DSL or cable. This group of users is increasingly important as one focus of debates over universal service.
3.5.4 Growthin3Gmobile
There is strong growth in third generation (3G) mobile services, particularly in Asia and Europe, where nearly all the top ten largest markets are situated (Figure 3.11, left). Mobile broadband has grown in speed and by the first quarter of 2006, operators were advertising commercially available download velocities of between 384 kbit/s – 1.4 Mbit/s. The industry promises even higher speeds in the future. For example, Telstra, a mobile opera-tor in Australia claims that it will soon be providing peak network speeds of 14.4 Mbit/s over its High Speed Download Packet Access (HSDPA) network. Mobile broadband (3G) services are now offered in many developing countries throughout central and eastern Asia, Latin America and the Caribbean (Figure 3.10, right). Wideband CDMA networks were operational in 49 countries by the start of 2007, with 24 HSDPA networks. Twelve economies had separate networks supporting both W-CDMA and CDMA 2000 1x in 2006.32
As operators introduce these advanced mobile services, they are now deriving a greater propor-tion of their revenues from data services. In Africa, data revenues are small, but growing. Vodacom

53World Information Society Report 2007
reports data revenues of 2 billion Rand for 2006 (USD 0.3 bn), up 52 per cent from 1.3 bn Rand in 2005 (USD 0.2 bn). Data revenues constituted 7 per cent of total service revenues for Vodacom Group in 2006, up from 5.6 per cent in 2005.33
Vodacom considers that it is in an excellent posi-tion to take advantage of growth opportunities in the cellular and converged communications industry and recently launched “mobile TV on the move” over its HSDPA network. Vodacom plans to continue to grow mobile data revenues by mobi-lizing office tools and software applications such as 3G, HSDPA, Vodafone Mobile Connect Cards and live TV-streaming Blackberry at acceptable prices.34 Data revenues represent a much higher proportion of total revenues in the mature mar-kets of Asia-Pacific, where consumers are at ease with using their mobile for mobile gaming, m-commerce and access to news and sports alerts.
3.6Conclusions
This chapter has tracked progress in WSIS imple-mentation, with regards to the three clusters of the digital opportunity index (DOI) namely Opportunity, Infrastructure and Utilization. It has shown that the Information Society has grown steadily since the start of the WSIS process in 2003.
However, there are some concerns that in the development of the global Information Society continues to be uneven. Although the developing world is making strong gains in mobile telephony and, to a lesser extent, Internet access, Europe and Asia are gaining ground in the adoption of new technologies such as broadband and mobile Internet. This suggests that discrepancies in access to ICTs between countries are not only measured in terms of basic penetration and access, but are taking on new dimensions in speed, mobility and capacity of access. Through its measurement of mobile/fixed components and new technologies, the DOI can measure all these trends and can be used to improve and enrich policy-making. Speed and quality of access considerations must be taken into account in future assessments of the digital divide, as well as in the broader debate over provi-sion of universal service.
1 More information on the Digital Opportunity Index is available from: www.itu.int/doi.
2 A time series has been calculated for the full set of 181 economies since 2004 and for sixty-two economies since 2001.
3 The use of the ICT Opportunity Index is explored in greater detail in a separate ITU publication, published in February 2007: “Measuring the Information Society”, available at: www.itu.int/ITU-D/ict/publications/ict-oi/2007/index.html.
4 For more practical information on how the DOI is constructed, see the DOI user guide at: www.itu.int/osg/spu/statis-tics/DOI/doi-guide.pdf and the methodology report “Measuring digital opportunity” (November 2005), at www.itu.int/osg/spu/statistics/DOI/linkeddocs/Measuring_Digital_Opp_Revised_23_Nov_2005%20(2).pdf.
5 The DOI scores for each country have a mix of infrastructure indicators (valid for year end 2005) and tariff and coverage measures (valid for 2006). For that reason, the DOI scores presented here are classified as 2005/06 but, for convenience when making time-series analysis, they may be simply referred to as “ 2006”.
6 Income classifications are updated each year, based on Gross National Income. This comparison of digital opportu-nity uses the 2005/2006 income classification, applied to the DOI scores for 2004-2006.
7 As measured by the range in digital opportunity (high income – low income) and dispersion around world average.
8 “Qatar Internet and Datacomm Landscape”, report by the Arab Advisors Group, 21 February 2007, available from: www.arabadvisors.com.
Notes for Chapter Three

Statistical Annex
54
Chapter Three
9 Namely: Maldives, Morocco, Peru, Myanmar, Senegal and Venezuela; all of these were medium-DOI economies.
10 The Geneva Plan of Action can be downloaded from: www.itu.int/wsis/documents/doc_multi.asp?lang=en&id=1160|0.
11 www.rcrnews.com/apps/pbcs.dll/article?AID=/20070326/FREE/70322019/1026/FREE.
12 P. 51, Chapter 4, World Telecommunication Development Report (2002), ITU, Geneva, available from www.itu.int/publications/
13 Agence de Régulation de Télécommunications (ART, Sénégal), “Le marche de l’Internet”, web page, available at: www.artp-senegal.org/telecharger/Fiche_Internet_2005.pdf.
14 The 2006 World Information Society report noted that “In mobile telephony, worldwide, prices have been falling by an average of 10 per cent per year. Internet access has fallen by a similar amount and in 2005, cost only three-quar-ters of its price in 2003. As a more recent technology, broadband Internet access is the most expensive, but it has also fallen the most – broadband has enjoyed a 40 per cent reduction in price since 2003 due to growing competition and changes towards flat-rate, unmetered pricing packages”.
15 Press Release, 21 February 2007, available from MTN Press Release, at: www.mtn.co.za/?pid=9522&fullstory=382
16 Page 4, Etisalat Annual Report 2005, available from: www.etisalat.ae/assets/CCD/Digital%20Press%20Office/Financial%20Informaiton/Etisalat%20E%20AR05.pdf.
17 P. 109, Chap. 3: Telecommunications, The Communications Market 2006, available from: www.ofcom.org.uk/research/cm/cm06/. In relation to the UK broadband market, Chapter 3 notes that “in addition to widespread availa-bility, consumers now have an increased choice of broadband service providers… Together with the cable operators and the fast-growing wireless broadband sector, consumers have never had more choice of broadband products, pricing packages and access platforms. This in turn has fuelled the growth of broadband take-up and consumption”, page 109.
18 The first two figures are from Statistics Finland Household Budget Surveys (www.stat.fi/tk/el/kulutustutkimus/kulutust_t4_1.html), while the latter is from the following report commissioned by the European Commission: Eurobarometer, E-Communications Household Survey, July 2006.
19 For more detail, see the OECD’s December 2006 broadband subscriber estimates at: www.oecd.org/document/7/0,2340,en_2649_34223_38446855_1_1_1_1,00.html.
20 See for example, “Status of VoIP worldwide, 2006”, Background Paper prepared for the ITU workshop, “The Future of Voice”, 15-16 January 2007, available at: www.itu.int/osg/spu/ni/voice/papers/FoV-VoIP-Biggs-Draft.pdf.
21 www.ghanatelecom.com.gh/gt_aboutus/newsdetails.asp?pnum=3&id=228&catid=0.
22 www.lttnet.com/english/coming.php and www.lttnet.com/english/sr_libyadsl.php.
23 www.lta.org.ls/Consultations/Tariffs/29012007_TL_ADSL.html
24 Telecom Lesotho submission to LTA, Page 1, www.lta.org.ls/20070126082548627.pdf
25 www.dot-com-alliance.org/newsletter/article.php?article_id=127
26 See Maroc Telecom press release, 31 May 2006, available from: www.iam.ma/details.aspx?id=101 and www.iam.ma/fichiers/Maroc-Telecom-Communique-TVADSL-31mai06-VF(2).pdf.
27 The Moroccan regulator, the Agence Nationale de Régulation des Télécommunications (ANRT), available in French from: www.anrt.net.ma/fr/and Balancing Act Africa, www.balancingact-africa.com/news/back/balancing-act_340.html.
28 Annual report 2006, p.30, available atwww.qtel.com.qa/documents/ar/ANNUAL%20REPORT%20ENGLISH%202006.pdf.
29 www.africaonline.com/country.news.php?mode=getitem&itemno=115&cid=12
30 ITU, “Broadband as commodity: Hong Kong, China Internet case study”, April 2003, available at: www.itu.int/.
31 “The slow death of dial-up”, The Economist, 8 March 2007, available at: www.economist.com/search/displaystory.cfm?story_id=E1_RSGGDSP.
32 Australia, Israel, Japan, the Republic of Korea and the United States, Czech Republoc, New Zealand, Romania and Taiwan (China).
33 Page 11, Vodacom Annual report 2006, available from the Vodacom Group website at: www.vodacom.com/voda-com/investor_relations/docs/Vodacom%202006%20AR%20Full.pdf.
33 P. 12, Vodacom Annual report 2006, available from the Vodacom Group website at: www.vodacom.com/vodacom/investor_relations/docs/Vodacom%202006%20AR%20Full.pdf.

55World Information Society Report 2007
Annex: Methodological Note on Digital Opportunity IndexThe definitions of the core indicators used to compile the Digital Opportunity Index (DOI) are available from the Partnership for Measuring ICT for Development. The latest available data (year-end 2005) was used, except where noted otherwise. Where 2005 data were not available, later data was used for tariffs while for other indicators, earlier data was used or an estimate was made. This section identifies the methodology used to compile the indicators for this version of the DOI, including the time period of the data, and where necessary, the estimation technique.
Indicator Core
codeNote
Percentage of population covered by mobile cellular telephony
A-7The base year is 2005. This data is generally available from many mobile network operators. If national data are not available from an official source, the figure for the largest operator is used. In rare instances, this may understate actual coverage since different operators could cover different sections of the country. In the absence of data for a few countries, the percent-age of the urban population is used on the assumption that it is less costly to install infra-structure in those areas and they have a greater number of potential clients that can afford service.
Internet access tariffs (20 hours per month) as a percentage of per capita income
A-8The base year is 2006 since this is the latest year for which a complete set of comparable data is available. Data are based on the cheapest available package for 20 hours of use per month and do not include telephone line rental. The basket is divided by 2004 Gross National Income per capita (from the World Bank).
Mobile cellular tariffs as a percentage of per capita income
A-9The base year is 2005, since this is the latest year for which a complete set of comparable data is available. A monthly charge is compiled based on a basket of peak and off-peak and on-net, off-net and fixed calls. The basket is divided by 2004 Gross National Income per capita (from the World Bank).
Proportion of households with a fixed line telephone
HH-3
This indicator, which is based on 2005 data, should ideally be compiled from a household survey. If not available, administrative records can be used for the number of residential tel-ephone lines divided by the number of households.
Proportion of households with a computer
HH-
5
This indicator, which is based on 2005 data, should be compiled from a household survey. If not available, data on the number of computers in the country could be used, adjusted for the estimated amount in homes. If that data is not available, then the data are estimated based on the per capita income of regional peers.
Proportion of households with Internet access at home
HH-7
This indicator, which is based on 2005 data, should be compiled from a household survey. I not available, data on the number of Internet subscriptions, adjusted for the estimated amount in homes, can be used. If that data is not available, then the data are estimated based on the per capita income of regional peers.
Mobile cellular subscribers per 100 inhabitants
A-2The base year is 2005. Data are universally available for this indicator.
Mobile Internet subscribers
A-4†
The base year is 2005. Since mobile Internet access is relatively recent, many countries either do not report data on the number of subscribers or definitions vary.. There are a variety of in-dicators used to reflect mobile Internet use. Some operators report the number of high-speed subscriptions and others report the number of subscriptions to their mobile portal services. Some users utilize mobile cellular networks to access the Internet using laptop computers. There is little consensus as to whether these types of users should be considered fixed Inter-net subscribers or mobile Internet subscribers. Finally, the concept of Internet access is seri-ously challenged when including mobile, since the users’ experience is entirely different and many so-called mobile Internet users are not actually surfing websites per se but download-ing logos and ring tones or sending picture messages. In general, either the number of Wire-less Access Protocol (WAP), General Packet Radio Service (GPRS) or mobile portal subscribers is used. In the absence of data, estimates are based on the number of post-paid subscribers, the availability of mobile data networks (e.g., GPRS, EDGE, CDMA2000 or WCDMA) and re-gional trends.
Proportion of individuals that used the Internet
HH-
8
The base year is 2005. A growing number of countries have carried out surveys. In the absence of survey data, national estimates are used. If these are lacking, then estimates are derived from the number of subscribers.
Proportion of fixed broadband subscribers to total Internet subscribers
A-5†
The base year is 2005. There is a growing consensus that a service should be considered broadband only if it offers speeds of at least 256 kbit/s in at least one direction. Note that this indicator refers to ‘fixed‘ type of broadband access such as DSL, cable modem, Ethernet LAN, fibre optic and Fixed Wireless Access. This data set is generally complete for most countries that have broadband service.
Proportion of mobile broadband subscribers to total mobile subscribers
A-5†
The base year is 2005. Mobile broadband subscribers refer to users of mobile networks provid-ing speeds of at least 256 kbit/s in at least one direction. This data set is generally complete for countries that have mobile broadband service.
Source: ITU/UNCTAD/KADO Digital Opportunity Platform. † = Derivation of core indicator