Embed Size (px)
Citation preview
Chapter ThirteenChapter ThirteenMeasurementMeasurement
Winston Jackson and Norine Verberg
Methods: Doing Social Research, 4eMethods: Doing Social Research, 4e
2 © 2007 Pearson Education Canada
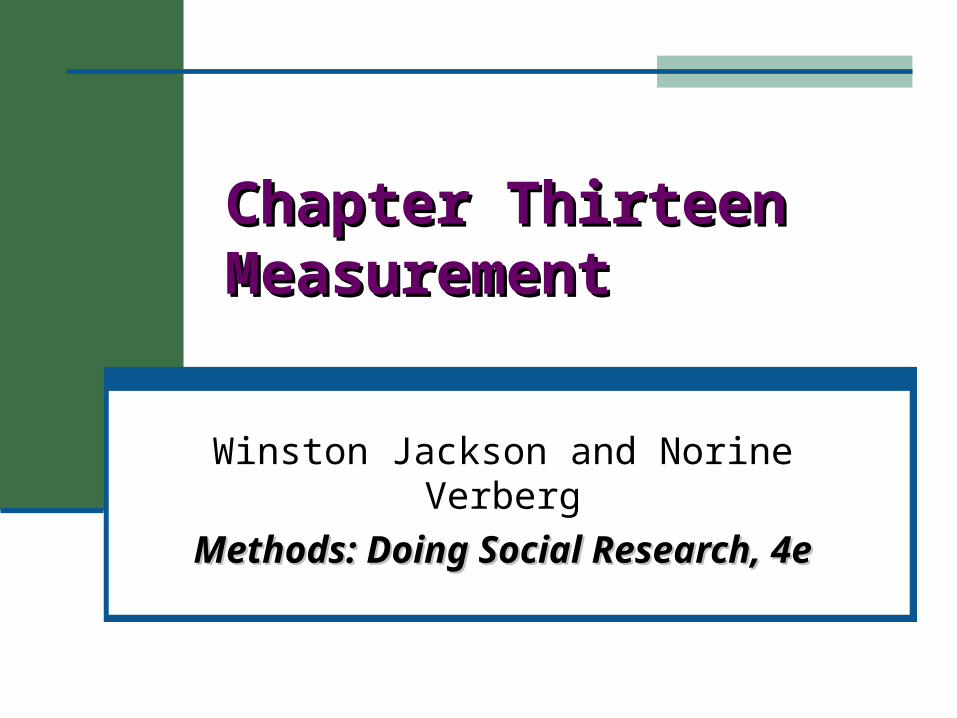
A. Theoretical, Conceptual, and Operational Levels
Measurement is the “process of linking abstract concepts to empirical referents”(Carmines & Zeller)
Hence, one moves from the general (theoretical level) to the specific (empirical level) i.e., For each concept, an indicator is identified e.g., What is the best way to measure, or indicate, a
person’s social prestige? The concepts we measure are called variables See Figure 13.1 (next slide)
3 © 2007 Pearson Education Canada
Figure 13.1 Levels in Research Design
FPO Figure 13.1 Levels in Research Design from page 350
4 © 2007 Pearson Education Canada
Figure 13.1
Shows movement from the general to the specific – from the theoretical level to the operational level referred to as operationalization
At the theoretical level, concepts (e.g., socioeconomic status, alienation, job satisfaction, conformity, age, gender, poverty, political efficacy) are conceptualized
At the operational level, the researcher must create measures (or indicators) for the concept Indicators should reflect the variable’s conceptual
definition
5 © 2007 Pearson Education Canada
Assessing Indicators
We assess the link between the concepts and the indicators by evaluating the validity and reliability of the indicators
1. Validity the extent to which a measure reflects a
concept, reflecting neither more nor less than what is implied by the conceptual definition
2. Reliability the extent to which, on repeated measures,
an indicator yields similar readings
6 © 2007 Pearson Education Canada
1. Validity (in Quantitative Research)
Illustration: concept - socioeconomic status Conceptual definition: a “hierarchical continuum
of respect and prestige” Operational definition: annual salary Assessment: Low validity (salary might not
capture prestige – widows, ministers, nuns – prestige and respect would be higher than income suggests
Measure should be congruent with conceptual definition
7 © 2007 Pearson Education Canada
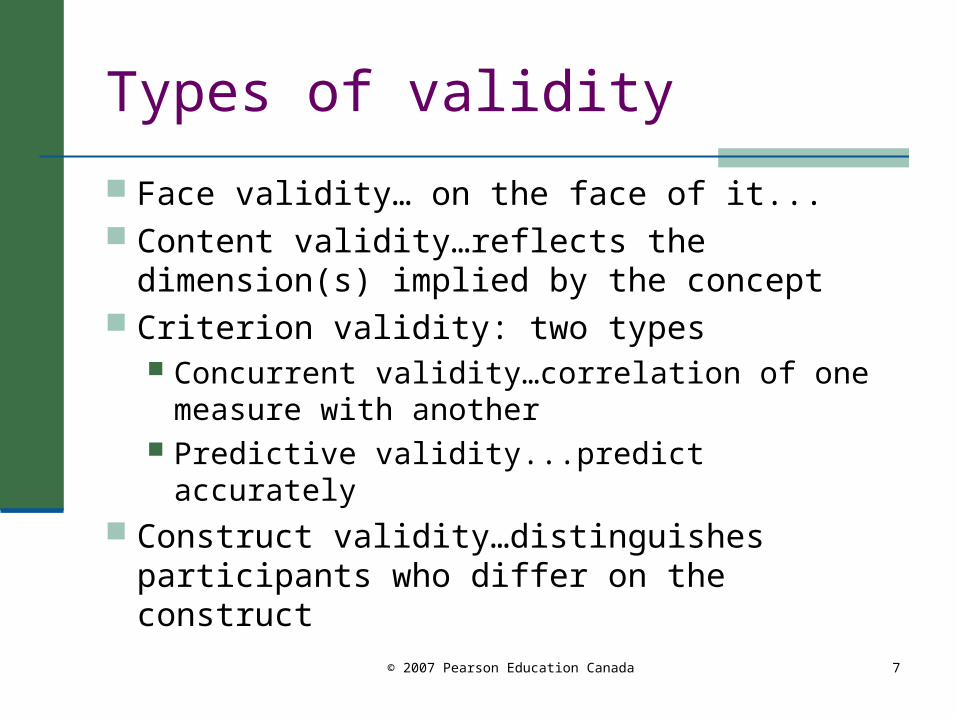
Types of validity
Face validity… on the face of it... Content validity…reflects the dimension(s)
implied by the concept Criterion validity: two types
Concurrent validity…correlation of one measure with another
Predictive validity...predict accurately Construct validity…distinguishes participants
who differ on the construct
8 © 2007 Pearson Education Canada
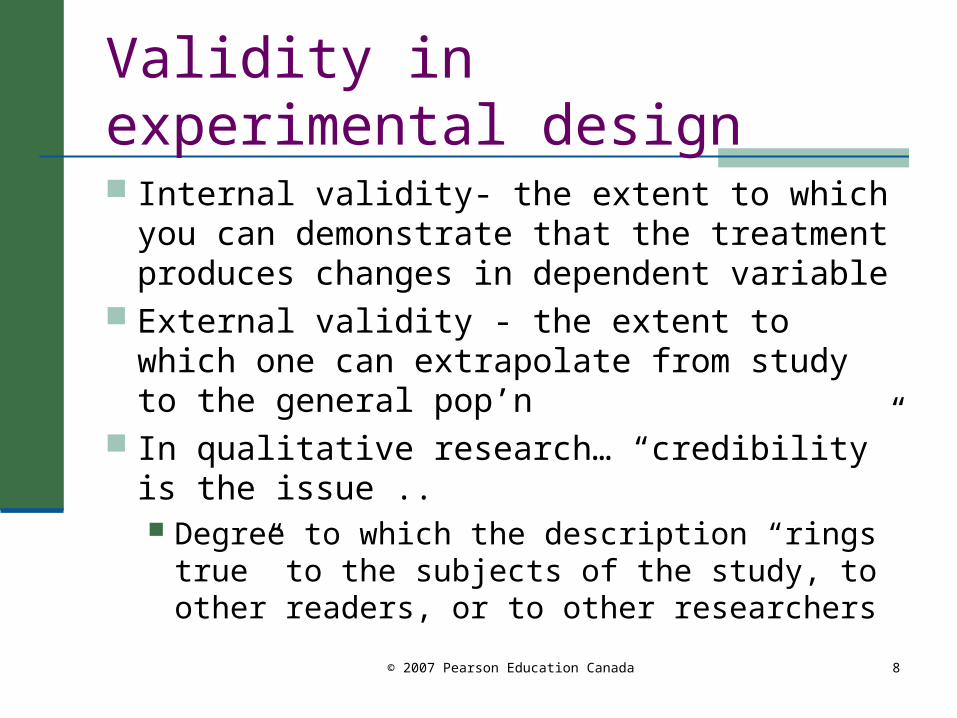
Validity in experimental design
Internal validity- the extent to which you can demonstrate that the treatment produces changes in dependent variable
External validity - the extent to which one can extrapolate from study to the general pop’n
In qualitative research… “credibility” is the issue .. Degree to which the description “rings true” to
the subjects of the study, to other readers, or to other researchers
9 © 2007 Pearson Education Canada
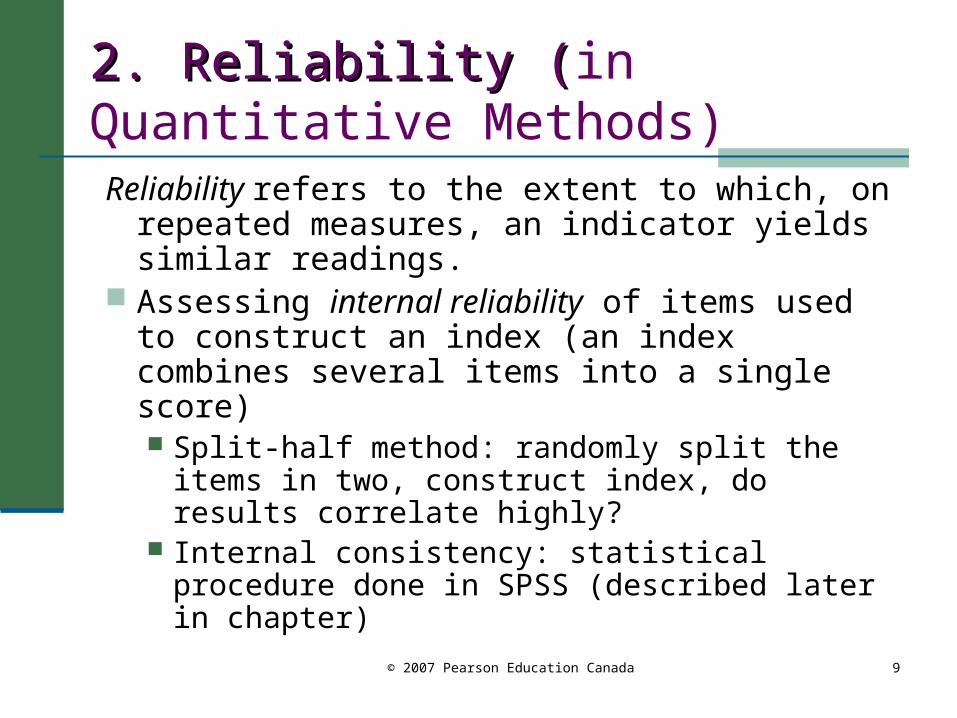
2. Reliability (2. Reliability (in Quantitative Methods)
Reliability refers to the extent to which, on repeated measures, an indicator yields similar readings.
Assessing internal reliability of items used to construct an index (an index combines several items into a single score) Split-half method: randomly split the items in
two, construct index, do results correlate highly?
Internal consistency: statistical procedure done in SPSS (described later in chapter)
10 © 2007 Pearson Education Canada
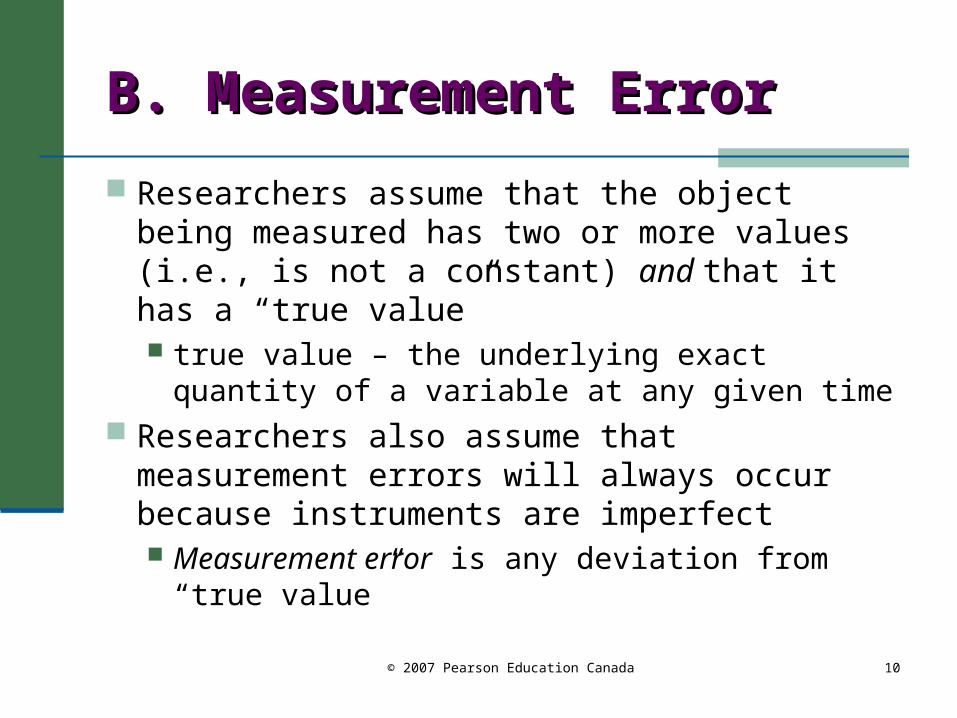
B. Measurement ErrorB. Measurement Error
Researchers assume that the object being measured has two or more values (i.e., is not a constant) and that it has a “true value” true value – the underlying exact quantity of a
variable at any given time Researchers also assume that measurement
errors will always occur because instruments are imperfect Measurement error is any deviation from “true
value”
11 © 2007 Pearson Education Canada
Measurement Error (Cont’d)
Measures are made up of the following components: MEASURE= true value +/- (SE+/-RE)
SE ~ Systematic error is non-random error that systematically over- or under-estimates a value (eg., systematically assigning the lowest value when a respondent does not answer)
RE ~ Random error is random fluctuations around the true value Not a problematic…should average out
12 © 2007 Pearson Education Canada
1. Tips for Reducing 1. Tips for Reducing Random and Systematic ErrorRandom and Systematic Error1. Take average of several measures
2. Use several different indicators
3. Use random sampling procedures
4. Use sensitive measures
5. Avoid confusion in wording of questions or instructions
6. Error-check data carefully
7. Reduce subject/experimenter expectations
13 © 2007 Pearson Education Canada
C. Levels of MeasurementC. Levels of Measurement
Introduced in Chapter 8; This chapter stresses the importance of level of measurement for measuring concepts Type of level of measurement influences
which statistical procedures one can use Three levels of measurement
1. Nominal
2. Ordinal
3. Ratio
14 © 2007 Pearson Education Canada
15 © 2007 Pearson Education Canada
D. The Effects of Reduced Levels D. The Effects of Reduced Levels of Measurementof Measurement
Best to achieve most precise, and highest, level of measurements possible
When lower levels are used, the results under-estimate the relative importance of a variable The greater the reduction in measurement
precision, the greater the drop in correlations between variable
Precisely measured variables will appear to be more important than poorly measured ones
16 © 2007 Pearson Education Canada
E. Indexes, Scales, and Special Measurement Procedures Combining several indicators into one score
results in an index or scale While used interchangeably, an index refers
to the combination of two or more indicators; a scale refers to a more complex combination of indicators where the pattern of responses is taken into account
Indexes are routinely constructed to reflect complex variables Socioeconomic status, job satisfaction, group
dynamics, social attitudes toward an issue
17 © 2007 Pearson Education Canada
1. Item Analysis1. Item Analysis
Items in an index should discriminate well Example of test item development
Test graded, students divided into upper and lower quartile
Examine performance on each question Select those questions that discriminate best
18 © 2007 Pearson Education Canada
Discrimination of ItemsDiscrimination of Items
FPO Table 13.1 Discrimination Ability of 100 Items: Percentage Correct for Each Item, by Quartile, from page 350
19 © 2007 Pearson Education Canada
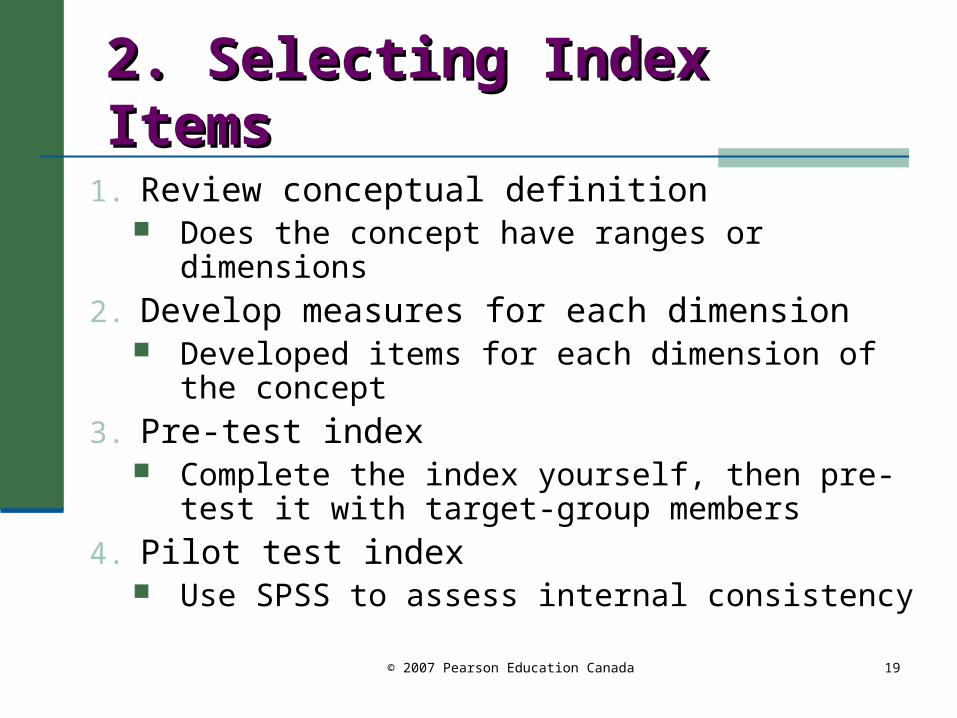
2. Selecting Index Items2. Selecting Index Items
1. Review conceptual definition Does the concept have ranges or dimensions
2. Develop measures for each dimension Developed items for each dimension of the
concept
3. Pre-test index Complete the index yourself, then pre-test it
with target-group members
4. Pilot test index Use SPSS to assess internal consistency
20 © 2007 Pearson Education Canada
3. The Rationale for Using Several Items in an Index
21 © 2007 Pearson Education Canada
4. Likert-based Indexes
22 © 2007 Pearson Education Canada
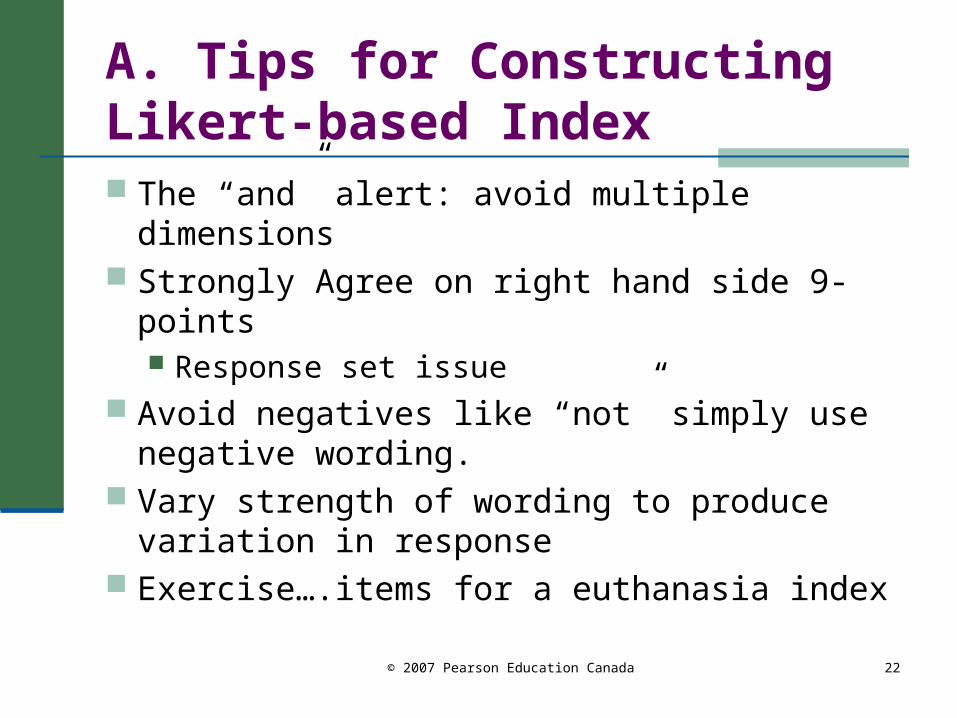
A. Tips for Constructing Likert-based Index The “and” alert: avoid multiple dimensions Strongly Agree on right hand side 9-points
Response set issue Avoid negatives like “not” simply use negative
wording. Vary strength of wording to produce variation
in response Exercise….items for a euthanasia index
23 © 2007 Pearson Education Canada
A. Tips for Constructing a Likert-based Index
24 © 2007 Pearson Education Canada
B. Evaluation of Likert-based Indexes
25 © 2007 Pearson Education Canada
C. Using the Internal Consistency Approach to Selecting Index Items
26 © 2007 Pearson Education Canada
5.5. Semantic Differential Procedures
A variety of anchors are used and people place themselves or others on a continuum: shy/outgoing; bookworm/social butterfly
Continued…
27 © 2007 Pearson Education Canada
5. Box 13.3
28 © 2007 Pearson Education Canada
6. Magnitude Estimation Procedures
subjects use numbers or line lengths to indicate perceptions. Very good for comparisons: yields ratio level measures. Comparing liking of teachers; seriousness of crimes; liking of one community compared to another one, etc.
29 © 2007 Pearson Education Canada
Tips for Using Magnitude Estimation Procedures
1. Only use ME when a researcher is present to explain the method to respondents
2. Use ME when comparative judgments sought
3. Use a stimulus category somewhere near the middle of the range you intend to use as a standard (avoid a standard too high or low)
4. After the standard established,