Embed Size (px)
Citation preview
1
CHAPTER
1The Business Case for Quality
The healthcare industry is finally awakening to the fact that we are far from perfection. Take for example these events in the early part of the new century:
Twins Thomas Boone and Zoe Grace Quaid nearly died in November 2007 at • Cedars-Sinai Hospital in Los Angeles when they were mistakenly given a massive overdose of heparin. Instead of using Hep-Lock, the highly diluted solution of the drug to maintain patency of an indwelling line, the twins instead received therapeu-tic heparin, which is 10 times more concentrated. Hemorrhaging from every possible site, the babies nearly exsanguinated before the error was discovered and action taken to correct the mistake. The infants are the children of actor Dennis Quaid and his wife Kimberly, who have set up a foundation to discover ways to prevent medical errors. 1 Three-year-old Sebastian Ferrero succumbed to a 10-fold overdose of arginine dur-• ing a test to evaluate human growth hormone deficiency at the University of Florida Pediatric Outpatient Clinic. Not only did Sebastian receive the overdose, but when his parents took him to the Shands Hospital emergency department with vomiting and seizures, they waited 4 hours for treatment. By the time a computed tomography (CT) was performed, Sebastian was near death, and after a misread CT the child was transferred to the intensive care unit brain dead. Sebastian’s parents, Horst and Luisa, received an $850,000 settlement, but they have begun a fund-raising campaign to build a new children’s hospital in Gainesville within the next 5 years. 2 Alyssa Shinn, a baby born prematurely to a mother who had undergone in vitro • fertilization, received a fatal overdose of zinc in her hyperalimentation solution, prepared by a part-time pharmacist at Summerlin Hospital in Las Vegas. 3 The error occurred because of multiple failures in the hospital pharmaceutical ordering system, including a failure of a pharmacy team to check the dose of zinc, which turned out to be 1,000 times the dose prescribed and reasonable for the baby. Multiple checks in the system failed, causing the lethal dose of zinc to be administered, resulting in the baby’s death. The error resulted in an undisclosed financial settlement between the hospital and the family.
64494_CH01_Print.indd 164494_CH01_Print.indd 1 10/6/09 2:51:38 PM10/6/09 2:51:38 PM
© Jones and Bartlett Publishers, LLC. NOT FOR SALE OR DISTRIBUTION.
2 CHAPTER 1 The Business Case for Quality
In addition to the estimated 98,000 deaths due to medical errors each year reported in the Institute of Medicine’s (IOM) landmark 1999 study, To Err Is Human: Building a Safer Health Care System , 4 the World Health Organization published statistics on estimated error rates in other countries as well. For example, the probability of patients suffering from an error in Australian hospitals is a distressing 16.6%, whereas in Denmark the rate is around 10%. Thus the risk of injury from medical error is not limited to the United States but is recognized as a worldwide problem. The World Health Organization (WHO) statistics indicate that stories of errors like those described above are repeated many times each year around the world. Many doctors, nurses, and other professionals are alarmed at these figures but are also concerned that the reports represent only the tip of the iceberg: Counted errors are almost always in hospital settings, leaving the outpatient setting, where the bulk of care in the United States is provided, largely unmonitored.
To counter this distressing reality, healthcare professionals have begun to adopt methods developed by the manufacturing and other service industries to reduce the frequency of mistakes that harm people who seek health care. The quality improve-ment approaches pioneered by Shewhart, Deming, Juran, Ohne, and many others are being applied to healthcare services, with increasing recognition that the provision of health services consists of linked, interdependent processes amenable to the same approaches for achieving safety and higher value that have been applied in other industries for decades.
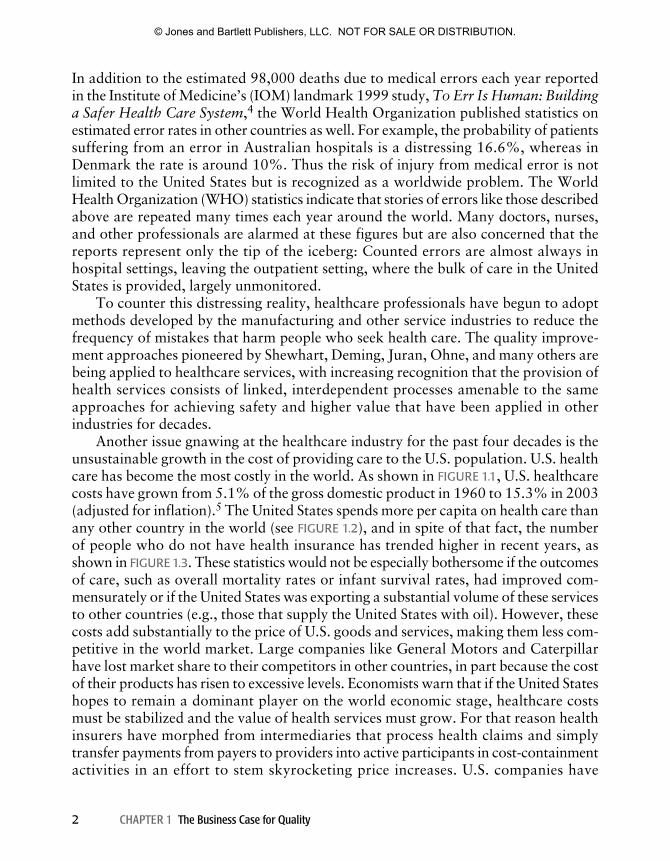
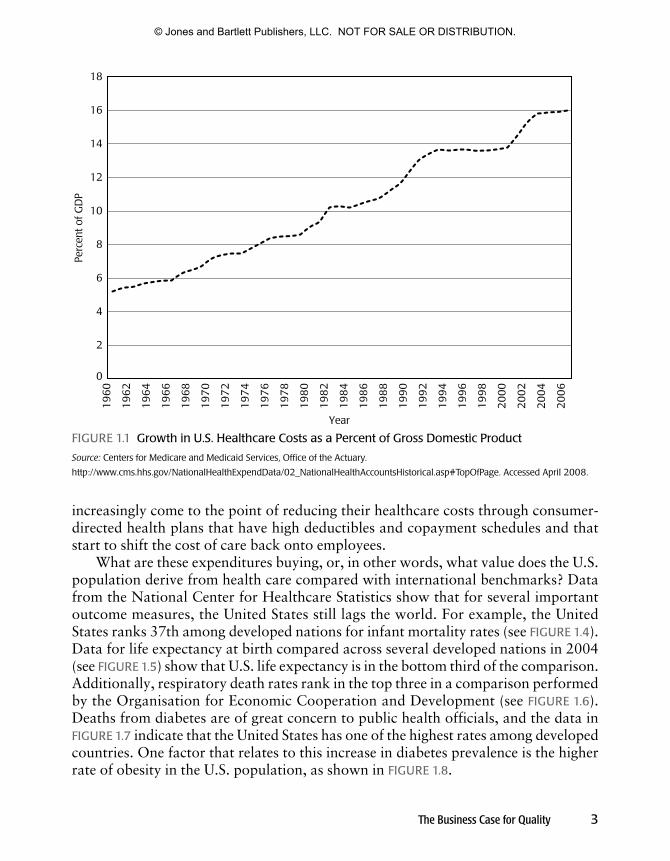
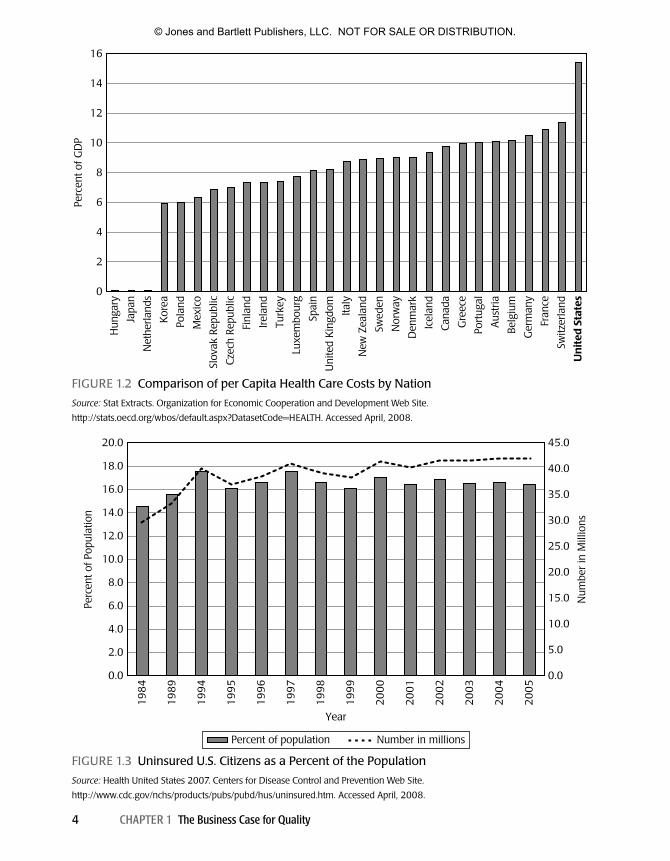
Another issue gnawing at the healthcare industry for the past four decades is the unsustainable growth in the cost of providing care to the U.S. population. U.S. health care has become the most costly in the world. As shown in FIGURE 1.1, U.S. healthcare costs have grown from 5.1% of the gross domestic product in 1960 to 15.3% in 2003 (adjusted for inflation). 5 The United States spends more per capita on health care than any other country in the world (see FIGURE 1.2), and in spite of that fact, the number of people who do not have health insurance has trended higher in recent years, as shown in FIGURE 1.3. These statistics would not be especially bothersome if the outcomes of care, such as overall mortality rates or infant survival rates, had improved com-mensurately or if the United States was exporting a substantial volume of these services to other countries (e.g., those that supply the United States with oil). However, these costs add substantially to the price of U.S. goods and services, making them less com-petitive in the world market. Large companies like General Motors and Caterpillar have lost market share to their competitors in other countries, in part because the cost of their products has risen to excessive levels. Economists warn that if the United States hopes to remain a dominant player on the world economic stage, healthcare costs must be stabilized and the value of health services must grow. For that reason health insurers have morphed from intermediaries that process health claims and simply transfer payments from payers to providers into active participants in cost-containment activities in an effort to stem skyrocketing price increases. U.S. companies have
64494_CH01_Print.indd 264494_CH01_Print.indd 2 10/6/09 2:51:38 PM10/6/09 2:51:38 PM
© Jones and Bartlett Publishers, LLC. NOT FOR SALE OR DISTRIBUTION.
The Business Case for Quality 3
0
19
60
19
62
19
64
19
66
19
68
19
70
19
72
19
74
19
76
19
78
Year
19
80
19
82
19
84
19
86
19
88
19
90
19
92
19
94
19
96
19
98
20
00
20
02
20
04
20
06
2
4
6
8
Perc
ent
of G
DP
10
12
14
16
18
FIGURE 1.1 Growth in U.S. Healthcare Costs as a Percent of Gross Domestic Product
Source: Centers for Medicare and Medicaid Services, Office of the Actuary.
http://www.cms.hhs.gov/NationalHealthExpendData/02_NationalHealthAccountsHistorical.asp#TopOfPage. Accessed April 2008.
increasingly come to the point of reducing their healthcare costs through consumer-directed health plans that have high deductibles and copayment schedules and that start to shift the cost of care back onto employees.
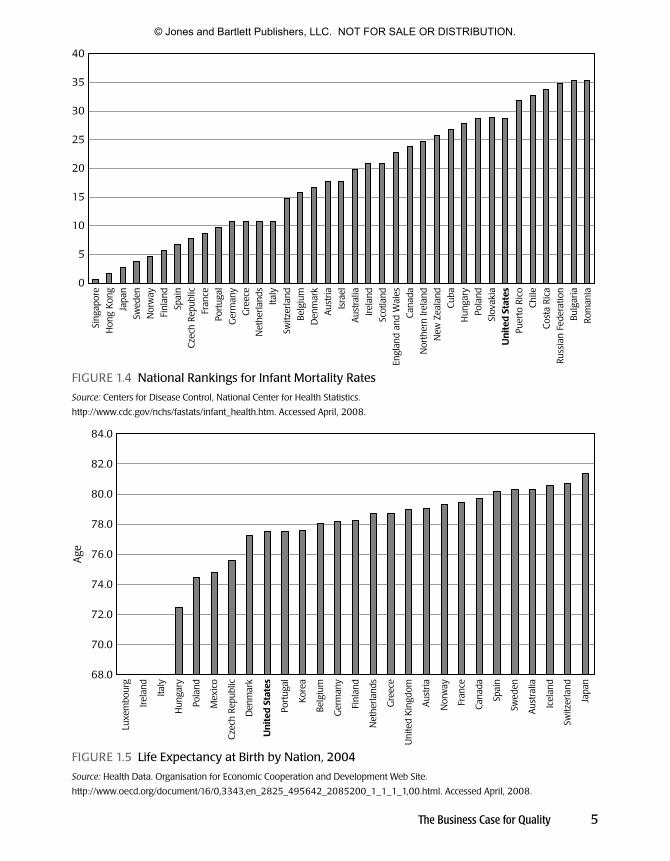
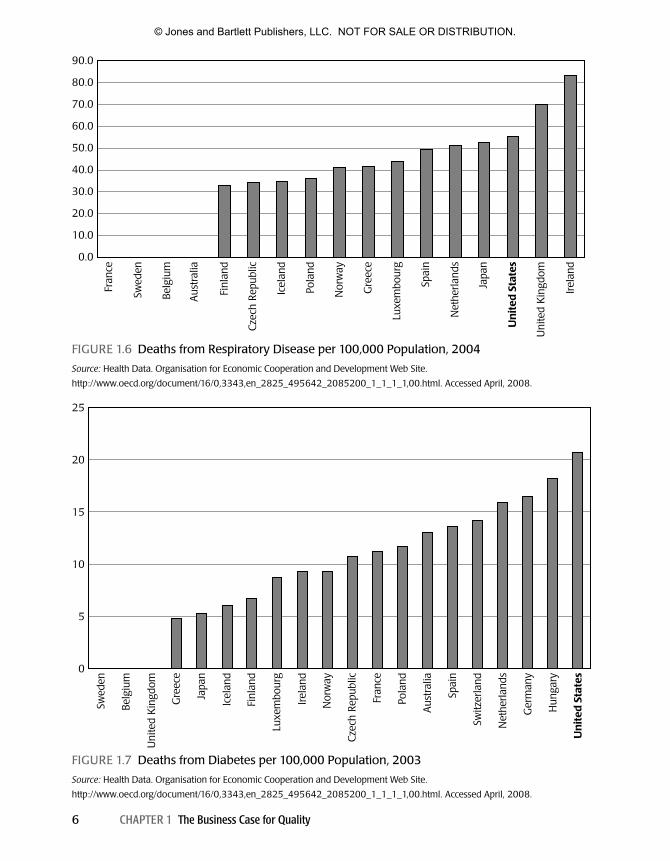
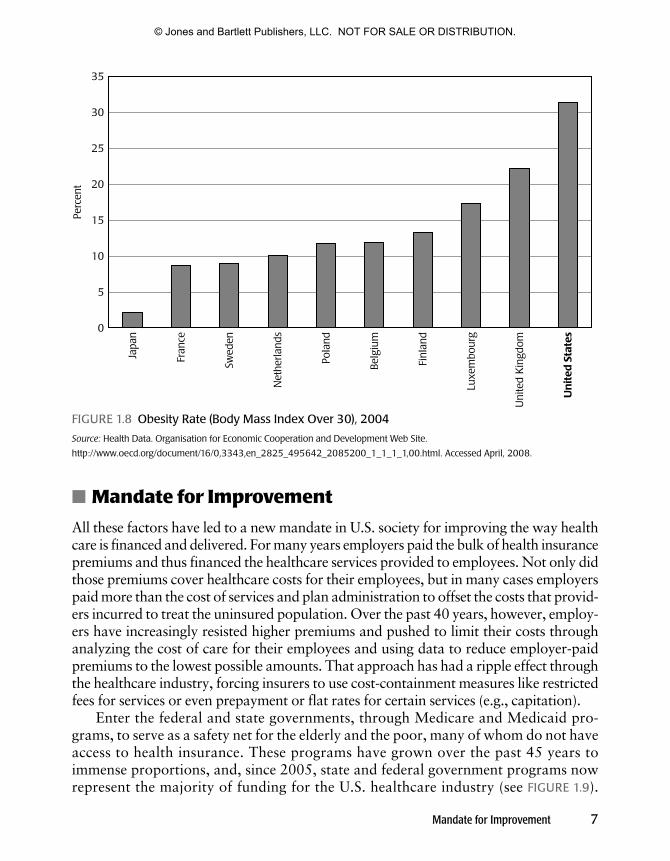
What are these expenditures buying, or, in other words, what value does the U.S. population derive from health care compared with international benchmarks? Data from the National Center for Healthcare Statistics show that for several important outcome measures, the United States still lags the world. For example, the United States ranks 37th among developed nations for infant mortality rates (see FIGURE 1.4). Data for life expectancy at birth compared across several developed nations in 2004 (see FIGURE 1.5) show that U.S. life expectancy is in the bottom third of the comparison. Additionally, respiratory death rates rank in the top three in a comparison performed by the Organisation for Economic Cooperation and Development (see FIGURE 1.6). Deaths from diabetes are of great concern to public health officials, and the data in FIGURE 1.7 indicate that the United States has one of the highest rates among developed countries. One factor that relates to this increase in diabetes prevalence is the higher rate of obesity in the U.S. population, as shown in FIGURE 1.8.
64494_CH01_Print.indd 364494_CH01_Print.indd 3 10/6/09 2:51:38 PM10/6/09 2:51:38 PM
© Jones and Bartlett Publishers, LLC. NOT FOR SALE OR DISTRIBUTION.
4 CHAPTER 1 The Business Case for Quality
19
84
0.0
2.0
4.0
6.0
8.0
10.0
12.0
14.0
16.0
18.0
20.0 45.0
0.0
5.0
10.0
Num
ber
in M
illio
ns
Perc
ent of
Pop
ulat
ion
15.0
20.0
25.0
30.0
35.0
40.0
19
89
19
94
19
95
19
96
19
97
19
98
19
99
20
00
20
01
20
02
20
03
20
04
20
05
Year
Percent of population Number in millions
FIGURE 1.3 Uninsured U.S. Citizens as a Percent of the Population
Source: Health United States 2007. Centers for Disease Control and Prevention Web Site.
http://www.cdc.gov/nchs/products/pubs/pubd/hus/uninsured.htm. Accessed April, 2008.
0
2
4
6Perc
ent of
GD
P
8
10
12
14
16
Belg
ium
Can
ada
Cze
ch R
epub
lic
Finl
and
Fran
ce
Ger
man
y
Hun
gary
Icel
and
Irel
and
Italy
Japa
n
Kor
ea
Luxe
mbo
urg
Mex
ico
Net
herlan
ds
New
Zea
land
Pola
nd
Aus
tria
Gre
ece
Port
ugal
Slov
ak R
epub
lic
Spai
n
Den
mar
k
Nor
way
Swed
en
Switz
erla
nd
Turk
ey
Uni
ted
Kin
gdom
Un
ited
Sta
tes
FIGURE 1.2 Comparison of per Capita Health Care Costs by Nation
Source: Stat Extracts. Organization for Economic Cooperation and Development Web Site.
http://stats.oecd.org/wbos/default.aspx?DatasetCode=HEALTH. Accessed April, 2008.
64494_CH01_Print.indd 464494_CH01_Print.indd 4 10/6/09 2:51:38 PM10/6/09 2:51:38 PM
© Jones and Bartlett Publishers, LLC. NOT FOR SALE OR DISTRIBUTION.
0
Sing
apor
e
Hon
g K
ong
Japa
n
Swed
en
Nor
way
Finl
and
Spai
n
Cze
ch R
epub
lic
Fran
ce
Port
ugal
Ger
man
y
Gre
ece
Italy
Net
herlan
ds
Switz
erla
nd
Belg
ium
Den
mar
k
Aus
tria
Isra
el
Aus
tral
ia
Irel
and
Scot
land
Engl
and
and
Wal
es
Can
ada
Nor
ther
n Irel
and
New
Zea
land
Cub
a
Hun
gary
Pola
nd
Slov
akia
Un
ited
Sta
tes
Puer
to R
ico
Chi
le
Cos
ta R
ica
Russ
ian
Fede
ratio
n
Bulg
aria
Rom
ania
5
10
15
20
25
30
35
40
FIGURE 1.4 National Rankings for Infant Mortality Rates
Source: Centers for Disease Control, National Center for Health Statistics.
http://www.cdc.gov/nchs/fastats/infant_health.htm. Accessed April, 2008.
68.0
70.0
72.0
74.0
76.0
78.0
Age
80.0
82.0
84.0
Pola
nd
Luxe
mbo
urg
Irel
and
Italy
Japa
n
Fran
ce
Swed
en
Net
herlan
ds
Belg
ium
Finl
and
Uni
ted
Kin
gdom
Gre
ece
Icel
and
Nor
way
Cze
ch R
epub
lic
Aus
tral
ia
Spai
n
Switz
erla
nd
Ger
man
y
Hun
gary
Aus
tria
Un
ited
Sta
tes
Port
ugal
Kor
ea
Can
ada
Den
mar
k
Mex
ico
FIGURE 1. 5 Life Expectancy at Birth by Nation, 2004
Source: Health Data. Organisation for Economic Cooperation and Development Web Site.
http://www.oecd.org/document/16/0,3343,en_2825_495642_2085200_1_1_1_1,00.html. Accessed April, 2008.
The Business Case for Quality 5
64494_CH01_Print.indd 564494_CH01_Print.indd 5 10/6/09 2:51:39 PM10/6/09 2:51:39 PM
© Jones and Bartlett Publishers, LLC. NOT FOR SALE OR DISTRIBUTION.
6 CHAPTER 1 The Business Case for Quality
0.0
10.0
20.0
30.0
40.0
50.0
60.0
70.0
80.0
90.0
Gre
ece
Fran
ce
Swed
en
Belg
ium
Aus
tral
ia
Japa
n
Net
herlan
ds
Pola
nd
Finl
and
Luxe
mbo
urg
Uni
ted
Kin
gdom
Irel
and
Un
ited
Sta
tes
Icel
and
Nor
way
Cze
ch R
epub
lic
Spai
n
FIGURE 1.6 Deaths from Respiratory Disease per 100,000 Population, 2004
Source: Health Data. Organisation for Economic Cooperation and Development Web Site.
http://www.oecd.org/document/16/0,3343,en_2825_495642_2085200_1_1_1_1,00.html. Accessed April, 2008.Fr
ance
Pola
nd
Cze
ch R
epub
lic
0
5
10
15
20
25
Finl
and
Japa
n
Swed
en
Belg
ium
Luxe
mbo
urg
Uni
ted
Kin
gdom
Gre
ece
Icel
and
Nor
way
Irel
and
Net
herlan
ds
Un
ited
Sta
tes
Aus
tral
ia
Spai
n
Switz
erla
nd
Ger
man
y
Hun
gary
FIGURE 1.7 Deaths from Diabetes per 100,000 Population, 2003
Source: Health Data. Organisation for Economic Cooperation and Development Web Site.
http://www.oecd.org/document/16/0,3343,en_2825_495642_2085200_1_1_1_1,00.html. Accessed April, 2008.
64494_CH01_Print.indd 664494_CH01_Print.indd 6 10/6/09 2:51:39 PM10/6/09 2:51:39 PM
© Jones and Bartlett Publishers, LLC. NOT FOR SALE OR DISTRIBUTION.
Mandate for Improvement 7
Mandate for Improvement ■
All these factors have led to a new mandate in U.S. society for improving the way health care is financed and delivered. For many years employers paid the bulk of health insurance premiums and thus financed the healthcare services provided to employees. Not only did those premiums cover healthcare costs for their employees, but in many cases employers paid more than the cost of services and plan administration to offset the costs that provid-ers incurred to treat the uninsured population. Over the past 40 years, however, employ-ers have increasingly resisted higher premiums and pushed to limit their costs through analyzing the cost of care for their employees and using data to reduce employer-paid premiums to the lowest possible amounts. That approach has had a ripple effect through the healthcare industry, forcing insurers to use cost-containment measures like restricted fees for services or even prepayment or flat rates for certain services (e.g., capitation).
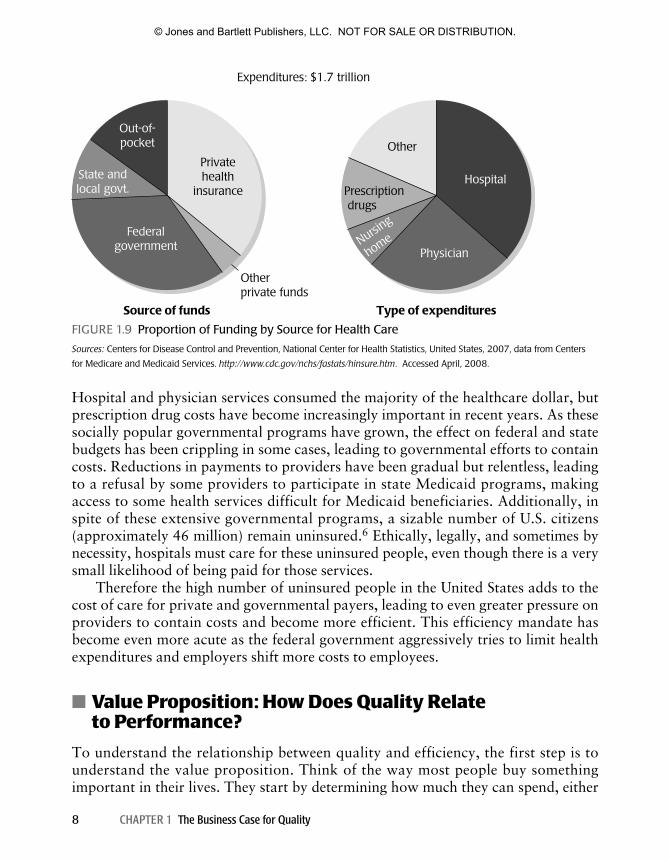
Enter the federal and state governments, through Medicare and Medicaid pro-grams, to serve as a safety net for the elderly and the poor, many of whom do not have access to health insurance. These programs have grown over the past 45 years to immense proportions, and, since 2005, state and federal government programs now represent the majority of funding for the U.S. healthcare industry (see FIGURE 1.9).
Japa
n
Fran
ce
Swed
en
Net
herlan
ds
Pola
nd
Belg
ium
Finl
and
Luxe
mbo
urg
Uni
ted
Kin
gdom
Un
ited
Sta
tes0
5
10
15Perc
ent 20
25
30
35
FIGURE 1.8 Obesity Rate (Body Mass Index Over 30), 2004
Source: Health Data. Organisation for Economic Cooperation and Development Web Site.
http://www.oecd.org/document/16/0,3343,en_2825_495642_2085200_1_1_1_1,00.html. Accessed April, 2008.
64494_CH01_Print.indd 764494_CH01_Print.indd 7 10/6/09 2:51:40 PM10/6/09 2:51:40 PM
© Jones and Bartlett Publishers, LLC. NOT FOR SALE OR DISTRIBUTION.
8 CHAPTER 1 The Business Case for Quality
Hospital and physician services consumed the majority of the healthcare dollar, but prescription drug costs have become increasingly important in recent years. As these socially popular governmental programs have grown, the effect on federal and state budgets has been crippling in some cases, leading to governmental efforts to contain costs. Reductions in payments to providers have been gradual but relentless, leading to a refusal by some providers to participate in state Medicaid programs, making access to some health services difficult for Medicaid beneficiaries. Additionally, in spite of these extensive governmental programs, a sizable number of U.S. citizens (approximately 46 million) remain uninsured. 6 Ethically, legally, and sometimes by necessity, hospitals must care for these uninsured people, even though there is a very small likelihood of being paid for those services.
Therefore the high number of uninsured people in the United States adds to the cost of care for private and governmental payers, leading to even greater pressure on providers to contain costs and become more efficient. This efficiency mandate has become even more acute as the federal government aggressively tries to limit health expenditures and employers shift more costs to employees.
Value Proposition: How Does Quality Relate ■to Performance?
To understand the relationship between quality and efficiency, the first step is to understand the value proposition. Think of the way most people buy something important in their lives. They start by determining how much they can spend, either
Expenditures: $1.7 trillion
Type of expenditures
Other
Hospital
PhysicianNursin
g
home
Prescription drugs
Source of funds
Federalgovernment
Privatehealth
insurance
Out-of-pocket
State andlocal govt.
Otherprivate funds
FIGURE 1.9 Proportion of Funding by Source for Health Care
Sources: Centers for Disease Control and Prevention, National Center for Health Statistics, United States, 2007, data from Centers
for Medicare and Medicaid Services. http://www.cdc.gov/nchs/fastats/hinsure.htm. Accessed April, 2008.
64494_CH01_Print.indd 864494_CH01_Print.indd 8 10/6/09 2:51:40 PM10/6/09 2:51:40 PM
© Jones and Bartlett Publishers, LLC. NOT FOR SALE OR DISTRIBUTION.
Value Proposition: How Does Quality Relate to Performance? 9
by figuring how much cash they can put together for the purchase or by how much debt they can support. Then, using that number, they optimize the purchase to get the best product or service available—that is, they shop. That process of optimizing quality within cost constraints produces the value proposition, which can be thought of mathematically as follows:
V a l u e = Q u a l i t y C o s t
This relationship fundamentally links a consumer’s perception of value directly to the quality of the good or service and inversely to the cost. In other words, purchasers look for the highest quality at the lowest cost to optimize value. The value proposition drives performance improvement across the business world, including health care, but until the past 10 to 15 years the numerator (quality) has been difficult to measure. In fact, many providers still argue that health services involve so much “art” that quality is difficult to quantify. In some cases that argument may be justified, but surrogates for precise metrics, such as patient satisfaction, are now frequently used to at least attempt to approximate the quality of health services. This approach has become acceptable to all but a minority of providers, and these types of measures are widely used in health care.
A key question, however, tries to characterize the relationship between quality improvement efforts and their associated costs and the benefits realized in organiza-tional performance. In short, does quality pay? Comprehensive studies in health care have not yet been done, but research performed in other industries indicates that quality improvement efforts do, indeed, generate a return on investment. Consider these examples:
• The Profit Impact of Market Strategy study performed by Bradley Gale and Robert Buzzell 7 collected business strategy and financial results from over 450 companies and 3,000 business units starting in 1972 and found that the most significant fac-tor in defining organizational success is quality. Companies that produce high-quality goods and services have a short-term advantage in premium pricing, which then leads to a long-term benefit through market share growth. These factors lead to greater profitability, providing greater customer loyalty and less vulnerability to penetration pricing by competitors that would erode margins.
• The federal General Accounting Office studied applicants for the Malcolm Baldrige National Quality Award (MBNQA) in 1991. 8 The Baldrige Award honors organizations that demonstrate superior performance in seven categories of per-formance: (1) leadership; (2) strategic planning; (3) customer and market focus; (4) measurement, analysis, and knowledge management; (5) workforce focus; (6) process management; and (7) results. This prestigious award requires a rigorous application and review process, culminating in a site visit for a select few organi-zations before their being chosen as award recipients. (The Baldrige Award is
64494_CH01_Print.indd 964494_CH01_Print.indd 9 10/6/09 2:51:40 PM10/6/09 2:51:40 PM
© Jones and Bartlett Publishers, LLC. NOT FOR SALE OR DISTRIBUTION.
10 CHAPTER 1 The Business Case for Quality
examined in more depth in Chapter 8.) At the request of Congress, the 1991 General Accounting Office study evaluated 20 Baldrige applicants that had moved to a site visit to determine the impact of formal total quality management practices on performance. The study reported that companies that had implemented total quality management practices had better employee relations, greater productivity, higher market share, and improved profitability due to greater customer satisfac-tion and loyalty.
• The Baldrige Index, a hypothetical index of stock prices of publicly traded Baldrige Award recipients that has been tracked by the MBNQA program since 1995, 9 has been compared with the Standard & Poor’s 500 Index (S&P 500) since its incep-tion. In 8 of 10 years, the Baldrige Index’s annual percentage increase outperformed the S&P 500 by a substantial margin, often by a factor of three to four times the S&P 500.
• A study by Easton and Jarrell 10 reported in the text by Stahl, sampled 108 firms for the impact of total quality management on corporate financial performance and stock return over a 5-year period after deployment of total quality manage-ment programs. The authors reported that improved performance was consistent among these organizations for both accounting-based indicators and return on equity. The study used an interview approach that helped characterize the com-panies’ quality improvement systems into those that were more advanced and contrasted the results with those that were not as sophisticated, and this analysis demonstrated that level of performance was directly related to the individual firm’s commitment to the quality approach and the degree of implementation of the quality system.
• Hendricks and Singhal used a surrogate measure for quality program implementa-tion: the winning of quality awards. 11 These researchers reasoned that those com-panies that actually received awards for quality management should demonstrate higher market value. They published the results of a study in 2001 that validated a 38% to 46% better average performance of stock prices compared with control groups. Another study by this research team showed that operating income among award-winning firms was 79% higher than for control groups and they showed a 43% higher improvement in sales revenues. 12
Comprehensive studies have not yet been published for the healthcare industry, but Baldrige Award recipients in the healthcare category have reported exceptional performance that they attribute to their efforts in continually improving performance. For example, SSM Health Care has increased market share in St. Louis to 18% in the 3-year period after receiving the Baldrige Award. Additionally, SSM’s financial per-formance has earned an AA investment rating, placing them in the upper 1% of all hospitals in the United States. Kansas City’s Saint Luke’s Hospital system, a 2003 Baldrige recipient, was ranked 35th out of 4,500 U.S. hospitals in the 2002 Consumer’s Checkbook. A review of the applications of these and other Baldrige recipients reveals
64494_CH01_Print.indd 1064494_CH01_Print.indd 10 10/6/09 2:51:40 PM10/6/09 2:51:40 PM
© Jones and Bartlett Publishers, LLC. NOT FOR SALE OR DISTRIBUTION.
How Do Organizations Measure the Value Proposition? 11
a number of performance zeniths in areas such as the Centers for Medicare and Medicaid Services (CMS) performance metrics and the Joint Commission’s ORYX and core measures. Senior leaders at these organizations attribute superior results to establishment and maintenance of improvement processes and systems.
How Do Organizations Measure the ■Value Proposition?
Both the numerator and denominator must be measured to demonstrate value. Both quality and cost present major challenges for healthcare organizations. The IOM defines quality as “the degree to which health services for individuals and populations increase the likelihood of desired health outcomes and are consistent with current professional knowledge.” 13 Additionally, the IOM set six standards to be achieved by the healthcare industry for ensuring that the definition was met by the industry’s services:
1. Safe: The IOM states that patient safety is not solely about ensuring that systems are designed and monitored to prevent failure of a procedure or process or the use of the wrong intervention (e.g., wrong medication or test) to achieve a diagnostic or therapeutic goal. Safe care ensures correct diagnoses, avoidance of unnecessary risks, and ensuring that patients are completely informed (informed consent) about the nature of diagnostic and therapeutic interventions and their attendant risks. One important element of the informed consent pro-cess is to understand the patient’s cultural milieu, ensuring that communications are conducted in a way that a patient and caretakers can understand. More effective communication through the use of cultural training and use of inter-preters can improve safety by enhancing diagnostic accuracy, reducing exposure to unnecessary risks due to a provider misunderstanding a patient’s history or physical findings, and allowing patients to participate in clinical decisions regarding their care by being truly well-informed partners in the care process.
2. Effective: The IOM’s landmark work, Crossing the Quality Chasm, emphasizes the importance of using evidence-based guidelines to provide high-quality care. This approach to care, often called “evidence-based practice,” incorporates the most current valid research evidence into decision making and combines these clinical guides with clinical experience and, importantly, patient values. This approach also reinforces the need for the provider to be culturally competent, as described under the safety principle, but it also calls on the system of care to better understand the disparities in health needs and programs of care based on ethnic and racial differences. This cultural competence, which encompasses both clinical and system capabilities, is one key factor in ensuring that care is effective. In addition to cultural competence, though, the systems of care
64494_CH01_Print.indd 1164494_CH01_Print.indd 11 10/6/09 2:51:40 PM10/6/09 2:51:40 PM
© Jones and Bartlett Publishers, LLC. NOT FOR SALE OR DISTRIBUTION.
12 CHAPTER 1 The Business Case for Quality
(e.g., availability of supplies, lack of wasted resources in processes, adequate staffing, and high-performing capital equipment) also must be optimized to gain the efficiency in care that will ensure effectiveness of health services.
3. Patient-centered: Crossing the Quality Chasm states that compassion, empa-thy, and responsiveness to the needs, values, and expressed preferences of the individual patient are the hallmarks of patient-centeredness. Many would agree that these attitudes and skills are also central to clinical cultural competence.
4. Timely: A timely system prevents customers from experiencing harmful delays in receiving needed diagnostic or therapeutic interventions. One of the major complaints of health system clients is the wait time for procedures or for interaction with a medical professional. Language barriers may contribute to increased length of stay in the hospital or longer wait times in an emergency department. Systemic cultural competence could thus improve the timeliness and efficiency of a system by getting patients the services that are appropriate in an expeditious fashion.
5. Efficient: Business efficiency is always balanced with effectiveness as an organization is examining performance. Nearly any manager can achieve 100% effectiveness at unlimited cost, but optimizing the interaction between the two parameters requires maximizing quality and eliminating waste. A great deal of later chapters is devoted to reduction in waste, particularly in the lean sense of eliminating the “seven deadly wastes” (discussed in Chapter 6). However, one of the most difficult tasks for contemporary healthcare manag-ers is reducing or eradicating waste while maintaining quality and operational effectiveness.
6. Equitable: Crossing the Quality Chasm states that a system exhibits high qual-ity if it provides care that does not vary because of personal characteristics such as gender, ethnicity, geographic location, and socioeconomic status. Systemic cultural competence, which entails processes to monitor the quality of care and detect disparities by stratifying measures by race/ethnicity, must be at the foun-dation of targeted quality improvement activities. Ignoring the differences in any population based on these characteristics inevitably leads to inequity, inefficiency, and reduced effectiveness. Many healthcare systems now have special programs to deal with cultural diversity as a way of addressing this important factor.
Thus the stage has been set for organizations to measure the elements of the value proposition, and many accrediting and certification bodies have worked to gain pre-eminence in the field through efforts to establish standard, system-wide metrics. For example, the CMS has put forward a number of measures that are used in its continu-ing effort to ensure quality care for Medicare and Medicaid beneficiaries. The current measures are listed in Appendix 1.1, and updates are published on the CMS website (www.cms.gov).
64494_CH01_Print.indd 1264494_CH01_Print.indd 12 10/6/09 2:51:40 PM10/6/09 2:51:40 PM
© Jones and Bartlett Publishers, LLC. NOT FOR SALE OR DISTRIBUTION.
Measurement Is the Key to Performance Incentives 13
Measurement Is the Key to Performance Incentives ■
Healthcare reimbursement programs have undergone tremendous changes in the past 50 years. Shortly after Medicare became a reality, hospitals were paid fees according to “cost-based reimbursement,” which led to tremendous increases in the cost of care, because providers had little incentive to reduce or avoid unnecessary expenditures. In the 1970s the diagnosis-related group (DRG) concept was devised as a new method for paying hospitals, which at least promoted some efficiency in hospitals. Under the DRG payment system, hospitals were paid a fixed amount for each DRG, which was a statistically created grouping of diagnoses that were related based on an analysis performed by a research group at Yale University in the 1970s. This method of payment was used initially by Medicare starting in the 1980s but has since been adopted in some manner by many other payers. Capitation, another major payment scheme initiated about the same time, has not survived as well as has the DRG system. Capitation payment involves paying a fixed amount per individual being treated for a fixed basket of services. So, for example, a primary care provider might receive a capitation payment of $10 per member per month to provide all of an individual’s primary care, including office visits, tests, and inpatient services that the provider renders if the person is admitted to the hospital. Thus the payer’s risk is reduced, but if a beneficiary requires more than just the routine level of care, the provider may lose money on that individual. In theory, capitation arrangements are much like “mini-insurance plans” in which provider costs are spread across a population of people so that providers must consider the entire population that is capitated, rather than just an individual, and determine if the total payments offset the total costs.
Many providers had problems with capitation, because use of medical services can be unpredictable in any group of people, more so with small populations. Therefore the experiment with prospective payment did not fare well in general, and other approaches to motivating providers to become more efficient became necessary. As before, the Medicare program led the industry and in 2005 initiated a pay for perfor-mance (P4P) program for physician practices that uses the results of quality metrics to set amounts of incentive payments for Medicare providers who achieve certain levels on these metrics. Private insurers quickly followed suit, and providers are now being deluged with these programs. The concept of P4P has now become an industry standard and likely will persist into the future. The approach has only a short history at the present time, and so results are yet to be determined. 14,15
Medicare’s P4P approach bases incentives on quality measures, but many com-mercial insurers include cost and volume measures in the incentive program as well. By combining the cost and quality measures, insurers seem to be addressing the value proposition more completely, but in many cases these payers often emphasize the cost metrics over those designed to measure quality. 16 When the factors of the value prop-osition are not balanced, customer value is not optimized, leading to dissatisfaction
64494_CH01_Print.indd 1364494_CH01_Print.indd 13 10/6/09 2:51:41 PM10/6/09 2:51:41 PM
© Jones and Bartlett Publishers, LLC. NOT FOR SALE OR DISTRIBUTION.
14 CHAPTER 1 The Business Case for Quality
and loss of the customer’s patronage. Healthcare customers can have interesting views from the standpoint of their understanding of quality. Studies have shown that health-care customers value time with the physician, indications of a physician’s interest in them as individuals, and shorter wait times, 17,18 whereas payers are interested in performance on measures such as prescription of a beta-blocker after a heart attack or use of an angiotensin-converting enzyme inhibitor in congestive heart failure. This disconnection between the actual customer of services and those who pay for services has added increased complexity to the value proposition, and providers often have difficulty serving these occasionally conflicting requirements. Although some states and payers have made provider clinical performance information available via the Internet, 19–21 most consumers still use word-of-mouth referrals from friends or from their own physician to select a provider for healthcare services. 22 However, a combi-nation of improved public knowledge of provider measures and use of metrics that are more easily understood and applicable to individual consumers should begin to make these publicly available data useful for customers making decisions about their health care.
The increasing use of these types of metrics has provided the momentum of change for implementing advanced performance improvement approaches like the Toyota Production System (lean processing), six sigma, and the relatively new combined approach, lean six sigma. These newer methods have enhanced efforts by healthcare institutions to make quantum leaps in efficiency and effectiveness and to improve value for customers, payers, and accreditation agencies. Because lean six sigma has just started to create value in the healthcare marketplace, quality improvement staff members are learning a new vocabulary of performance enhancement but are also demonstrating increased value to the organization as well.
The Marketplace Wins in the End ■
Although many forces are at work in the healthcare industry presently, in the end consumers determine the structure of the system in the future. The growth of consumer-determined health plans places far more economic leverage in the hands of individuals, and the use of P4P programs to improve efficiency and effectiveness will exert the greatest influence over the industry. Alternative and complementary approaches to health have become reimbursable by some payers, changing the demand profile for traditional medical services, and a competitive marketplace has changed the philo-sophical underpinnings of health professions. The business case for quality has never been stronger, as consumers will apply the value proposition to health purchases just as they do for other professional services, leading to higher quality at lower costs. At no time in the history of U.S. health care has the need for improving the quality of care been more compelling. The subject of this book includes approaches such as lean six sigma and other methods, but in the end quality practitioners must remember the
64494_CH01_Print.indd 1464494_CH01_Print.indd 14 10/6/09 2:51:41 PM10/6/09 2:51:41 PM
© Jones and Bartlett Publishers, LLC. NOT FOR SALE OR DISTRIBUTION.
References 15
underlying force behind these efforts—the consumer, the client, the customer—what we call patients.
Discussion Questions ■
1. The risk of medical errors has been estimated to cause 98,000 unnecessary deaths in the hospital each year. Do you believe the risk of medical care in ambulatory settings is the same, greater, or less? Why?
2. Discuss the reasons for healthcare costs being higher per capita in the United States than in any other country. Will the upward trend continue or decline? Why?
3. Medicare and Medicaid have traditionally been leaders in designing and imple-menting cost containment and quality initiatives in the healthcare industry. What are the reasons for this leadership? Name one approach pioneered by Medicare for reducing the cost of care.
4. Describe the value proposition. How does it apply to your life? 5. What are the six standards of quality health care defined by the Institute of
Medicine? Explain one of the standards and give examples. 6. What is pay for performance? How should the approach influence the quality
and cost of healthcare services?
References ■
Hernandez G. Quaid fights common medical errors. 1. Los Angeles Daily News. Retrieved March 2008 from http://www.dailynews.com/news/ci_8579598 Word R. Parents of Florida boy killed by hospital error hope to prevent similar accidents. 2. Associated Press. Retrieved March 2008 from http://www.nctimes.com/articles/2008/03/16/health/ 9_56_273_15_08 “Deadly Dose,” ABC News. Retrieved March 2008 from http://abcnews.go.com/Video/3. playerIndex?id=4308939 Institute of Medicine. 4. To Err Is Human: Building a Safer Health Care System . Retrieved March 2008 from http://www.iom.edu/CMS/8089/5575.aspx Assistant Secretary for Planning and Evaluation, U.S. Department of Health and Human Services. 5. ASPE Issue Briefings: Long-term growth of medical expenditures—Public and private, May 2005. Retrieved April 2008 from http://aspe.hhs.gov/health/MedicalExpenditures/index.shtml Center on Policy and Budget Priorities. Poverty and share of americans without health insurance 6. were higher in 2007—and median income for working-age households was lower—than at the bottom of last recession. Retrieved June 2009 from http://www.cbpp.org/cms/?fa=view&id=621 Buzzell RD, Gale BT. 7. The PIMS Principles: Linking Strategy to Performance. New York: The Free Press; 1987. U.S. General Accounting Office (GAO/NSIAD-91-190). 8. Management Practices: U.S. Companies Improve Performance Through Quality. Washington, DC: U.S. General Accounting Office; 1994. Malcolm Baldrige Index. Retrieved March 2008 from http://www.baldrige.gov 9.
64494_CH01_Print.indd 1564494_CH01_Print.indd 15 10/6/09 2:51:41 PM10/6/09 2:51:41 PM
© Jones and Bartlett Publishers, LLC. NOT FOR SALE OR DISTRIBUTION.
16 CHAPTER 1 The Business Case for Quality
Easton GS, Jarrell SL. The emerging academic research on the link between total quality manage-10. ment and corporate financial performance: A critical review. In Stahl MJ, ed. Perspectives in Total Quality. Malden, MA: Blackwell, in association with ASQ Quality Press; 1999. Hendricks KB, Singhal VR. The long run stock performance of firms with effective TQM programs. 11. Management Science. 2001; 47: 359–368. Hendricks KB, Singhal VR. Does implementing an effective TQM program actually improve oper-12. ating performance? Empirical evidence from firms that have won quality awards. Management Science. 1997; 43: 1258–1274. Institute of Medicine. 13. Crossing the Quality Chasm. Retrieved March 2008 from http://www.iom.edu/CMS/8089.aspx Stulberg J. The physician quality reporting initiative—A gateway to pay for performance: What 14. every health care professional should know. Quality Management in Health Care. 2008; 17: 2–8. Hagland M. The long run. As the P4P race continues, providers integrate EBM with data-gathering 15. systems to cross the finish line. Healthcare Informatics. 2007; 24: 36–39. Green J. Pay for performance: Quality and cost control go arm in arm. 16. Trustee. 2006; 59: 6–11. Pines JM, Garson C, Baxt WG, Rhodes KV, Shofer FS, Hollander JE. ED crowding is associated with 17. variable perceptions of care compromise. Academy of Emergency Medicine. 2007; 14: 1176–1181. Kong MC, Camacho FT, Feldman SR, Anderson RT, Balkrishnan R. Correlates of patient satisfac-18. tion with physician visit: Differences between elderly and non-elderly survey respondents. Health Quality and Life Outcomes. 2007; 24: 62. Gearon CJ. State-by-state guide to health care provider performance. Retrieved April 2008 from 19. http://www.aarp.org/health/doctors/articles/statebystate_guide_healthcare_provider_performance.html HealthGrades physician evaluation website. Retrieved April 2008 from http://www.healthgrades.com 20. Integrated Health Care Association. Physician group clinical care report card. Retrieved April 2008 21. from http://iha.ncqa.org/reportcard Wynne S, Wells R. Hospital quality report cards: Ready for prime time? Retrieved April 2008 from 22. http://jdc.jefferson.edu/cgi/viewcontent.cgi?article=1451&context=hpn
Additional Resources ■
Bodenheimer T, Grumbach K. Understanding Health Policy. New York: McGraw-Hill; 2005. Institute of Medicine. Crossing the Quality Chasm: A New Health System for the 21st Century .
Washington, DC: National Academy Press; 2001. Kohn L, Donaldson M, Corrigan J, eds. To Err Is Human: Building a Safer Health System . Washington,
DC: National Academy Press; 2000.
64494_CH01_Print.indd 1664494_CH01_Print.indd 16 10/6/09 2:51:41 PM10/6/09 2:51:41 PM
© Jones and Bartlett Publishers, LLC. NOT FOR SALE OR DISTRIBUTION.
Appendix 1.1 17
Appendix 1.1 ■
CMS Physicians Quality Reporting Initiative ( PQRI) Measures
Please note: Gaps in measure numbering reflect retired 2007 and 2008 PQRI measures that were not included in the 2009 PQRI.
1. Hemoglobin A1c Poor Control in Type 1 or 2 Diabetes Mellitus Description: Percentage of patients aged 18 through 75 years with diabetes mellitus who had most recent hemoglobin A1c greater than 9.0%
2. Low Density Lipoprotein Control in Type 1 or 2 Diabetes Mellitus Description: Percentage of patients aged 18 through 75 years with diabetes mellitus who had most recent LDL-C level in control (less than 100 mg/dl)
3. High Blood Pressure Control in Type 1 or 2 Diabetes Mellitus Description: Percentage of patients aged 18 through 75 years with diabetes mellitus who had most recent blood pressure in control (less than 140/80 mmHg)
4. Screening for Future Fall Risk Description: Percentage of patients aged 65 years and older who were screened for future fall risk (patients are considered at risk for future falls if they have had 2 or more falls in the past year or any fall with injury in the past year) at least once within 12 months
5. Heart Failure: Angiotensin-Converting Enzyme (ACE) Inhibitor or Angiotensin Receptor Blocker (ARB) Therapy for Left Ventricular Systolic Dysfunction (LVSD) Description: Percentage of patients aged 18 years and older with a diagnosis of heart failure and left ventricular systolic dysfunction (LVSD) who were prescribed ACE inhibitor or ARB therapy
6. Oral Antiplatelet Therapy Prescribed for Patients with Coronary Artery Disease Description: Percentage of patients aged 18 years and older with a diagnosis of coronary artery disease who were prescribed oral antiplatelet therapy
7. Beta-blocker Therapy for Coronary Artery Disease Patients with Prior Myocardial Infarction (MI) Description: Percentage of patients aged 18 years and older with a diagnosis of coronary artery disease and prior myocardial infarction (MI) who were prescribed beta-blocker therapy
64494_CH01_Print.indd 1764494_CH01_Print.indd 17 10/6/09 2:51:41 PM10/6/09 2:51:41 PM
© Jones and Bartlett Publishers, LLC. NOT FOR SALE OR DISTRIBUTION.
18 CHAPTER 1 The Business Case for Quality
8. Heart Failure: Beta-blocker Therapy for Left Ventricular Systolic Dysfunction Description: Percentage of patients aged 18 years and older with a diagnosis of heart failure who also have left ventricular systolic dysfunction (LVSD) and who were prescribed beta blocker therapy
9. Antidepressant Medication During Acute Phase for Patients with New Episode of Major Depression Description: Percentage of patients aged 18 years and older diagnosed with new episode of major depressive disorder (MDD) and documented as treated with anti-depressant medication during the entire 84-day (12 week) acute treatment phase
10. Stroke and Stroke Rehabilitation: Computed Tomography (CT) or Magnetic Resonance Imaging (MRI) Reports Description: Percentage of final reports for CT or MRI studies of the brain performed within 24 hours of arrival to the hospital for patients aged 18 years and older with either a diagnosis of ischemic stroke or transient ischemic attack (TIA) or intracranial hemorrhage or at least one documented symptom consistent with ischemic stroke or TIA or intracranial hemorrhage that includes documen-tation of the presence or absence of each of the following: hemorrhage and mass lesion and acute infarction
11. Stroke and Stroke Rehabilitation: Carotid Imaging Reports Description: Percentage of final reports for carotid imaging studies (neck MR angiography [MRA], neck CT angiography [CTA], neck duplex ultrasound, carotid angiogram) performed for patients aged 18 years and older with the diagnosis of ischemic stroke or transient ischemic attack (TIA) that include direct or indirect reference to measurements of distal internal carotid diameter as the denominator for stenosis measurement
12. Primary Open Angle Glaucoma: Optic Nerve Evaluation Description: Percentage of patients aged 18 years and older with a diagnosis of primary open-angle glaucoma (POAG) who have an optic nerve head evaluation during one or more office visits within 12 months
13. Age-Related Macular Degeneration: Dilated Macular Examination Description: Percentage of patients aged 50 years and older with a diagnosis of age-related macular degeneration who had a dilated macular examination per-formed which included documentation of the presence or absence of macular thickening or hemorrhage AND the level of macular degeneration severity during one or more office visits within 12 months
14. Diabetic Retinopathy: Documentation of Presence or Absence of Macular Edema and Level of Severity of Retinopathy Description: Percentage of patients aged 18 years and older with a diagnosis of diabetic retinopathy who had a dilated macular or fundus exam performed which
64494_CH01_Print.indd 1864494_CH01_Print.indd 18 10/6/09 2:51:41 PM10/6/09 2:51:41 PM
© Jones and Bartlett Publishers, LLC. NOT FOR SALE OR DISTRIBUTION.
Appendix 1.1 19
included documentation of the level of severity of retinopathy and the presence or absence of macular edema during one or more office visits within 12 months
15. Diabetic Retinopathy: Communication with the Physician Managing Ongoing Diabetes Care Description: Percentage of patients aged 18 years and older with a diagnosis of diabetic retinopathy who had a dilated macular or fundus exam performed with documented communication to the physician who manages the ongoing care of the patient with diabetes mellitus regarding the findings of the macular or fundus exam at least once within 12 months
16 . Perioperative Care: Timing of Antibiotic Prophylaxis—Ordering Physician Description: Percentage of surgical patients aged 18 years and older undergoing procedures with the indications for prophylactic parenteral antibiotics, who have an order for prophylactic antibiotic to be given within one hour (if fluo-roquinolone or vancomycin, two hours), prior to the surgical incision (or start of procedure when no incision is required)
17. Perioperative Care: Selection of Prophylactic Antibiotic—First OR Second Generation Cephalosporin Description: Percentage of surgical patients aged 18 years and older undergoing procedures with the indications for a first OR second generation cephalosporin prophylactic antibiotic, who had an order for cefazolin OR cefuroxime for antimicrobial prophylaxis
18. Perioperative Care: Discontinuation of Prophylactic Antibiotics (Non-Cardiac Procedures) Description: Percentage of non-cardiac surgical patients aged 18 years and older undergoing procedures with the indications for prophylactic antibiotics AND who received a prophylactic antibiotic, who have an order for discontinuation of prophylactic antibiotics within 24 hours of surgical end time
19. Perioperative Care: Venous Thromboembolism (VTE) Prophylaxis (When Indicated in ALL Patients) Description: Percentage of patients aged 18 years and older undergoing proce-dures for which VTE prophylaxis is indicated in all patients, who had an order for Low Molecular Weight Heparin (LMWH), Low-Dose Unfractionated Heparin (LDUH), adjusted-dose warfarin, fondaparinux or mechanical pro-phylaxis to be given within 24 hours prior to incision time or within 24 hours after surgery end time
20. Osteoporosis: Communication with the Physician Managing Ongoing Care Post-Fracture Description: Percentage of patients aged 50 years and older treated for a hip, spine, or distal radial fracture with documentation of communication with the
64494_CH01_Print.indd 1964494_CH01_Print.indd 19 10/6/09 2:51:41 PM10/6/09 2:51:41 PM
© Jones and Bartlett Publishers, LLC. NOT FOR SALE OR DISTRIBUTION.
20 CHAPTER 1 The Business Case for Quality
physician managing the patient’s on-going care that a fracture occurred and that the patient was or should be tested or treated for osteoporosis
21. Aspirin at Arrival for Acute Myocardial Infarction (AMI) Description: Percentage of patients, regardless of age, with an emergency department discharge diagnosis of AMI who had documentation of receiving aspirin within 24 hours before emergency department arrival or during emer-gency department stay
22. Perioperative Care: Timing of Prophylactic Antibiotics—Administering Physician Description: Percentage of surgical patients aged 18 and older who have an order for a parenteral antibiotic to be given within one hour (if fluoroquinolone or vancomycin, two hours) prior to the surgical incision (or start of procedure when no incision is required) for whom administration of prophylactic antibiotic has been initiated within one hour (if fluoroquinolone or vancomycin, two hours) prior to the surgical incision (or start of procedure when no incision is required)
23. Stroke and Stroke Rehabilitation: Deep Vein Thrombosis Prophylaxis (DVT) for Ischemic Stroke or Intracranial Hemorrhage Description: Percentage of patients aged 18 years and older with a diagnosis of ischemic stroke or intracranial hemorrhage who received DVT prophylaxis by end of hospital day two
24. Stroke and Stroke Rehabilitation: Discharged on Antiplatelet Therapy Description: Percentage of patients aged 18 years and older with a diagnosis of ischemic stroke or transient ischemic attack (TIA) who were prescribed antiplatelet therapy at discharge
25. Stroke and Stroke Rehabilitation: Anticoagulant Therapy Prescribed for Atrial Fibrillation at Discharge Description: Percentage of patients aged 18 years and older with a diagnosis of ischemic stroke or transient ischemic attack (TIA) with documented permanent, persistent, or paroxysmal atrial fibrillation who were prescribed an anticoagu-lant at discharge
26. Stroke and Stroke Rehabilitation: Tissue Plasminogen Activator (t-PA) Considered Description: Percentage of patients aged 18 years and older with a diagnosis of ischemic stroke whose time from symptom onset to arrival is less than 3 hours who were considered for t-PA administration
64494_CH01_Print.indd 2064494_CH01_Print.indd 20 10/6/09 2:51:41 PM10/6/09 2:51:41 PM
© Jones and Bartlett Publishers, LLC. NOT FOR SALE OR DISTRIBUTION.
Appendix 1.1 21
27. Stroke and Stroke Rehabilitation: Screening for Dysphagia Description: Percentage of patients aged 18 years and older with a diagnosis of ischemic stroke or intracranial hemorrhage who underwent a dysphagia screen-ing process before taking any foods, fluids, or medication by mouth
28. Stroke and Stroke Rehabilitation: Consideration of Rehabilitation Services Description: Percentage of patients aged 18 years and older with a diagnosis of ischemic stroke or intracranial hemorrhage for whom consideration of reha-bilitation services is documented
29. Screening or Therapy for Osteoporosis for Women Aged 65 Years and Older Description: Percentage of female patients aged 65 years and older who have a central dual-energy X-ray absorptiometry (DXA) measurement ordered or per-formed at least once since age 60 or pharmacologic therapy prescribed within 12 months
30. Osteoporosis: Management Following Fracture Description: Percentage of patients aged 50 years and older with fracture of the hip, spine or distal radius who had a central dual-energy X-ray absorptiometry (DXA) measurement ordered or performed or pharmacologic therapy prescribed
31. Osteoporosis: Pharmacologic Therapy Description: Percentage of patients aged 50 years and older with a diagnosis of osteoporosis who were prescribed pharmacologic therapy within 12 months
32. Use of Internal Mammary Artery (IMA) in Coronary Artery Bypass Graft (CABG) Surgery Description: Percentage of patients aged 18 years and older undergoing isolated coronary artery bypass graft (CABG) surgery using an internal mammary artery (IMA)
33. Preoperative Beta-blocker in Patients with Isolated Coronary Artery Bypass Graft (CABG) Surgery Description: Percentage of patients aged 18 years and older undergoing isolated coronary artery bypass (CABG) surgery who received a beta-blocker pre-operatively
34 . Perioperative Care: Discontinuation of Prophylactic Antibiotics (Cardiac Procedures) Description: Percentage of cardiac surgical patients aged 18 years and older undergoing procedures with the indications for prophylactic antibiotics AND
64494_CH01_Print.indd 2164494_CH01_Print.indd 21 10/6/09 2:51:41 PM10/6/09 2:51:41 PM
© Jones and Bartlett Publishers, LLC. NOT FOR SALE OR DISTRIBUTION.
22 CHAPTER 1 The Business Case for Quality
who received a prophylactic antibiotic, who have an order for discontinuation of prophylactic antibiotics within 48 hours of surgical end time
35. Medication Reconciliation Description: Percentage of patients aged 65 years and older discharged from any inpatient facility (e.g., hospital, skilled nursing facility, or rehabilitation facility) and seen within 60 days following discharge in the office by the physician providing on-going care who had a reconciliation of the discharge medications with the current medication list in the medical record documented
36. Advance Care Plan Description: Percentage of patients aged 65 years and older who have an advance care plan or surrogate decision maker documented in the medical record or documentation in the medical record that an advance care plan was discussed but the patient did not wish or was not able to name a surrogate decision maker or provide an advance care plan in the medical record
37 . Assessment of Presence or Absence of Urinary Incontinence in Women Aged 65 Years and Older Description: Percentage of female patients aged 65 years and older who were assessed for the presence or absence of urinary incontinence within 12 months
38. Characterization of Urinary Incontinence in Women Aged 65 Years and Older Description: Percentage of female patients aged 65 years and older with a diagnosis of urinary incontinence whose urinary incontinence was characterized at least once within 12 months
39 . Plan of Care for Urinary Incontinence in Women Aged 65 Years and Older Description: Percentage of female patients aged 65 years and older with a diagnosis of urinary incontinence with a documented plan of care for urinary incontinence at least once within 12 months
40. Chronic Obstructive Pulmonary Disease (COPD): Spirometry Evaluation Description: Percentage of patients aged 18 years and older with a diagnosis of COPD who had spirometry evaluation results documented
41. Chronic Obstructive Pulmonary Disease (COPD): Bronchodilator Therapy Description: Percentage of patients aged 18 years and older with a diagnosis of COPD and who have an FEV1/FVC less than 70% and have symptoms who were prescribed an inhaled bronchodilator
64494_CH01_Print.indd 2264494_CH01_Print.indd 22 10/6/09 2:51:41 PM10/6/09 2:51:41 PM
© Jones and Bartlett Publishers, LLC. NOT FOR SALE OR DISTRIBUTION.
Appendix 1.1 23
42. Asthma: Pharmacologic Therapy Description: Percentage of patients aged 5 through 40 years with a diagnosis of mild, moderate, or severe persistent asthma who were prescribed either the preferred long-term control medication (inhaled corticosteroid) or an acceptable alternative treatment
43. Electrocardiogram Performed for Non-Traumatic Chest Pain Description: Percentage of patients aged 40 years and older with an emergency department discharge diagnosis of non-traumatic chest pain who had a 12-lead electrocardiogram (ECG) performed
44. Electrocardiogram Performed for Syncope Description: Percentage of patients aged 60 years and older with an emergency department discharge diagnosis of syncope who had a 12-lead ECG performed
45. Vital Signs for Community-Acquired Bacterial Pneumonia Description: Percentage of patients aged 18 years and older with a diagnosis of community-acquired bacterial pneumonia with vital signs documented and reviewed
46. Assessment of Oxygen Saturation for Community-Acquired Bacterial Pneumonia Description: Percentage of patients aged 18 years and older with a diagnosis of community-acquired bacterial pneumonia with oxygen saturation documented and reviewed
47. Assessment of Mental Status for Community-Acquired Bacterial Pneumonia Description: Percentage of patients aged 18 years and older with a diagnosis of community-acquired bacterial pneumonia with mental status assessed
48. Empiric Antibiotic for Community-Acquired Bacterial Pneumonia Description: Percentage of patients aged 18 years and older with a diagnosis of community-acquired bacterial pneumonia with an appropriate empiric antibi-otic prescribed
49. Asthma Assessment Description: Percentage of patients aged 5 through 40 years with a diagnosis of asthma who were evaluated during at least one office visit within 12 months for the frequency (numeric) of daytime and nocturnal asthma symptoms
50. Appropriate Treatment for Children with Upper Respiratory Infection (URI) Description: Percentage of children aged 3 months through 18 years with a diagnosis of upper respiratory infection (URI) who were not prescribed or
64494_CH01_Print.indd 2364494_CH01_Print.indd 23 10/6/09 2:51:41 PM10/6/09 2:51:41 PM
© Jones and Bartlett Publishers, LLC. NOT FOR SALE OR DISTRIBUTION.
24 CHAPTER 1 The Business Case for Quality
dispensed an antibiotic prescription on or within 3 days of the initial date of service
51. Appropriate Testing for Children with Pharyngitis Description: Percentage of children aged 2 through 18 years with a diagnosis of pharyngitis, who were prescribed an antibiotic and who received a group A streptococcus (strep) test for the episode
52. Myelodysplastic Syndrome (MDS) and Acute Leukemias: Baseline Cytogenetic Testing Performed on Bone Marrow Description: Percentage of patients aged 18 years and older with a diagnosis of MDS or an acute leukemia who had baseline cytogenetic testing performed on bone marrow
53. Myelodysplastic Syndrome (MDS): Documentation of Iron Stores in Patients Receiving Erythropoietin Therapy Description: Percentage of patients aged 18 years and older with a diagnosis of MDS who are receiving erythropoietin therapy with documentation of iron stores prior to initiating erythropoietin therapy
54. Multiple Myeloma: Treatment with Bisphosphonates Description: Percentage of patients aged 18 years and older with a diagnosis of multiple myeloma, not in remission, who were prescribed or received intrave-nous bisphosphonate therapy within the 12-month reporting period
55. Chronic Lymphocytic Leukemia (CLL): Baseline Flow Cytometry Description: Percentage of patients aged 18 years and older with a diagnosis of CLL who had baseline flow cytometry studies performed
56. Hormonal Therapy for Stage IC—III ER/PR Positive Breast Cancer Description: Percentage of female patients aged 18 years and older with Stage IC through IIIC, estrogen receptor (ER) or progesterone receptor (PR) positive breast cancer who were prescribed tamoxifen or aromatase inhibitor (AI) dur-ing the 12-month reporting period
57. Chemotherapy for Stage III Colon Cancer Patients Description: Percentage of patients aged 18 years and older with Stage IIIA through IIIC colon cancer who are prescribed or who have received adjuvant chemotherapy during the 12-month reporting period
58. Plan for Chemotherapy Documented Before Chemotherapy Administered Description: Percentage of patients, regardless of age, with a diagnosis of breast, colon, or rectal cancer who are receiving intravenous chemotherapy for whom the planned chemotherapy regimen (which includes, at a minimum: drug(s)
64494_CH01_Print.indd 2464494_CH01_Print.indd 24 10/6/09 2:51:41 PM10/6/09 2:51:41 PM
© Jones and Bartlett Publishers, LLC. NOT FOR SALE OR DISTRIBUTION.
Appendix 1.1 25
prescribed, dose, and duration) is documented prior to the initiation of a new treatment regimen
59. Radiation Therapy Recommended for Invasive Breast Cancer Patients who have Undergone Breast Conserving Surgery Description: Percentage of invasive female breast cancer patients aged 18 through 70 years old who have undergone breast conserving surgery and who have received recommendation for radiation therapy within 12 months of the first office visit
60. Prevention of Ventilator-Associated Pneumonia—Head Elevation Description: Percentage of ICU patients aged 18 years and older who receive mechanical ventilation and who had an order on the first ventilator day for head of bed elevation (30–45 degrees)
61. Prevention of Catheter-Related Bloodstream Infections (CRBSI)—Central Venous Catheter Insertion Protocol Description: Percentage of patients, regardless of age, who undergo central venous catheter (CVC) insertion for whom CVC was inserted with all elements of maximal sterile barrier technique (cap AND mask AND sterile gown AND sterile gloves AND a large sterile sheet AND hand hygiene AND 2% chlor-hexidine for cutaneous antisepsis) followed
62. Assessment of GERD Symptoms in Patients Receiving Chronic Medication for GERD Description: Percentage of patients aged 18 years and older with the diagnosis of gastroesophageal reflux disease (GERD) who have been prescribed continu-ous proton pump inhibitor (PPI) or histamine H2 receptor antagonist (H2RA) therapy who received an annual assessment of their GERD symptoms after 12 months of therapy
63. Vascular Access for Patients Undergoing Hemodialysis Description: Percentage of patients aged 18 years and older with a diagnosis of end stage renal disease (ESRD) and receiving hemodialysis who have a functioning AV fistula OR patients who are referred for an AV fistula at least once during the 12-month reporting period
64. Influenza Vaccination in Patients with End Stage Renal Disease (ESRD) Description: Percentage of patients aged 18 years and older with a diagnosis of ESRD and receiving dialysis who received the influenza immunization during the flu season (September through February)
65. Plan of Care for ESRD Patients with Anemia Description: Percentage of patient calendar months during the 12-month report-ing period in which patients aged 18 years and older with a diagnosis of end
64494_CH01_Print.indd 2564494_CH01_Print.indd 25 10/6/09 2:51:41 PM10/6/09 2:51:41 PM
© Jones and Bartlett Publishers, LLC. NOT FOR SALE OR DISTRIBUTION.
26 CHAPTER 1 The Business Case for Quality
stage renal disease (ESRD) who are receiving dialysis have a Hgb ≥ 11g/dL OR have a Hgb < 11 g/dL with a documented plan of care for anemia
66. Plan of Care for Inadequate Hemodialysis in ESRD Patients Description: Percentage of patient calendar months during the 12-month report-ing period in which patients aged 18 years and older with a diagnosis of end stage renal disease (ESRD) receiving hemodialysis have a Kt/V ≥ 1.2 OR patients who have a Kt/V < 1.2 with a documented plan of care for inadequate hemodialysis
67. Plan of Care for Inadequate Peritoneal Dialysis Description: Percentage of patients aged 18 years and older with a diagnosis of end stage renal disease (ESRD) receiving peritoneal dialysis who have a Kt/V ≥ 1.7 OR patients who have a Kt/V < 1.7 with a documented plan of care for inadequate peritoneal dialysis at least three times during the 12-month reporting period
68. Testing of Patients with Chronic Hepatitis C (HCV) for Hepatitis C Viremia Description: Percentage of patients aged 18 years and older with a diagnosis of hepatitis C seen for an initial evaluation who had HCV RNA testing ordered or previously performed
69. Initial Hepatitis C RNA Testing Description: Percentage of patients aged 18 years and older with a diagnosis of chronic hepatitis C who are receiving antiviral treatment for whom quan-titative HCV RNA testing was performed within 6 months prior to initiation of treatment
70. HCV Genotype Testing Prior to Therapy Description: Percentage of patients aged 18 years and older with a diagnosis of chronic hepatitis C who are receiving antiviral treatment for whom HCV genotype testing was performed prior to initiation of treatment
71. Consideration for Antiviral Therapy in HCV Patients Description: Percentage of patients aged 18 years and older with a diagnosis of chronic hepatitis C who were considered for peginterferon and ribavirin therapy within the 12-month reporting period
72. HCV RNA Testing at Week 12 of Therapy Description: Percentage of patients aged 18 years and older with a diagnosis of chronic hepatitis C who are receiving antiviral treatment for whom quanti-tative HCV RNA testing was performed at 12 weeks from the initiation of antiviral treatment
64494_CH01_Print.indd 2664494_CH01_Print.indd 26 10/6/09 2:51:41 PM10/6/09 2:51:41 PM
© Jones and Bartlett Publishers, LLC. NOT FOR SALE OR DISTRIBUTION.
Appendix 1.1 27
73. Hepatitis A and B Vaccination in Patients with HCV Description: Percentage of patients aged 18 years and older with a diagnosis of hepatitis C who were recommended to receive or who have received hepatitis A vaccination or who have documented immunity to hepatitis A AND who were recommended to receive or have received hepatitis B vaccination or who have documented immunity to hepatitis B
74. Counseling Patients with HCV Regarding Use of Alcohol Description: Percentage of patients aged 18 years and older with a diagnosis of hepatitis C who received education regarding the risk of alcohol consumption at least once within the 12-month reporting period
75. Counseling of Patients Regarding Use of Contraception Prior to Starting Antiviral Therapy Description: Percentage of female patients aged 18 through 44 years and all men aged 18 years and older with a diagnosis of chronic hepatitis C who are receiving antiviral treatment who were counseled regarding contraception prior to the initiation of treatment
76. Acute Otitis Externa (AOE): Topical Therapy Description: Percentage of patients aged 2 years and older with a diagnosis of AOE who were prescribed topical preparations
77. Acute Otitis Externa (AOE): Pain Assessment Description: Percentage of patient visits for those patients aged 2 years and older with a diagnosis of AOE with assessment for auricular or periauricular pain
78. Acute Otitis Externa (AOE): Systemic Antimicrobial Therapy—Avoidance of Inappropriate Use Description: Percentage of patients aged 2 years and older with a diagnosis of AOE who were not prescribed systemic antimicrobial therapy
79. Otitis Media with Effusion (OME): Diagnostic Evaluation—Assessment of Tympanic Membrane Mobility Description: Percentage of patient visits for those patients aged 2 months through 12 years with a diagnosis of OME with assessment of tympanic membrane mobility with pneumatic otoscopy or tympanometry
80. Otitis Media with Effusion (OME): Hearing Testing Description: Percentage of patients aged 2 months through 12 years with a diagnosis of OME who received tympanostomy tube insertion who had a hear-ing test performed within 6 months prior to tympanostomy tube insertion
64494_CH01_Print.indd 2764494_CH01_Print.indd 27 10/6/09 2:51:41 PM10/6/09 2:51:41 PM
© Jones and Bartlett Publishers, LLC. NOT FOR SALE OR DISTRIBUTION.
28 CHAPTER 1 The Business Case for Quality
81. Otitis Media with Effusion (OME): Antihistamines or Decongestants—Avoidance of Inappropriate Use Description: Percentage of patients aged 2 months through 12 years with a diagnosis of OME who were not prescribed/recommended either antihistamines or decongestants
82. Otitis Media with Effusion (OME): Systemic Antimicrobials—Avoidance of Inappropriate Use Description: Percentage of patients aged 2 months through 12 years with a diagnosis of OME who were not prescribed systemic antimicrobials
83. Otitis Media with Effusion (OME): Systemic Corticosteroids—Avoidance of Inappropriate Use Description: Percentage of patients aged 2 months through 12 years with a diagnosis of OME who were not prescribed systemic corticosteroids
84. Breast Cancer Patients who have a pT and pN Category and Histologic Grade for Their Cancer Description: Percentage of breast cancer resection pathology reports that include the pT category (primary tumor), the pN category (regional lymph nodes), and the histologic grade
85. Colorectal Cancer Patients who have a pT and pN Category and Histologic Grade for Their Cancer Description: Percentage of colon and rectum cancer resection pathology reports that include the pT category (primary tumor), the pN category (regional lymph nodes) and the histologic grade
86. Appropriate Initial Evaluation of Patients with Prostate Cancer Description: Percentage of patients, regardless of age, with prostate cancer receiving interstitial prostate brachytherapy, OR external beam radiotherapy to the prostate, OR radical prostatectomy, OR cryotherapy with documented evaluation of prostate-specific antigen (PSA), AND primary tumor (T) stage, AND Gleason score prior to initiation of treatment
87. Inappropriate Use of Bone Scan for Staging Low-Risk Prostate Cancer Patients Description: Percentage of patients, regardless of age, with a diagnosis of pros-tate cancer at low risk of recurrence receiving interstitial prostate brachytherapy, OR external beam radiotherapy to the prostate, OR radical prostatectomy, OR cryotherapy who did not have a bone scan performed at any time since diagnosis of prostate cancer
64494_CH01_Print.indd 2864494_CH01_Print.indd 28 10/6/09 2:51:41 PM10/6/09 2:51:41 PM
© Jones and Bartlett Publishers, LLC. NOT FOR SALE OR DISTRIBUTION.
Appendix 1.1 29
88. Review of Treatment Options in Patients with Clinically Localized Prostate Cancer Description: Percentage of patients, regardless of age, with clinically localized prostate cancer AND receiving interstitial prostate brachytherapy, OR external beam radiotherapy to the prostate, OR radical prostatectomy, OR cryotherapy who received counseling prior to initiation of treatment on, at a minimum, the following treatment options for clinically localized disease: active surveillance, AND interstitial prostate brachytherapy, AND external beam radiotherapy, AND radical prostatectomy
89. Adjuvant Hormonal Therapy for High-Risk Prostate Cancer Patients Description: Percentage of patients, regardless of age, with a diagnosis of pros-tate cancer at high risk of recurrence receiving external beam radiotherapy to the prostate who were prescribed adjuvant hormonal therapy (GnRH agonist or antagonist)
90. Three-dimensional Radiotherapy for Patients with Prostate Cancer Description: Percentage of patients, regardless of age, with prostate cancer receiving external beam radiotherapy to the prostate only (no metastases) who receive 3D-CRT or IMRT
91. Patients who have Major Depression Disorder who meet DSM IV Criteria Description: Percentage of patients aged 18 years and older with a new diag-nosis or recurrent episode of major depressive disorder (MDD) who met the DSM-IV TM criteria during the visit in which the new diagnosis or recurrent episode was identified during the measurement period
92. Patients who have Major Depression Disorder who are Assessed for Suicide Risks Description: Percentage of patients aged 18 years and older with a new diagnosis or recurrent episode of major depressive disorder (MDD) who had a suicide risk assessment completed at each visit during the measurement period
93. Disease Modifying Anti-Rheumatic Drug Therapy in Rheumatoid Arthritis
Description: Percentage of patients aged 18 years and older who were diagnosed with rheumatoid arthritis and were prescribed, dispensed, or administered at least one ambulatory prescription for a disease modifying anti-rheumatic drug (DMARD)
94. Patients with Osteoarthritis who have an Assessment of Their Pain and Function
Description: Percentage of patient visits for patients aged 21 years and older with a diagnosis of osteoarthritis (OA) with assessment for function and pain
64494_CH01_Print.indd 2964494_CH01_Print.indd 29 10/6/09 2:51:41 PM10/6/09 2:51:41 PM
© Jones and Bartlett Publishers, LLC. NOT FOR SALE OR DISTRIBUTION.
30 CHAPTER 1 The Business Case for Quality
95. Influenza Vaccination for Patients > 50 Years Old Description: Percentage of patients aged 50 years and older who received an influenza immunization during the flu season (September through February)
96. Pneumonia Vaccination for Patients 65 years and Older
Description: Percentage of patients aged 65 years and older who have ever received a pneumococcal vaccine
97. Screening Mammography
Description: Percentage of women aged 40 through 69 years who had a mam-mogram to screen for breast cancer within 24 months
98. Colorectal Cancer Screening
Description: Percentage of patients aged 50 through 80 years who received the appropriate colorectal cancer screening
99. Inquiry Regarding Tobacco Use
Description: Percentage of patients aged 18 years or older who were queried about tobacco use one or more times within 24 months
100. Advising Smokers to Quit
Description: Percentage of patients aged 18 years and older and are smokers who received advice to quit smoking
101. Inappropriate Antibiotic Treatment for Adults with Acute Bronchitis
Description: Percentage of adults aged 18 through 64 years with a diagnosis of acute bronchitis who were not prescribed or dispensed an antibiotic prescription on or within 3 days of the initial date of service
102. Dilated Eye Exam in Diabetic Patient
Description: Percentage of patients aged 18 through 75 years with a diagnosis of diabetes mellitus who had a dilated eye exam
103. Angiotensin Converting Enzyme Inhibitor (ACE) or Angiotensin Receptor Blocker (ARB) Therapy for Patients with Coronary Artery Disease and Diabetes and/or Left Ventricular Systolic Dysfunction (LVSD) Description: Percentage of patients aged 18 years and older with a diagnosis of coronary artery disease (CAD) who also have diabetes mellitus and/or left ventricular systolic dysfunction (LVSD) who were prescribed ACE Inhibitor or ARB therapy
64494_CH01_Print.indd 3064494_CH01_Print.indd 30 10/6/09 2:51:41 PM10/6/09 2:51:41 PM
© Jones and Bartlett Publishers, LLC. NOT FOR SALE OR DISTRIBUTION.
Appendix 1.1 31
104. Urine Screening for Microalbumin or Medical Attention for Nephropathy in Diabetic Patients Description: Percentage of patients aged 18 through 75 years of age with dia-betes mellitus who received urine protein screening or medical attention for nephropathy during at least one office visit within 12 months
105. ACE Inhibitor or Angiotensin Receptor Blocker (ARB) Therapy in Patients with CKD Description: Percentage of patients aged 18 years and older with a diagnosis of advanced chronic kidney disease (CKD) (stage 4 or 5, not receiving Renal Replacement Therapy [RRT]), and hypertension and proteinuria who were prescribed angiotensin converting enzyme (ACE) inhibitor or angiotensin recep-tor blocker (ARB) therapy during the 12-month reporting period
106. Chronic Kidney Disease (CKD): Laboratory Testing (Calcium, Phosphorus, Intact Parathyroid Hormone (iPTH) and Lipid Profile) Description: Percentage of patients aged 18 years and older with a diagnosis of advanced CKD (stage 4 or 5, not receiving Renal Replacement Therapy [RRT]), who had the following laboratory testing ordered at least once during the 12-month reporting period: serum levels of calcium, phosphorus and intact PTH, and lipid profile
107. Chronic Kidney Disease (CKD): Blood Pressure Management Description: Percentage of patient visits for patients aged 18 years and older with a diagnosis of advanced CKD (stage 4 or 5, not receiving Renal Replacement Therapy [RRT]), with a blood pressure < 130/80 mmHg OR blood pressure ≥ 130/80 mmHg with a documented plan of care
108. Chronic Kidney Disease (CKD): Plan of Care: Elevated Hemoglobin for Patients Receiving Erythropoiesis-Stimulating Agents (ESA) Description: Percentage of patient calendar months during the 12-month report-ing period in which patients aged 18 years and older with a diagnosis of ad-vanced CKD (stage 4 or 5, not receiving Renal Replacement Therapy [RRT]), receiving ESA therapy, have a hemoglobin < 13 g/dL OR patients whose hemo-globin is ≥ 13 g/dL and have a documented plan of care
109. HIT—Adoption/Use of Health Information Technology (Electronic Health Records) Description: Documents whether provider has adopted and is using health information technology. To qualify, the provider must have adopted a qualified electronic medical record (EMR). For the purpose of this measure, a qualified EMR can either be a Certification Commission for Healthcare Information
64494_CH01_Print.indd 3164494_CH01_Print.indd 31 10/6/09 2:51:42 PM10/6/09 2:51:42 PM
© Jones and Bartlett Publishers, LLC. NOT FOR SALE OR DISTRIBUTION.
32 CHAPTER 1 The Business Case for Quality
Technology (CCHIT) certified EMR or, if not CCHIT certified, the system must be capable of all of the following:
• Generating a medication list • Generating a problem list • Entering laboratory tests as discrete searchable data elements
110. HIT—Adoption/Use of e-Prescribing Description: Documents whether provider has adopted a qualified e-Prescribing system and the extent of use in the ambulatory setting. To qualify this system must be capable of ALL of the following:
• Generating a complete active medication list incorporating electronic data received from applicable pharmacy drug plan(s) if available
• Selecting medications, printing prescriptions, electronically transmitting pre-scriptions, and conducting all safety checks (defined below)
• Providing information related to the availability of lower cost, therapeutically appropriate alternatives (if any)
• Providing information on formulary or tiered formulary medications, patient eligibility, and authorization requirements received electronically from the patient’s drug plan
111. Diabetic Foot and Ankle Care, Peripheral Neuropathy: Neurological Evaluation Description: Percentage of patients aged 18 years and older with a diagnosis of diabetes mellitus who had a neurological examination of their lower extremities
112. Diabetic Foot and Ankle Care, Ulcer Prevention: Evaluation of Footwear Description: Percentage of patients aged 18 years and older with a diagnosis of diabetes mellitus who were evaluated for proper footwear and sizing
113. Universal Weight Screening and Follow-Up
Description: Percentage of patients aged 65 years and older with a calculated Body Mass Index (BMI) within the past six months or during the current visit that is documented in the medical record and if the most recent BMI is ≥ 30 or < 22, a follow-up plan is documented
114. Universal Influenza Vaccine Screening and Counseling Description: Percentage of patients aged 50 years and older who were screened and counseled about the influenza vaccine during the months of January, February, March, October, November, and December
64494_CH01_Print.indd 3264494_CH01_Print.indd 32 10/6/09 2:51:42 PM10/6/09 2:51:42 PM
© Jones and Bartlett Publishers, LLC. NOT FOR SALE OR DISTRIBUTION.
Appendix 1.1 33
115. Universal Documentation and Verification of Current Medications in the Medical Record Description: Percentage of patients aged 18 years and older with written provider documentation that current medications with dosages (includes prescription, over-the-counter, herbals, vitamin/mineral/dietary [nutritional] supplements) were verified with the patient or authorized representative
116. Pain Assessment Prior to Initiation of Patient Treatment Description: Percentage of patients aged 18 years and older with documentation of a pain assessment (if pain is present, including location, intensity and descrip-tion) through discussion with the patient or through use of a standardized tool on each initial evaluation prior to initiation of therapy
117. Patient Co-Development of Treatment Plan/Plan of Care Description: Percentage of patients aged 18 years and older identified as having actively participated in the development of the treatment plan/plan of care. Appropriate documentation includes signature of the practitioner and either co-signature of the patient or documented verbal agreement obtained from the patient or, when necessary, an authorized representative
118. Screening for Cognitive Impairment Description: Percentage of patients aged 65 years and older who have documentation of results of a screening for cognitive impairment using a stan-dardized tool
119. Screening for Clinical Depression Description: Percentage of patients aged 18 years and older screened for clinical depression using a standardized tool
Retrieved April 2008 from http://www.cms.hhs.gov/PQRI/Downloads/ 2008PQRIMeasuresList.pdf
64494_CH01_Print.indd 3364494_CH01_Print.indd 33 10/6/09 2:51:42 PM10/6/09 2:51:42 PM
© Jones and Bartlett Publishers, LLC. NOT FOR SALE OR DISTRIBUTION.

64494_CH01_Print.indd 3464494_CH01_Print.indd 34 10/6/09 2:51:42 PM10/6/09 2:51:42 PM
© Jones and Bartlett Publishers, LLC. NOT FOR SALE OR DISTRIBUTION.