Embed Size (px)
Citation preview

Chapter Six: The Western Road Convict Population
1 G.A. Wood, ‘Convicts’, JRAHS, Vol.8, Pt.4, 1922, p.187.2 Eris O’Brien, The Foundation of Australia (1786-1800): A Study in English Criminal Practice and PenalColonization in the Eighteenth Century, Sheed & Ward, London, 1937, pp.10-11, 13-15.3 Manning Clark, ‘The Origins of the Convicts Transported to Eastern Australia, 1787-1852’, HistoricalStudies, Vol. 7: 1956, pp.121-35; 314-27.
174
Chapter Six
The Western Road Convicts
There are three major schools of thought concerning the origins and character of the
convicts transported to New South Wales which retain some currency in the
literature. The first emerged in the early 1920s when George Wood argued that the
convicts transported to Australia were the victims of a harsh economic and political
regime and a brutal and self interested criminal justice system. ‘Is it not the case’,
asked Wood, ‘that the true villains remained behind in England while their victims,
innocent and manly, created the Australian democracy?’1 In 1937 Eris O’Brien also
concluded that, while many sentences had been commuted from the death penalty,
and therefore were likely to be more serious than Wood had credited, the convicts
had generally been guilty of trifling offences.2 Generations of school children were
raised with what became a cliched notion that convicts were poor, desperate people
sentenced for stealing a loaf of bread by a heartless government. With culpability for
the injustices of the system directed to the British, it was a nationalistic viewpoint
that spared Australians and their convict forebears, embarrassment or responsibility
for what had been previously viewed as ignominious national beginnings.
Manning Clark, writing in 1956, was the first major historian to revive the largely
nineteenth century view of convicts as criminals. After a limited examination of
convict indents, Clark concluded that the convicts were largely members of a
professional urban criminal class.3 This view developed as the second major school
of thought across the following decades. In the 1960s Lloyd Robson used the

Chapter Six: The Western Road Convict Population
4 Lloyd Robson, The Convict Settlers of Australia: An Enquiry into the Origin and Character of theConvicts Transported to New South Wales and Van Diemen’s Land, 1788-1852, Melbourne UniversityPress, 1965.5 A.G.L., Shaw Convicts and Colonies: A Study of Penal Transportation from Great Britain and Irelandto Australia and other parts of the British Empire Melbourne University Press, 1966, pp.164; 182-183.6 Brian Fletcher, Colonial Australia before 1850, Melbourne, Nelson, 1976; Robert Hughes, The FatalShore, London, Collins Harvill, 1987; M.B. and C.B. Schedvin, ‘The Nomadic Tribes of Urban Britain: APrelude to Botany Bay’, Historical Studies, Vol.20, Pt. 78, 1978, pp.254-276; Humphrey McQueen, ANew Britannia, Penguin, 1970; Stephen Garton, ‘The Convict Origins Debate: Historians And TheProblem Of The Criminal Class’, Aust & NZ Jour. of Criminology, Vol.24, July 1991, pp.69-71.7 John Hirst, Convict Society and its enemies, Sydney, George Allen & Unwin, 1983, pp.85-86.
175
transportation indents to analyse a random sample population comprised of every
20th convict sent to eastern Australia. He produced a demographic profile confirming
Clark’s suspicions.4 A.G.L. Shaw came to similar conclusions, subscribing to the
view that the convicts belonged to a criminal class of ne’er-do-wells, an underworld
of rogues, pick pockets and drunkards who stole for a living. All three were of the
opinion, however, that English convicts were not, in the words of Shaw, ‘atrocious
villains’ and that the Irish were even less so, being more likely to be first offenders
from rural, rather than urban environments.5
Brian Fletcher, in Colonial Australia before 1850 (1976), Robert Hughes in The
Fatal Shore (1978), M.B. and C.B. Schedvin in ‘The Nomadic Tribes of Urban
Britain: A Prelude to Botany Bay’ (1978), and Humphrey McQueen in A New
Britannia (1970) essentially took up the conclusions of Clark, Robson and Shaw.
The convicts were portrayed as work-shy members of the working class and as
selfish thieves interested only in their own survival, feckless professional criminals
that were as likely to betray their peers as the local lord or bourgeois shopkeeper.6
John Hirst in Convict Society and its Enemies (1983) accepted the view that convicts
came from a criminal class, but portrayed them as individuals likely to pursue their
own advantage, budding entrepreneurs keen to use the system for their financial
advancement. Thus, he argued, they formed part of the origins of a capitalist, market
oriented society.7 George Rudé in Protest and Punishment: The Story of the Social
and Political Protesters Transported to Australia, 1788-1868 (1978) allowed that a
small minority were social or political protestors. Rudé reminded scholars that the

Chapter Six: The Western Road Convict Population
8 George Rudé, Protest & Punishment, Oxford, Clarendon Press, 1978, pp.242-247.9 Michael Sturma, Vice in a Vicious Society, St. Lucia, Queensland University Press, 1983, pp.1-8.10 The Convict Workers team also included Barrie Dyster, David Meredith, Deborah Oxley, John Perkinsand Kris Corcoran. Their findings were compiled in Stephen Nicholas (ed.) Convict Workers:Reinterpreting Australia’s Past, Cambridge University Press, Sydney, 198811 Stephen Nicholas and Peter R. Shergold, ‘Unshackling the Past’ in Nicholas op. cit., pp.3; 6-7.12 Ralph Shlomowitz, ‘Convict workers: a review article’, Australian Journal of Economic HistoryReview, Vol. 30, Sepot 1990, pp.67-80.
176
question of the degree to which the ‘complexion’ of the convicts changed in response
to circumstances in Britain had not been addressed.8 Michael Sturma in Vice in a
Vicious Society tempered the primacy of the criminal class theory when he argued in
1983 that the inadequacy of crime statistics, both in the colony and in Britain,
undermined the validity of claims for criminality. He concluded that the concept of a
‘criminal class’ either in Britain or Australia was the creation of nineteenth century
prosecutors and twentieth century historians.9
More recently, a third school of thought challenged many of the orthodoxies that had
emerged from the preceding paradigms. Stephen Nicholas, Peter Shergold and others
presented a major reinterpretation of the convicts in 1988 .10 They examined almost
20,000 indents to conclude that the convicts were neither hapless victims nor work-
shy, conniving ne’er-do-wells. The notion of a ‘criminal class’ was rejected and they
argued that the convicts sent to Australia ‘were ordinary British and Irish working
class men and women’.11 The Convict Workers team paid particular attention to the
occupations and literacy levels indicated on the transportation indents, an aspect that
had been largely neglected in previous studies or been dismissed as unreliable. They
claimed that the convicts’ occupation profile was broadly similar to a profile drawn
from the 1841 census of England and Ireland and that the indent data was more
reliable than had previously been credited. These claims and their methodology were
challenged, for example, by Shlomowitz as early as 1990, but the methodology and
data stands nevertheless as a benchmark from which other population studies can be
developed and refined.12
This chapter draws on the indent data for the Western Road convicts to comment on
the evidence for, and validity of, the victim/rogue dichotomy that dominated convict

Chapter Six: The Western Road Convict Population
13 Shaw, op. cit., p.216.14 Robson, op. cit., p.9.
177
historiography in the twentieth century. The data for the Western Road population is
compared with the findings the two major convict population studies undertaken to
date, ie., those of Robson and Nicholas and Shergold, referred to above. In the
discussion following the reader is directed to the tables at the end of the chapter to
assess the data sample on which the discussion is based.
The Western Road Sample Population
In contrast to Robson’s random sample of some 6,000 convicts and the Convict
Workers sample of 20,000, the Western Road convict recidivist population, which is
the subject of this thesis, is a very specific sample of 1108 convicts. The details of
these individuals were found in court records and correspondence related to the
convict stockades on the Western Road, from Mt Victoria to Bathurst, in the 1830s.
Many are part of the 18 % of all transported men estimated by Shaw to have been
confined at some time to an iron gang in the period 1826 to 1836.13 Gaps in the data
have meant that most analysis has been undertaken within data sets defined by the
information available for the particular query rather than a standardised set for every
query. As a rule, categories with a total of less than 15 subjects were not interrogated
because of the statistical distortion small changes in such samples can instigate. This
has meant for example, that the contribution of Scottish prisoners has been largely
excluded. The data tables at the end of the chapter, however, include this material
and can be referred to by the reader.
The population has a number of commonalities with Robson’s sample. About half
had arrived with the minimal sentence of seven years, religious affiliations were
almost identical, with the ratio of Protestants to Catholics at about 2:1. The English
offenders were in the majority with the Irish a very sizeable minority. On the whole
they were largely convicted of property crimes.14 An area of distinction was military
crime. This was a category in which the Western Road recidivists exceeded the

Chapter Six: The Western Road Convict Population
15 Ibid.16 Hamish Maxwell-Stewart, ‘The Bushrangers and Convict System of Van Dieman’s Land, 1803-1846’,Ph.D Thesis, University of Edinburgh, 1990, p.43.17 Robson, op. cit., p.9.18 Ibid., p.161.19 Stephen Nicholas and Peter Shergold, ‘Unshackling the Past’ in op. cit., p.5.
178
proportion in Robson’s overall sample, particularly that for New South Wales. In all
other crime categories the sample population is too small to make meaningful
comment and so the property offenders are by default the focus of much of the
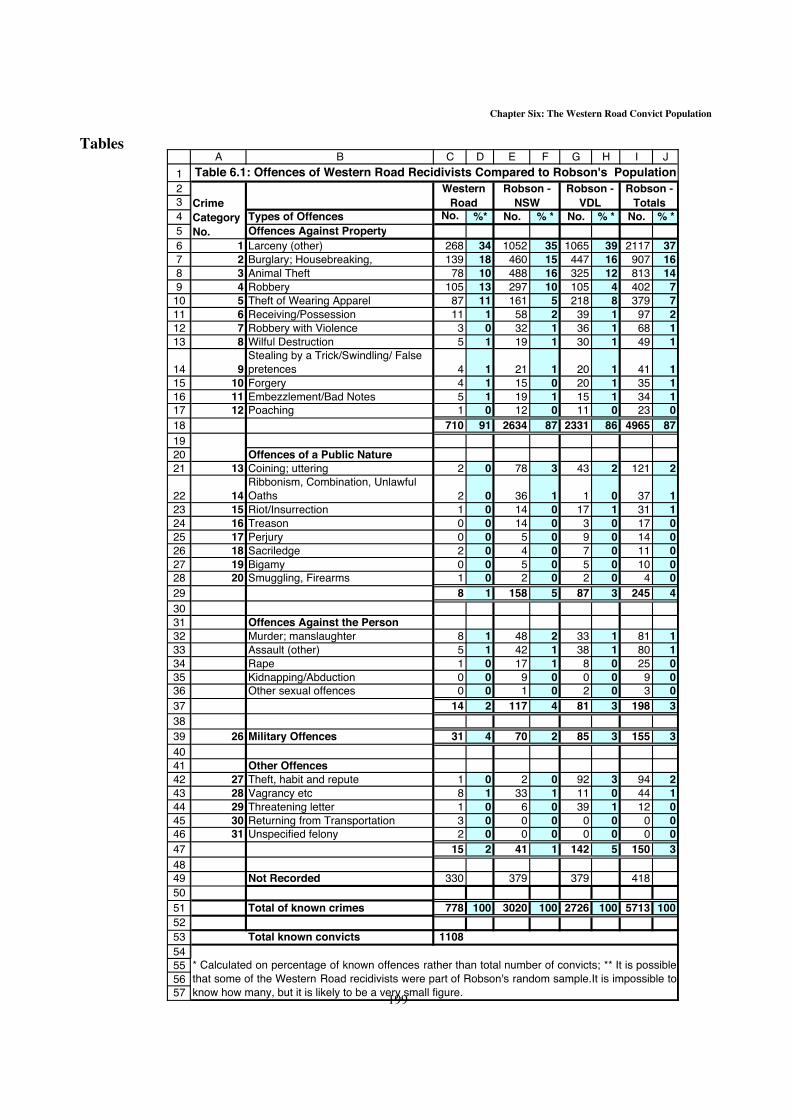
analysis which follows. [Tables 6.1, 6.2 and 6.3]
The single greatest difference with Robson’s findings is the much larger proportion
who had no previous criminal record prior to their conviction and transportation to
New South Wales, 60% compared to Robson’s estimate of from 33% to 50%.15
[Table 6.4] Other differences are the slightly greater proportion on the Western Road
with life sentences, their overall youthfulness and accompanying that, their single
marital status. [Table 6.5 and 6.6] This is a similar demographic to that of the
Tasmanian bushrangers who were the subject of Hamish Maxwell-Stewart’s 1990
thesis.16 The average age on arrival was 23, compared to Robson’s 26, with the
majority clustered in the lower age ranges.17 [Table 6.7] They had spent about five
years in the colony before coming to attention on the Western Road. In all, the
profile adds up to a more youthful and inexperienced convict population than the
terms ‘recidivist’ or ‘lifer’ usually conjures. These were not ‘old lags’.
Robson’s statistical analysis was undertaken when computers were relatively
primitive. It was largely a quantitative exercise, and at the time, long overdue as no
large scale detailed analysis had been undertaken to inform the convict origins
debate. As Robson explained, he aimed to ‘... discover the truth of the origins of the
convicts ...’ arguing that ‘... intuitive reasoning cannot be defended when objective
methods are at hand’.18 Despite this quest for ‘truth’, as Nicholas and Shergold
pointed out, Robson’s claims are ‘an elaboration of the nineteenth century notion of
a criminal class’, a notion that also determined the statistical analyses of Clark and
Shaw, rather than evolved from them.19 This was the dominant view in the 1950s and

Chapter Six: The Western Road Convict Population
20 Hamish Maxwell-Stewart, op. cit., p21 Ibid.22 In this thesis, the Oxford English Dictionary meaning: ‘urban life’ is applied. to this term. The ConciseOxford Dictionary, 9th Edition, Clarendon Press, Oxford. 1995.
179
1960s among historians of crime in nineteenth century Britain. More recent research
in the United Kingdom has found little evidence to support it.20
Clark, Robson and Shaw placed a great deal of emphasis on the crimes of the
convicts, while neglecting occupational and educational data. The argument was
made more attractive and persuasive by discussions that embellished the statistical
findings with colourful examples that reinforced the criminal class theory.21 As
Nicholas and Shergold found, a quantitative examination of the convict indents does
not support the claims for the existence of a criminal class. The research for this
thesis also revealed that evidence in the statistical detail supports a view of the
convicts as workers who stole occasionally and opportunistically for a variety of
reasons including want, the assertion of customary rights and the redress of
employment related grievances.
Statistical Constraints and Methods
The key attributes used to define the character of the convicts have been their
urbanity22, their youth, their mobility, nationality, marital and occupational status and
level of literacy. This base information was supplied on their arrival in New South
Wales in what is generally referred to as the convict indents. The most
comprehensive data set exists for the period after 1826, from the administration of
Governor Darling, when most Western Road recidivists arrived in New South Wales.
Identification of Individual Convicts
Two major difficulties faced by all researchers who have attempted to address the
question of convict identity have been gaps and inconsistencies in the data. In
undertaking the analysis for this thesis, significant problems were encountered in
determining the status of individuals and in some cases the identity of individuals. A
Chapter Six: The Western Road Convict Population
180
number had aliases, and many had names that were very common; there are, for
example, 11 John Smiths. Spellings of less common names were variable and the
orthography and calligraphy of some of the clerks was highly idiosyncratic.
Most convicts were identified because they appeared before the bench of magistrates
at Cox’s River or the Bathurst bench or quarter sessions or, more seriously, before
the NSW Supreme Court. Another source which enabled the identification of
individuals was the Employment Index for 1832 and the Convict & Employers (NSW)
Index: 1828, 1832-1833, Jan 1838-Jan 1844 extracted from the Government Gazette
by genealogical researchers, Pastkeys. It was valuable data but problems quickly
emerged. These included false identities and transcription errors either by the clerks
on the Western Road, at the Gazette office or on the original indent. For example, an
individual could be listed over a number of weeks as a runaway from a particular
gang and finally his recapture is recorded, but over the period he is identified as
being from a number of different ships and/or gangs. Cross referencing with all the
available data often enabled the correct person to be identified but sometimes there
would be two people with the same name from different ships in the same gang or
even two people with the same name from the same ship in the same gang. In
situations such as these specific identification became impossible.
It also became clear from the Cox’s River court records that there were sometimes
delays in information reaching the Gazette. If Gazette entries are taken literally,
some convicts were achieving impossible feats in running, suffering recapture and
processing by the courts, sentencing and running again. Overseers were frequent
witnesses in court proceedings and it was often possible to use their identities to link
convicts, gangs and crimes and thus differentiate events and their protagonists. Again
this process had its flaws, for example, if an overseer was in charge of a gang in July
and September 1833 can we assume, if no other overseer has been identified for the
period, that he was also in charge of it in August? In this study that assumption has
been made.

Chapter Six: The Western Road Convict Population
23 Robson, op. cit., p.25.24 Samuel Lewis, A Topographical Dictionary of England , Samuel Lewis and Co., London, 1831,reprinted by Genealogical Publishing Co., Baltimore 1996; Samuel Lewis, Samuel Lewis and Co.,London, 1831, reprinted by Genealogical Publishing Co., Baltimore 1984; Samuel Lewis, ATopographical Dictionary of Scotland, Samuel Lewis and Co., London, 1851, reprinted by GenealogicalPublishing Co., Baltimore 1989.
181
The attempts to sort out identity were not always successful and in some instances an
incorrect conclusion may have been drawn. However, general statements can be
made. Previous analyses suffered from the same problems and those conducted prior
to digitization had fewer resources to resolve issues than are currently available.
[Tables 6.8 to and 6.11]
The Assessment of Urban/Rural Status
The origin of the criminal and his distance from place of origin have been used by
Robson to comment on his character, not only as an urbanite or otherwise, but on the
extent to which he may have been a professional criminal, an opportunist or a victim
of the times. Yet, identification of the rural/urban status of offenders, that is, whether
they were town or village dwellers or from isolated areas in the countryside, is
problematic.23 Sometimes a county is nominated as a ‘native place’ and at other
times a more specific locality, such as a town, is given. But, as observed by Robson,
even non-industrialized counties had some urban development. Thus outside the
great urban centres, the identification of the county is inadequate to make a
determination. While Robson acknowledged the difficulties posed by the urban/rural
classification, he nevertheless described convicts according to an overall assessment
of the extent of industrialization of the particular counties of trial. In this thesis,
Samuel Lewis’s A Topographical Dictionary of England (1831), A Topographical
Dictionary of Ireland (1837) and A Topographical Dictionary of Scotland (1851)24
were used to assess the urban/rural character of both the place of origin and place of
trial.
In coming to a decision on the rural or urban character of an individual a number of
rules were adopted. Firstly, if the place of origin was given as a county, rather than a
town, this was interpreted as being a strong, but not conclusive, indicator that the

Chapter Six: The Western Road Convict Population
25 It could equally be argued that New South Wales transportees, by definition, were not successfulcriminals, and therefore that they may have attempted their crimes in non-urban settings.
182
person had rural origins. Secondly, a threshold population of 5000 was set to
distinguish an urban from a rural place. Thirdly, where there were a number of places
with the same name, the one closest to the place of trial was identified as the place of
origin. To refine Robson’s analysis a process of ‘triangulation’ was employed to
ameliorate some of the limitations imposed by the gross data. The occupation and
age of the offender, the crime and whether the trial was in the person’s county of
origin or adjoining county were considered in association with Lewis’s description of
the place.
While some crimes, such as picking pockets or street robbery, which needed a crowd
to be successfully implemented,25 may lend themselves to a largely urban
classification, country fairs were also places that picking pockets or shoplifting
might occur. Robson also noted that urban offenders were known to make marauding
raids in the country so that a crime that may appear to have all the hall marks of an
offence of a rural habitue� may in fact be that of an urbanite or urban fringe dweller
who occasionally worked as a rural labourer and occasionally and/or
opportunistically committed crimes in the country.
On occasion a person’s occupation, the nature of the crime and place of trial have
lead to a rural classification, when if assessed only against the population of the
place of origin an urban assessment would have resulted. When only either the
county of origin or trial was identified, rather than both, the nature of the crime and
the general character of the identified county, such as Lancashire for example, led to
a classification like Robson’s, of urban. Where a reasonably confident estimation
could not be made, for example, when the occupation and/or the crime cast doubt on
a classification the category, ‘undecided’ was chosen. Where there was insufficient
information to decide the category, ‘unknown’ was chosen.
Chapter Six: The Western Road Convict Population
26 Stephen Nicholas and Peter Shergold, ‘Convicts as Migrants’ in Nicholas op. cit., p.54.183
Mobility
An assessment of the proximity of the places of trial to the place of origin has been
undertaken to assist in forming a view of the degree of mobility of the convicts prior
to their transportation. [Table 6.12] The analysis needs to be viewed with a degree of
caution due to the uncertainty of the exact distances involved when only a county
name is provided, rather than a specific town or locality. Robson’s data simply
juxtaposes counties of trial with counties of origin with conclusions in gross terms
drawn on the numbers tried in their home county or otherwise. This interpretation,
which can imply degrees of mobility, makes no provision for persons living on or
near county boundaries and has the potential to falsely contribute to a perception of a
marauding, mobile criminal class. For example a person from Greenwich in Kent
tried in Southwark in Surrey, or a Southwark person tried in the counties of London
or Middlesex or Surrey, under this methodology would contribute to a perception of
mobility, yet the localities in reality are separated by a short walk. In this thesis,
where these circumstances have been recognized, they have been treated as if the
counties of origin and of trial are one and the same. Robson’s analysis implies that
people not tried in their county of origin were either criminal itinerants or had
migrated with criminal intent. Yet, on conviction, a place may have been the home of
a person for many years or it may not. In the absence of statistical surveys other than
those done on the indents by Robson and Nicholas and Shergold, we simply do not
have the evidence to make such assumptions.
All the research in this area by the known authorities has a speculative element.
These speculations need to be more strongly acknowledged than the usual
unobtrusive caution embedded in the text when a particular claim is asserted and
then largely disregarded in the subsequent discussion. Nicholas and Shergold, for
example, acknowledge that their measure of mobility is crude because of its potential
to underestimate mobility. They have assumed that convicts were tried in their
county of residence and are unable to take into account intra-county mobility.26 They

Chapter Six: The Western Road Convict Population
27 Ibid.,p.55.28 Stephen Nicholas and Peter Shergold, ‘Convicts as Workers’ in Nicholas, op. cit., pp.64-66.
184
have nevertheless produced a (superficially) authoritative chart of the distances
people moved. The indent data does not allow the precise measures implied by their
Table 4.427 because of the difficulty of ascertaining to where in a county a person
may have migrated.
Nevertheless, even data which has a wide range of interpretations can enable the
historian to make claims based on the possible scenario at the extremes of the range.
While there may be a wide variance in the specifics, in general such assessments can
still fulfil a useful function, while recognizing the limitations of scope. Accordingly,
in this thesis a general measure has been used which merely identifies trends.
Occupational Crime
The data has also been analysed to determine if there exists a relationship between
the crime and a person’s occupation. Six categories were employed in the analysis:
‘Not Related’, ‘Unlikely’, ‘Possibly’, ‘Highly Likely’, ‘Related’, and ‘Undecided’.
This enables a wide range of alternatives to be considered, from the highly
conservative to the all embracing. At the extremes, the decisions are relatively
straight forward but consistency in the mid range classifications, particularly the
‘Possibles’ and the ‘Unlikelies’, is difficult to achieve. Nicholas and Shergold
acknowledged the difficulties presented by the indent data in relating the crime to the
employment. They defined work-related theft to be stealing tools, stealing goods and
stealing from the worker’s master/employer. Tools included job specific equipment
and thefts described as ‘tools’ on the indent.28 In this thesis such thefts have been
similarly defined. It was classed as being ‘possibly’ related in cases where an
occupation made an opportunity for theft available, such as a glazier or tradesman
who committed burglary where the victim may have been a client or employer. In
such an instance the crime may have arisen not only because of an opportunity
presenting itself but because it may also relate to the employer-employee

Chapter Six: The Western Road Convict Population
185
relationship. The category ‘unlikely’ is for that class of crimes which could only
remotely and with a stretch of imagination be linked to an offender’s occupation or
employment. ‘Highly Likely’ categorizes crimes such as the theft of a sheep by a
ploughman where it is not indicated that the theft was from an employer and not
from a specific trade, ie a shepherd, but is from the same industry or an allied
occupation. The ‘Not Related’ categorization covers those crimes for which a
connection cannot be found. The results of this analysis should only be considered in
the most general vailidity because of the shortcomings of the indent data and thus the
necessary guesswork in the classification. [Table 6.13]
Degree of Criminality
The use of raw data referring to the gross number of prior convictions is another
reasonably blunt instrument in assessing the degree of criminality of a population.
The indent data only occasionally gives the nature of the prior sentence but indicates
the number of known prior sentences. The few known former sentences range from a
few days to 14 years. Using the gross data, some convicts with two or three minor
convictions with trifling sentences could appear more criminal than someone who
had a single prior sentence of several years.
Nationality
The nationality of the convict was usually inferred from the place of origin and place
of trial data in the indent. When it was not clear an assessment was made based on
the name and at other times on the origin of the majority of other convicts on the ship
on which he arrived.
The Analysis
The Innocents (in a relative sense)
The most promising group of convicts from the Western Road against which the
‘convict as victim’ thesis can be tested are the 57% of property offenders who
received the minimum seven year sentence. [Table 6.4] Fifty-nine per cent of this
Chapter Six: The Western Road Convict Population
29 Robson, op. cit., Table 6(b) p.193.30 Governor Darling to Right Hon. W. Huskisson, 28 March 1828, HRA, Series I, Vol. XIV, The LibraryCommittee of the Commonwealth Parliament, Sydney, 1922,p.69-72. 31 Robson, op. cit., Chapter Three and p.179.
186
least offensive group had no prior convictions on transportation to New South Wales.
This is a much greater proportion than the 24% of all offenders against property
(including more serious offenders with lengthier sentences) found by Robson.29
Robson’s sample had a high non-response rate (39% compared to 3% in this sample)
and his inclusion of serious offenders contributed to the relatively low proportion of
first offenders in his analysis, whereas this Western Road group excludes those with
life and 14 year terms. Such a large difference, however, in the context of the
recidivist Western Road population whom Governor Darling referred to as ‘... the
very refuse of the whole Convict Population ... [being] “Double distilled
Villains”...’,30 lends support to the assertion that the general convict population of
New South Wales was likely to be composed of a greater percentage of lesser
criminals, who might be definable as victims in the terms of Wood and O’Brien than
was credited by Clark, Robson or Shaw.
Robson’s model of analysis has been employed, for comparative purposes, in the
discussion following. The most frequent categories of crime against property are
individually analysed, to ascertain if there were pockets or classes of criminals at
variance with the general convict population identified by Robson. Secondly,
characteristics that might lend weight to either the victim or the rogue convict
portrait are sought.
Drawing on Robson’s crime categorization model31 the top five property offences for
those sentenced to 7 year terms were:
& Larceny (other) 193& Theft of wearing apparel 69& Robbery 49& Burglary/housebreaking 41& Animal theft 35

Chapter Six: The Western Road Convict Population
32 Robson did not analyse his data for crime, sentence and nationality. See Ibid. Table 6(c) and Table 6(d)pp. 189; 194-195; 205.33 Ibid., Table 6(c), p.194.34 Ibid., p.36.35 Ibid., p.37.
187
Larceny
The crime of larceny involves, fraudulently and without the consent of the owner,
taking and carrying away property with the intent to permanently deprive the owner
of it. In this group there were several convictions for stealing food including bread,
cheese, herrings, fruit, pork, bacon and potatoes. But the quantities are not described,
so it is impossible to discern if the ‘heists’ were commercial undertakings, trifling
offences of necessity or the assertion of customary rights. Many thefts related to
cloth, jewellery, plate, money and lead, all of which were very saleable items. Unlike
Robson’s sample, of which the majority were tried in England, there were almost
equal numbers of English and Irish offenders.32 The proportion of larcenists with
seven year sentences in the Western Road recidivist population closely approximated
the proportion in Robson’s general population sample.33 This is an unexpected result,
as this less criminal offender category, compared to those with lengthier sentences,
was not expected to be so strongly represented in a population of recidivists.[Table
6.1, 6.4 and 6.14]
Like Robson’s sample they can be described, on the whole, as young single urbanites
with an average age of 22 over half of whom had prior convictions. Robson
concluded that 72%34 of larcenists were likely to have been in trouble previously and
led him to find that ‘... there is evidence that transportation was not a sentence passed
lightly or for the first offence unless it was a serious one’.35 The English urban
larcenists on the Western Road had, at 93%, a much higher rate of prior conviction
than Robson’s overall sample or his English sample. This figure goes some way to
explaining their standing as recidivists in New South Wales. They bear a strong
resemblance to the young urban thief profile. The Irish urbanite’s rate of prior
conviction at 7% is much lower than Robson’s findings for the Irish and is
extraordinarily low for a population that is defined as habitually criminal. Unlike
Chapter Six: The Western Road Convict Population
36 Ibid., Table 5(b), p.189.37 Ibid., p.24.38 Ibid., Table (5h), p.191.
188
Robson’s Irish profile of older, married and rural in character, they resemble young
urban victims of a harsh justice system.36 [Tables 6.2, 6.3, 6.4, and 6.14]
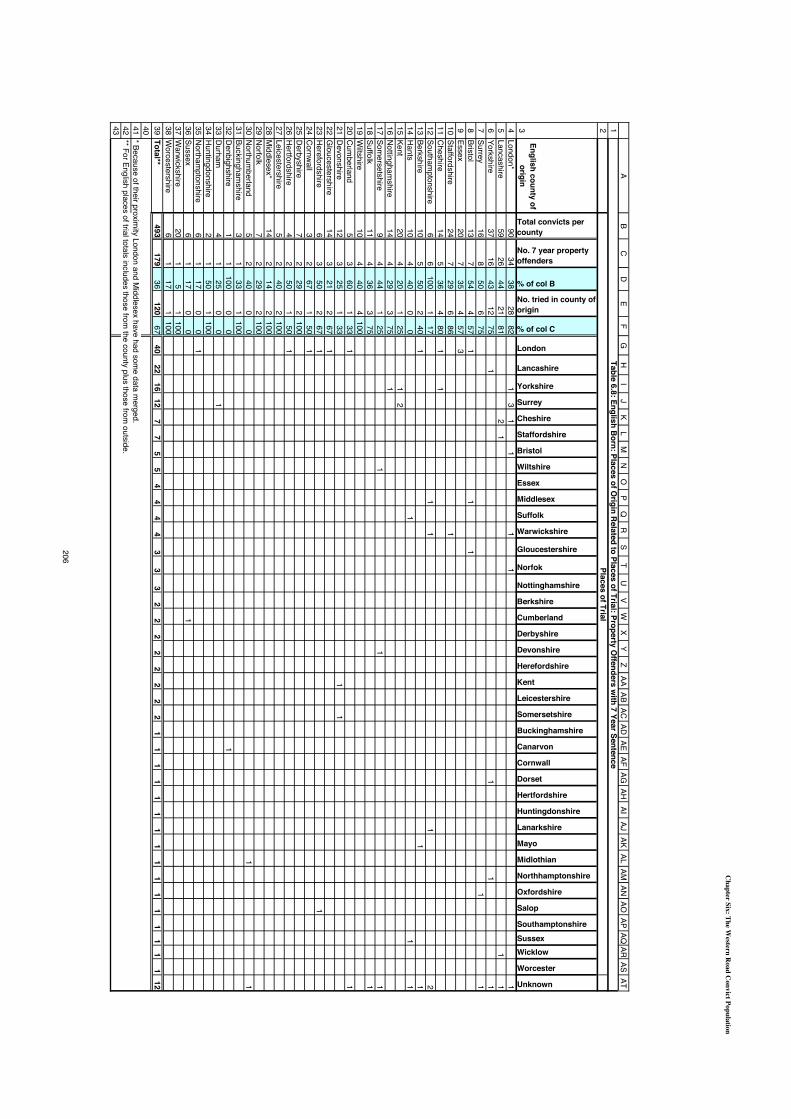
Robson found a third of convicts tried in rural counties had been born outside their
county of trial and concluded that some of these ‘... made a profession of preying on
the countryside, for a large proportion of rural crime was committed by migrant
depredators...’37 In the Western Road sample a greater proportion of English urban
larcenists (74%) were tried in their county of origin than in Robson’s overall sample
(64%).38 In the urban and industrialized counties, property offenders in general that
were tried in their county of origin formed a very large majority, for example, 82%
from London and 81% from Lancashire. Of the English urban larcenists who were
not tried in their county of origin, a substantial proportion were tried in adjoining
counties with similar economic features, possibly brought there by prospects of
employment, for example, a weaver who went from Yorkshire to Manchester. About
half were from regional areas but were convicted in London. Only one appeared to
be a migrant from London to the regions (a baker/tailor who was arrested in
Warwick) and only three had moved a great distance across the country. Most seven
year larcenists did not move far from their county of origin; aside from the capital, an
adjoining county was the location of choice. The data suggests that in England, aside
from movement from the regions to the capital, migration across the country or from
the capital to the regions was rare and there is no evidence of the professional urban
depredators referred to by Robson. The analysis of the seven year English larcenists
reveals a more sedentary young urban population than found in the general convict
population by Robson. [Tables 6.8, 6.12 and 6.14]
The Irish larcenists are distinguished from their English counterparts by their greater
mobility with a larger proportion than the English tried away from their county of
origin. Five were tried in Britain and almost a quarter were inter-regional migrants,

Chapter Six: The Western Road Convict Population
39 This figure excludes those who were adjacent to the capital and were tried there. They have beenincluded in the regional to capital figures.40 Robson, op. cit., p.194.
189
being tried a considerable distance from their home county. Thirty per cent were
tried in an adjacent county and39 eight per cent were migrants from the capital to the
regions, providing some evidence of urban individuals raiding the countryside that
was not apparent in the English data. The Belfast groom who stole potatoes in
County Down and the Dublin gunsmith who stole seals in County Tyrone may be
examples of this type of criminal. The 22 year old pedlar from Drogheda in Louth
County who was convicted of stealing linen in Longford, even without a prior
conviction, might qualify as shiftless. With most Dubliners tried in Dublin there is
only very limited support in this data for the existence of urban thieves preying on
the countryside. Whereas 50% of the English not tried in their county of origin were
tried in London, among the Irish the figure for those who migrated from the regions
to Dublin is only 24% and of these a number fit the ubiquitous urban thief profile. As
Robson found, the overwhelming majority of offences were opportunistic and, with
pick pockets alone counting for almost half, perpetrators on the lookout for
opportunities are a substantial proportion. There are various individuals who could
be classed as either ‘victim’ or ‘feckless thief’. The degree of Irish mobility and the
nature of many of the crimes in the context of the extreme poverty in Ireland during
the period, lend support to the view that many of these crimes were driven by want.
On conviction, the Irish were treated harshly. [Tables 6.10, 6.12 and 6.14]
Theft of Wearing Apparel
Clothing thieves under seven year sentences are over represented on the Western
Road in comparison to Robson’s sample.40 Individual items stolen included a coat
and shoes, a shawl, a cape, scarf, trousers and a waistcoat. It is possible that these
items may have been associated with want or personal need. However, there is
evidence suggesting that many items were stolen for sale rather than personal use, for
example, the 17 year old London errand boy, the 41 year old labourer and an 18 year
old blacksmith’s apprentice (all single), who were convicted on separate occasions of

Chapter Six: The Western Road Convict Population
41 Robson, op. cit., p.194190
stealing a gown, an unlikely but not inconceivable personal item. The majority of the
offence descriptions in the indents were expressed in generalised terms of quantity
such as ‘stealing clothes’, ‘feloniously stealing clothes’ and ‘stealing clothes and
money’. In this category the description of the items more often than not appears in
the plural leading to the suspicion that the thefts were for on-selling and therefore
likely to be a more regular activity because of the knowledge and skill required to
pass on, ‘fence’, the items and thus involve criminal association. The majority were
young single urbanites more than half of whom were English. The small total sample
does not hold much meaning except that there is a continuation of the same trend of
greater mobility among the Irish as was evident among the larcenists. Some 83% of
the urban English were tried in their county of origin and, although sedentary, were
more likely to have been previously convicted than the Irish. There is no evidence of
a roving criminal class of thieves of clothing. [Tables 6.2, 6.3, 6.4, 6.12 and 6.14]
Burglary and Robbery
The crime of burglary is distinguished from robbery in that it involves unlawfully
entering a house or building to steal property usually at night, whereas robbery is
stealing property either from the victim’s person or from the immediate control and
presence of the victim. Burglars and robbers with seven year sentences are
proportionally higher in the Western Road population than in Robson’s sample.41
[Table 6.4] The lack of details for the crimes of burglary and robbery precludes
comment based on the type of item stolen for either of these categories and inhibits
the analysis. The group consists of 37 English and 46 Irish offenders with the
English showing a marked preference for burglary over robbery (3:2) and the Irish,
the reverse, committing robberies rather than burglaries at a rate of almost 3:1. The
majority (88%) were urbanites with no prior convictions and the Irish with fewer
prior convictions than the English.[Tables 6.5, 6.14, 6.15 and 6.16] Of the English
with a pre-existing criminal record, ten had two prior convictions, one had three and
three had one. Where the terms are indicated the sentences are short, ranging from

Chapter Six: The Western Road Convict Population
191
two to six months. Overall, seven year terms were awarded in only 28% of English
convictions for burglary and robbery. [Tables 6.2 and 6.5] While the seven year
sentence for a thrice convicted English 14 year old may have been an act of leniency
due to his youth, the explanation for the relatively light seven year sentences for
these re-offenders may lie in the fact that their former offences were relatively minor,
or it may not. The data does not tell us.
As with the preceding groups there is scant evidence among the burglars and robbers
for a mobile professional class of thieves. Of the English who were tried outside their
home county, three were tried in adjacent counties and two had moved from the
regions to the capital. Overall the sample is too small to make meaningful comment
but this Irish group with a higher rate of trial in the county of origin shows less
mobility than their countrymen in other major property crime categories. [Table
6.12]
Animal Theft
Animal thieves are represented on the Western Road in a proportion which
approximates Robson’s findings.[Table 6.1] The sample is small, consisting of 12
English and 22 Irish offenders. The quantities of animals stolen are not supplied but
small animals such as sheep, geese, pigs and fowls were the main (culinary?) choice.
A majority had no prior convictions, indeed the lowest proportion of any category.
[Table 6.15 and 6.16] There is no distinction in the rate of conviction between the
English and the Irish. The offenders were largely single rural people with once again
the English more likely to be tried in their county of origin, but in this sample, the
Irish who were not tried at home were all tried in an adjacent county, a situation
quite different to that of the other Irish crime groups. Another distinction between
the English and the Irish is an age disparity with the Irish on average 5 years older
and more likely to be married than the more youthful 20 year old English country
boys.
Chapter Six: The Western Road Convict Population
192
The Relationship Between Crime and Occupation of the Seven Year Property
Offenders
The aim of this analysis is not so much to confirm the convicts’ occupational and
skill claims, as did Nicholas and Shergold, but rather to form an opinion on
Ignatieff’s statements concerning the assertion of rights discussed in Chapter Two. A
filtering of all seven year property offences against the occupations of the offenders
indicates that the majority (59%) bear no relationship or an unlikely relationship to
their employment or occupation. In these instances it was difficult to see any
connection between the person’s employment and the crime. Very few crimes (5%)
can definitely be said to be employment related. Only when the ‘highly likelies’ and
the ‘possibles’ are included does the figure reach 38%. This result is partly due to the
limited information provided by the indents. Taking a very broad and inclusive view
more than a third could be attributed to employment with the figure slightly higher
for the Irish than the English. [Table 6.13]
The crimes identified as employment related have the potential for customary rights
or industrial and employment issues between the convict and his employer to have
been an influencing factor. Examples include an attorney’s clerk convicted of
stealing books, butchers’ convicted of stealing meat or animals, domestic servants
convicted of stealing clothes or household items, farm workers of stealing animals or
cheese, textile workers of stealing cloth or clothes or a stableman or soldier of
stealing boots. Some offenders were in occupations that provided the access and
means to undertake crimes, suggesting an opportunistic character to the crimes and
the criminals, for example, a porter, who stole a carpet or tailors who stole clothing.
The majority of offences have no relation to a person’s occupation in terms of
employees seeking retribution or the employment providing the opportunity. Of
those that were employment related, while undoubtedly some instances were simply
thefts, others could be related to the taking of cast off, redundant or worn items, or
off cuts from the manufacturing process, or as some sort of penalty or pay back

Chapter Six: The Western Road Convict Population
42 Michael Ignatieff, A Just Measure of Pain, The Macmillan Press, London, 1978, pp.179 -180; 182-184.193
extracted by workers who were otherwise powerless to seek redress for grievances.
But the majority of offences appear to be opportunistic rather than the assertion of
rights. However, this is very difficult to assert with any certainty on the basis of the
indent data. Although the majority came from an urban background, the data does
not suggest the majority came from a criminal underworld.
The Character of the Seven Year Property Offenders
In the 1820s, when the majority of these offences were committed, crime was
considered to be largely a rural problem due to a breakdown in traditional rural
economic relationships. There was also recognition of a breakdown in master-servant
relationships in the manufacturing district. Evidence before the 1826 Committee on
Criminal Committals indicated that the increasingly casual mode of employment for
rural labourers was a cause of crime arising from enclosing common land,
consolidating tenancies and evicting cottagers. As a result many young men who
were no longer accommodated by their employer were forced to become itinerant,
following seasonal work.42 Of this sample population only 16% of crimes have been
identified as being the acts of a rural person. [Table 6.14]
Overall, the analysis of property crimes for which 7 year sentences were awarded
reveals that, contrary to expectations, there is little evidence of the existence of a
mobile class of urban thieves either in England or Ireland, with the English being
particularly sedentary. Many of the offences are opportunistic rather than
professional. While the Irish were slightly more rural or regional in character than
the English, they, like the English, were predominantly urban, with a much lower
rate of prior conviction than the English. [Table 6.14] The Irish were much less
likely to steal wearing apparel or commit burglaries. Irish offenders dominate in one
category only - animal theft. As to their status as victims, the Irish from this sample
are more likely to qualify than the English. There is also evidence that a number of
Chapter Six: The Western Road Convict Population
194
convictions were for trifling crimes particularly in the larceny category. Some in the
animal theft category could be argued to have been acting from want.
It could reasonably be expected that the Western Road recidivist population would
have a greater history of criminality than the general convict population. Yet, among
the English animal and clothing thieves and burglars and robbers, even after allowing
for a doubling of the prior conviction rate, some 40 % of this group, could be viewed
as having been harshly treated as first offenders. This treatment may have lead them
to become recidivists. The data raises the possibility that these trifling offenders
became hardened criminals due to their New South Wales’ penal experience. The
disproportionate number of Irish larcenists with seven year terms, 60% of whom had
no prior convictions, [Table 6.16] among the recidivists on the Western Road raises
a number of questions. Does it imply, for example, that English larcenists were better
at keeping out of trouble once they arrived in New South Wales? Could it imply that
the Irish were more embittered by the experience of servitude and became more
criminal after their arrival in New South Wales? Or does this disproportionate
number of Irish larcenists suggest firstly that the Irish were treated more harshly in
the justice system in the United Kingdom where Irish first offenders were more
likely to be transported? Secondly, in New South Wales, where their masters were
largely British, were they more likely to be subject to secondary punishment than
their British counterparts?
Serious Offenders
On the assumption that longer sentences were passed for the more serious or
recidivist offenders it is a reasonable assumption that these criminals would fit the
profile described by Clark, Robson and Shaw. In a test of this assumption, the 298
convicts who arrived in New South Wales under 14 year or life sentences for crimes
against property were analysed in a similar fashion to those under the minimal
sentence. The group make up 41% of property offenders identified on the Western
Road, a larger proportion than found in Robson’s general population. [Table 6.1]

Chapter Six: The Western Road Convict Population
43 Robson op. cit., Table 6(b),p.193.195
This outcome conforms to expectations of recidivist criminals continuing to indulge
their criminal propensities in New South Wales. However, anomalously, a
substantially larger proportion than Robson’s population had not been previously
convicted prior to their transportation to New South Wales.43 Although this was to a
lesser degree than those with seven year sentences this finding lends further support
to the view that, if the worst of the Western Road recidivists, who have a particularly
bad reputation in the literature, had so low an incidence of prior conviction, then the
general convict population could be expected to have consisted of an even greater
proportion of first convictions. Transportation for life for such a group appears to be
a harsh sentence.[Tables 6.15 and 6.16]
The larcenists with 14 year and life sentences are also on average six years younger
than Robson’s sample. A major difference between this group and those under a 7
year sentence is that the Irish are a very small component, in fact the sample is so
small that it cannot be meaningfully analysed. The group under discussion here is
English, urban and single with a prior conviction rate of 91%, closely matching the
seven year English urban larcenists in this respect and like them, well above the
average of any other sample populations. Another notable difference is that rather
than the almost entirely sedentary population that the English lesser offenders
presented, almost half were tried outside their county of origin. There is a great deal
more movement in this group, inter-regionally and from the capital to the regions.
Very few clothing thieves received life sentences, the sample here being too small
for analysis. The burglars and robbers are another youthful group who are over
represented on the road compared to Robson’s general population. Their
characteristics mirror those of the larcenists except in two important respects. Firstly
their prior conviction rate is less than one third and there is a sizeable minority of
Irish offenders, but the English outnumber the Irish at a rate of 2:1. Secondly, the
English of this group are more mobile than other groups, but the Irish are not. Both
are demonstrating in this respect the opposite characteristics of their countrymen

Chapter Six: The Western Road Convict Population
44 Ignatieff, op. cit., pp.15-19; 154-166.45 Hamish Maxwell-Stewart, op. cit., p.53.
196
with 7 year sentences. [Table 6.12 and 6.17] Crimes committed by this group are
more likely to be employment related, the range being 12% that could definitely be
attributed, rising to 18% including the ‘Highly Likely’ and 44% including the
‘Possibles’. The English had a greater tendency to commit work related crime than
the Irish. [Table 6.13]
The variations in sentencing severity, for example, the pick pockets with no former
convictions who received either life or seven years, with a few sentenced to 14 years,
supports the views put forward by Ignatieff of the reluctance in some instances to
prosecute to the extent indicated by the legal code, a trend evident in the late
seventeenth and the first third of the eighteenth century.44 The decisions seem
difficult to explain using the data available for this study. Age does not appear to be
a factor and all the convictions (whatever the severity) date from the mid 1820s. It
should also be kept in mind that the demographic of this study is one of recidivists
who continued to offend and re-offend in the Colony. One could mount a case that
they were ‘bad eggs’ to start with, or alternatively, the system converted them to
hardened, embittered criminals incapable of integration into a civil and free society.
Hamish Maxwell-Stewart in 1990 followed up on the Convict Workers research in
his examination of another convict subset with a particularly negative reputation.
Based on the criteria adopted by Nicholas and Shergold, 335 Tasmanian bushrangers
were found to compare ‘favourably with general assessments of the convict
population’. Members of this group had arrived in Australia in their most productive
years, unencumbered by dependents and in good health. Maxwell-Stewart rejected
that they were a population drawn ‘from a residuum of nineteenth century
undeserving poor’.45 He concluded that they were neither innocent victims nor
professional criminals, but workers who casually engaged in crime, if the
opportunity and/or the need arose, to supplement wages rather than replace them.
Chapter Six: The Western Road Convict Population
46 Ibid.. pp. 49;52.47 Ibid., p.53.48 Ibid., p.54.
197
Partly on the basis of what he termed a ‘high’ level of work related crime (12%),
Maxwell-Stewart found, like Nicholas and Shergold, that they were, ‘In short ...
“convict workers”’.46 The findings of this thesis largely concur with those of
Maxwell-Stewart.
However, it is difficult to accept Maxwell-Stewart’s denouement that, with few
having dependents, there was ‘a strong indication that their integration into colonial
society was a comparatively efficient and painless process’. 47Clearly it was not.
These bushrangers, like many on the Western Road, came to attention because they
lived outside the law, attacking the society they had been brought into. Nearly 40%
were publicly executed, another seven were shot at large and the remainder in
Maxwell-Stewart’s words, ‘spent long unproductive years labouring in the penal
settlements at Newcastle, Macquarie Harbour, Port Arthur and Norfolk Island’.48
This last statement is also particularly difficult to accept given that the value of
convict labour to the colony is central to the convicts as workers thesis. While work
at the harsher penal settlements or on the Western Road may or may not have been as
productive as elsewhere, it provided a considerable economic benefit to the colony,
by opening up areas such as the Hunter, Port Macquarie, Moreton Bay districts and
the western plains of New South Wales.
This chapter has demonstrated that there is a great deal of broad concurrence with
Robson’s overall findings on the demographics between the two sample populations.
However, there is difference in the detail which leads to important differences in
interpretation of the statistics and ultimately the conclusions. For example, there is
very little evidence for the existence of a criminal class, with only a few individuals
located who might be used to illustrate the criminal class profile as portrayed by
Clark, Robson and Shaw. While this thesis does not find a majority of crimes that
lead to transportation were employment related, other indices did not support the

Chapter Six: The Western Road Convict Population
198
professional criminal thesis of Clark, Robson and Shaw. It has been concluded that
the criminal activity was opportunistic, rather than professional, although some were
likely to have stolen habitually. With some exceptions, the Western Road recidivists
were young, urban and single and on arrival in New South Wales were relatively less
experienced as criminals than Robson’s population. The English presented as a
particularly sedentary population, a different finding to that of Nicholas and
Shergold. Persons 18 years and under make up 30% of the Western Road property
offenders and most were from an urban environment. Overall the data suggests that
the convicts were workers, opportunists and some were the victims of a harsh penal
code. The following chapter will examine their skills and experience as workers on
the Western Road.
Tables
Chapter Six: The Western Road Convict Population
12345678910111213
1415161718192021
222324252627282930313233343536373839404142434445464748495051525354555657
A B C D E F G H I J
Types of Offences No. %* No. % * No. % * No. % *Offences Against Property
1 Larceny (other) 268 34 1052 35 1065 39 2117 372 Burglary; Housebreaking, 139 18 460 15 447 16 907 163 Animal Theft 78 10 488 16 325 12 813 144 Robbery 105 13 297 10 105 4 402 75 Theft of Wearing Apparel 87 11 161 5 218 8 379 76 Receiving/Possession 11 1 58 2 39 1 97 27 Robbery with Violence 3 0 32 1 36 1 68 18 Wilful Destruction 5 1 19 1 30 1 49 1
9Stealing by a Trick/Swindling/ False pretences 4 1 21 1 20 1 41 1
10 Forgery 4 1 15 0 20 1 35 111 Embezzlement/Bad Notes 5 1 19 1 15 1 34 112 Poaching 1 0 12 0 11 0 23 0
710 91 2634 87 2331 86 4965 87
Offences of a Public Nature13 Coining; uttering 2 0 78 3 43 2 121 2
14Ribbonism, Combination, Unlawful Oaths 2 0 36 1 1 0 37 1
15 Riot/Insurrection 1 0 14 0 17 1 31 116 Treason 0 0 14 0 3 0 17 017 Perjury 0 0 5 0 9 0 14 018 Sacriledge 2 0 4 0 7 0 11 019 Bigamy 0 0 5 0 5 0 10 020 Smuggling, Firearms 1 0 2 0 2 0 4 0
8 1 158 5 87 3 245 4
Offences Against the PersonMurder; manslaughter 8 1 48 2 33 1 81 1Assault (other) 5 1 42 1 38 1 80 1Rape 1 0 17 1 8 0 25 0Kidnapping/Abduction 0 0 9 0 0 0 9 0Other sexual offences 0 0 1 0 2 0 3 0
14 2 117 4 81 3 198 3
26 Military Offences 31 4 70 2 85 3 155 3
Other Offences27 Theft, habit and repute 1 0 2 0 92 3 94 228 Vagrancy etc 8 1 33 1 11 0 44 129 Threatening letter 1 0 6 0 39 1 12 030 Returning from Transportation 3 0 0 0 0 0 0 031 Unspecified felony 2 0 0 0 0 0 0 0
15 2 41 1 142 5 150 3
Not Recorded 330 379 379 418
Total of known crimes 778 100 3020 100 2726 100 5713 100
Total known convicts 1108
Table 6.1: Offences of Western Road Recidivists Compared to Robson's Population
* Calculated on percentage of known offences rather than total number of convicts; ** It is possiblethat some of the Western Road recidivists were part of Robson's random sample.It is impossible toknow how many, but it is likely to be a very small figure.
Crime Category No.
Western Road
Robson - NSW
Robson - VDL
Robson - Totals
199

Chapter Six: The Western Road Convict Population
12
345678910111213141516171819
2021222324252627282930313233343536373839404142434445464748
A B C D E F G H I J
Types of Offences
Crime Category No. Offences Against Property 7
year
s
% o
f I
14 y
ears
% o
f I
Life
% o
f I
Tota
l O
ffenc
es
% o
f I15
1 Larceny (other) 93 64 23 16 29 20 145 382 Burglary; Housebreaking, 23 25 15 16 55 59 93 243 Animal Theft 12 28 9 21 22 51 43 114 Robbery 14 36 4 10 21 54 39 105 Theft of Wearing Apparel 38 75 9 18 4 8 51 136 Receiving/Possession 1 33 1 33 1 33 3 17 Robbery with Violence 0 0 1 100 0 0 1 08 Wilful Destruction 0 0 1 33 2 67 3 19 Stealing by a Trick/Swindling/ F 2 100 0 0 0 0 2 1
10 Forgery 0 0 0 0 1 100 1 011 Embezzlement/Bad Notes 0 0 0 0 1 100 1 012 Poaching 0 0 1 100 0 0 1 0
183 48 64 17 136 36 383 100
Offences of a Public Nature13 Coining; uttering 0 0 0 0 1 100 1 100
14Ribbonism, Combination, Unlawful Oaths 0 0 0 0 0 0 0 0
15 Riot/Insurrection 0 0 0 0 0 0 0 016 Treason 0 0 0 0 0 0 0 017 Perjury 0 0 0 0 0 0 0 018 Sacriledge 0 0 0 0 0 0 0 019 Bigamy 0 0 0 0 0 0 0 020 Smuggling, Firearms 0 0 0 0 0 0 0 0
0 0 0 0 1 100 1 100
Offences Against the Person21 Murder; manslaughter 0 0 0 0 2 100 2 10022 Assault (other) 0 0 2 67 1 33 3 15023 Rape 0 0 0 0 0 0 0 024 Kidnapping/Abduction 0 0 0 0 0 0 0 025 Other sexual offences 0 0 0 0 0 0 0 0
0 0 2 40 3 60 5 100
26 Military Offences 4 31 9 69 0 0 13 100
Other Offences27 Theft, habit and repute 0 0 0 0 0 0 0 028 Vagrancy etc 0 0 0 0 0 0 0 029 Threatening letter 0 0 1 100 0 0 1 10030 Returning from Transportation 0 0 2 67 1 33 3 100
0 0 3 75 1 25 4 100
Not Recorded 26 29 77 132
Total of known crimes 187 46 73 18 141 35 406 100
Table 6.2 English Crimes and Sentences
200

Chapter Six: The Western Road Convict Population
12
3456789
1011
121314151617181920212223242526272829303132333435363738394041424344454647484950
A B C D E F G H I J
Types of Offences
Crime Category No. Offences Against Property 7
year
s
% o
f I
14 y
ears
% o
f I
Life
% o
f I
Tota
l%
of
Tota
ls
1 Larceny (other) 90 90 6 6 4 4 100 392 Burglary; Housebreaking, 13 45 1 3 15 52 29 113 Animal Theft 22 73 1 3 7 23 30 124 Robbery 33 58 0 0 24 42 57 225 Theft of Wearing Apparel 26 100 0 0 0 0 26 106 Receiving/Possession 2 50 1 25 1 25 4 27 Robbery with Violence 0 0 0 0 2 100 2 18 Wilful Destruction 0 0 0 0 1 100 1 0
9Stealing by a Trick/Swindling/ False Pretences 2 100 0 0 0 0 2 1
10 Forgery 0 0 0 0 2 100 2 111 Embezzlement/Bad Notes 1 33 2 67 0 0 3 112 Poaching 0 0 0 0 0 0 0 0
189 74 11 4 56 22 256 100
Offences of a Public Nature13 Coining; uttering 0 0 0 0 0 0 0 014 Ribbonism, Combination, Unlawful Oaths 0 0 1 100 0 0 1 3315 Riot/Insurrection 0 0 0 0 1 100 1 3316 Treason 0 0 0 0 0 0 0 017 Perjury 0 0 0 0 0 0 0 018 Sacriledge 0 0 0 0 0 0 0 019 Bigamy 0 0 0 0 0 0 0 020 Smuggling, Firearms 1 100 0 0 0 0 1 33
1 33 1 33 1 33 3 100
Offences Against the Person21 Murder; manslaughter 3 50 0 0 3 50 6 20022 Assault (other) 2 100 0 0 0 0 2 6723 Rape 0 0 0 0 1 9 11 36724 Kidnapping/Abduction 0 0 0 0 0 0 0 025 Other sexual offences 0 0 0 0 0 0 0 0
5 26 0 0 4 21 19 100
26 Military Offences 6 50 4 33 2 17 12 400
Other Offences27 Theft, habit and repute 0 0 0 0 0 0 0 028 Vagrancy etc 8 100 0 0 0 0 8 10029 Threatening letter 0 0 0 0 0 0 0 030 Returning from Transportation 0 0 0 0 0 0 0 0
8 100 0 0 0 0 8 100
Not Recorded 24 3 34 61
Total of known crimes 209 70 16 5 63 21 298 100
SentencesTable 6.3: Irish Crimes and Sentences
201

Chapter Six: The W
estern Road C
onvict Population
12345678910111213141516171819202122
AB
CD
EF
GH
IJ
KL
MN
OP
QR
Types of Offences (a)
1Larceny (other )
19372
10655
3714
1130
3714
2259
26838
13952
2Burglary; Housebreaking,
4129
2254
2518
1456
7252
4968
13920
8662
3Anim
al Theft35
4529
8310
134
4029
3723
7978
1159
764
Robbery49
4735
714
42
5049
4737
76105
1575
715
Theft of Wearing Apparel
7182
3752
1011
440
56
00
8712
4046
6Receiving/Possession
764
457
218
2100
218
150
112
764
7Robbery with Violence
00
00
133
1100
267
2100
30
3100
8W
ilful Destruction0
00
01
201
1004
804
1005
15
1009
Stealing by a Trick/Swindling/ False pretences4
1002
500
00
00
00
04
12
5010
Forgery1
251
1000
00
03
752
674
13
7511
Embezzlem
ent/Bad Notes1
201
1003
603
1001
200
05
14
8012
Poaching0
00
01
1001
1000
00
01
01
100Totals
40257
23759
9413
4345
20429
14069
710100
42460
Offences
No priors
% col O
(a) Based on Robson's categorization; (b) Discrepancies in totals for sentences and total number of crim
es comm
itted is due to sentences in a few cases being unknown.
No priors
% col O
% col O
Crime
Category No.
Life
% col G
No priors
% col K
Offences
Table 6.4 Sentences for Crimes Against Property and Incidence of No Prior Conviction
14 Years7 Years
Offences
% col O
No priors
% col C
Totals
Offences (b)
% col O tota
202

Chapter Six: The W
estern Road C
onvict Population
123456789101112131415161718192021222324252627282930313233
AB
CD
EF
GH
IJ
KL
MN
OP
QR
ST
UV
WX
Crime/Nationality
Total no. of single or married offenders
No. Single
% of col B
Av. ageNo. singles with prior con.s
% of col C
No. urban singles
% of col C
No. rural singles
% of col CNo. single tried in county of origin
% of col C
No. married
% of col B
Av. ageNo. married with prior con.s
% of col N
No. urban married
% of col NNo. rural married
% of col NNo. married tried in county of
% of col N
EnglishLarceny
8974
8320
6486
6993
45
5574
1517
2912
8012
801
75
33Theft of wearing apparel
3533
9420
1752
2782
515
2576
26
220
02
1000
02
100Burglary and robbery
3634
9424
1441
3294
26
2162
26
371
502
1000
01
50Anim
al theft12
1192
202
183
277
646
551
836
00
00
1100
1100
All crimes against property (a)
174152
8720
9965
13086
4429
10569
2213
2916
7319
862
99
41
IrishLarceny
8976
8520
2837
6079
1013
4458
1315
284
3110
773
234
31Theft of wearing apparel
2621
8122
943
1781
15
1152
519
281
202
402
402
40Burglary and robbery
4639
8520
1128
2974
718
2872
715
331
145
710
03
43Anim
al theft21
1571
213
205
338
536
406
2930
00
117
467
467
All crimes against property (a)
187154
8220
5133
11373
2718
8857
3318
306
1820
619
2713
39
ScottishLarceny
107
7019
457
7100
00
114
330
312
673
1000
01
33Theft of wearing apparel
44
10022
375
4100
00
125
00
00
00
00
00
0Burglary and robbery
44
10022
250
375
125
375
00
00
00
00
00
0Anim
al theft0
00
00
00
00
00
00
00
00
00
00
00
All crimes against property (a)
2117
8121
1059
1694
16
635
419
343
754
1000
02
50
TotalsLarceny
188157
8420
9661
13687
149
10064
3116
4418
5825
814
1310
32Theft of wearing apparel
6558
8921
2950
4883
610
3764
711
251
144
572
294
57Burglary and robbery
8677
9022
2735
6483
1013
5268
910
352
227
780
04
44Anim
al theft33
2679
215
198
3115
5812
467
2133
00
114
571
571
All crimes against property (a)
382323
8520
16050
25980
7222
19962
5915
3125
4243
7311
1924
41
Table 6.5 Marital Status of Property O
ffenders with 7 Year Sentences
a) includes all crimes against property including sm
aller crime categories outside the top 5.
SingleM
arried
203

Chapter Six: The W
estern Road C
onvict Population
123456789101112131415161718192021222324252627282930313233343536
AB
CD
EF
GH
IJ
KL
MN
OP
QR
ST
UV
WX
Crime/Nationality
Total no. of single or married offenders
No. Single
% of col B
Av. age
No. singles with prior con.s
% of col C
No. urban singles
% of col C
No. rural singles
% of col CNo. single tried in county of origin
% of col C
No. married
% of col B
Av. ageNo. married with prior con.s
% of col N
No. urban married
% of col N
No. rural married
% of col N
No. married tried in county of origin
% of col N
EnglishLarceny
5247
9021
2247
3983
919
2553
510
322
404
801
202
40Theft of wearing apparel
1311
8519
873
1091
19
873
215
332
1002
1000
-2
100Burglary and robbery
9481
8621
2733
6074
1822
4353
1314
271
812
921
85
38Anim
al theft30
2583
2110
409
3615
6011
445
1728
0-
240
360
480
All crimes against property (a)
198172
8721
6940
12070
4727
8952
2613
295
1921
815
1913
50
IrishLarceny
1010
10021
660
990
110
440
00
00
00
00
00
0Theft of wearing apparel
00
-0
00
00
00
00
00
00
00
00
00
0Burglary and robbery
3935
9021
720
2366
411
1440
410
271
253
751
251
25Anim
al theft8
675
290
03
502
332
332
2524
150
2100
00
2100
All crimes against property (a)
6656
8522
1323
3766
1832
2036
1015
302
209
901
106
60
ScottishLarceny
99
10017
667
9100
00
667
00
00
00
00
00
-Theft of wearing apparel
11
10017
00
1100
00
00
00
00
00
00
00
0Burglary and robbery
1412
8619
542
1083
217
1083
214
320
02
1000
01
50Anim
al theft0
00
00
00
00
00
00
00
00
00
00
00
All crimes against property (a)
2722
8118
1150
2091
29
1673
519
331
205
1000
01
20
TotalsLarceny
7166
9320
3452
5786
1015
3553
57
322
404
801
202
40Theft of wearing apparel
1412
8618
867
1192
18
867
214
332
1002
1000
02
100Burglary and robbery
147128
8720
3930
9373
2419
6752
1913
432
1117
892
117
37Anim
al theft38
3182
2510
3212
3917
5513
427
1826
114
457
343
686
All crimes against property (a)
291250
8620
9337
17771
6727
12550
4114
318
2035
856
1520
49
a) includes all crimes against property including sm
aller crime categories outside the top 5.
SinglesM
arriedsTable 6.6: M
arital Status of Offenders w
ith 14 year and life Sentences
204

Chapter Six: The Western Road Convict Population
Age Range No %15 and under 59 616 to 20 406 4221 to 25 270 2826 to 30 125 1331 to 35 46 536 to 40 26 341 to 45 11 146 to 50 9 151 to 55 4 056 to 60 1 0Sample size 957 100
Table 6.7 Average Age of Western Road Recidivists on Transportation to NSW
205
Chapter Six: The W
estern Road C
onvict Population
12345678910111213141516171819202122232425262728293031323334353637383940414243
AB
CD
EF
GH
IJ
KL
MN
OP
QR
ST
UV
WX
YZ
AAAB
ACAD
AEAF
AGAH
AIAJ
AKAL
AMAN
AOAP
AQAR
ASAT
English county of origin
Total convicts per county
No. 7 year property offenders
% of col B
No. tried in county of origin
% of col C
London
Lancashire
Yorkshire
Surrey
Cheshire
Staffordshire
Bristol
Wiltshire
Essex
Middlesex
Suffolk
Warwickshire
Gloucestershire
Norfok
Nottinghamshire
Berkshire
Cumberland
Derbyshire
Devonshire
Herefordshire
Kent
Leicestershire
Somersetshire
Buckinghamshire
Canarvon
Cornwall
Dorset
Hertfordshire
Huntingdonshire
Lanarkshire
Mayo
Midlothian
Northhamptonshire
Oxfordshire
Salop
SouthamptonshireSussexWicklow
Worcester
Unknown
London*90
3438
2882
13
11
11
1Lancashire
5926
4421
812
11
1Yorkshire
3716
4312
751
11
1Surrey
168
506
751
1Bristol
137
544
571
11
Essex20
735
457
3Staffordshire
247
296
861
Cheshire14
536
480
11
Southamptonshire
66
1001
171
11
2Berkshire
105
502
401
11
Hants10
440
00
11
1Kent
204
201
251
2Nottingham
shire14
429
375
1Som
ersetshire9
444
125
11
1Suffolk
114
363
751
Wiltshire
104
404
100Cum
berland5
360
133
11
Devonshire12
325
133
11
Gloucestershire
143
212
671
Herefordshire6
350
267
11
Cornwall3
267
150
1Derbyshire
72
292
100Hertfordshire
42
501
501
Leicestershire5
240
2100
Middlesex*
142
142
100Norfolk
72
292
100Northum
berland5
240
00
11
Buckinghamshire
31
331
100Denbighshire
11
1000
01
Durham4
125
00
1Huntingdonshire
21
501
100Northam
ptonshire6
117
00
1Sussex
61
170
01
Warwickshire
201
51
100W
orcestershire6
117
1100
Total**493
17936
12067
4022
1612
77
55
44
44
33
32
22
22
22
21
11
11
11
11
11
11
11
112
* Because of their proximity London and M
iddlesex have had some data m
erged.** For English places of trial totals includes those from
the county plus those from outside.
Places of TrialTable 6.8: English Born: Places of O
rigin Related to Places of Trial: Property Offenders w
ith 7 Year Sentences
206

Chapter Six: The W
estern Road C
onvict Population
1234567891011121314151617181920212223242526272829303132333435363738394041
AB
CD
EF
GH
IJ
KL
MN
OP
QR
ST
UV
WX
YZ
AAAB
ACAD
AEAF
AGAH
AIAJ
AKAL
AMAN
AOAP
AQAR
ASAT
English county of origin
Total convicts per county
No. 14 year & life property offenders
% of col B
No. tried in county of origin
% of col C
London
Lancashire
Yorkshire
Surrey
Kent
Cheshire
Warwickshire
Northhamptonshire
Staffordshire
Bristol
Gloucestershire
Middlesex
Nottinghamshire
Devonshire
Essex
Inverness-shire
Norfok
Southamptonshire
Wiltshire
Derbyshire
Hertfordshire
Lincolnshire
Somersetshire
Suffolk
Sussex
Worcester
Buckinghamshire
Cornwall
Cumberland
Dorset
Down
Dublin
Herefordshire
Leicestershire
Northumberland
Oxfordshire
Stirlingshire
Unknown
London90
2932
2379
21
12
Lancashire59
1627
1169
21
11
Yorkshire37
1335
646
12
11
11
Surrey16
850
675
11
Bristol13
215
2100
Essex20
15
1100
Staffordshire24
1250
542
31
11
1Cheshire
148
573
381
31
Southamptonshire
60
00
0Berkshire
101
100
01
Hants10
330
00
3Kent
208
407
881
Nottinghamshire
147
504
571
11
Somersetshire
94
441
251
1Suffolk
112
182
100W
iltshire10
440
375
1Cum
berland5
240
150
1Devonshire
122
171
501
Gloucestershire
146
433
501
11
Herefordshire6
117
1100
Cornwall3
133
1100
Derbyshire7
114
00
1Hertfordshire
42
502
100Leicestershire
52
401
501
Middlesex*
1410
714
401
11
11
1Norfolk
73
431
331
1Northum
berland5
120
00
1Buckingham
shire3
133
1100
Durham4
125
00
1Northam
ptonshire6
233
00
11
Sussex6
467
00
13
Warwickshire
202
101
501
Worcestershire
64
672
501
1Total**
490163
3393
5732
1812
117
66
55
44
44
33
33
33
22
22
22
21
11
11
11
11
11
5
* Because of their proximity London and M
iddlesex have had some data m
erged.** For English places of trial totals include those from
the county plus those from outside.
Table 6.9: English Born: Places of Origin Related to Places of Trial: Property O
ffenders with 14 Year and Life Sentence s
Places of Trial
207

Chapter Six: The W
estern Road C
onvict Population
123456789101112131415161718192021222324252627282930313233343536373839
AB
CD
EF
GH
IJ
KL
MN
OP
QR
ST
UV
WX
YZ
AAAB
ACAD
AEAF
AGAH
AIAJ
AKAL
AMAN
AOAP
AQ
Irish county of origin
Total convicts per county
No. 7 year property offenders
% of col B
No. tried in county of origin
% of col C
Dublin
Cork TipperaryAntrimDownWaterfordGalwayLimerickCarlowCavanClareKilkennyMeathDonegal
Kerry
LongfordWicklowLondonLondonderryOSTyroneWexford
Armagh
Bristol
Derbyshire
Glamagoran
KildareKings
Lanarkshire
LancashireLouthNorfolkSligoSouthamptonWestmeathYorkshireUnknown
Dublin88
4855
4390
12
11
1Cork
3620
5613
652
12
11
Limerick
179
535
561
21
Waterford
149
646
671
11
Galway
139
696
671
11
Wicklow
148
571
135
11
Wexford
127
582
292
11
1Carlow
87
884
573
Tipperary19
632
350
11
1Kilkenny
86
752
331
11
1M
ayo7
686
00
11
11
1Arm
agh6
6100
00
14
1M
eath12
542
240
11
1Antrim
95
564
801
Clare12
433
4100
Down5
480
125
21
Westm
eath4
375
00
11
1M
onaghan5
240
00
11
Tyrone8
225
150
1Londonderry
72
292
100Donegal
62
332
100Leitrim
52
400
01
1Louth
42
500
01
11
1Longford
32
671
501
1Q
ueens3
267
00
11
Sligo3
267
00
11
Kildare6
117
1100
Kings5
120
00
11
Cavan4
125
1100
Kerry2
150
1100
Roscomm
on2
150
00
1Ferm
anagh3
00
00
11
Totals*350
18553
10557
6316
98
88
77
65
55
43
33
32
22
22
11
11
11
11
11
11
11
4
* For Irish places of trial total includes those from the county plus those from
outside.
Places of trialTable 6.10: Irish Born: Places of O
rigin Related to Places of Trial: Property Offenders w
ith 7 Year Sentence s
208

Chapter Six: The W
estern Road C
onvict Population
123456789101112131415161718192021222324252627282930313233343536373839
AB
CD
EF
GH
IJ
KL
MN
OP
QR
ST
UV
WX
YZ
AAAB
ACAD
AEAF
AGAH
AIAJ
AK
Irish county of origin
Total convicts per countyyproperty offenders
% of col BNo. tried in county of origin
% of col CDublinCork ClareLancashireLimerickOSWaterfordAntrimWexfordCavanGalwayKildareKilkennyLondonMeathTipperaryTyroneDownDonegalLongfordArmaghCarmarthenCheshireGuernseyKentKingsLanarkshireMiddlesexSligoSouthamptonUnknown
Dublin88
2427
1875
11
11
1Cork
3610
289
901
Limerick
176
354
671
1W
aterford14
00
00
Galway
131
81
1003
Wicklow
144
290
0W
exford12
542
240
11
1Carlow
80
00
0Tipperary
199
472
223
21
1Kilkenny
82
250
02
Mayo
71
141
100Arm
agh6
00
00
Meath
125
422
402
1Antrim
94
441
251
11
Clare12
542
5100
Down5
120
00
1W
estmeath
41
250
00
1M
onaghan5
240
150
1Tyrone
84
502
501
1Londonderry
75
710
02
11
1Donegal
63
500
01
11
Leitrim5
360
267
1Louth
41
250
01
Longford3
00
00
1Q
ueens3
133
00
1Sligo
31
331
100Kildare
65
830
02
21
Kings5
120
00
1Cavan
42
501
50Kerry
20
00
0Roscom
mon
20
00
0Ferm
anagh3
267
10
1Totals*
350108
3153
4929
105
44
44
33
22
22
22
22
11
11
11
11
11
11
16
* For Irish places of trial total includes those from the county plus those from
outside.
Table 6.11: Irish Born: Places of Origin Related to Places of Trial: Property O
ffenders with 14 Year and Life Sentence s
Places of trial
209

Chapter Six: The W
estern Road C
onvict Population
1234567891011121314
AB
CD
EF
GH
IJ
KL
MN
OP
QR
ST
UV
WX
YZ
AAAB
ACAD
AEAF
AG
Distance Assessment
No.
% of total col B
No.
% of total col D
No.
% of total col F
No.
% of total col H
No.
% of total col J
No.
% of total col L
No.
% of total col N
No.
% of total col P
No.
% of total col R
No.
% of total col T
No.
% of total col V
No.
% of total col X
No.
% of total col Z
No.
% of total col AB
No.
% of total col AD
No.
% of total col AE
Adjacent8
3813
353
274
361
2011
1004
672
189
411
2521
577
396
504
802
1000
0Regional -> Capital
943
822
218
327
120
00
117
436
523
00
411
317
18
00
00
00
Inter-regional2
105
142
184
362
400
01
172
185
230
08
222
111
81
200
00
0Cross country
15
38
327
00
00
00
00
19
15
00
13
00
217
00
00
00
Capital -> Regional Urban0
00
01
90
00
00
00
00
01
50
01
30
00
00
00
00
0Capital -> Region
15
38
00
00
00
00
00
00
15
00
25
00
00
00
00
0Not country of birth
00
514
00
00
120
00
00
218
00
375
13
633
217
00
00
00
Sample size
21100
37100
11100
11100
5100
11100
6100
11100
22100
4100
37100
18100
12100
545
2100
00
7 year and life sentences 14 year and life sentences
English Larceny
Irish Larceny
English Burglary and Robbery
Irish Burglary and Robbery
Irish Wearing Apparel
English Burglary and Robbery
Irish Burglary and Robbery
Table 6.12: Proximity of Place of O
rigin to Place of Trial for Offenders Not tried in their County of O
rigin
English Animal Theft
Irish Animal Theft
English Wearing Apparel
Irish Wearing Apparel
Irish Larceny
English Animal Theft
Irish Animal Theft
English Wearing Apparel
English Larceny
210

Chapter Six: The Western Road Convict Population
123
45678910111213
A B C D E F G H I J K L M
No.
% o
f tot
al c
ol B
No.
% o
f tot
al c
ol D
No.
% o
f tot
al c
ol F
No.
% o
f tot
al c
ol H
No.
% o
f tot
al c
ol J
No.
% o
f tot
al c
ol L
Not related 184 46 86 47 79 42 90 30 52 26 28 41Unlikely 53 13 29 16 21 11 65 22 49 25 10 15Possibly 104 26 46 25 52 28 79 26 48 24 19 28Highly likely 27 7 8 4 19 10 18 6 14 7 3 4Related 21 5 11 6 9 5 35 12 27 14 6 9Undecided 13 3 3 2 9 5 13 4 10 5 2 3Totals 402 100 183 100 189 100 300 100 200 100 68 100
Table 6.13 Occupation/Employment Related Crime for Property Offenders7 Year Property Crimes
IrishEnglishAll
Rela
tions
hip
of
Occ
upat
ion
or
Empl
oym
ent t
o Cr
ime
14 Year & Life Property CrimesAll English Irish
211

Chapter Six: The W
estern Road C
onvict Population
123456789101112131415161718192021222324252627282930313233
AB
CD
EF
GH
IJ
KL
MN
OP
QR
ST
UV
WX
Crime/Nationality
Total no. of urban or rural offenders
No. urban
% of col B
Av.ageNo. urbans with prior con.s
% of col C
No. single urbans
% of col C
No. married urbans
% of col CNo. urbans tried in county of origin
% of col C
No. rural% of col B
Av. age
No. rurals with prior con.s
% of col N
No. single rurals
% of col N
No. married rurals
% of col N
No. rurals tried in home county
% of col N
EnglishLarceny
8882
9321
7693
6984
1316
5567
67
265
834
671
175
83Theft of wearing apparel
3530
8619
1550
2790
27
2583
514
262
405
1000
01
20Burglary and robbery
3735
9521
1440
3291
26
2160
25
231
502
1000
02
100Anim
al theft11
327
200
03
1000
00
08
7320
113
788
113
675
All crimes against property (a)
174151
8721
10670
13086
1913
10066
2313
2511
4819
832
915
65
IrishLarceny
8471
8521
57
6085
1014
3955
1315
221
810
773
236
46Theft of wearing apparel
2219
8622
842
1789
211
1158
314
330
01
332
671
33Burglary and robbery
4134
8322
1956
2985
515
2368
717
200
07
1000
571
Animal theft
196
3223
117
583
117
233
1368
252
158
624
318
62All crim
es against property (a)171
13478
2250
37113
8420
1574
5537
2224
38
2773
924
2054
ScottishLarceny
1010
10023
660
660
330
220
00
00
00
00
00
0Theft of wearing apparel
44
10022
375
4100
00
125
00
00
00
00
00
0Burglary and robbery
54
8024
250
375
00
250
120
221
1001
1000
01
100Anim
al theft0
00
00
00
00
00
00
00
00
00
00
00
All crimes against property (a)
2221
9523
1362
1676
419
733
15
221
1001
1000
01
100
TotalsLarceny
182163
9022
8753
13583
2616
9659
1910
246
3214
744
2111
58Theft of wearing apparel
6153
8721
2649
4891
48
3770
813
302
256
752
252
25Burglary and robbery
8373
8822
3548
6488
710
4663
1012
222
2010
1000
08
80Anim
al theft30
930
221
118
891
112
2221
7023
314
1571
524
1467
All crimes against property (a)
367306
8322
16955
25985
4314
18159
6117
2415
2547
7711
1836
59
a) includes all crimes against property including sm
aller crime categories
RuralTable 6.14 Urban-rural status of property offenders w
ith 7 year sentencesUrban
212

C
hapter Six: The Western R
oad Convict Population
12345678910111213141516171819202122
AB
CD
EF
GH
IJ
KL
MN
OP
QR
Types of Offences (a)
1Larceny (other)
9365
4751
2316
835
2920
1862
14438
7351
2Burglary; Housebreaking,
2325
1148
1516
1067
5559
3665
9324
5761
3Anim
al Theft12
2710
839
204
4422
4916
7345
1230
674
Robbery14
379
644
112
5021
5515
7138
1026
685
Theft of Wearing Apparel
3878
2053
918
333
48
00
4913
2347
6Receiving/Possession
133
00
133
1100
133
00
31
133
7Robbery with Violence
00
00
1100
1100
00
00
10
1100
8W
ilful Destruction0
00
01
331
1002
672
1003
13
1009
Stealing by a Trick/Swindling/ False pretences2
1000
00
00
00
00
02
10
010
Forgery0
00
00
00
01
1001
1001
01
10011
Embezzlem
ent/Bad Notes0
00
00
00
01
1000
01
00
012
Poaching0
00
01
1000
00
00
10
00
Totals183
4897
5364
1743
45136
3688
65381
100215
56
14 Years7 Years
Offences
% col O
No priors
% col C
Offences
No priors
Crime
Category No.
Table 6.15 English (c) Sentences for Crimes Against Property and Incidence of No Prior Conviction
(a)Basedon
Robson'scategorization;
(b)Discrepanciesin
totalsforsentences
andtotalnum
berofcrimes
comm
ittedis
dueto
sentencesin
afew
casesbeing
unknown;(c)includes
small num
ber of Welsh.
Life
% col G
No priors
No priors
% col K
% col O
% col O
Offences
Offences (b)
% col O tota
Totals
% col O
213
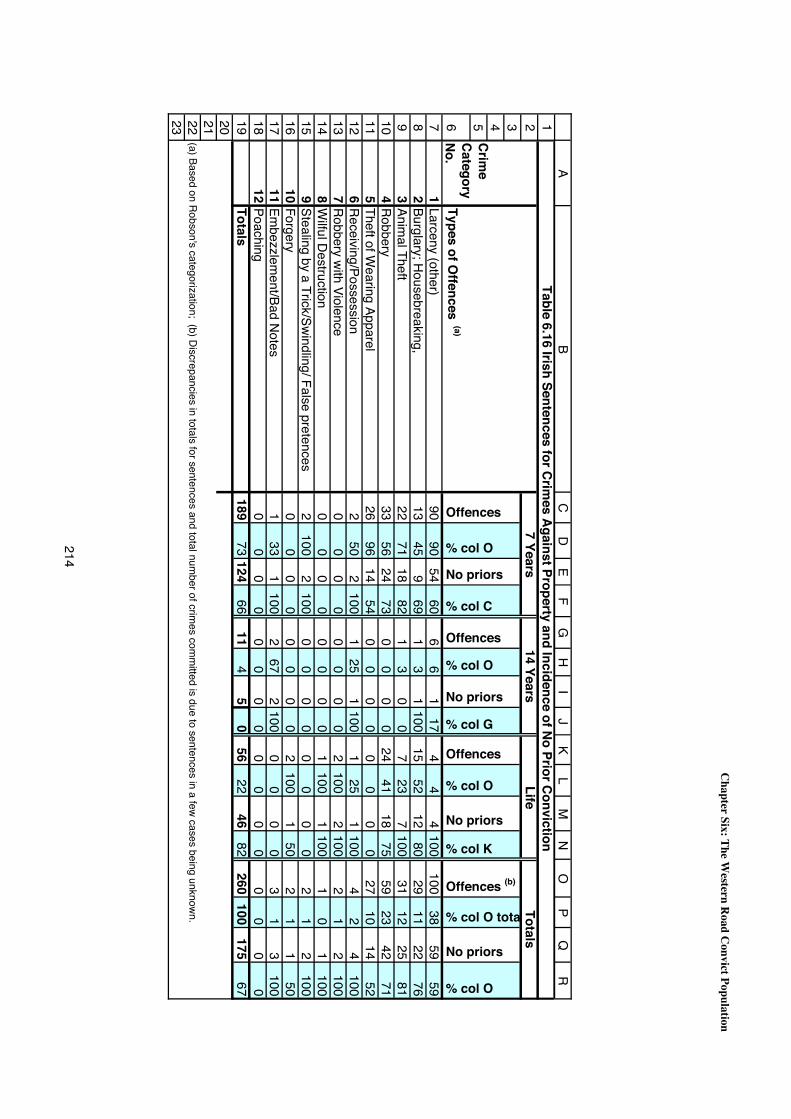
Chapter Six: The W
estern Road C
onvict Population
1234567891011121314151617181920212223
AB
CD
EF
GH
IJ
KL
MN
OP
QR
Types of Offences (a)
1Larceny (other)
9090
5460
66
117
44
4100
10038
5959
2Burglary; Housebreaking,
1345
969
13
1100
1552
1280
2911
2276
3Anim
al Theft22
7118
821
30
07
237
10031
1225
814
Robbery33
5624
730
00
024
4118
7559
2342
715
Theft of Wearing Apparel
2696
1454
00
00
00
00
2710
1452
6Receiving/Possession
250
2100
125
1100
125
1100
42
4100
7Robbery with Violence
00
00
00
00
2100
2100
21
2100
8W
ilful Destruction0
00
00
00
01
1001
1001
01
1009
Stealing by a Trick/Swindling/ False pretences2
1002
1000
00
00
00
02
12
10010
Forgery0
00
00
00
02
1001
502
11
5011
Embezzlem
ent/Bad Notes1
331
1002
672
1000
00
03
13
10012
Poaching0
00
00
00
00
00
00
00
0Totals
18973
12466
114
50
5622
4682
260100
17567
Table 6.16 Irish Sentences for Crimes Against Property and Incidence of No Prior Conviction
14 Years7 Years
Offences
% col O
No priors
% col C
No priors
No priors
Crime
Category No.
TotalsLife
% col G
% col O
Offences
% col O
(a) Based on Robson's categorization; (b) Discrepancies in totals for sentences and total number of crim
es comm
itted is due to sentences in a few cases being unknown.
Offences
No priors
% col K
% col O
Offences (b)
% col O tota
214

Chapter Six: The W
estern Road C
onvict Population
12345678910111213141516171819202122232425262728293031323334353637
AB
CD
EF
GH
IJ
KL
MN
OP
QR
ST
UV
WX
Crime/Nationality
Total no. of urban or rural offenders
No. urban
% of col B
Av.age
No. urbans with prior con.s
% of col C
No. single urbans
% of col C
No. married urbans
% of col C
No. urbans tried in county of origin
% of col C
No. rural
% of col B
Av. age
No. rurals with prior con.s
% of col N
No. single rurals
% of col N
No. married rurals
% of col NNo. rurals tried in home county
% of col N
EnglishLarceny
5243
8320
2047
3991
49
2353
917
244
449
1001
115
56Theft of wearing apparel
1312
9221
1083
1083
217
975
18
220
01
1000
01
100Burglary and robbery
9172
7922
2332
6083
1217
3549
1921
234
2118
951
513
68Anim
al theft30
1137
232
189
822
187
6419
6323
842
1579
316
947
All crimes against property (a)
194141
7321
5640
12085
2115
7452
5327
2317
3247
895
930
57
IrishLarceny
109
9021
667
9100
00
444
110
190
01
1000
00
0Theft of wearing apparel
00
00
00
00
00
00
00
00
00
00
00
0Burglary and robbery
4026
6522
727
2388
312
1350
1435
220
04
291
71
7Anim
al theft7
571
261
203
602
401
202
2936
00
2100
00
00
All crimes against property (a)
6647
7124
1430
3779
919
2145
1929
241
518
951
52
11
ScottishLarceny
1010
10021
770
990
110
660
00
00
00
00
00
0Theft of wearing apparel
22
10030
150
150
00
00
00
00
00
00
00
0Burglary and robbery
1412
8621
433
1083
217
91
214
181
502
1000
02
100Anim
al theft0
00
00
00
00
00
00
00
00
00
00
00
All crimes against property (a)
2826
9322
1246
2077
519
1545
27
181
502
1000
02
100
TotalsLarceny
7262
8621
3353
5792
524
3353
1014
224
4010
1001
105
50Theft of wearing apparel
1513
8717
1185
1185
212
969
17
220
01
1000
01
100Burglary and robbery
145110
7622
3431
9385
1778
5752
3524
215
1424
692
616
46Anim
al theft37
1643
253
1912
754
168
5021
5730
838
1781
314
943
All crimes against property (a)
288214
7422
8238
17783
3516
11051
7426
2219
2667
916
834
46
a) includes all crimes against property including sm
aller crime categories
RuralUrban
Table 6.17 Urban-Rural Status of Property Offenders w
ith 14 year and Life Sentences
215

1
2
3456789101112131415161718192021222324252627282930313233343536373839404142434445464748495051525354
A B C D E F G H I J K L M N O
Crime Category
County of Trial 7 ye
ars
14 &
Life
7 ye
ars
14 &
Life
7 ye
ars
14 &
Life
7 ye
ars
14 &
Life
7 ye
ars
% o
f col
N
14 &
Life
% o
f col
N
Tria
ls
% o
f N51
London 23 17 5 13 1 4 7 4 36 49 38 51 74 20Lancashire 12 5 5 9 0 0 6 4 23 56 18 44 41 11Yorkshire 9 3 7 6 0 3 1 0 17 59 12 41 29 8Surrey 6 5 1 6 2 0 2 1 11 48 12 52 23 6Warwickshire 4 3 0 6 0 1 0 1 4 27 11 73 15 4Staffordshire 4 2 3 3 0 2 0 0 7 50 7 50 14 4Cheshire 1 1 0 5 0 0 4 0 5 45 6 55 11 3Bristol 2 2 2 2 0 0 0 0 4 50 4 50 8 2Essex 1 1 0 2 1 1 2 0 4 50 4 50 8 2Gloucestershire 0 0 2 3 0 1 1 0 3 43 4 57 7 2Kent 1 1 1 3 0 3 0 0 2 22 7 78 9 2Middlesex 4 0 1 0 0 1 0 6 100 0 0 6 2Norfolk 2 0 0 4 0 1 0 0 2 29 5 71 7 2Nottinghamshire 0 0 1 5 0 0 0 1 1 14 6 86 7 2Oxfordshire 0 1 1 1 0 1 1 1 2 33 4 67 6 2Suffolk 1 0 0 2 1 0 2 0 4 67 2 33 6 2Wiltshire 2 0 1 3 2 0 0 0 5 63 3 38 8 2Worcestershire 0 0 0 2 1 3 0 0 1 17 5 83 6 2Berkshire 1 0 0 0 0 0 1 0 2 100 0 0 2 1Buckinghamshire 1 0 0 1 0 0 0 0 1 50 1 50 2 1Cambridgeshire 0 0 0 1 0 1 0 0 0 2 100 2 1Cornwall 0 0 1 0 0 0 0 1 1 50 1 50 2 1Cumberland 1 0 1 0 0 1 0 0 2 67 1 33 3 1Derbyshire 2 1 0 1 0 0 0 0 2 50 2 50 4 1Devonshire 1 2 0 1 0 0 0 0 1 25 3 75 4 1Dorset 0 0 1 0 0 0 2 0 3 100 0 0 3 1Heredfordshire 1 0 0 1 1 0 0 0 2 67 1 33 3 1Hertfordshire 1 1 0 1 0 1 0 0 1 25 3 75 4 1Inverness 0 1 0 0 2 0 0 0 0 3 100 3 1Leicestershire 2 0 0 1 0 1 0 0 2 50 2 50 4 1Lincolnshire 1 1 0 1 0 1 0 0 1 25 3 75 4 1Northumberland 0 2 0 0 0 0 0 0 0 0 2 100 2 1Somersetshire 0 1 0 1 0 0 2 0 2 50 2 50 4 1Southampton 1 0 0 2 0 1 0 0 1 25 3 75 4 1Sussex 1 0 1 2 0 0 0 2 50 2 50 4 1Canarvon 0 0 0 0 0 0 1 0 1 100 0 0 1 0Denbeigh 0 0 0 0 0 1 0 0 0 0 1 100 1 0Down 0 0 0 0 0 1 0 0 0 0 1 100 1 0Dublin 0 0 0 1 0 0 0 0 0 0 1 100 1 0Glamorganshire 0 0 0 1 0 0 0 0 0 0 1 100 1 0Huntingdonshire 0 0 0 0 1 0 0 0 1 100 0 0 1 0Lanarkshire 0 0 1 0 0 0 0 0 1 100 0 0 1 0Mayo 0 0 1 0 0 0 0 0 1 100 0 0 1 0Northhamptonshire 0 0 0 0 1 0 0 0 1 100 0 0 1 0Salop 1 0 0 0 0 0 0 0 1 100 0 0 1 0Stirlingshire 0 0 0 1 0 0 0 0 0 1 100 1 0Wicklow 0 0 0 0 1 0 0 0 1 100 0 0 1 0Unknown 7 2 1 3 1 5 0 13 68 6 32 19 5Totals 93 52 37 94 12 31 38 13 180 49 190 51 370 100
Table 6.18 English Top 5 Property Crimes and Sentences by County of Trial
Total TrialsTotal Sentences1 - Larceny
2 & 4 - Burglary & Robbery
3 - Animal Theft
5 - Theft Wearing Apparel
211

Chapter Six: The Western Road Convict Population
1
2
34567891011121314151617181920212223242526272829303132333435363738394041424344454647
A B C D E F G H I J K L M N O
Crime Category
County of Trial 7 ye
ars
14 &
Life
7 ye
ars
14 &
Life
7 ye
ars
14 &
Life
7 ye
ars
14 &
Life
7 ye
ars
% o
f col
N
14 &
Life
% o
f col
N
Tria
ls
% o
f N44
Dublin 32 4 17 12 0 2 11 0 60 77 18 23 78 32Cork 3 0 6 4 3 2 3 0 15 71 6 29 21 9Waterford 4 1 4 4 0 1 0 0 8 57 6 43 14 6Antrim 3 0 3 0 1 1 2 0 9 90 1 10 10 4Tipperary 5 0 1 1 3 0 0 0 9 90 1 10 10 4Down 6 0 0 1 2 0 0 0 8 89 1 11 9 4Galway 5 0 2 0 0 1 0 0 7 88 1 13 8 3Clare 1 0 2 2 1 0 1 0 5 71 2 29 7 3Limerick 2 0 1 0 2 0 2 0 7 100 0 0 7 3Carlow 3 0 1 0 2 0 0 0 6 100 0 0 6 2Meath 0 0 4 2 0 0 0 0 4 67 2 33 6 2Kilkenny 3 0 1 0 1 0 0 0 5 100 0 0 5 2Wexford 2 0 0 3 0 0 0 0 2 40 3 60 5 2Cavan 2 0 1 0 1 0 0 0 4 100 0 0 4 2Lancashire 1 2 0 1 0 0 0 0 1 25 3 75 4 2Longford 2 0 1 0 0 1 0 0 3 75 1 25 4 2Tyrone 2 0 0 2 0 0 0 0 2 50 2 50 4 2Donegal 1 0 0 0 2 0 0 0 3 100 0 0 3 1Kerry 2 0 0 0 0 0 1 0 3 100 0 0 3 1Wicklow 0 0 0 0 1 0 2 0 3 100 0 0 3 1Armagh 0 0 0 1 0 0 1 0 1 50 1 50 2 1Kildare 1 0 0 1 0 0 0 0 1 50 1 50 2 1London 1 0 0 1 0 0 0 0 1 50 1 50 2 1Londonderry 0 0 0 0 1 0 1 0 2 100 0 0 2 1Bristol 0 0 1 0 0 0 0 0 1 100 0 0 1 0Carmarthen 0 0 0 0 0 0 0 0 0 0 1 100 1 0Cheshire 0 1 0 0 0 0 0 0 0 0 1 100 1 0Derbyshire 0 0 0 0 0 0 1 0 1 100 0 0 1 0Glamorganshire 1 0 0 0 0 0 0 0 1 100 0 0 1 0Kings 0 0 0 0 1 0 0 0 1 100 0 0 1 0Lanarkshire 0 0 0 1 0 0 0 0 0 0 1 100 1 0Louth 1 0 0 0 0 0 0 0 1 100 0 0 1 0Monaghan 0 0 0 1 0 0 0 0 0 0 1 100 1 0Norfolk 1 0 0 0 0 0 0 0 1 100 0 0 1 0Sligo 0 0 0 0 1 0 0 0 1 100 0 0 1 0Southampton 0 0 0 0 0 0 1 0 1 100 0 0 1 0Warwickshire 0 0 0 1 0 0 0 0 0 0 1 100 1 0Westmeath 1 0 0 0 0 0 0 0 1 100 0 0 1 0Yorkshire 1 0 0 0 0 0 0 0 1 100 0 0 1 0OS 0 0 0 1 0 0 0 0 0 0 1 100 1 0Unknown 3 2 1 0 0 1 0 5 71 2 29 7 3Totals 89 10 46 39 22 8 27 0 184 76 57 24 241 100
Table 6.19 Irish Top 5 Property Crimes and Sentences by County of Trial
Total TrialsTotal Sentences
1 - Larceny
2 & 4 - Burglary
& 3 - Animal
Theft
5 - Theft Wearing Apparel
217
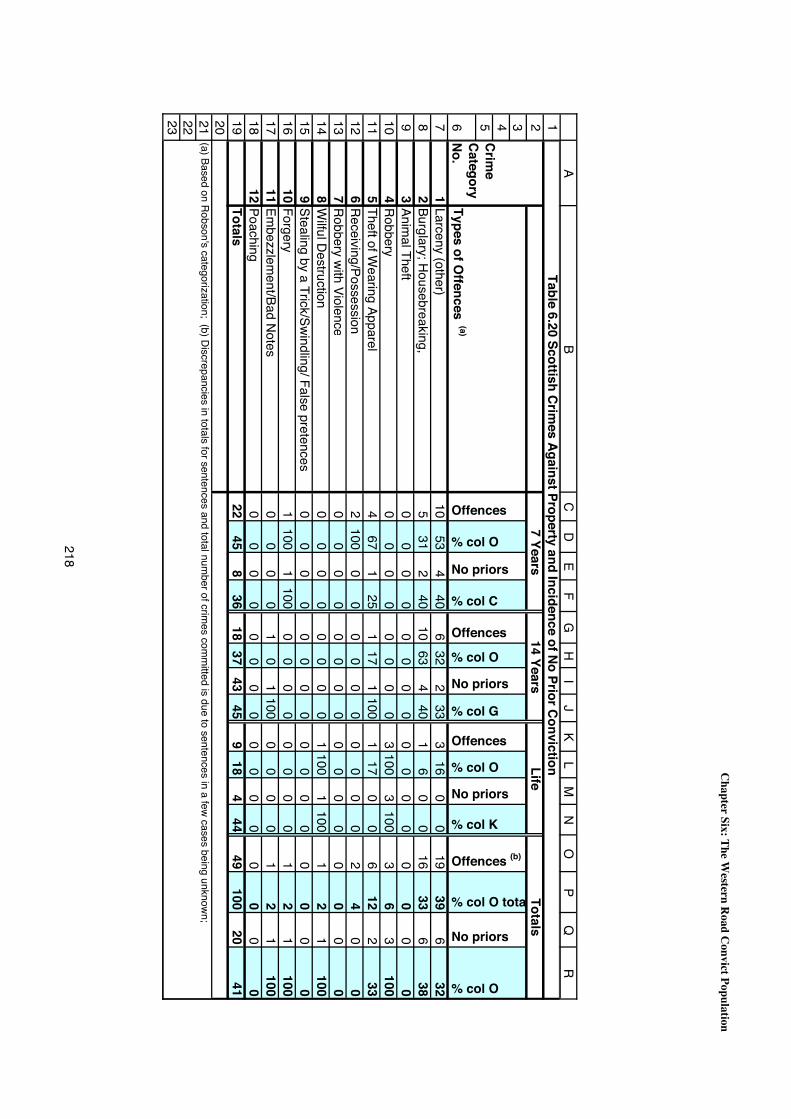
Chapter Six: The W
estern Road C
onvict Population
1234567891011121314151617181920212223
AB
CD
EF
GH
IJ
KL
MN
OP
QR
Types of Offences (a)
1Larceny (other)
1053
440
632
233
316
00
1939
632
2Burglary; Housebreaking,
531
240
1063
440
16
00
1633
638
3Anim
al Theft0
00
00
00
00
00
00
00
04
Robber y0
00
00
00
03
1003
1003
63
1005
Theft of Wearing Apparel
467
125
117
1100
117
00
612
233
6Receiving/Possession
2100
00
00
00
00
00
24
00
7Robbery with Violenc e
00
00
00
00
00
00
00
00
8W
ilful Destruction0
00
00
00
01
1001
1001
21
1009
Stealing by a Trick/Swindling/ False pretence s0
00
00
00
00
00
00
00
010
Forger y1
1001
1000
00
00
00
01
21
10011
Embezzlem
ent/Bad Notes0
00
01
01
1000
00
01
21
10012
Poaching0
00
00
00
00
00
00
00
0Totals
2245
836
1837
4345
918
444
49100
2041
Offences
Offences
% col O
No priors
% col C
TotalsTable 6.20 Scottish Crim
es Against Property and Incidence of No Prior Conviction 14 Years
7 Years
% col O tota
% col O
Offences
% col O
(a) Based on Robson's categorization; (b) Discrepancies in totals for sentences and total number of crim
es comm
itted is due to sentences in a few cases being unknown;
Life
% col G
No priors
% col K
No priors
No priors
% col O
Crime
Category No.
Offences (b)
218
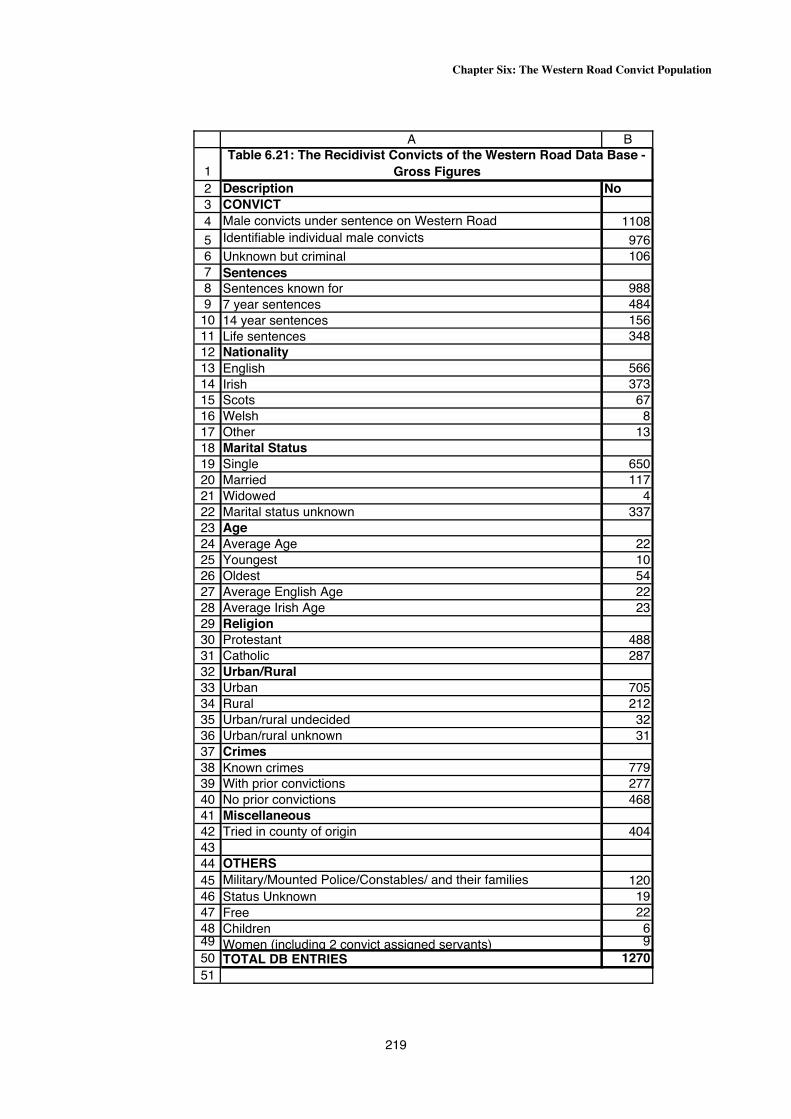
Chapter Six: The Western Road Convict Population
123456789101112131415161718192021222324252627282930313233343536373839404142434445464748495051
A B
Description NoCONVICTMale convicts under sentence on Western Road 1108Identifiable individual male convicts 976Unknown but criminal 106Sentences Sentences known for 9887 year sentences 48414 year sentences 156Life sentences 348NationalityEnglish 566Irish 373Scots 67Welsh 8Other 13Marital StatusSingle 650Married 117Widowed 4Marital status unknown 337AgeAverage Age 22Youngest 10Oldest 54Average English Age 22Average Irish Age 23ReligionProtestant 488Catholic 287Urban/RuralUrban 705Rural 212Urban/rural undecided 32Urban/rural unknown 31CrimesKnown crimes 779With prior convictions 277No prior convictions 468MiscellaneousTried in county of origin 404
OTHERSMilitary/Mounted Police/Constables/ and their families 120Status Unknown 19Free 22Children 6Women (including 2 convict assigned servants) 9TOTAL DB ENTRIES 1270
Table 6.21: The Recidivist Convicts of the Western Road Data Base - Gross Figures
219