Embed Size (px)
Citation preview

Big Ideas Math Green Copyright © Big Ideas Learning, LLC Resources by Chapter All rights reserved. 298
Chapter 9 Family and Community Involvement (English) .......................................... 299
Family and Community Involvement (Spanish) ......................................... 300
Section 9.1 ................................................................................................... 301
Section 9.2 ................................................................................................... 307
Section 9.3 ................................................................................................... 313
Section 9.4 ................................................................................................... 319
Section 9.5 ................................................................................................... 325
Technology Connection ............................................................................... 331

Copyright © Big Ideas Learning, LLC Big Ideas Math Green All rights reserved. Resources by Chapter
299
Chapter
9 Statistical Measures
Name _________________________________________________________ Date __________
Dear Family,
In this chapter, your student will study different forms of statistical measures. One of the most common statistical measures is finding the mean of a set of data. Another word for mean is average. Think about ways you use the word average outside of the classroom. Consider the examples below before brainstorming your own ideas.
Have you ever said "today is an average day"? What does that mean? You are probably comparing that particular day to a day that went really great or maybe to a day that did not turn out so good. So, what determines whether a day is good, average, or bad? Do you think your average day would be the same as a sibling or a parent? Spend some time thinking about the difference between a good, average, and bad day.
How about temperatures? How does a meteorologist determine what the average high or low temperatures are for any given day? Do some research on the Internet as a family to discover how meteorologists keep track of average temperatures for your city.
Some other questions to consider:
• How would a record high or low temperature affect the average temperature on a given day?
• What other factors could affect an average temperature?
Now it is your turn! Think about other situations, activities, or events in which averages are used as a form of measurement or comparison. Make a list as a family and discuss how averages are used in each of the situations. Then consider what is being measured and how knowing the average is beneficial to you.
May you have above average luck!
Big Ideas Math Green Copyright © Big Ideas Learning, LLC Resources by Chapter All rights reserved. 300
Capítulo
9 Medidas de estadística
Nombre _______________________________________________________ Fecha ________
Estimada familia,
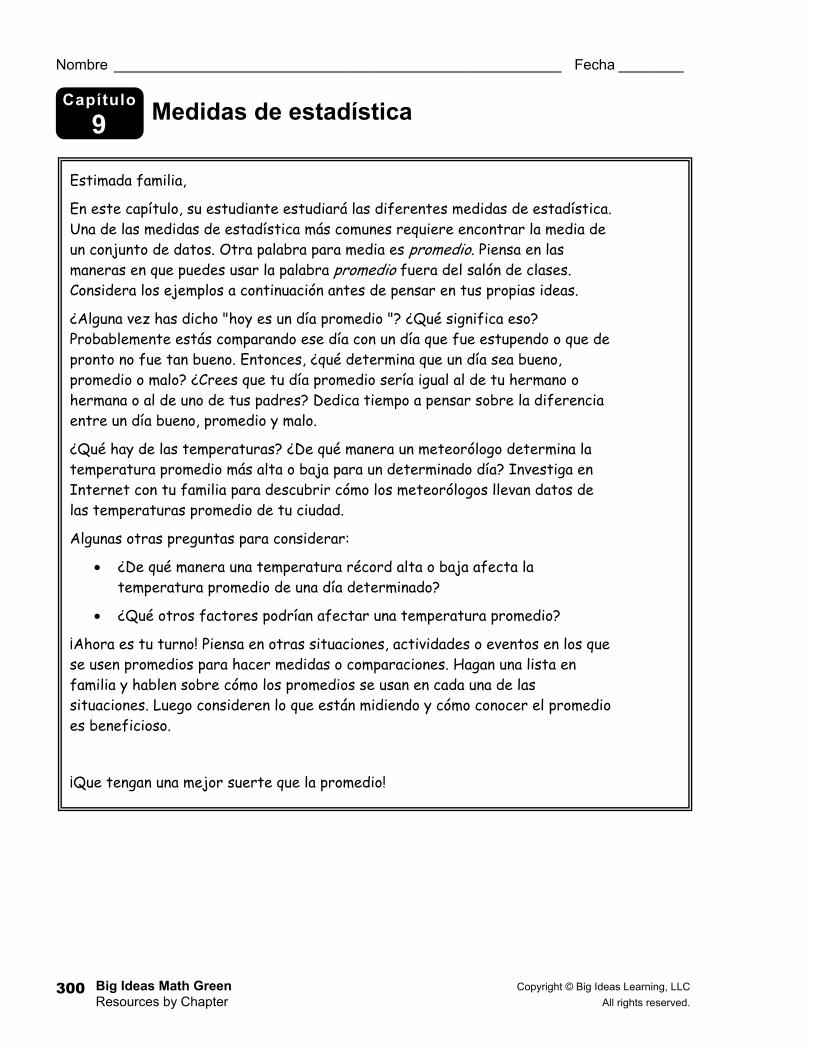
En este capítulo, su estudiante estudiará las diferentes medidas de estadística. Una de las medidas de estadística más comunes requiere encontrar la media de un conjunto de datos. Otra palabra para media es promedio. Piensa en las maneras en que puedes usar la palabra promedio fuera del salón de clases. Considera los ejemplos a continuación antes de pensar en tus propias ideas.
¿Alguna vez has dicho "hoy es un día promedio "? ¿Qué significa eso? Probablemente estás comparando ese día con un día que fue estupendo o que de pronto no fue tan bueno. Entonces, ¿qué determina que un día sea bueno, promedio o malo? ¿Crees que tu día promedio sería igual al de tu hermano o hermana o al de uno de tus padres? Dedica tiempo a pensar sobre la diferencia entre un día bueno, promedio y malo.
¿Qué hay de las temperaturas? ¿De qué manera un meteorólogo determina la temperatura promedio más alta o baja para un determinado día? Investiga en Internet con tu familia para descubrir cómo los meteorólogos llevan datos de las temperaturas promedio de tu ciudad.
Algunas otras preguntas para considerar:
• ¿De qué manera una temperatura récord alta o baja afecta la temperatura promedio de una día determinado?
• ¿Qué otros factores podrían afectar una temperatura promedio?
¡Ahora es tu turno! Piensa en otras situaciones, actividades o eventos en los que se usen promedios para hacer medidas o comparaciones. Hagan una lista en familia y hablen sobre cómo los promedios se usan en cada una de las situaciones. Luego consideren lo que están midiendo y cómo conocer el promedio es beneficioso.
¡Que tengan una mejor suerte que la promedio!
Copyright © Big Ideas Learning, LLC Big Ideas Math Green All rights reserved. Resources by Chapter
301
Activity
9.1 Start Thinking! For use before Activity 9.1
Activity
9.1 Warm Up For use before Activity 9.1
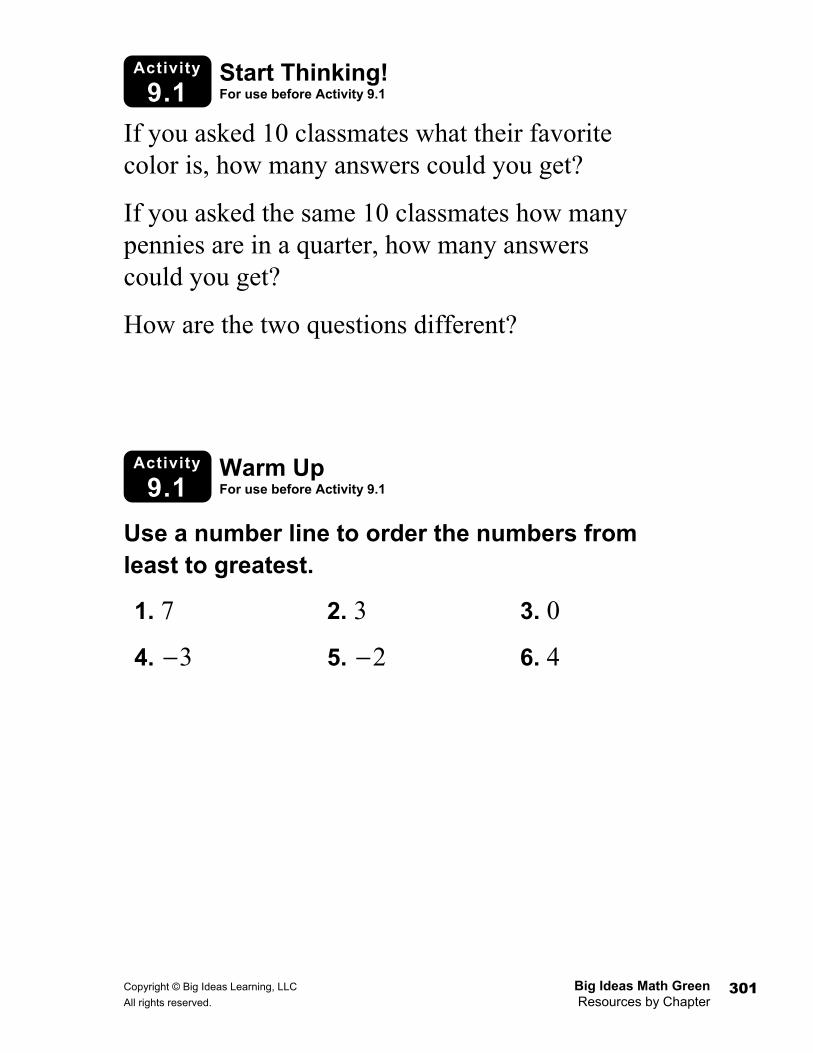
If you asked 10 classmates what their favorite color is, how many answers could you get?
If you asked the same 10 classmates how many pennies are in a quarter, how many answers could you get?
How are the two questions different?
Use a number line to order the numbers from least to greatest.
1. 7 2. 3 3. 0
4. 3− 5. 2− 6. 4

Big Ideas Math Green Copyright © Big Ideas Learning, LLC Resources by Chapter All rights reserved. 302
Lesson
9.1 Warm Up For use before Lesson 9.1
Lesson
9.1 Start Thinking! For use before Lesson 9.1
What is the difference between a statistical question and a non-statistical question? Give an example of each.
Answer the question. Determine if your answer would be the same as your classmates’.
1. How many letters are in the alphabet?
2. How many centimeters are in one meter?
3. How many letters are in your last name?
4. What size shoe do you wear?
Copyright © Big Ideas Learning, LLC Big Ideas Math Green All rights reserved. Resources by Chapter
303
9.1 Practice A
Name _________________________________________________________ Date __________
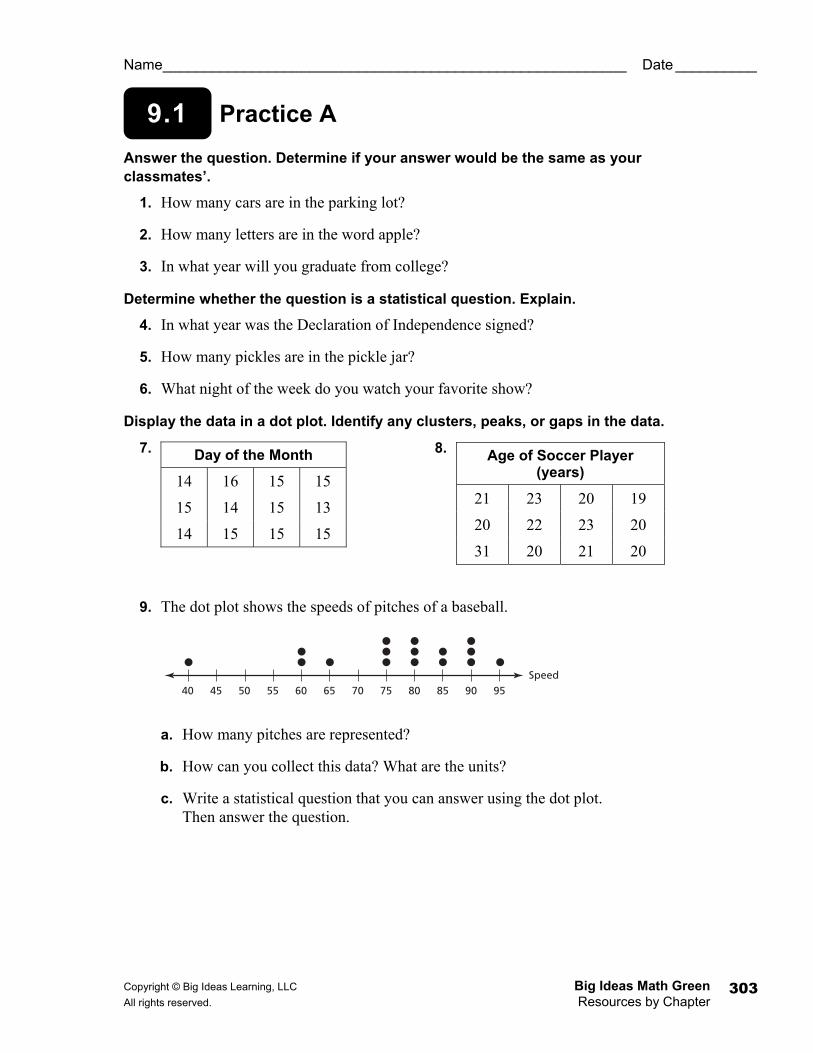
Answer the question. Determine if your answer would be the same as your classmates’.
1. How many cars are in the parking lot?
2. How many letters are in the word apple?
3. In what year will you graduate from college?
Determine whether the question is a statistical question. Explain.
4. In what year was the Declaration of Independence signed?
5. How many pickles are in the pickle jar?
6. What night of the week do you watch your favorite show?
Display the data in a dot plot. Identify any clusters, peaks, or gaps in the data.
7. 8.
9. The dot plot shows the speeds of pitches of a baseball.
a. How many pitches are represented?
b. How can you collect this data? What are the units?
c. Write a statistical question that you can answer using the dot plot. Then answer the question.
4540 50 656055 75 85 9570 80 90Speed
Day of the Month
14 16 15 15
15 14 15 13
14 15 15 15
Age of Soccer Player (years)
21 23 20 19
20 22 23 20
31 20 21 20
Big Ideas Math Green Copyright © Big Ideas Learning, LLC Resources by Chapter All rights reserved. 304
9.1 Practice B
Name _________________________________________________________ Date _________
Determine whether the question is a statistical question. Explain.
1. How long did you wait in line?
2. How many games did you bowl?
3. How many quarters are in a football game?
Display the data in a dot plot. Identify any clusters, peaks, or gaps in the data.
4. 5.
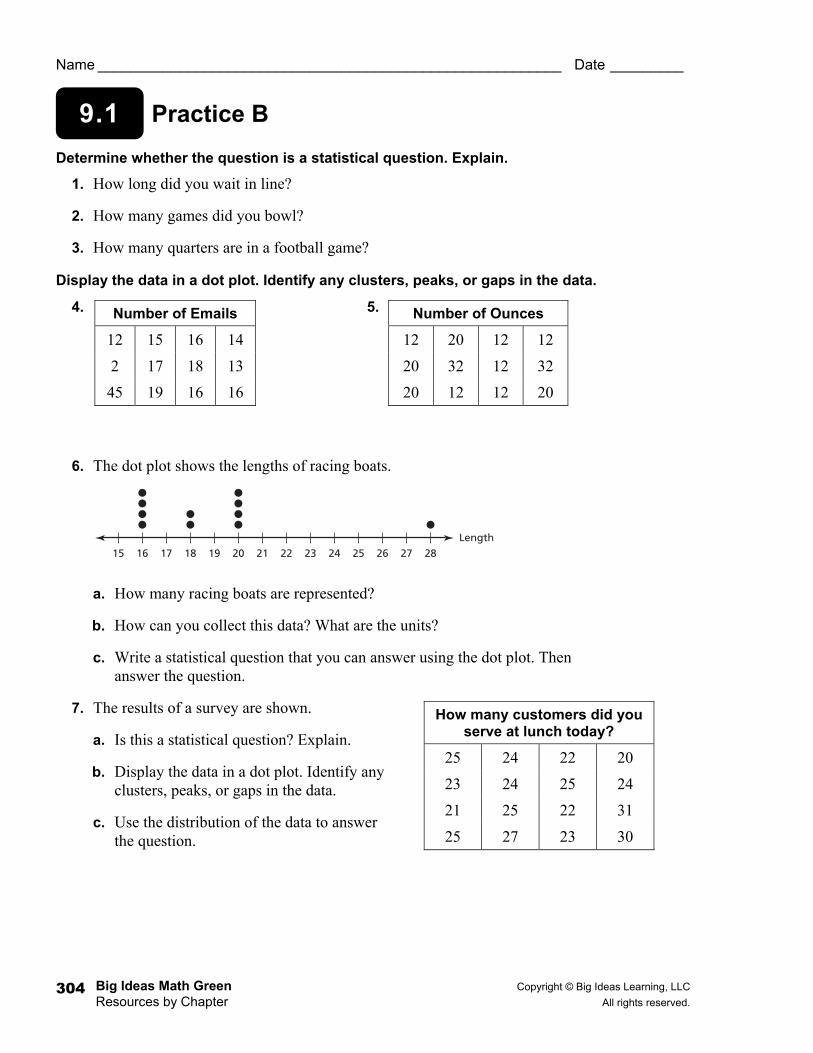
6. The dot plot shows the lengths of racing boats.
a. How many racing boats are represented?
b. How can you collect this data? What are the units?
c. Write a statistical question that you can answer using the dot plot. Then answer the question.
7. The results of a survey are shown.
a. Is this a statistical question? Explain.
b. Display the data in a dot plot. Identify any clusters, peaks, or gaps in the data.
c. Use the distribution of the data to answer the question.
Number of Emails
12 15 16 14
2 17 18 13
45 19 16 16
Number of Ounces
12 20 12 12
20 32 12 32
20 12 12 20
How many customers did you serve at lunch today?
25 24 22 20
23 24 25 24
21 25 22 31
25 27 23 30
1615 17 201918 22 24 2621 23 25 27 28Length
Copyright © Big Ideas Learning, LLC Big Ideas Math Green All rights reserved. Resources by Chapter
305
9.1 Enrichment and Extension
Name _________________________________________________________ Date __________
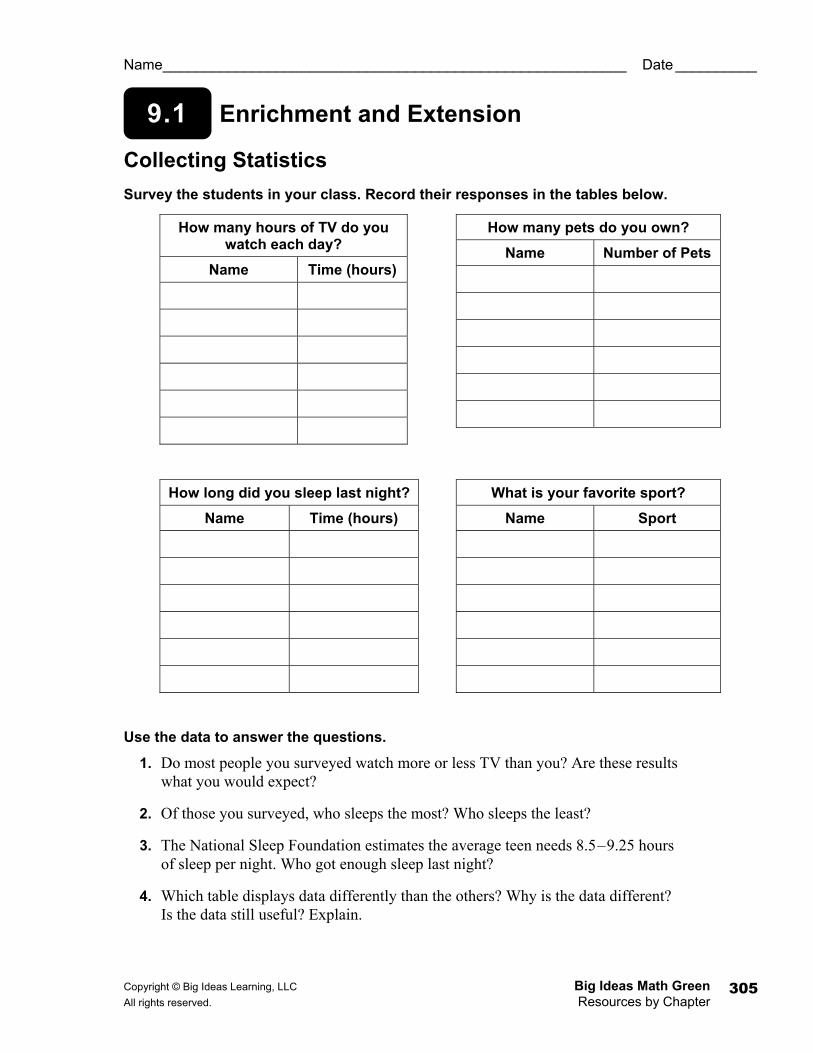
Collecting Statistics Survey the students in your class. Record their responses in the tables below.
Use the data to answer the questions.
1. Do most people you surveyed watch more or less TV than you? Are these results what you would expect?
2. Of those you surveyed, who sleeps the most? Who sleeps the least?
3. The National Sleep Foundation estimates the average teen needs 8.5–9.25 hours of sleep per night. Who got enough sleep last night?
4. Which table displays data differently than the others? Why is the data different? Is the data still useful? Explain.
How many hours of TV do you watch each day?
Name Time (hours)
How many pets do you own?
Name Number of Pets
How long did you sleep last night?
Name Time (hours)
What is your favorite sport?
Name Sport
Big Ideas Math Green Copyright © Big Ideas Learning, LLC Resources by Chapter All rights reserved. 306
Puzzle Time
Name _________________________________________________________ Date _________
If A Seagull Flies Over The Sea, What Flies Over The Bay? Write the letter of each answer in the box containing the exercise number.
Determine whether the question is a statistical question.
1. How many hours do sixth-graders spend watching television on the weekend?
A. Yes B. No
2. How many states begin with the letter A?
D. Yes E. No
3. How many members in the sixth-graders’ households have cell phones?
A. Yes B. No
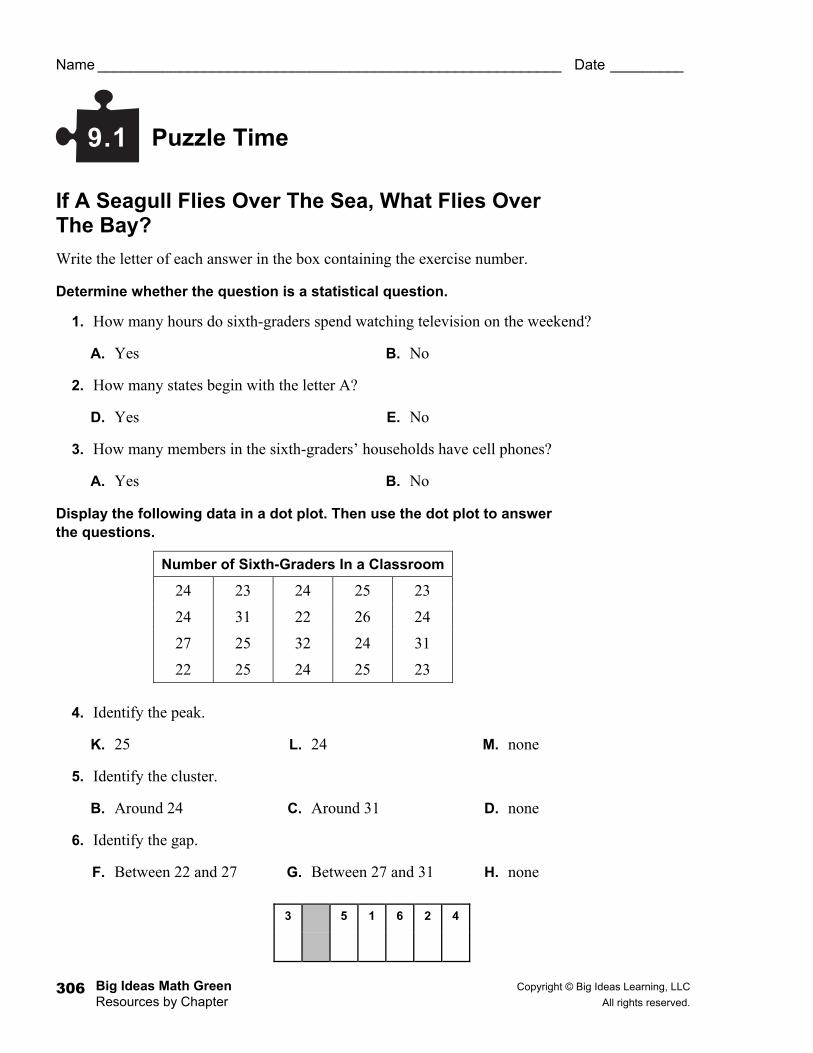
Display the following data in a dot plot. Then use the dot plot to answer the questions.
4. Identify the peak.
K. 25 L. 24 M. none
5. Identify the cluster.
B. Around 24 C. Around 31 D. none
6. Identify the gap.
F. Between 22 and 27 G. Between 27 and 31 H. none
9.1
Number of Sixth-Graders In a Classroom
24 23 24 25 23
24 31 22 26 24
27 25 32 24 31
22 25 24 25 23
3 5 1 6 2 4
Copyright © Big Ideas Learning, LLC Big Ideas Math Green All rights reserved. Resources by Chapter
307
Activity
9.2 Warm Up For use before Activity 9.2
Activity
9.2 Start Thinking! For use before Activity 9.2
What comes to mind when you think of the word average? How does the word average relate to math?
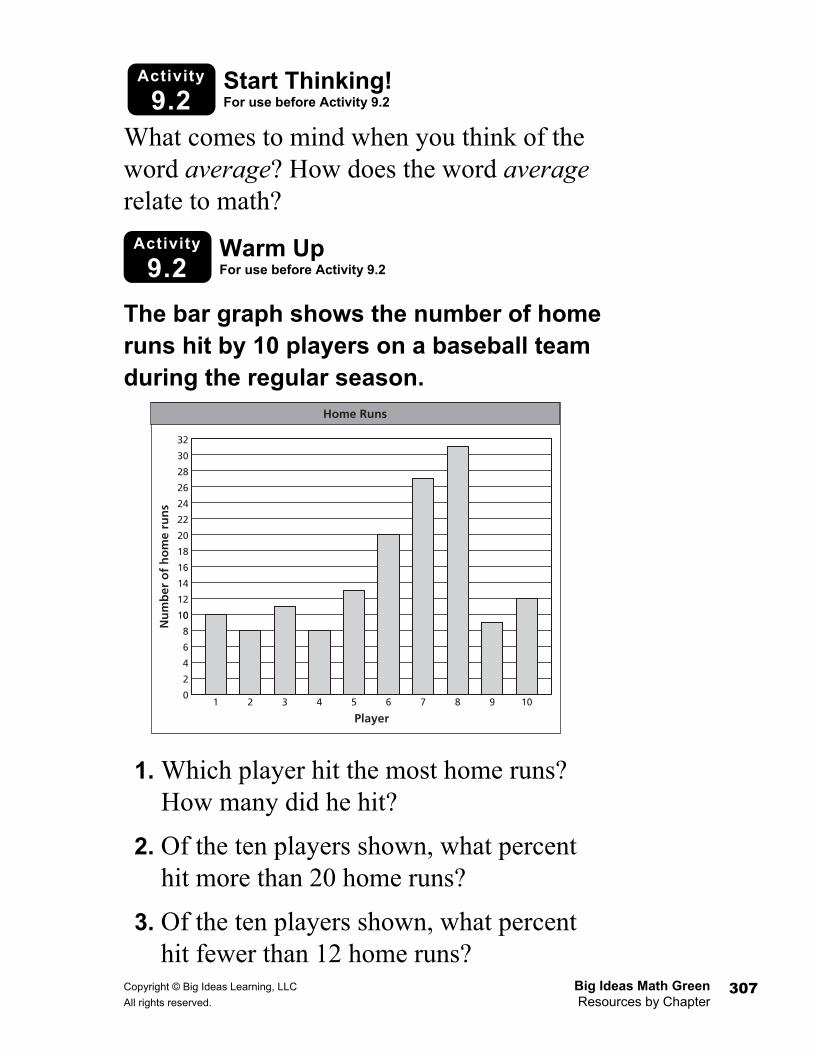
The bar graph shows the number of home runs hit by 10 players on a baseball team during the regular season.
1. Which player hit the most home runs? How many did he hit?
2. Of the ten players shown, what percent hit more than 20 home runs?
3. Of the ten players shown, what percent hit fewer than 12 home runs?
Home Runs
16
18
20
22
24
26
28
30
32
32
1 2 3 4 5 6 7 8 9 10
14
12
0
Nu
mb
er o
f h
om
e ru
ns
10
8
6
4
2
0
Player
Big Ideas Math Green Copyright © Big Ideas Learning, LLC Resources by Chapter All rights reserved. 308
Lesson
9.2 Warm Up For use before Lesson 9.2
Lesson
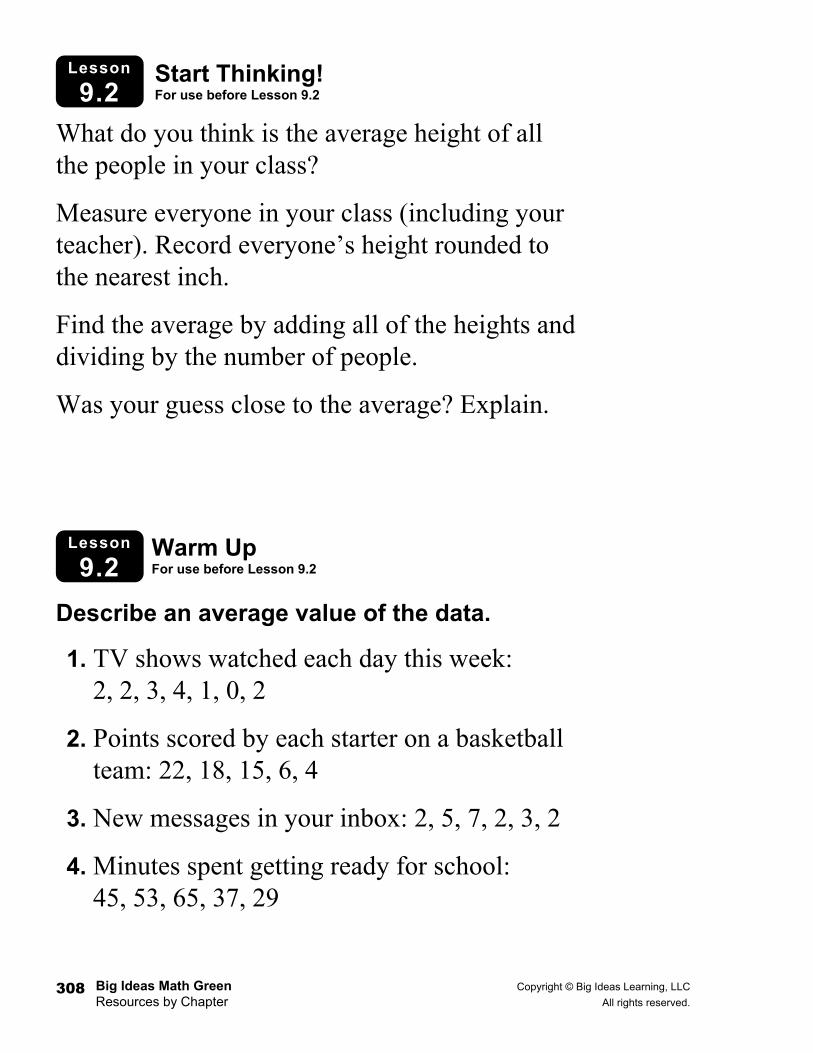
9.2 Start Thinking! For use before Lesson 9.2
What do you think is the average height of all the people in your class?
Measure everyone in your class (including your teacher). Record everyone’s height rounded to the nearest inch.
Find the average by adding all of the heights and dividing by the number of people.
Was your guess close to the average? Explain.
Describe an average value of the data.
1. TV shows watched each day this week: 2, 2, 3, 4, 1, 0, 2
2. Points scored by each starter on a basketball team: 22, 18, 15, 6, 4
3. New messages in your inbox: 2, 5, 7, 2, 3, 2
4. Minutes spent getting ready for school: 45, 53, 65, 37, 29
Copyright © Big Ideas Learning, LLC Big Ideas Math Green All rights reserved. Resources by Chapter
309
9.2 Practice A
Name _________________________________________________________ Date __________
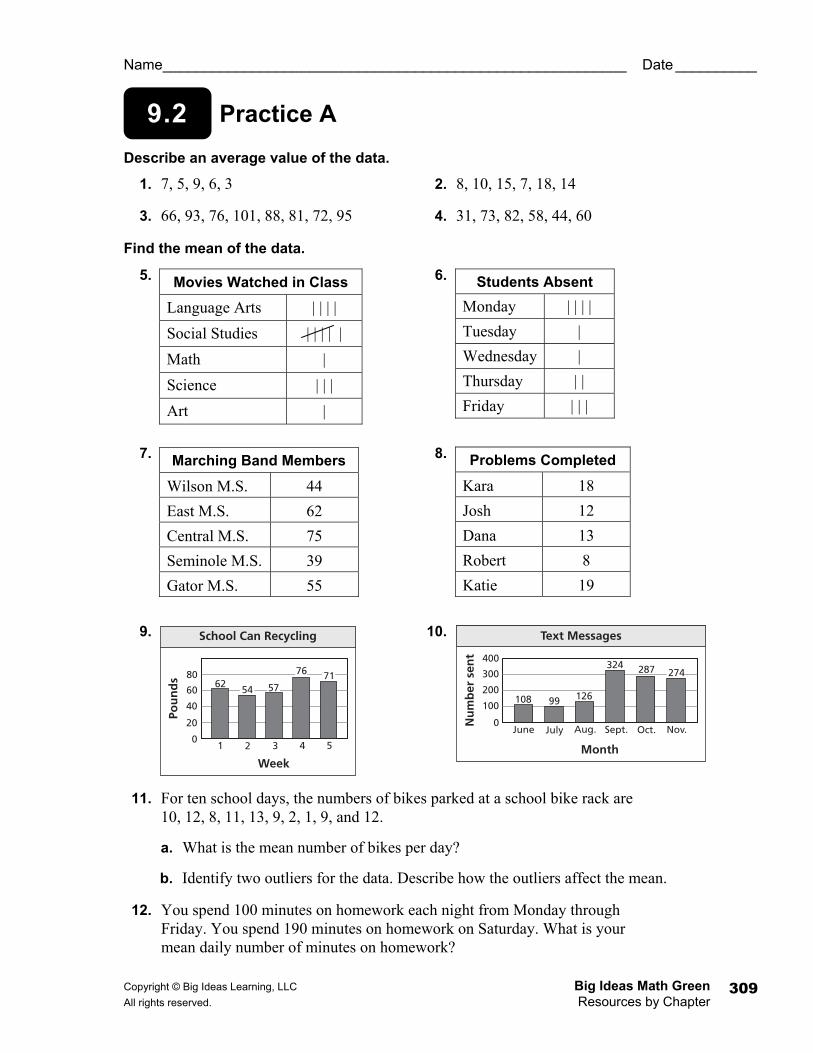
Describe an average value of the data.
1. 7, 5, 9, 6, 3 2. 8, 10, 15, 7, 18, 14
3. 66, 93, 76, 101, 88, 81, 72, 95 4. 31, 73, 82, 58, 44, 60
Find the mean of the data.
5. 6.
7. 8.
9. 10.
11. For ten school days, the numbers of bikes parked at a school bike rack are 10, 12, 8, 11, 13, 9, 2, 1, 9, and 12.
a. What is the mean number of bikes per day?
b. Identify two outliers for the data. Describe how the outliers affect the mean.
12. You spend 100 minutes on homework each night from Monday through Friday. You spend 190 minutes on homework on Saturday. What is your mean daily number of minutes on homework?
Marching Band Members
Wilson M.S. 44
East M.S. 62
Central M.S. 75
Seminole M.S. 39
Gator M.S. 55
Problems Completed
Kara 18
Josh 12
Dana 13
Robert 8
Katie 19
Movies Watched in Class
Language Arts | | | |
Social Studies | | | | |
Math |
Science | | |
Art |
Students Absent Monday | | | |
Tuesday |
Wednesday |
Thursday | |
Friday | | |
20
40
60
80
01 2 3 4 5
Week
Pou
nd
s
School Can Recycling
6254 57
76 71
100
200
300
400
0June July Aug. Sept. Oct. Nov.
Month
Nu
mb
er s
ent
Text Messages
108 99 126
324 287 274
Big Ideas Math Green Copyright © Big Ideas Learning, LLC Resources by Chapter All rights reserved. 310
9.2 Practice B
Name _________________________________________________________ Date _________
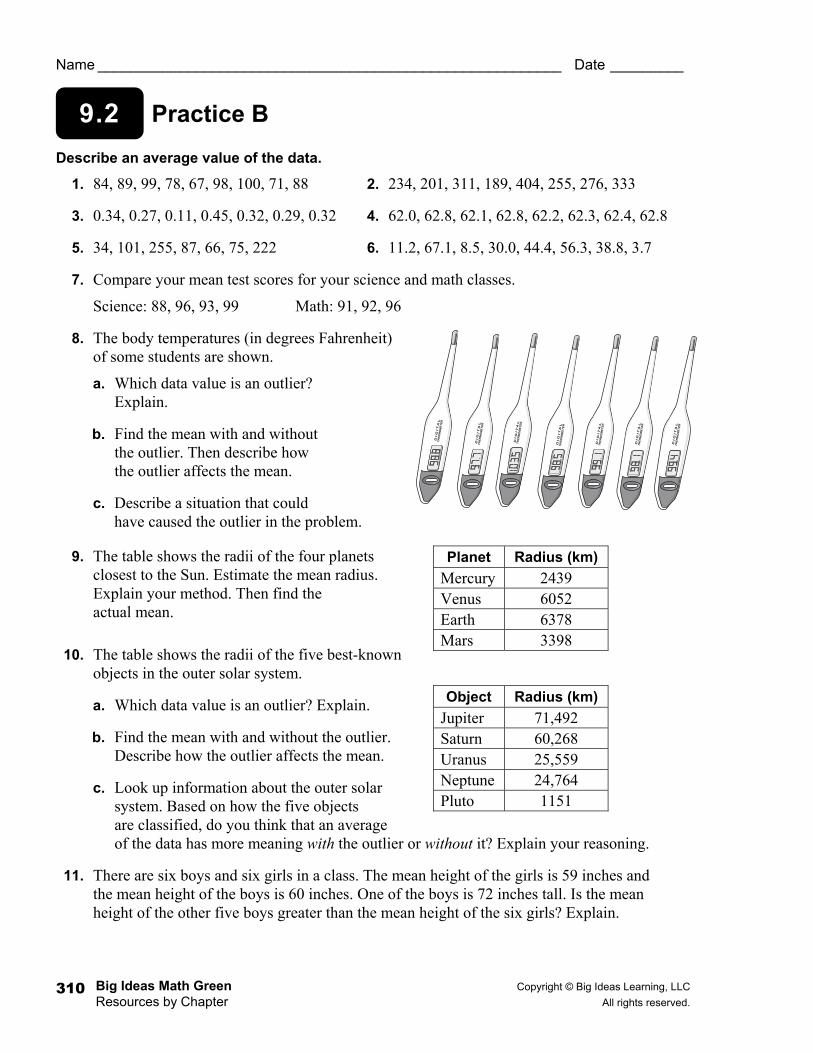
Describe an average value of the data.
1. 84, 89, 99, 78, 67, 98, 100, 71, 88 2. 234, 201, 311, 189, 404, 255, 276, 333
3. 0.34, 0.27, 0.11, 0.45, 0.32, 0.29, 0.32 4. 62.0, 62.8, 62.1, 62.8, 62.2, 62.3, 62.4, 62.8
5. 34, 101, 255, 87, 66, 75, 222 6. 11.2, 67.1, 8.5, 30.0, 44.4, 56.3, 38.8, 3.7
7. Compare your mean test scores for your science and math classes.
Science: 88, 96, 93, 99 Math: 91, 92, 96
8. The body temperatures (in degrees Fahrenheit) of some students are shown.
a. Which data value is an outlier? Explain.
b. Find the mean with and without the outlier. Then describe how the outlier affects the mean.
c. Describe a situation that could have caused the outlier in the problem.
9. The table shows the radii of the four planets closest to the Sun. Estimate the mean radius. Explain your method. Then find the actual mean.
10. The table shows the radii of the five best-known objects in the outer solar system.
a. Which data value is an outlier? Explain.
b. Find the mean with and without the outlier. Describe how the outlier affects the mean.
c. Look up information about the outer solar system. Based on how the five objects are classified, do you think that an average of the data has more meaning with the outlier or without it? Explain your reasoning.
11. There are six boys and six girls in a class. The mean height of the girls is 59 inches and the mean height of the boys is 60 inches. One of the boys is 72 inches tall. Is the mean height of the other five boys greater than the mean height of the six girls? Explain.
Planet Radius (km) Mercury 2439 Venus 6052 Earth 6378 Mars 3398
Object Radius (km) Jupiter 71,492 Saturn 60,268 Uranus 25,559 Neptune 24,764 Pluto 1151
Copyright © Big Ideas Learning, LLC Big Ideas Math Green All rights reserved. Resources by Chapter
311
9.2 Enrichment and Extension
Name _________________________________________________________ Date __________
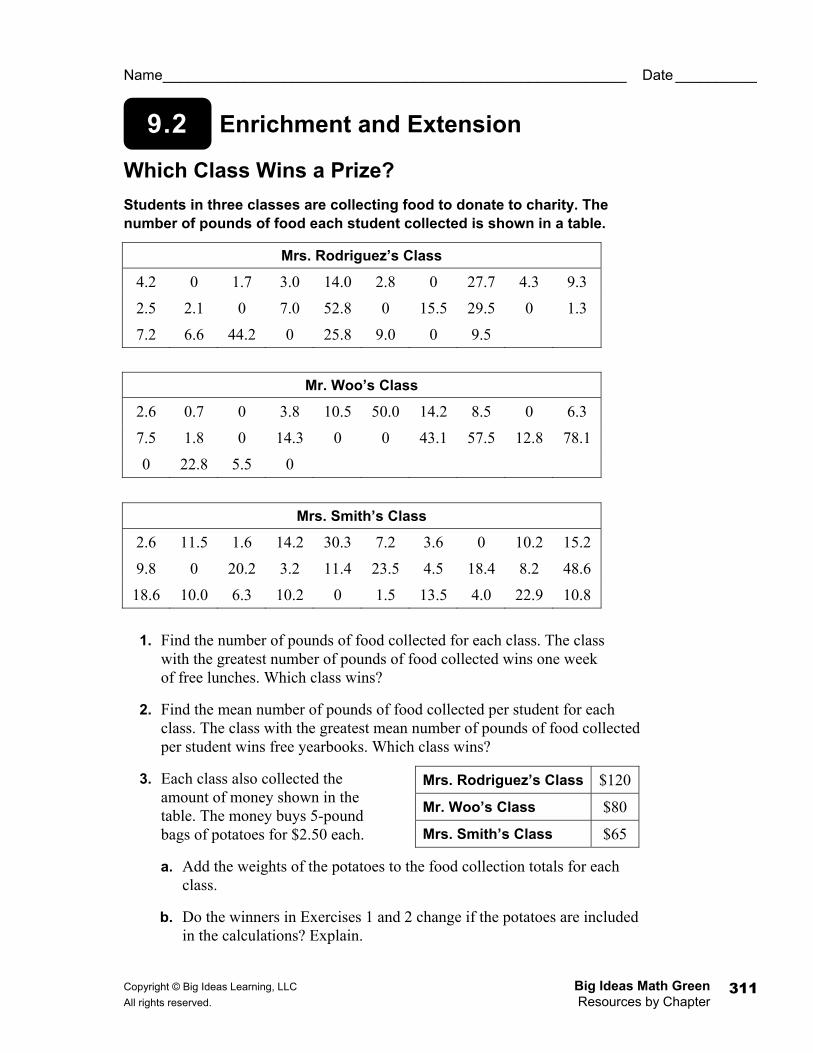
Which Class Wins a Prize? Students in three classes are collecting food to donate to charity. The number of pounds of food each student collected is shown in a table.
1. Find the number of pounds of food collected for each class. The class with the greatest number of pounds of food collected wins one week of free lunches. Which class wins?
2. Find the mean number of pounds of food collected per student for each class. The class with the greatest mean number of pounds of food collected per student wins free yearbooks. Which class wins?
3. Each class also collected the amount of money shown in the table. The money buys 5-pound bags of potatoes for $2.50 each.
a. Add the weights of the potatoes to the food collection totals for each class.
b. Do the winners in Exercises 1 and 2 change if the potatoes are included in the calculations? Explain.
Mrs. Rodriguez’s Class $120
Mr. Woo’s Class $80
Mrs. Smith’s Class $65
Mrs. Rodriguez’s Class
4.2 0 1.7 3.0 14.0 2.8 0 27.7 4.3 9.3
2.5 2.1 0 7.0 52.8 0 15.5 29.5 0 1.3
7.2 6.6 44.2 0 25.8 9.0 0 9.5
Mr. Woo’s Class
2.6 0.7 0 3.8 10.5 50.0 14.2 8.5 0 6.3
7.5 1.8 0 14.3 0 0 43.1 57.5 12.8 78.1
0 22.8 5.5 0
Mrs. Smith’s Class
2.6 11.5 1.6 14.2 30.3 7.2 3.6 0 10.2 15.2
9.8 0 20.2 3.2 11.4 23.5 4.5 18.4 8.2 48.6
18.6 10.0 6.3 10.2 0 1.5 13.5 4.0 22.9 10.8

Big Ideas Math Green Copyright © Big Ideas Learning, LLC Resources by Chapter All rights reserved. 312
Puzzle Time
Name _________________________________________________________ Date _________
What Is Really Easy To Get Into, But Really Hard To Get Out Of? Write the letter of each answer in the box containing the exercise number.
Find the mean of the data.
1. 2. 3.
4.
5. 12, 15, 18, 22, 25, 28 6. 2.6, 2.9, 3.2, 4.2, 5.6
Find the outlier of the data.
7. 60, 55, 65, 8, 57, 62 8. 2, 2, 3, 3, 4, 32
9. 11, 13, 13, 15, 15, 76 10. 18, 17, 1, 15, 19, 23
9.2
Answers
G. 4
O. 3.7
E. 76
I. 2
R. 20
B. 32
U. 17
L. 3
T. 8
B. 1
Number of Text Messages Per Day
Jill 22
Dylan 15
Bill 18
Bella 20
Drew 10
Number of Cats Owned
Louise | | |
Ted | |
Mark | |
Alexis |
Number of TVs in Home
Spencer
Megan
Tyler
Ann
Beth
Ashley
Mike
Number of Visits
to the Stadium
Matt Brady Olivia Ellie Riley Noah Sam
8 2 3 7 5 6 1 10 4 9
Copyright © Big Ideas Learning, LLC Big Ideas Math Green All rights reserved. Resources by Chapter
313
Activity
9.3 Warm Up For use before Activity 9.3
Activity
9.3 Start Thinking! For use before Activity 9.3
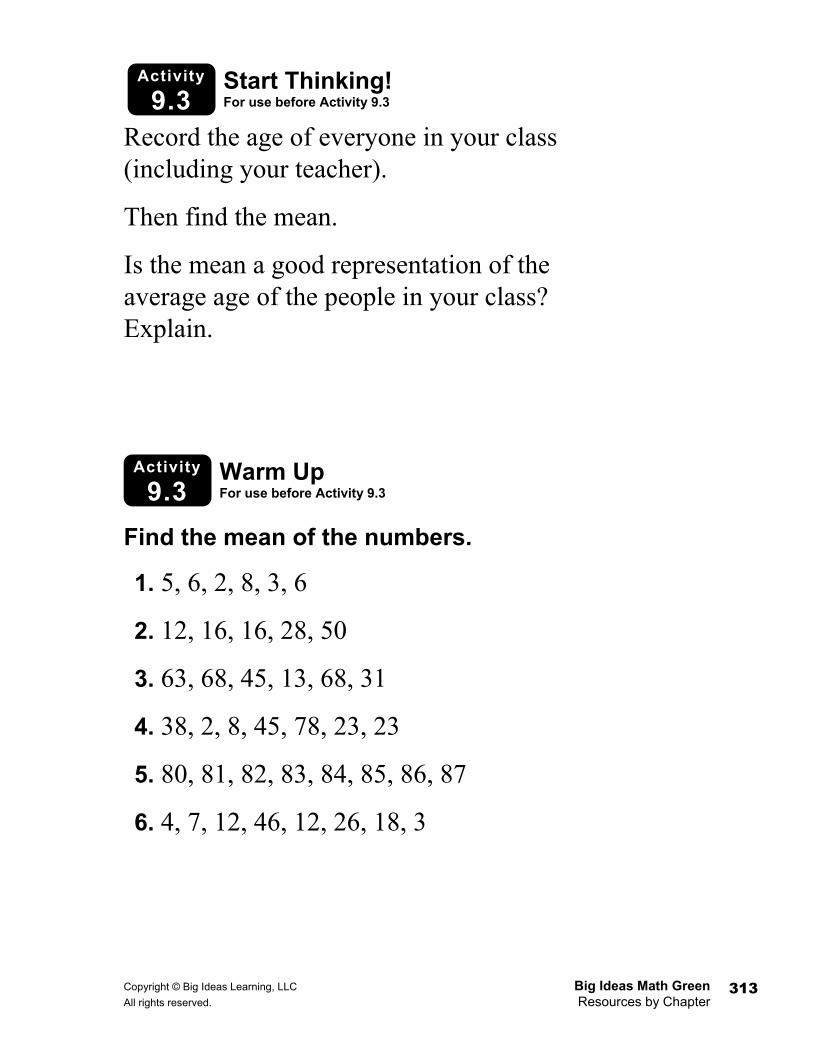
Record the age of everyone in your class (including your teacher).
Then find the mean.
Is the mean a good representation of the average age of the people in your class? Explain.
Find the mean of the numbers.
1. 5, 6, 2, 8, 3, 6
2. 12, 16, 16, 28, 50
3. 63, 68, 45, 13, 68, 31
4. 38, 2, 8, 45, 78, 23, 23
5. 80, 81, 82, 83, 84, 85, 86, 87
6. 4, 7, 12, 46, 12, 26, 18, 3
Big Ideas Math Green Copyright © Big Ideas Learning, LLC Resources by Chapter All rights reserved. 314
Lesson
9.3 Warm Up For use before Lesson 9.3
Lesson
9.3 Start Thinking! For use before Lesson 9.3
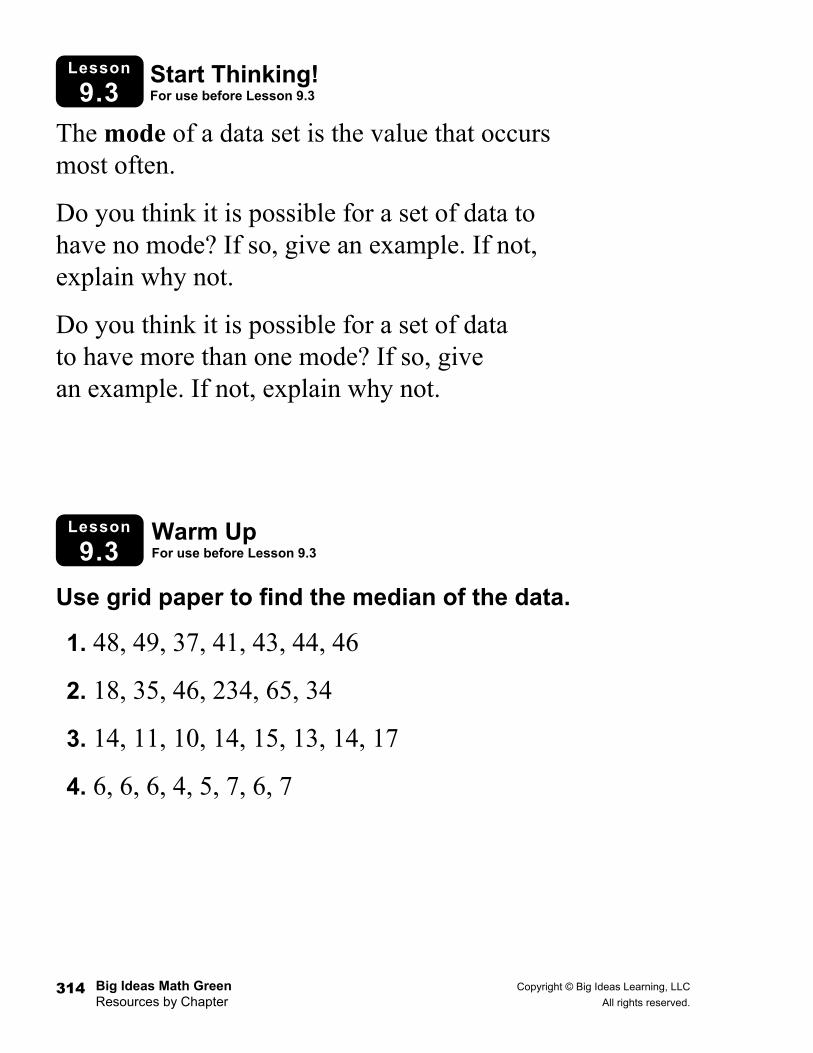
The mode of a data set is the value that occurs most often.
Do you think it is possible for a set of data to have no mode? If so, give an example. If not, explain why not.
Do you think it is possible for a set of data to have more than one mode? If so, give an example. If not, explain why not.
Use grid paper to find the median of the data.
1. 48, 49, 37, 41, 43, 44, 46
2. 18, 35, 46, 234, 65, 34
3. 14, 11, 10, 14, 15, 13, 14, 17
4. 6, 6, 6, 4, 5, 7, 6, 7

Copyright © Big Ideas Learning, LLC Big Ideas Math Green All rights reserved. Resources by Chapter
315
9.3 Practice A
Name _________________________________________________________ Date __________
Find the median and mode(s) of the data.
1. 1, 3, 5, 6, 7, 9, 11 2. 2, 2, 6, 8, 10, 14
3. 12, 15, 10, 12, 21, 9, 12 4. 15, 22, 21, 22, 12, 16
5. 52, 61, 56, 55, 72, 64 6. 71, 51, 37, 44, 50, 49, 55
7. 91, 96, 89, 97, 89, 98, 94, 93 8. 55, 60, 60, 40, 60, 75, 40, 25
9. Describe and correct the error in finding the median and mode of the data.
Find the mode(s) of the data.
10. 11.
Find the mean, median, and mode(s) of the data. Choose the measure that best represents the data. Explain your reasoning.
12. 6, 35, 8, 20, 6, 16, 7 13. 66, 57, 66, 16, 2, 35, 66, 114
14. You sent the same email message to 10 of your friends. The numbers of hours it took them to reply were 1, 1, 1, 2, 2, 3, 4, 5, 5, and 25.
a. Find the mean, median, and mode of the data.
b. Which measure best represents the data? Explain your reasoning.
c. Which data value is an outlier? Explain your answer.
d. Predict how the mean, median, and mode would change if you omit the outlier in the data list.
Breeds of Dogs in a Pet Hotel
lab poodle beagle
schnauzer lab pug
pit bull boxer pit bull
beagle akita poodle
boxer pit bull lab
Students’ Initials
TC AT RC CC LD
DT LB TR SS TL
JG RL JC MB GR
FM MS DR BB JT
RG PS MJ WS FC
data: 25, 28, 24, 22, 27, 24, 29, 26
ordered data: 22, 24, 25, 26, 27, 28, 29
The median is 26. There is no mode.
Big Ideas Math Green Copyright © Big Ideas Learning, LLC Resources by Chapter All rights reserved. 316
9.3 Practice B
Name _________________________________________________________ Date _________
Find the mean, median, and mode(s) of the data. Choose the measure that best represents the data. Explain your reasoning.
1. 83, 68, 56, 100, 78, 94, 74 2. 55, 65, 49, 22, 56, 65, 61, 57
3. 104, 128, 72, 73, 75, 73, 119 4. 20.1, 13.4, 9.8, 21.3, 20.8, 19.1, 68.1, 22.6
Find the mean, median, and mode(s) of the data with and without the outlier. Describe the effect of the outlier on the measures of central tendency.
5. 72, 75, 26, 65, 72, 67, 71 6. 70, 85, 150, 70, 85, 65, 65, 85
Find the mean, median, and mode(s) of the data.
7. 0.39, 0.52, 0.30, 0.33, 0.44, 0.42 8. 2.4, 1.6, 1.2, 2.4, 2.7, 1.9, 2.5, 2.1
9. 1 1 1 2 5 1
, , , , ,3 2 6 3 6 2
10. 1 1 3 1 1 5 1 3
4 , 2 , 4 , 1 , 3 , 3 , 4 , 28 4 4 4 2 8 8 8
Find the mode(s) of the data.
11. A, B, D, C, D, B, A, B, C, B, A 12. X, Y, X, X, Y, Y, Y, X, X, Y, X, Y, X
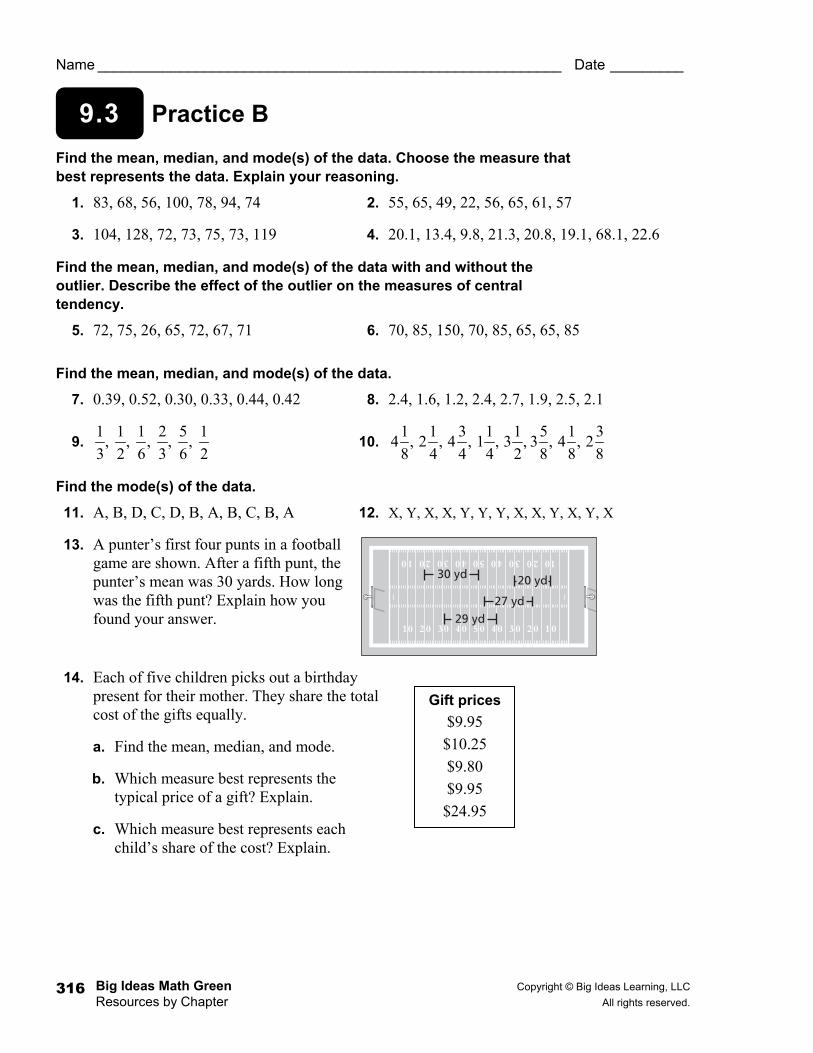
13. A punter’s first four punts in a football game are shown. After a fifth punt, the punter’s mean was 30 yards. How long was the fifth punt? Explain how you found your answer.
14. Each of five children picks out a birthday present for their mother. They share the total cost of the gifts equally.
a. Find the mean, median, and mode.
b. Which measure best represents the typical price of a gift? Explain.
c. Which measure best represents each child’s share of the cost? Explain.
Gift prices $9.95
$10.25
$9.80
$9.95
$24.95
30 yd 20 yd
27 yd29 yd
Copyright © Big Ideas Learning, LLC Big Ideas Math Green All rights reserved. Resources by Chapter
317
9.3 Enrichment and Extension
Name _________________________________________________________ Date __________
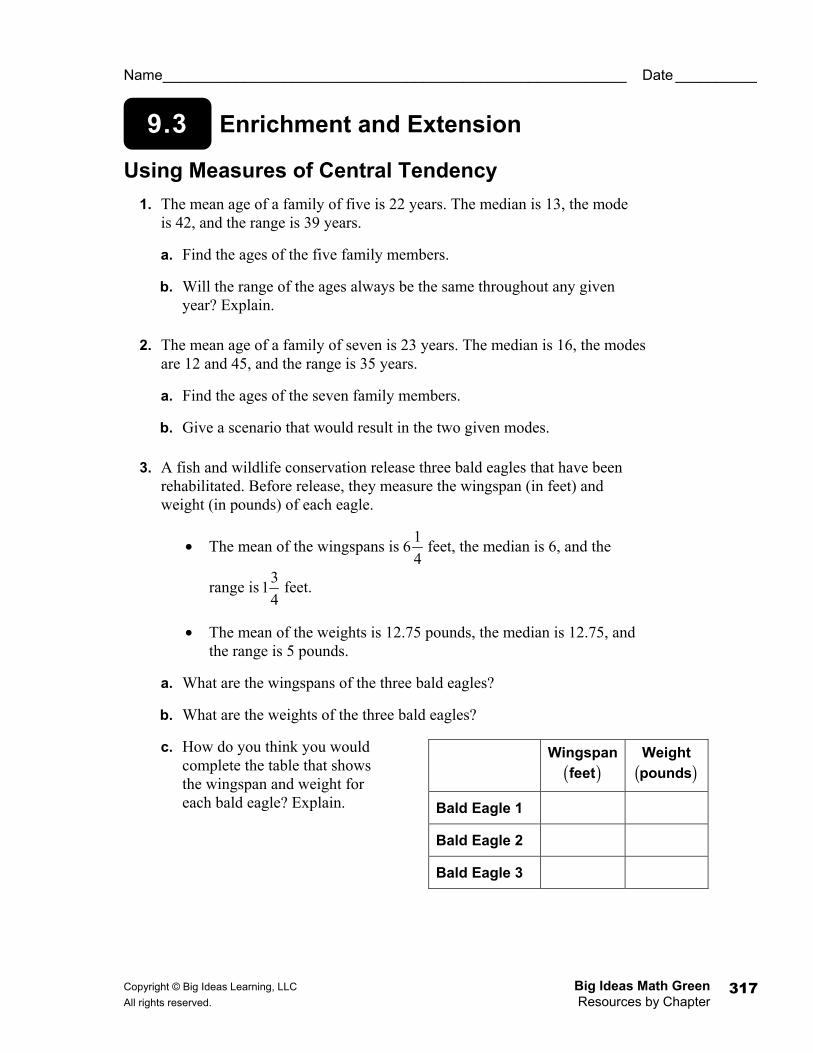
Using Measures of Central Tendency 1. The mean age of a family of five is 22 years. The median is 13, the mode
is 42, and the range is 39 years.
a. Find the ages of the five family members.
b. Will the range of the ages always be the same throughout any given year? Explain.
2. The mean age of a family of seven is 23 years. The median is 16, the modes are 12 and 45, and the range is 35 years.
a. Find the ages of the seven family members.
b. Give a scenario that would result in the two given modes.
3. A fish and wildlife conservation release three bald eagles that have been rehabilitated. Before release, they measure the wingspan (in feet) and weight (in pounds) of each eagle.
• The mean of the wingspans is1
64
feet, the median is 6, and the
range is3
14
feet.
• The mean of the weights is 12.75 pounds, the median is 12.75, and the range is 5 pounds.
a. What are the wingspans of the three bald eagles?
b. What are the weights of the three bald eagles?
c. How do you think you would complete the table that shows the wingspan and weight for each bald eagle? Explain.
Wingspan( )feet
Weight( )pounds
Bald Eagle 1
Bald Eagle 2
Bald Eagle 3

Big Ideas Math Green Copyright © Big Ideas Learning, LLC Resources by Chapter All rights reserved. 318
Puzzle Time
Name _________________________________________________________ Date _________
What Should Always Go Up When The Rain Is Pouring Down? Write the letter of each answer in the box containing the exercise number.
Find the mean, median, and mode(s) of the data.
1. 4, 6, 8, 10, 12, 4, 12
2. 13, 18, 15, 12, 15, 17
3. 94, 82, 95, 72, 90, 92, 95, 100
4. 43, 12, 35, 51, 18, 26, 32
5. 14, 35, 20, 30, 31, 14, 19, 6, 2
6. 50, 39, 35, 50, 44, 39, 53, 66
Find the mode of the data.
7. 8.
Answers
U. 19, 19, 1
F. Soccer
T. Apples
R. 15, 15, 15
P. Spaghetti
L. Gymnastics
A. 31, 32, none
B. 8, 8, 4, and 12
W. Football
L. 47, 47, 39 and 50
M. 90, 93, 95
E. Pizza
9.3
Favorite Sport
Soccer Gymnastics
Baseball Baseball
Swimming Soccer
Football Gymnastics
Gymnastics Basketball
Golf Lacrosse
Basketball Golf
Hockey Football
Favorite Food
Pizza Pizza
Cheeseburger Spaghetti
Apples Cheeseburger
Spaghetti Pizza
Hot dog Spaghetti
Pizza Apples
Cheeseburger Hot dog
5 3 1 2 8 7 6 4
Copyright © Big Ideas Learning, LLC Big Ideas Math Green All rights reserved. Resources by Chapter
319
Activity
9.4 Start Thinking! For use before Activity 9.4
Activity
9.4 Warm Up For use before Activity 9.4
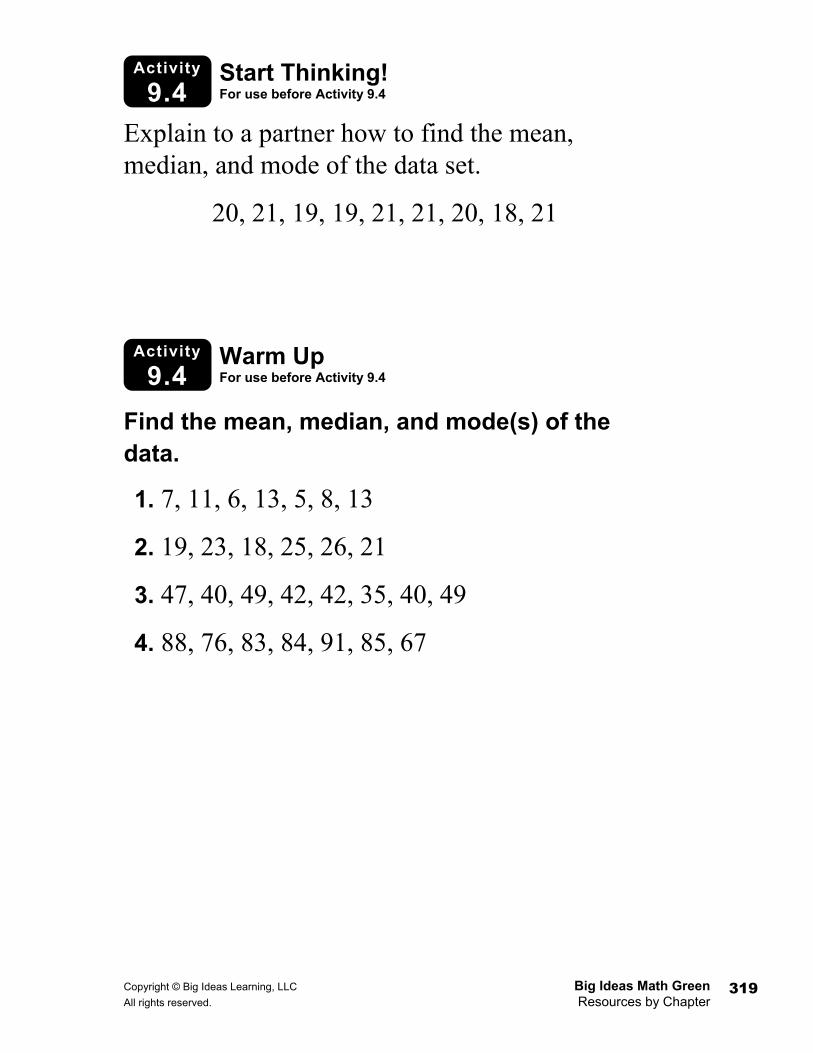
Explain to a partner how to find the mean, median, and mode of the data set.
20, 21, 19, 19, 21, 21, 20, 18, 21
Find the mean, median, and mode(s) of the data.
1. 7, 11, 6, 13, 5, 8, 13
2. 19, 23, 18, 25, 26, 21
3. 47, 40, 49, 42, 42, 35, 40, 49
4. 88, 76, 83, 84, 91, 85, 67

Big Ideas Math Green Copyright © Big Ideas Learning, LLC Resources by Chapter All rights reserved. 320
Lesson
9.4 Warm Up For use before Lesson 9.4
Lesson
9.4 Start Thinking! For use before Lesson 9.4
Make a dot plot of each data set. Identify the data set that is the least spread out and the data set that is the most spread out.
Set 1: 98, 93, 92, 99, 100
Set 2: 75, 87, 92, 92, 74
Set 3: 88, 89, 91, 92, 90
Use grid paper to find the median of the data. Then find the median of the lower half and the median of the upper half of the data. Describe the spread of the data.
1. 10, 12, 17, 11, 18, 11, 13
2. 23, 34, 21, 30, 30, 26, 28
3. 54, 52, 55, 54, 55, 53, 56
4. 98, 95, 75, 87, 93, 90, 88
Copyright © Big Ideas Learning, LLC Big Ideas Math Green All rights reserved. Resources by Chapter
321
9.4 Practice A
Name _________________________________________________________ Date __________
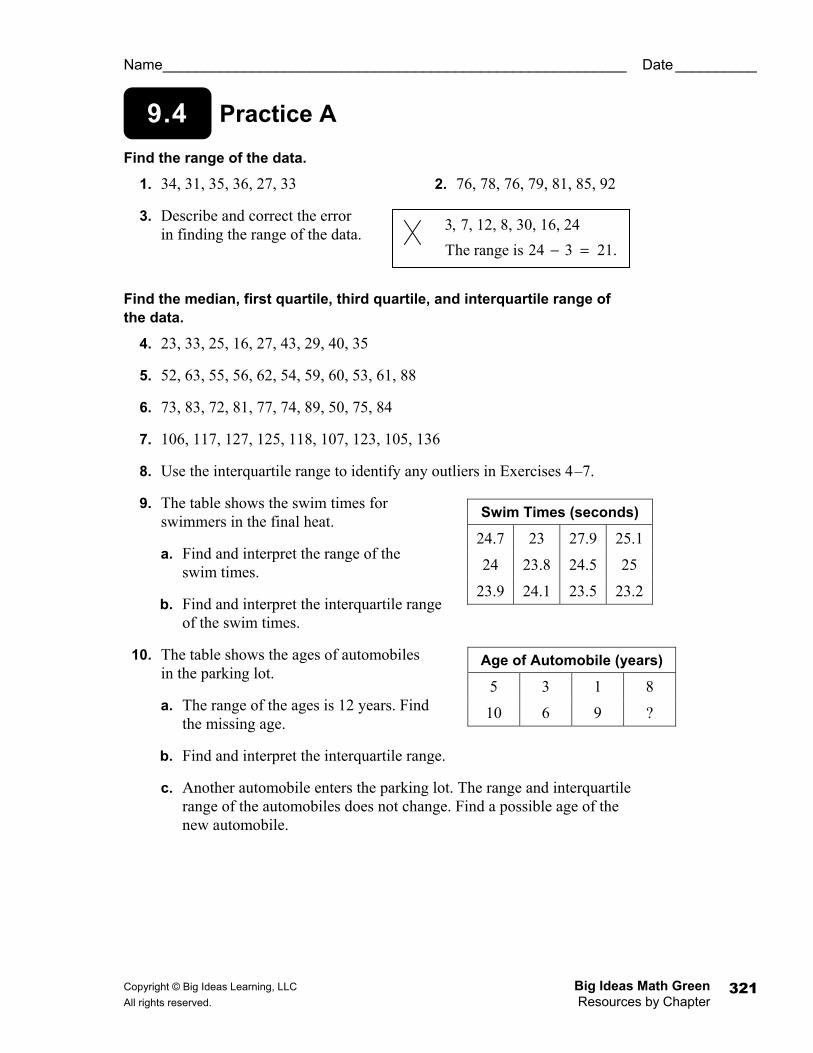
Find the range of the data.
1. 34, 31, 35, 36, 27, 33 2. 76, 78, 76, 79, 81, 85, 92
3. Describe and correct the error in finding the range of the data.
Find the median, first quartile, third quartile, and interquartile range of the data.
4. 23, 33, 25, 16, 27, 43, 29, 40, 35
5. 52, 63, 55, 56, 62, 54, 59, 60, 53, 61, 88
6. 73, 83, 72, 81, 77, 74, 89, 50, 75, 84
7. 106, 117, 127, 125, 118, 107, 123, 105, 136
8. Use the interquartile range to identify any outliers in Exercises 4–7.
9. The table shows the swim times for swimmers in the final heat.
a. Find and interpret the range of the swim times.
b. Find and interpret the interquartile range of the swim times.
10. The table shows the ages of automobiles in the parking lot.
a. The range of the ages is 12 years. Find the missing age.
b. Find and interpret the interquartile range.
c. Another automobile enters the parking lot. The range and interquartile range of the automobiles does not change. Find a possible age of the new automobile.
Swim Times (seconds)
24.7 23 27.9 25.1
24 23.8 24.5 25
23.9 24.1 23.5 23.2
Age of Automobile (years)
5 3 1 8
10 6 9 ?
3, 7, 12, 8, 30, 16, 24
The range is 24 3 21.− =
Big Ideas Math Green Copyright © Big Ideas Learning, LLC Resources by Chapter All rights reserved. 322
9.4 Practice B
Name _________________________________________________________ Date _________
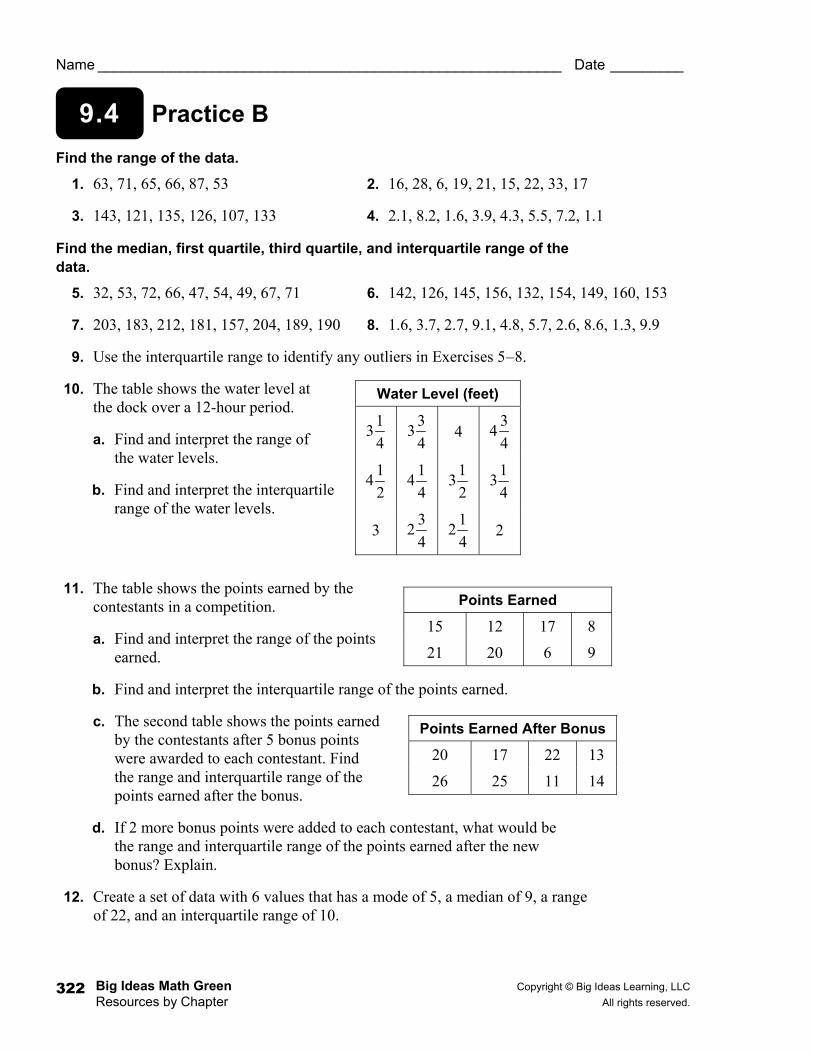
Find the range of the data.
1. 63, 71, 65, 66, 87, 53 2. 16, 28, 6, 19, 21, 15, 22, 33, 17
3. 143, 121, 135, 126, 107, 133 4. 2.1, 8.2, 1.6, 3.9, 4.3, 5.5, 7.2, 1.1
Find the median, first quartile, third quartile, and interquartile range of the data.
5. 32, 53, 72, 66, 47, 54, 49, 67, 71 6. 142, 126, 145, 156, 132, 154, 149, 160, 153
7. 203, 183, 212, 181, 157, 204, 189, 190 8. 1.6, 3.7, 2.7, 9.1, 4.8, 5.7, 2.6, 8.6, 1.3, 9.9
9. Use the interquartile range to identify any outliers in Exercises 5–8.
10. The table shows the water level at the dock over a 12-hour period.
a. Find and interpret the range of the water levels.
b. Find and interpret the interquartile range of the water levels.
11. The table shows the points earned by the contestants in a competition.
a. Find and interpret the range of the points earned.
b. Find and interpret the interquartile range of the points earned.
c. The second table shows the points earned by the contestants after 5 bonus points were awarded to each contestant. Find the range and interquartile range of the points earned after the bonus.
d. If 2 more bonus points were added to each contestant, what would be the range and interquartile range of the points earned after the new bonus? Explain.
12. Create a set of data with 6 values that has a mode of 5, a median of 9, a range of 22, and an interquartile range of 10.
Water Level (feet)
13
4
33
4 4
34
4
14
2
14
4
13
2
13
4
3 3
24
12
42
Points Earned
15 12 17 8
21 20 6 9
Points Earned After Bonus
20 17 22 13
26 25 11 14

Copyright © Big Ideas Learning, LLC Big Ideas Math Green All rights reserved. Resources by Chapter
323
9.4 Enrichment and Extension
Name _________________________________________________________ Date __________
Showing Interquartile Range The first and third quartile, and the median can be plotted on a number line to show where each equal part of the data lies. This method allows you to see how spread out or condensed the data is.
Example: Find the median, first quartile, and third quartile of the data shown. Then plot each on a number line.
4, 5, 3, 6, 5, 23
3 , 4 , 5, 5, 6 , 23 Arrange to find the median = 5.
Lower Half: 3, 4, 5 =1 4Q
Upper Half: 5, 6, 23 =3 6Q
Plot each on a number line to see the interquartile range.
Find the median, first quartile, and third quartile of the data. Then plot each on a number line and find the interquartile range.
1. 158, 151, 166, 150, 161, 155, 156, 161, 159, 162
2. 80, 62, 75, 80, 78, 66, 85
3. 15, 15, 15, 15, 15, 15, 16, 15, 16
4. 10, 13, 15, 14
5. 201, 209, 191, 200, 200, 194, 206, 199
6. 201, 19, 401, 1, 389, 11, 199, 381
median
3 6 9 12 15 18 21
Q1 Q3
Big Ideas Math Green Copyright © Big Ideas Learning, LLC Resources by Chapter All rights reserved. 324
Puzzle Time
Name _________________________________________________________ Date _________
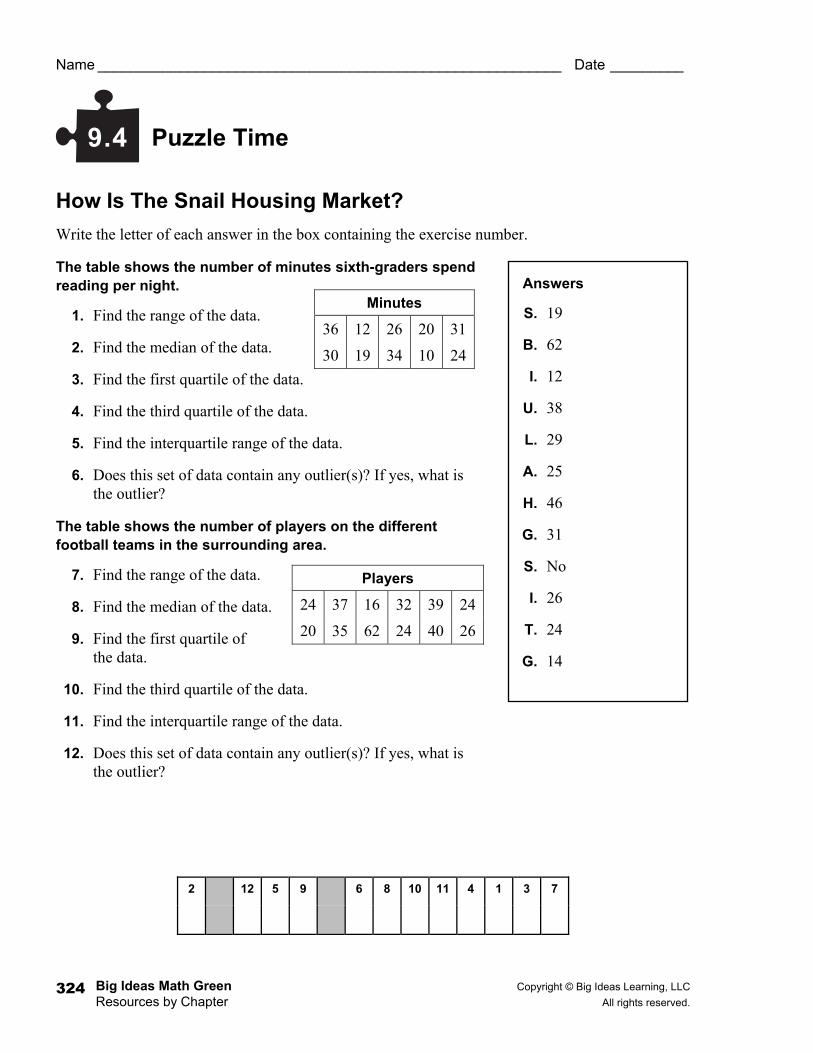
How Is The Snail Housing Market? Write the letter of each answer in the box containing the exercise number.
The table shows the number of minutes sixth-graders spend reading per night.
1. Find the range of the data.
2. Find the median of the data.
3. Find the first quartile of the data.
4. Find the third quartile of the data.
5. Find the interquartile range of the data.
6. Does this set of data contain any outlier(s)? If yes, what is the outlier?
The table shows the number of players on the different football teams in the surrounding area.
7. Find the range of the data.
8. Find the median of the data.
9. Find the first quartile of the data.
10. Find the third quartile of the data.
11. Find the interquartile range of the data.
12. Does this set of data contain any outlier(s)? If yes, what is the outlier?
2 12 5 9 6 8 10 11 4 1 3 7
Answers
S. 19
B. 62
I. 12
U. 38
L. 29
A. 25
H. 46
G. 31
S. No
I. 26
T. 24
G. 14
9.4
Minutes
36 12 26 20 31
30 19 34 10 24
Players
24 37 16 32 39 24
20 35 62 24 40 26
Copyright © Big Ideas Learning, LLC Big Ideas Math Green All rights reserved. Resources by Chapter
325
Activity
9.5 Start Thinking! For use before Activity 9.5
Activity
9.5 Warm Up For use before Activity 9.5
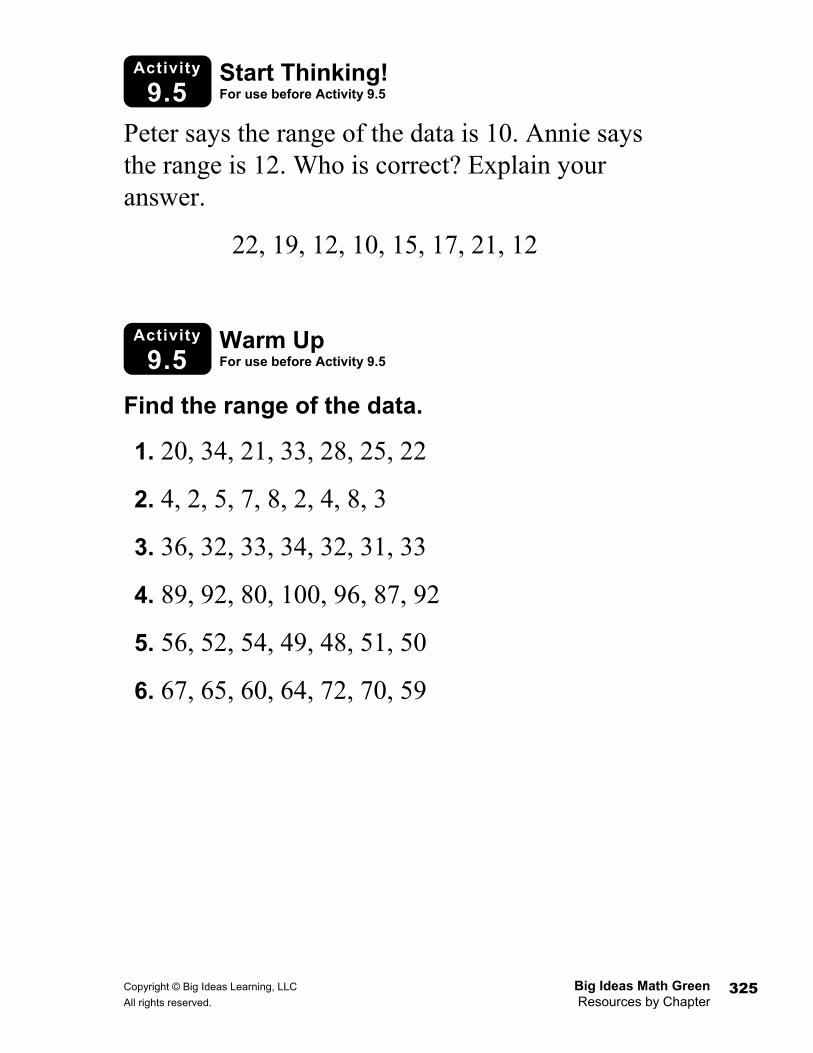
Peter says the range of the data is 10. Annie says the range is 12. Who is correct? Explain your answer.
22, 19, 12, 10, 15, 17, 21, 12
Find the range of the data.
1. 20, 34, 21, 33, 28, 25, 22
2. 4, 2, 5, 7, 8, 2, 4, 8, 3
3. 36, 32, 33, 34, 32, 31, 33
4. 89, 92, 80, 100, 96, 87, 92
5. 56, 52, 54, 49, 48, 51, 50
6. 67, 65, 60, 64, 72, 70, 59
Big Ideas Math Green Copyright © Big Ideas Learning, LLC Resources by Chapter All rights reserved. 326
Lesson
9.5 Warm Up For use before Lesson 9.5
Lesson
9.5 Start Thinking! For use before Lesson 9.5
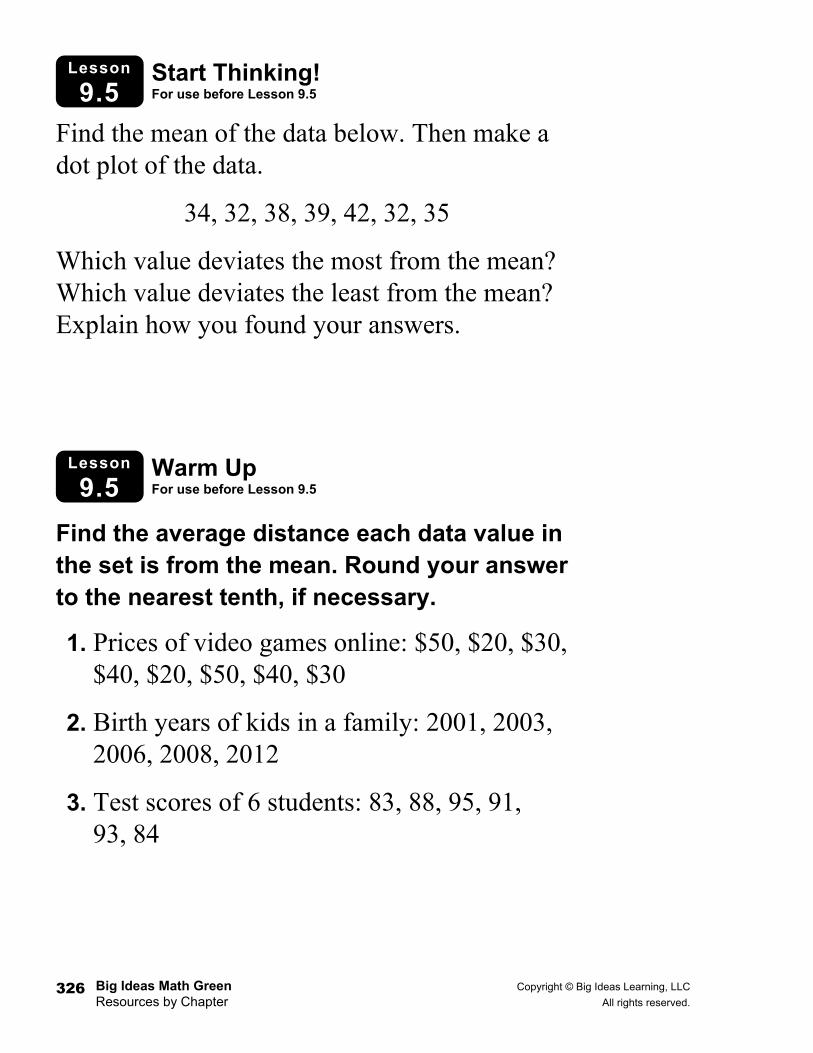
Find the mean of the data below. Then make a dot plot of the data.
34, 32, 38, 39, 42, 32, 35
Which value deviates the most from the mean? Which value deviates the least from the mean? Explain how you found your answers.
Find the average distance each data value in the set is from the mean. Round your answer to the nearest tenth, if necessary.
1. Prices of video games online: $50, $20, $30, $40, $20, $50, $40, $30
2. Birth years of kids in a family: 2001, 2003, 2006, 2008, 2012
3. Test scores of 6 students: 83, 88, 95, 91, 93, 84

Copyright © Big Ideas Learning, LLC Big Ideas Math Green All rights reserved. Resources by Chapter
327
9.5 Practice A
Name _________________________________________________________ Date __________
Find the average distance each data value in the set is from the mean. Round your answer to the nearest tenth, if necessary.
1. Numbers of houses on a street: 12, 8, 9, 11, 10
2. Years of birth: 1958, 2001, 1989, 1995, 1986, 2002
Find and interpret the mean absolute deviation of the data. Round your answer to the nearest tenth, if necessary.
3. 4.
5. 6.
7. The table shows the number of lawns mowed each day of the week. Find and interpret the range, interquartile range, and mean absolute deviation of the data. Round your answer to the nearest tenth, if necessary.
Which data set do you think would have the greater mean absolute deviation? Explain your reasoning.
8. numbers of bicycles parked in a garage
numbers of bicycles parked at a school
9. the number of miles driven each day
the number of miles walked each day
Weights of Bookbags (pounds)
12 15 9 10
7 8 13 14
Numbers of Fish in the Aquarium
14 23 30 17
24 20 21 19
Numbers of Pages in a Book
186 205 192 189
226 212 198 200
Gallons of Gas in Container
4.8 3.4 5 3.5
4.2 2.6 4.3 2.6
Lawns Mowed
5 7 10 9 6
Big Ideas Math Green Copyright © Big Ideas Learning, LLC Resources by Chapter All rights reserved. 328
9.5 Practice B
Name _________________________________________________________ Date _________
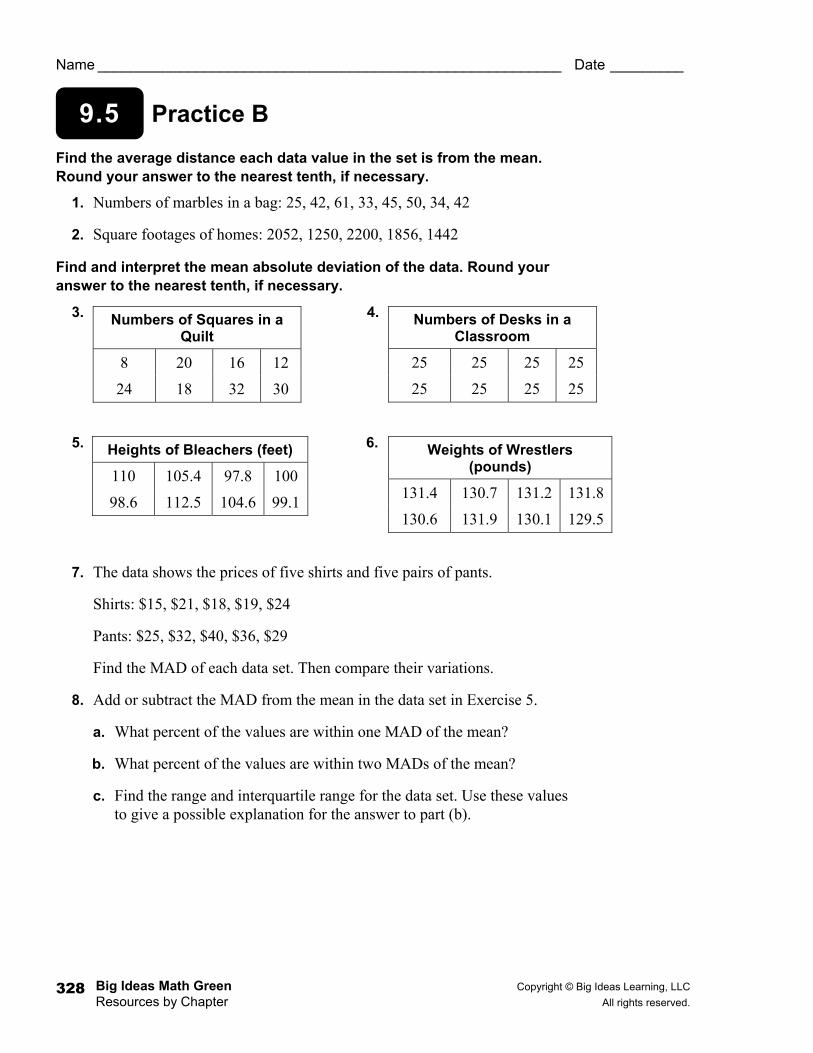
Find the average distance each data value in the set is from the mean. Round your answer to the nearest tenth, if necessary.
1. Numbers of marbles in a bag: 25, 42, 61, 33, 45, 50, 34, 42
2. Square footages of homes: 2052, 1250, 2200, 1856, 1442
Find and interpret the mean absolute deviation of the data. Round your answer to the nearest tenth, if necessary.
3. 4.
5. 6.
7. The data shows the prices of five shirts and five pairs of pants.
Shirts: $15, $21, $18, $19, $24
Pants: $25, $32, $40, $36, $29
Find the MAD of each data set. Then compare their variations.
8. Add or subtract the MAD from the mean in the data set in Exercise 5.
a. What percent of the values are within one MAD of the mean?
b. What percent of the values are within two MADs of the mean?
c. Find the range and interquartile range for the data set. Use these values to give a possible explanation for the answer to part (b).
Numbers of Squares in a Quilt
8 20 16 12
24 18 32 30
Numbers of Desks in a Classroom
25 25 25 25
25 25 25 25
Heights of Bleachers (feet)
110 105.4 97.8 100
98.6 112.5 104.6 99.1
Weights of Wrestlers (pounds)
131.4 130.7 131.2 131.8
130.6 131.9 130.1 129.5
Copyright © Big Ideas Learning, LLC Big Ideas Math Green All rights reserved. Resources by Chapter
329
9.5 Enrichment and Extension
Name _________________________________________________________ Date __________
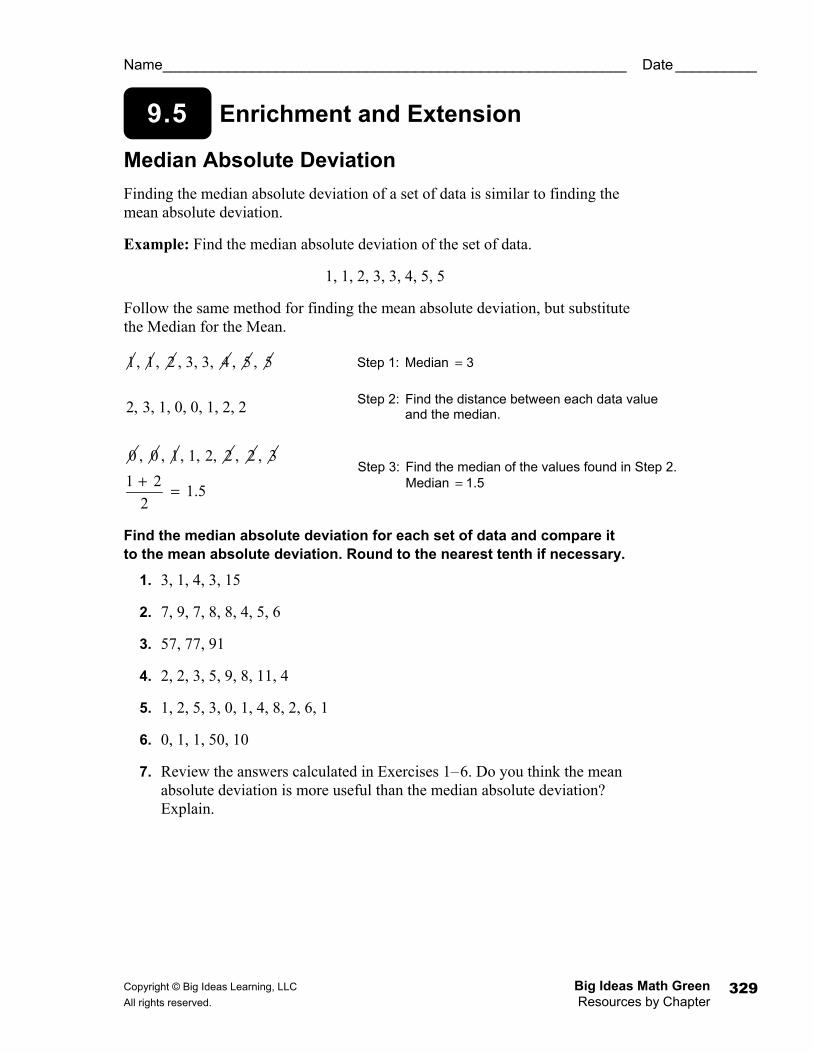
Median Absolute Deviation Finding the median absolute deviation of a set of data is similar to finding the mean absolute deviation.
Example: Find the median absolute deviation of the set of data.
1, 1, 2, 3, 3, 4, 5, 5
Follow the same method for finding the mean absolute deviation, but substitute the Median for the Mean.
1, 1, 2 , 3, 3, 4 , 5 , 5 Step 1: Median = 3
2, 3, 1, 0, 0, 1, 2, 2
0 , 0 , 1, 1, 2, 2 , 2 , 3
1 21.5
2
+ =
Find the median absolute deviation for each set of data and compare it to the mean absolute deviation. Round to the nearest tenth if necessary.
1. 3, 1, 4, 3, 15
2. 7, 9, 7, 8, 8, 4, 5, 6
3. 57, 77, 91
4. 2, 2, 3, 5, 9, 8, 11, 4
5. 1, 2, 5, 3, 0, 1, 4, 8, 2, 6, 1
6. 0, 1, 1, 50, 10
7. Review the answers calculated in Exercises 1–6. Do you think the mean absolute deviation is more useful than the median absolute deviation? Explain.
Step 3: Find the median of the values found in Step 2. Median = 1.5
Step 2: Find the distance between each data value and the median.

Big Ideas Math Green Copyright © Big Ideas Learning, LLC Resources by Chapter All rights reserved. 330
Puzzle Time
Name _________________________________________________________ Date _________
How Do You Measure Poison Ivy? Write the letter of each answer in the box containing the exercise number.
Use the tables to find the mean and the MAD.
1. Find the mean of the data.
2. Find the mean absolute deviation of the data.
3. Find the mean of the data.
4. Find the mean absolute deviation of the data.
5. Find the mean of the data.
6. Find the mean absolute deviation of the data.
7. Find the mean of the data.
8. Find the mean absolute deviation of the data.
5 8 1 7 6 3 2 4
Answers
Y. 1193
H. 78
C. 1192
I. 4
S. 11.8
T. 54
E. 2.5
B. 150
9.5
Number of Strikes During a Bowling Game
3 2 6 9
2 7 3 0
Scores on a Test (percent)
63 70 95 88 84
59 76 92 63 90
Number of Library Patrons
124 120 140 165
147 156 141 207
Prices of Skateboards (dollars)
44 63 24 99 58 36
Copyright © Big Ideas Learning, LLC Big Ideas Math Green All rights reserved. Resources by Chapter
331
Chapter
9 Technology Connection For use after Section 9.4
Name _________________________________________________________ Date __________
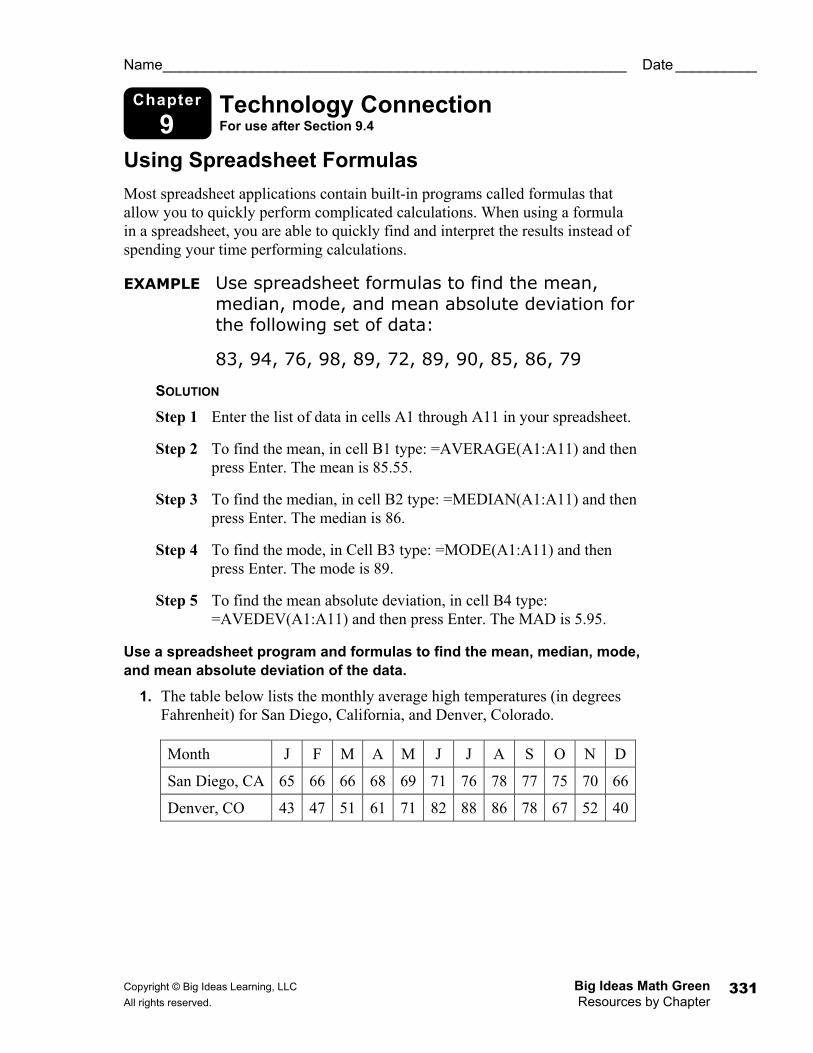
Using Spreadsheet Formulas Most spreadsheet applications contain built-in programs called formulas that allow you to quickly perform complicated calculations. When using a formula in a spreadsheet, you are able to quickly find and interpret the results instead of spending your time performing calculations.
EXAMPLE Use spreadsheet formulas to find the mean, median, mode, and mean absolute deviation for the following set of data:
83, 94, 76, 98, 89, 72, 89, 90, 85, 86, 79
SOLUTION
Step 1 Enter the list of data in cells A1 through A11 in your spreadsheet.
Step 2 To find the mean, in cell B1 type: =AVERAGE(A1:A11) and then press Enter. The mean is 85.55.
Step 3 To find the median, in cell B2 type: =MEDIAN(A1:A11) and then press Enter. The median is 86.
Step 4 To find the mode, in Cell B3 type: =MODE(A1:A11) and then press Enter. The mode is 89.
Step 5 To find the mean absolute deviation, in cell B4 type: =AVEDEV(A1:A11) and then press Enter. The MAD is 5.95.
Use a spreadsheet program and formulas to find the mean, median, mode, and mean absolute deviation of the data.
1. The table below lists the monthly average high temperatures (in degrees Fahrenheit) for San Diego, California, and Denver, Colorado.
Month J F M A M J J A S O N D
San Diego, CA 65 66 66 68 69 71 76 78 77 75 70 66
Denver, CO 43 47 51 61 71 82 88 86 78 67 52 40