Embed Size (px)
Citation preview

2.0 Introduction 26
2.1 Parent forage composition 27
2.2 The silage preservation process 33
2.3 Silage micro-organisms 42
2.4 Chop length 47
2.5 Losses 48
2.6 Appendices 53
Chapter 2Principles of silage preservation

Successful Silage 25
Principles of silage preservation
The authors
J.W. Piltz andA.G. Kaiser
Department of PrimaryIndustries, Wagga WaggaAgricultural Institute, WaggaWagga, NSW
In this chapter
2.0 Introduction 26
2.1 Parent forage composition 272.1.1 Dry matter content 272.1.2 Water soluble carbohydrate (WSC) content 292.1.3 Buffering capacity (BC) 312.1.4 Assessing the ensilability of forages 32
2.2 The silage preservation process 332.2.1 Aerobic phase 332.2.2 Fermentation phase 372.2.3 Feedout phase 39
2.3 Silage micro-organisms 422.3.1 Lactic acid bacteria (LAB) 422.3.2 Clostridia 432.3.3 Enterobacteria 432.3.4 Yeasts and moulds 442.3.5 Potentially harmful micro-organisms 45
2.4 Chop length 47
2.5 Losses 482.5.1 Field and harvesting losses 502.5.2 Storage losses 512.5.3 Feedout losses 52
2.6 Appendices 532.A1 WSC content of various forages 532.A2 Buffering capacity of various forages 542.A3 Biochemical pathways, and energy and DM losses
that occur during silage fermentation 552.A4 Species of lactic acid bacteria (LAB) and clostridia
found in silage 56
Principles of silage preservationChapter 2
The Key Issues
■ The key to producing a well-preserved silage is an anaerobic fermentation dominated by lactic acid bacteria (LAB).
■ A good fermentation requires sufficient water soluble carbohydrate (WSC) content to produce enough lactic acid toovercome the buffering capacity of the forage and reduce pH to an adequate level for preservation.
■ Shorter chop length increases rate of release of fermentation substrates and improves compaction.
■ Effective wilting will improve the fermentation, by concentrating available WSC and restricting activity of undesirablebacteria, and reduce effluent losses.
■ Wilt as rapidly as possible to avoid excessive respiration losses in the field and in the early stages of storage.
■ Compact well and seal effectively to create an anaerobic (air-free) environment. This will minimise losses duringstorage.
■ Once the silo is opened and the silage is exposed to air, aerobic spoilage will commence. Management duringfeedout will influence the extent of aerobic spoilage.
26 Top Fodder
Chapter 2
An acid fermentation occurs when forages
of sufficiently high moisture content are
stored under anaerobic conditions. During
fermentation, bacteria convert plant
sugars, water soluble carbohydrates
(WSCs), to fermentation acids and other
compounds. Ideally, this fermentation
produces mainly lactic acid and in
sufficient quantity to quickly reduce pH.
At low pH, acid conditions prevent further
microbial activity and spoilage.
The final pH achieved in a well-preserved
silage depends on the WSC and dry matter
(DM) content of the forage at time of
ensiling. The final pH may be as low as
3.8-4.2, but could exceed 5.0 in heavily
wilted silages, particularly those
produced from legumes (see Chapter 12,
Table 12.3).
The silage will not deteriorate as long as
anaerobic conditions are maintained. In
other words, the nutrients in the silage are
preserved while the silo or bale remains
sealed.
The rate and efficiency of the fermentation
process, the products of fermentation, and
the fermentation quality of the resultant
silage depend on several factors, the most
important being the composition of the
parent material at the time of ensiling and
the species of bacteria that dominate the
fermentation.
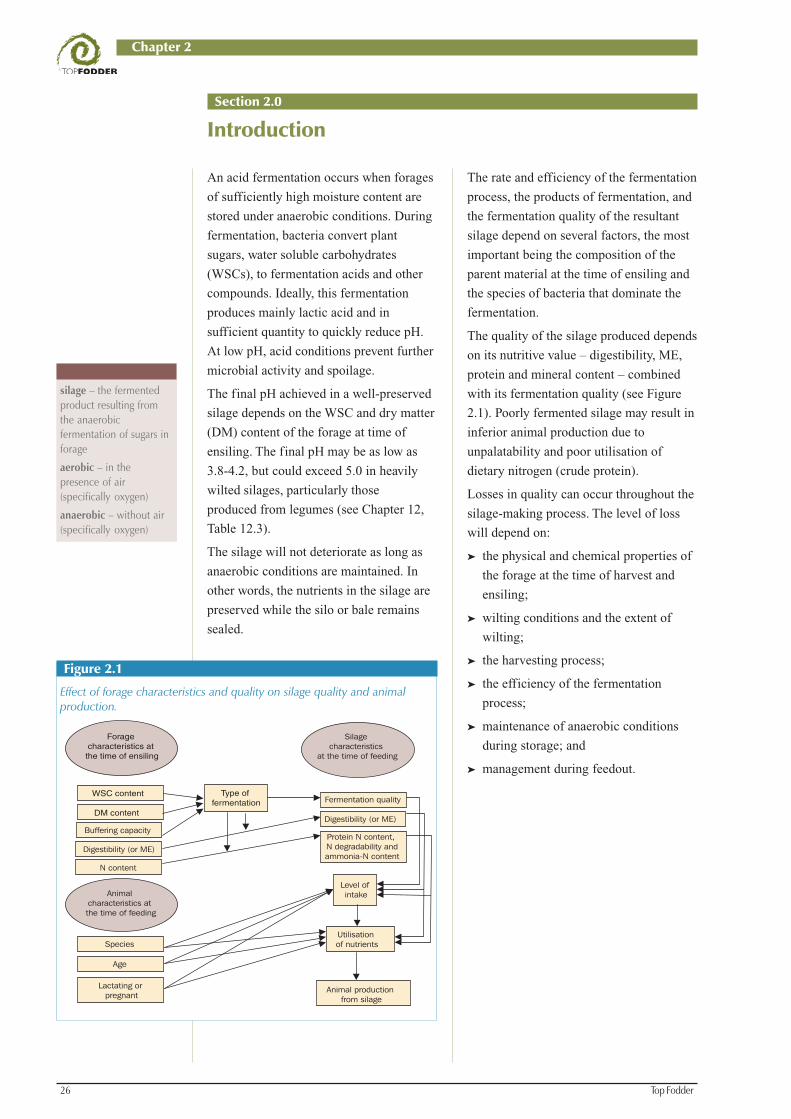
The quality of the silage produced depends
on its nutritive value – digestibility, ME,
protein and mineral content – combined
with its fermentation quality (see Figure
2.1). Poorly fermented silage may result in
inferior animal production due to
unpalatability and poor utilisation of
dietary nitrogen (crude protein).
Losses in quality can occur throughout the
silage-making process. The level of loss
will depend on:
➤ the physical and chemical properties of
the forage at the time of harvest and
ensiling;
➤ wilting conditions and the extent of
wilting;
➤ the harvesting process;
➤ the efficiency of the fermentation
process;
➤ maintenance of anaerobic conditions
during storage; and
➤ management during feedout.
silage – the fermentedproduct resulting fromthe anaerobicfermentation of sugars inforage
aerobic – in thepresence of air(specifically oxygen)
anaerobic – without air(specifically oxygen)
Figure 2.1
Effect of forage characteristics and quality on silage quality and animalproduction.
Section 2.0
Introduction
Buffering capacity
Species
Age
Forage characteristics at the time of ensiling
Type of fermentation
WSC content
DM content
Digestibility (or ME)
N content
Animal characteristics at the time of feeding
Lactating or pregnant
Silage characteristics
at the time of feeding
Fermentation quality
Digestibility (or ME)
Protein N content, N degradability andammonia-N content
Level of intake
Utilisation of nutrients
Animal production from silage

Successful Silage 27
Principles of silage preservation
The composition of the parent forage at
ensiling has a major influence on the
silage fermentation. The most important
components are DM content, WSC content
and buffering capacity (BC).
2.1.1
Dry matter content
The DM content of the parent forage at
ensiling can affect the quantity of effluent
lost from the silage during storage, the
growth of bacteria in the silage and the
ease of compaction which, in turn, affects
the exclusion of air from the silo or bale.
Effluent
During the early stages of the ensiling
process, as the cell structure breaks down
due to compaction and the action of plant
enzymes and microbial activity, fluids are
released from within the cells. If the
forage is stored at low DM content – in
particular unwilted, direct-cut pastures or
forages containing ‘free’ water from
rainfall or dew – surplus moisture
(including soluble compounds) will flow
out of the silo as silage effluent.
The quantity of effluent produced is
directly related to the DM content of the
forage ensiled and the extent of
compaction of the silage. Effluent flow
falls as DM content increases (see Figure
2.2), and stops when the DM content
reaches about 30%. As a result, wilting is
an effective management strategy for
reducing effluent losses.
Effluent flow is slightly greater for finer
chopped compared to long chop forage.
Silage effluent contains WSCs, protein,
minerals and fermentation products, so it
Effect of forage DMcontent at ensiling oneffluent losses from silage.
Figure 2.2
Source: Adapted fromBastiman (1976)
Section 2.1
Parent forage composition
represents a significant loss of nutrients.
The loss of WSCs will reduce the quantity
available for the silage fermentation.
Silage effluent is also a serious
environmental pollutant if it enters
waterways. It has a very high biological
oxygen demand (BOD), in the order of
12,000 to 83,000 mg/L. In the UK, silage
BOD levels have been estimated to be
about 200 times higher than those of
untreated domestic sewerage.
Effluent (from various sources)
contaminating water systems is receiving
increasing attention from the various State
environmental protection authorities. In
many European countries, landowners face
prosecution if silage effluent enters water
systems.
Although some silage additives can be
used to reduce the amount of silage
effluent produced (see Chapter 7), wilting
is the most effective way to prevent
effluent production.
DM content at ensiling (%)
10 15 20 25 30 35
50
100
150
200
Efflu
ent p
rodu
ced
(L/t
herb
age
ensi
led)
2.1

28 Top Fodder
Chapter 2
Growth of silage micro-organisms
The DM content of the forage directly
affects bacterial activity during the
fermentation phase. The activity of all
silage bacteria slows as forage DM content
increases and as silage pH decreases.
Bacterial activity stops at a higher pH as
forage DM content increases.
Therefore, wilted silages have a higher
final silage pH.
When fermentation is restricted by falling
pH, some of the WSC may be left
unfermented. Residual WSCs can cause
the silage to be more aerobically unstable,
resulting in greater losses during feedout
(see Chapter 10, Section 10.2.1).
Bacteria vary in their preferred conditions
for optimum growth, especially moisture
content (or water activity). Clostridia, one
of the main bacteria responsible for silage
spoilage, are particularly sensitive and
require low DM conditions to flourish.
Wilting to a DM content >30% usually
restricts clostridial growth and favours the
preferred lactic acid bacteria (LAB).
When forages are wilted, the concentration
of WSCs on a fresh crop basis increases
(see Section 2.1.2). This also favours the
growth of LAB and improved silage
fermentation quality.
The micro-organisms important to silage
production are discussed in detail in
Section 2.3.
Compaction and silage density
If forage DM content is too high at
ensiling, it is more difficult to achieve
adequate compaction. When silage density
is low, more oxygen remains in the silo at
ensiling and there is increased air
infiltration when the silage is opened for
feeding. Increased exposure to oxygen in
the early stages of the ensiling process
leads to increased respiration and loss of
DM and energy.
Additional information on storage and
feedout losses is provided in Section 2.5,
Section 9.8 of Chapter 9 and Chapter 10.
Information on optimum DM content of
various forages at ensiling is provided in
Chapter 4, Table 4.1; Chapter 5, Table 5.2;
and Chapter 6, Section 6.4.1.

Successful Silage 29
Principles of silage preservation
2.1.2
Water soluble carbohydrate(WSC) content
Effective ensiling relies on the
fermentation of WSCs to lactic acid by
LAB. WSC content in the parent forage
should be >2.5%, on a fresh forage basis,
for good silage fermentation. If WSCs are
<2.5%, the forage should be wilted (see
Appendix 2.A1, Figure 2A.1) or a silage
additive used to reduce the risk of a poor
fermentation (see Chapter 7, Section 7.4).
The main non-structural carbohydrates in
temperate grasses are glucose, fructose,
sucrose and fructans. Fructans are the
most important storage carbohydrates.
These and other sugars, present in small
quantities in plants, are soluble in cold
water and are collectively referred to as
WSCs.
The WSC contents of temperate legumes,
tropical grasses and tropical legumes are
lower than that of temperate grasses. The
main sugars in temperate legumes are
fructose, glucose and sucrose.
The principal storage carbohydrate in
temperate legume forages is starch, rather
than fructans – starch is insoluble in cold
Figure 2.3
Influence of stage of growth at harvest on the WSC content of different forages.
water. In cereal crops WSC contents are
high at the vegetative stage of growth, but
as grain filling progresses WSC content
falls and starch content increases.
Most naturally occurring LAB are unable
to ferment starch. Therefore, starch is not a
satisfactory substrate for LAB growth,
unless there is some breakdown
(hydrolysis) by plant enzymes (amylase)
or acid hydrolysis during the fermentation
to convert starch to WSCs. In addition,
most LAB cannot ferment hemicellulose
(a component of the plant fibre fraction),
but some hydrolysis of hemicellulose
occurs (due to the action of plant enzymes
and silage acids) releasing sugars for
fermentation.
Although a number of other factors
influence the WSCs of forages, species
differences (Appendix 2.A1, Table 2A.1)
and stage of growth have the greatest
effect. The trends for changes in WSC
content at different stages of growth are
illustrated in Figure 2.3. (More details for
crops and pasture species can be found in
Chapters 4 and 5.)
The effects of growth stage tend to be
greatest with temperate grasses and
cereal crops.
2.1
Sources: McDonald et al. (1991); Kaiser (various studies, unpublished data)
0
5
10
15
20
25
Sorghum x Sudan grassPearl milletSweet sorghumKikuyu
Tropical forages
WSC
(%
DM
)
Stage of growth
Early (Vegetative)
Late (Head emergence)
Stage of growth
WS
C (
% D
M)
0
5
10
15
20
25
30
Italian ryegrassBarley LucerneRed cloverOatsSubclover
Early (Vegetative)
Late (Grasses - head emergence;
Legumes - flowering)
Temperate forages

30 Top Fodder
Chapter 2
Other factors influencing WSC content
include:
Cultivar: There is evidence of significant
variation in WSC between cultivars in
some grass species. Some plant
breeders are selecting for higher WSC
content.
Weather conditions: Low light intensity,
cloudy weather and high rainfall during
crop growth can reduce WSC content.
Figure 2.4
Effect of N fertiliser on WSC and DM content, and buffering capacityof ryegrass.
Time of day: On sunny days, WSC content
usually increases during the day, until
mid afternoon. For this reason some
advisers have recommended mowing of
crops and pastures mid afternoon.
However, the variation in WSC content
during the day is considerably less than
that due to species and stage of growth.
Furthermore, any advantage in WSC
content could be lost by slower wilting
and higher respiration when forage is
cut later in the day (see Chapter 6,
Section 6.2).
N fertiliser application: Application of
nitrogen fertiliser can reduce WSC and
DM content, and increase buffering
capacity (see Section 2.1.3). This is
highlighted in a study with perennial
ryegrass (see Figure 2.4). Consequently,
nitrogen fertiliser application is not
recommended within four weeks
of harvest for most crops, in most
situations. The exception is short
regrowth crops, such as kikuyu and
other tropical grasses during their peak
growth periods.
Crops receiving high rates of nitrogen
fertiliser must be adequately wilted
(see Chapter 4, Section 4.3.2).
N fertiliser (kg N/ha)
DM
con
tent
(%
)
15
16
17
18
19
20
21
22
23
WS
C (
% D
M)
8
9
10
11
Buf
ferin
g ca
paci
ty (
meq
/kg
DM
)
200
210
220
230
240
250
260
270
DM content
WSC content
Buffering capacity
0 20 40 60 80 100 120 140 160
Source: Adapted from O’Kiely et al. (1997)

Successful Silage 31
Principles of silage preservation
2.1.3
Buffering capacity (BC)
All forages contain chemical compounds,
called buffers, which resist changes in pH.
Most of the BC of forage depends upon
the content of organic acids and their salts,
with proteins contributing to about 10-
20% of BC. In silage production, these
buffers neutralise some of the silage acids
as they are produced, restricting and
delaying the decline in pH, and providing
an opportunity for the growth of
undesirable bacteria. Therefore, there is an
increased risk of a poor fermentation when
ensiling forages with a high BC.
The main factors influencing the BC of
forages are:
Species: The BC of forages varies between
species (see Table 2A.2, in Appendix
2.A2), with legumes having higher BCs
than grasses. Some summer forage
crops, in particular maize, have a very
low BC, while some broadleaf weeds
can have a very high BC.
Stage of growth: There is evidence with a
number of pasture and forage crop
species that BC declines with advancing
crop maturity.
Figure 2.5
Influence of wilting on the buffering capacity of various forages underfavourable weather conditions.
UnwiltedWilted
0
100
200
300
400
500
600
700
Kikuyu grass
Subclover pasture
Red clover
Perennial ryegrass
Buffering
capaci
ty(m
eq/k
g D
M)
Source: Playne and McDonald (1966); Dawson et al. (1999);Kaiser (various studies, unpublished data)
N fertiliser application: The application
of nitrogen fertiliser can increase BC
(see Figure 2.4).
Wilting: BC is sometimes reduced when
forage is wilted (see Figure 2.5),
although this may not occur where
wilting conditions are unfavourable and
there is an ineffective wilt. The reduced
BC has been attributed to a reduction in
the organic acid content of the forage.
2.1

32 Top Fodder
Chapter 2
2.1.4
Assessing the ensilabilityof forages
The ensilability of a forage, or the
likelihood of producing a silage with a
good lactic acid fermentation, can be
assessed by taking account of its DM
content, WSC content and BC. Forages
with a high WSC content and low BC are
relatively easy to ensile successfully. On
the other hand, forages with a low WSC
content and high BC are more difficult to
ensile, particularly if the DM content is
also low. In these circumstances, the crop
needs to be wilted to DM targets to
achieve minimum WSC in the fresh crop
(see Section 2.1.2 and Figure 2A.1 in
Appendix 2.A1).
Table 2.1 shows the ensilability of a
number of common crops, pastures and
weeds.
Table 2.1
The ensilability ofvarious crops andpasture species.*
Buffering capacity WSC content (% DM basis)(meq. NaOH/kg DM) High (>20%) Medium (12-20%) Low (<12%)Low (<350) Sweet sorghum Maize, grain sorghum, Cocksfoot
winter cereals (heading),perennial ryegrass, lupins
Medium (350-550) Italian ryegrass, peas, Medics, arrowleaf clover,sunflowers lucerne, white clover, sainfoin,
kikuyu grass, other tropicalgrasses, millets, forage sorghum
High (>550) Capeweed, variegated Immature oats, subclover,thistle balansa clover, red clover,
berseem clover, vetch, tropicallegumes, Paterson’s curse
* Some species with a wide range in WSC or BC may appear in more than one category – see Appendices 2.A1 and 2.A2 formean values and ranges.
WSC content and BC of a species is modified by the stage of growth, N fertiliser application and weather conditions.
Difficult to ensilesuccessfully withoutwilting or silageadditives
Very easily ensiled
Easily ensiled
Moderately easy toensile
To take account of the three factors
influencing the ensilability of forages –
DM, WSC and BC – European researchers
have developed a fermentability
coefficient, which can be calculated for
each forage. They have identified a
minimum score, above which there is a
high probability of a good lactic
fermentation under European conditions.
At this stage, critical scores have not been
developed for forages under Australian
conditions.
Even if the ensilability of a forage is poor,
there are strategies that can be used to
increase the probability of a good
fermentation. Wilting (see Section 2.2.1
and Chapter 6) and silage additives (see
Chapter 7) are effective ‘tools’ for
improving the ensilability of difficult
forages.

Successful Silage 33
Principles of silage preservation
Section 2.2
The silage preservation process
2.2
2.2.1
Aerobic phase
The aerobic phase commences when the
forage is cut. It includes the wilting period
and the time between sealing and when
anaerobic conditions are achieved within
the silo (see Figure 2.7). Changes in forage
composition are mainly due to the action
of plant enzymes. Early in this phase
enzymes break down more complex
carbohydrates (fructans, starch and
hemicellulose), releasing simple sugars
(WSCs). Plant enzymes continue to use
WSCs for the process of respiration until
either all the substrate (WSCs) or available
oxygen has been used. Plant enzymes will
also continue to break down (degrade)
protein to various non-protein N
compounds – peptides, amino acids,
amides and ammonia – the process of
proteolysis.
Respiration
Respiration is undesirable because it
results in a loss of DM, energy (ME) and
available WSCs required by LAB for
fermentation. Although some respiration is
unavoidable, good silage-making practice
will minimise these losses (see Sections
2.5.1 and 2.5.2, and Chapter 6).
During respiration, WSCs are converted to
carbon dioxide and water, with energy
released in the form of heat. Heat
production is the first sign of respiration.
WSC + oxygen ➝ carbon dioxide + water
+ heat (16MJ/kg WSC)
Because the process is oxygen-dependent,
respiration ceases once anaerobic
conditions are established in the silo or
bale.
The extent of aerobic respiration will
depend on a number of factors, including
characteristics of the forage, the length of
wilt, wilting conditions, the time between
Respiration losses from cut grass in the field.
Figure 2.6
harvest and compaction and sealing, and
the degree of compaction achieved. Two of
the most important factors affecting the
rate of respiration are forage DM content
and temperature (see Figure 2.6).
Respiration rate is quite low once forage
DM reaches 50-60%, but at all DM levels
respiration increases with temperature.
Management factors that affect the time
taken to achieve anaerobic conditions – the
time taken to fill and seal the bunker or
bale, and the degree of compaction – are
also important (see Chapter 9, Section
9.4). However, even in a well-sealed silo,
the temperature rise increases as silage
density falls, especially when DM content
is high (see Figure 2.8).
If the aerobic phase continues for a
prolonged period after sealing, the sealing
is inadequate or a hole develops in the
plastic, allowing air into the silo, aerobic
micro-organisms (yeasts and moulds) will
grow. This results in increased DM and
energy losses due to spoilage in the silo
and also during the feedout phase
(see Section 2.5.3 and Chapter 10).
During the aerobic phaseplant enzymes:
Break down WSCs tocarbon dioxide andwater, and release of heat= respiration.
Break down proteins tovarious forms of solublenon-protein nitrogen(NPN) = proteolysis.
Respiration rate:
➤ is highest in leafyforages;
➤ is greater for legumesthan grasses;
➤ decreases withincreasing forage DMcontent; and
➤ is greater at higherambient temperatures.
Respiration depends onthe availability of oxygen,so is greater:
➤ with poorlycompacted silages;
➤ when filling is slow;and
➤ when sealing isdelayed.
DM content at ensiling (%)
20 30 40 50 60
Res
pira
tion
loss
(%
of D
M/h
r)
0.05
0.10
0.15
0.20
0.25
0.30
0.35
0.40Temperature
Source: Adapted from Honig (1980)
°20° C25° C30° C
15 C

34 Top Fodder
Chapter 2
Figu
re 2
.7
Cha
nges
occ
urrin
g du
ring
the
vario
us p
hase
s fo
r a w
ell-p
rese
rved
sila
ge.
Pha
se:
Aer
obic
Ferm
enta
tion
Sta
ble
Feed
out
LAB
po
pula
tion
Slo
w
wilt
Fast
w
ilt
pH
Uns
tabl
e si
lage
Sta
ble
sila
ge
Res
pira
tion
& g
row
th
of a
erob
icor
gani
sms
Oxy
gen
leve
lO
xyge
n
Wilt
ing
Aer
obic
Sto
rage
Ana
erob
icAer
obic
Feed
out
Mow
ing
Com
men
ceha
rves
t
Filli
ngof
silo
Sea
ling
1-3
day
s14 d
ays
Sta
ble
stor
age
stag
e(in
defin
ite s
tora
ge le
ngth
)Fo
r si
lage
nea
r ex
pose
d fa
ce
Ope
ratio
n
Con
ditio
ns
prev
ailin
g
Leve
l
Hig
h
Low
Sour
ce: A
dapt
ed fr
om P
itt (1
990)

Successful Silage 35
Principles of silage preservation
If the respiration is allowed to continue for
a prolonged period, a large amount of heat
will be produced. The temperature within
the silo or bale can become quite high,
resulting in heat damage of the protein and
a reduction in digestibility due to a
browning reaction (also known as Maillard
reaction or caramelisation).
Heat-damaged silages have a pleasant, sweet,
burnt sugar aroma and are quite palatable to
livestock, provided moulds are not present.
However, the digestibility of heat-damaged
silage is very low and it is usually only
suitable for maintenance feeding. There is
a significant drop in quality because the
excessive heat binds the protein and
amino acids to the hemicellulose fraction,
increasing the indigestible fibre and acid
detergent insoluble nitrogen (ADIN)
content (see latter section of Chapter 12,
Section 12.4.4).
Silages with a DM content ≥50% are most
susceptible to heat damage. Digestibility
will be reduced if the temperature in the
silo rises above 50°C.
Proteolysis
Proteolysis is undesirable because
ruminant livestock are not able to use
degraded protein as efficiently in the
rumen (see Chapter 12, Section 12.4.4).
The extent to which proteolysis occurs
during wilting varies considerably, and
does not appear to be related to either
plant species or nitrogen content.
If wilting is achieved quickly there appears
to be very little increase in the amount of
Rate of wilt Length of wilt DM content Protein-N Ammonia-N(hours) (%) (% total N)
Unwilted 0 17.3 92.5 0.12Rapid 6 34.9 87.7 0.11Rapid 48 46.2 83.2 0.21Slow 48 19.9 75.2 0.26Slow 144 37.5 68.9 2.61
Table 2.2The effect of wilting onthe major nitrogencomponents of ryegrass/clover forage.
Source: Carpintero et al. (1979)
Effect of forage density and DM content on temperature rise in awell-sealed bun.
Figure 2.8
degraded protein within the forage.
However, slow, extended wilts have been
shown to increase protein breakdown
(see Table 2.2).
Although respiration and proteolysis occur
more rapidly at higher temperatures the
rate of wilting also increases, with a more
rapid wilting usually resulting in less
proteolysis and loss of WSCs. Greatest
losses will occur when temperatures are
high, but rain and humid conditions cause
wilting rate to be slow.
Enzymic proteolysis can continue in the
ensiled material for several days.
Production of fermentation acids will
eventually stop the action of the enzymes.
For this reason, proteolysis occurs more
rapidly in freshly ensiled forage and
declines as pH declines. Achieving a rapid
lactic acid fermentation will result in less
degraded protein in the silage.
Increased wilting rateleads to:
➤ reduced respiration ofWSC;
➤ reduced loss of energyand DM;
➤ increased WSCavailable forfermentation;
➤ better fermentation;
➤ reduced proteolysisduring wilting; and
➤ reduced proteolysis inthe silo due to morerapid decline in pH.
Density (kg fresh forage/m3)
300 400 500 600 700 800 900
0.0
1.0
2.0
3.0
4.0
5.0
20%30%40%50%60%
DM content
Source: Adapted from Pitt (1983)
2.2
Tem
pera
ture
ris
e (°
C)

36 Top Fodder
Chapter 2
Types of silage
The composition of the ensiled forage and the subsequent fermentation will determine the type of silage produced.Silages produced under Australian conditions can be broadly classified into five main types:
Lactate silages
➤ fermentation is dominated by LAB;
➤ WSCs are primarily converted to lactic acid;
➤ have a pleasant, acidic and sometimes sweet smell;
➤ pH values are generally low (3.8-4.2), except in heavily wilted silages where the fermentation is restricted; and
➤ contain high lactic acid levels relative to other organic acids.
Acetate silages
➤ fermentation may be dominated by enterobacteria;
➤ more likely to occur when unwilted, or lightly wilted, low DM forage is ensiled;
➤ WSCs are primarily converted to acetic acid;
➤ typified by a sour, vinegar smell;
➤ pH values are higher than those of lactate silages at the same DM content; and
➤ DM and energy losses can be significant.
Clostridial silages
➤ fermentation is dominated by clostridia;
➤ more likely to occur when unwilted, or lightly wilted, low DM forage is ensiled;
➤ WSCs and lactic acid are converted to butyric and acetic acid;
➤ characterised by low lactic acid levels and high pH;
➤ proteins and amino acids are extensively degraded;
➤ ammonia-N levels are high as a proportion of total N;
➤ DM and energy losses can be significant (silages are unpalatable to livestock and the utilisation of the N in thesesilages is poor); and
➤ clostridial silages are not common in Australia.
Wilted silages
➤ fermentation is dominated by LAB;
➤ fermentation is restricted because of the high DM content (>30%). Less WSC are converted to lactic acid. pHvalues are higher than those of lactate silages;
➤ residual, unfermented WSC levels can be high, but vary due to length and extent of wilting;
➤ very dry forages are harder to compact, especially if chop length is long; there is a greater risk of yeast and mouldgrowth because oxygen levels in the pit or bale are high in poorly compacted silages; and
➤ higher residual WSC, poor compaction and carry-over yeast and mould spores can make these silages moreaerobically unstable.
Silages with additives
➤ the characteristics and type of fermentation observed varies with additive type. Chapter 7 gives further informationon the types of additives available and their use.
A more detailed description of the appearance and aroma of various silages is contained in Chapter 12, Section 12.3.

Successful Silage 37
Principles of silage preservation
2.2.2
Fermentation phase
The anaerobic fermentation phase
commences once anaerobic conditions are
achieved within the silo (see Figure 2.7).
During this phase, acids are produced,
lowering the silage pH and preventing
further microbial activity, and so
preserving the silage. The silage will not
deteriorate until exposed to oxygen. A
slow fermentation increases DM and
energy losses, and reduces the palatability
of the silage.
The silage quality and fermentation
products are determined by the forage
characteristics and which micro-organisms
dominate.
After the fermentation phase commences
there is a short period, about one day,
when breakdown of cell walls and the
release of fermentation substrates by plant
enzymes continue. Bacteria then begin to
multiply rapidly, increasing to a population
of about 1 billion (109) per gram of fresh
forage. These silage bacteria ferment
WSCs, converting them to acids and other
products. Ideally, LAB dominate the
fermentation, but enterobacteria and
clostridia may be dominant in some
silages. Aerobic yeasts can also be present.
This phase may be dominated, in the early
stages, by enterobacteria. These bacteria
ferment WSCs, producing mainly acetic
acid, with lesser quantities of lactic acid.
Ethanol, 2,3-butanediol and carbon
dioxide are also produced and DM and
energy is lost.
In well-fermented silages, as lactic acid is
produced the pH drops, enterobacteria
cease growing, and LAB quickly begin to
dominate the fermentation. If the decline
in pH is slow, enterobacteria may continue
to dominate the fermentation, and produce
an acetate silage.
LAB ferment WSCs to lactic acid, with
only very small quantities of other
compounds being produced (see Appendix
2.A3). Fermentation dominated by LAB is
preferred because lactic acid production is
the most efficient chemical pathway. The
decline in pH is rapid and there are only
very small fermentation losses of DM and
energy.
The proportion of lactic acid to other
compounds produced will depend on the
relative activity of homofermentative and
heterofermentative LAB (see Section
2.3.1). Providing sufficient WSC are
available, fermentation will continue until
a pH of about 4 is achieved. Lower pH
values have been observed in silages
produced in Australia from forages with
high levels of WSC and low buffering
capacity, such as maize and forage
sorghums. In drier silages, the
fermentation is inhibited and the ultimate
pH achieved is higher, and can exceed
pH 5 in heavily wilted silage
(see Chapter 12, Table 12.3).
Clostridial silages result if insufficient
lactic acid is produced or it is produced
too slowly. Clostridia require moist
conditions to thrive and are not usually a
problem in silages wilted to >30% DM
content.
If the population of clostridia increases, a
secondary fermentation can occur.
Clostridia ferment WSC, lactic acid, and
protein to produce butyric, propionic and
acetic acid, and ammonia-N (NH3-N)
plus a number of other intermediate
compounds (see Appendix 2.A3,
Table 2A.4).
As the secondary fermentation proceeds,
the pH rises. Final pH will be higher than
for a lactic acid fermentation and depends
on the final products of the fermentation.
This is because the acids produced are
weaker than lactic acid, and the ammonia-N
has a buffering effect against these acids.
2.2

38 Top Fodder
Chapter 2
Fermentation losses of DM and energy, and
degradation of protein can be substantial.
Clostridial silages have a rancid odour and
are unpalatable to livestock.
If anaerobic yeasts are present in the
forage they will ferment WSC to ethanol
(see Section 2.3.4). DM is lost due to the
production of carbon dioxide, but the loss
of energy is not significant. Growth of
yeasts is undesirable because they deplete
WSCs that would otherwise be available
for LAB. Other yeasts present also break
down lactic acid produced by the LAB.
The fermentation characteristics for a
range of silages are outlined in Table 2.3.
Remember, the ideal pH of a silage is
heavily influenced by the DM content of
the forage. Where DM content is high, the
fermentation is inhibited, resulting in
higher pH values and the quantity of
fermentation end products is lower.
The quality of the silage fermentation
directly affects the production from
animals fed that silage. Some examples of
Table 2.3
Lucerne Lucerne Grass Maize Maizesilage2 silage2 silage2 silage1 silage2
(30-35% DM) (45-55% DM) (25-35% DM) (25-35% DM) (35-45% DM)
pH 4.3-4.5 4.7-5.0 4.3-4.7 3.8 3.7-4.2Lactic acid (% DM) 7-8 2-4 6-10 4.9 4-7Acetic acid (% DM) 2-3 0.5-2.0 1-3 1.4 1-3Propionic acid (% DM) <0.5 <0.1 <0.1 N/A <0.1Butyric acid (% DM) <0.5 0 <0.5 0.25 0Ethanol (% DM) 0.5-1.0 0.5 0.5-1.0 1.9 1-3Ammonia-N (% total N) 10-15 <12 8-12 5.4 5-7
Fermentationcharacteristics for a rangeof silages in the UnitedStates and Europe.
Source: 1Adapted from Andrieu(1976), mean of 42 varieties;
2Kung (2001), expected range.
Table 2.5Effect of silage fermentation quality onliveweight gain (kg/day) in beef cattle.
Number of Silage fermentation qualityexperiments Poor Good
36 0.27 0.50Note: Silages produced from the same parent fodder.Good fermentation was achieved by either wilting orusing a silage additive.
Source: Kaiser (1984).
Ryegrass1 Cocksfoot1 Lucerne1 Kikuyu2 Pasture2 Maize2
Type of silage acetate clostridial acetate acetate acetate aerobicallyspoiled
Silage DM (%) 17.4 16.2 13.1 18.3 19.1 29.5pH 5.4 5.4 7.0 5.2 4.7 6.1Lactic acid (% DM) trace 0.1 1.3 1.5 1.5 <0.1Acetic acid (% DM) 11.6 3.7 11.4 4.2 4.8 <0.1Propionic acid (% DM) 1.4 1.5 0.8 trace 0.6 traceButyric acid (% DM) 2.3 3.6 0.8 trace <0.1 traceAmmonia-N (% total N) 20.5 32.3 29.2 16.2 16.2 6.0
Table 2.4Composition of severalsilages which haveundergone a poorfermentation.
Source: 1 McDonald et al.(1991); 2 Kaiser et al. (1995)
poorly fermented silages are given in Table
2.4. The level of ammonia-N (as a % of
total nitrogen) in conjunction with pH are
good indicators of silage fermentation
quality (see Chapter 12, Section 12.4.5).
Without supplementation, poorly
fermented silages will only support
relatively low rates of production
compared to well-preserved silages (see
Table 2.5).
Once the fermentation phase is completed,
the silage then enters a stable phase.
Provided that oxygen is excluded, there
will be little or no change to a lactate
silage during this period.
Successful Silage 39
Principles of silage preservation
2.2.3
Feedout phase
When silage is exposed to air, aerobic
organisms that have been dormant during
the anaerobic phase multiply (see Figure
2.7). Their activity will eventually
decompose the silage. The first sign that
aerobic spoilage has begun is heating of
the silage at the feeding face. Experiments
with silages undergoing aerobic spoilage
have shown that the temperature may rise
to 50°C or higher. A laboratory test would
also show a rise in the pH.
This process is sometimes incorrectly
referred to as ‘secondary fermentation’. In
fact, it is an aerobic process, more
correctly referred to as ‘aerobic
deterioration’ or ‘aerobic spoilage’.
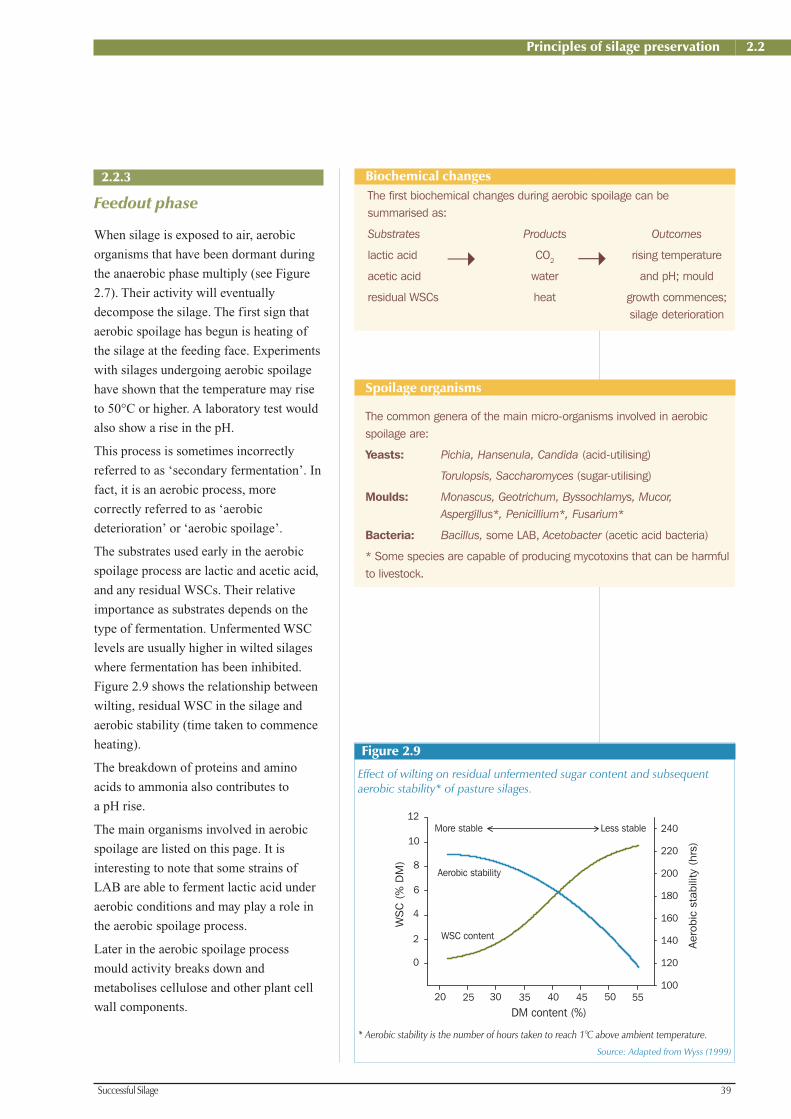
The substrates used early in the aerobic
spoilage process are lactic and acetic acid,
and any residual WSCs. Their relative
importance as substrates depends on the
type of fermentation. Unfermented WSC
levels are usually higher in wilted silages
where fermentation has been inhibited.
Figure 2.9 shows the relationship between
wilting, residual WSC in the silage and
aerobic stability (time taken to commence
heating).
The breakdown of proteins and amino
acids to ammonia also contributes to
a pH rise.
The main organisms involved in aerobic
spoilage are listed on this page. It is
interesting to note that some strains of
LAB are able to ferment lactic acid under
aerobic conditions and may play a role in
the aerobic spoilage process.
Later in the aerobic spoilage process
mould activity breaks down and
metabolises cellulose and other plant cell
wall components.
Biochemical changesThe first biochemical changes during aerobic spoilage can besummarised as:
Substrates Products Outcomes
lactic acid CO2 rising temperature
acetic acid water and pH; mould
residual WSCs heat growth commences;silage deterioration
➝ ➝
Figure 2.9
Effect of wilting on residual unfermented sugar content and subsequentaerobic stability* of pasture silages.
Spoilage organisms
The common genera of the main micro-organisms involved in aerobicspoilage are:
Yeasts: Pichia, Hansenula, Candida (acid-utilising)
Torulopsis, Saccharomyces (sugar-utilising)
Moulds: Monascus, Geotrichum, Byssochlamys, Mucor,
Aspergillus*, Penicillium*, Fusarium*
Bacteria: Bacillus, some LAB, Acetobacter (acetic acid bacteria)
* Some species are capable of producing mycotoxins that can be harmfulto livestock.
2.2
DM content (%)20 25 30 35 40 45 50 55
WS
C (
% D
M)
0
2
4
6
8
10
12
Aero
bic
stab
ility
(hr
s)
100
120
140
160
180
200
220
240
WSC content
Aerobic stability
More stable Less stable
Source: Adapted from Wyss (1999)
* Aerobic stability is the number of hours taken to reach 1° C above ambient temperature.

40 Top Fodder
Chapter 2
Figure 2.10
Effects of silage stability, depth of air penetration and rate of feedout on the temperature of the silage at the time of unloadingfrom the silo. Average DM content of silages, approximately 35%.
Aerobic spoilage can result in significant
losses, which increase with time of
exposure to air. DM losses can exceed
30% and quality losses can be significant.
Not only is silage intake often depressed,
animals may reject hot, spoiled silage.
The importance of air penetration and rate
of feedout for silages of varying aerobic
stability is highlighted in Figure 2.10. Air
penetration is greater in poorly compacted
silages and where there is greater
disturbance of the silage face. The results
shown in Figure 2.10 demonstrate that a
reduction in air penetration and an
increase in feedout rate can significantly
reduce temperature rise, particularly with
unstable silage.
Chapter 10, Section 10.2.1, gives the
losses in nutritive value in this study and
more details on the effects of feedout
management on aerobic spoilage.
Source: Derived from Honig et al. (1999)
0
5
10
15
20
25
Silage removal rate (cm/day)
14 29 43
T
Air penetration to 1 mUS
MS
S
Silage removal rate (cm/day)14 29 43
0
5
10
15
20
25
30Air penetration to 2 m
US
MS
S
The time between when the silage is first
exposed to air and when spoilage
commences at the exposed face varies
from a few hours to several days. A large
number of factors can reduce the
susceptibility of a silage to aerobic
spoilage. The key management factors are:
➤ rapid wilt, harvest and seal without
delay;
➤ good compaction (low silage porosity)
to reduce the air available for the
aerobic organisms responsible for
spoilage, and to minimise air
penetration into the exposed face during
feeding;
➤ sufficiently rapid feedout to minimise
the time of exposure to air; and
➤ minimum disturbance of the silage face
during feedout to reduce the rate of air
penetration.
US: Unstable – stable for only 1 day. MS: Moderate – stable for 3 days. S: Stable – stable for 7 days.
empe
ratu
re r
ise
abov
e am
bien
t (°
C)
Tem
pera
ture
ris
e ab
ove
ambi
ent
(° C
)
Successful Silage 41
Principles of silage preservation
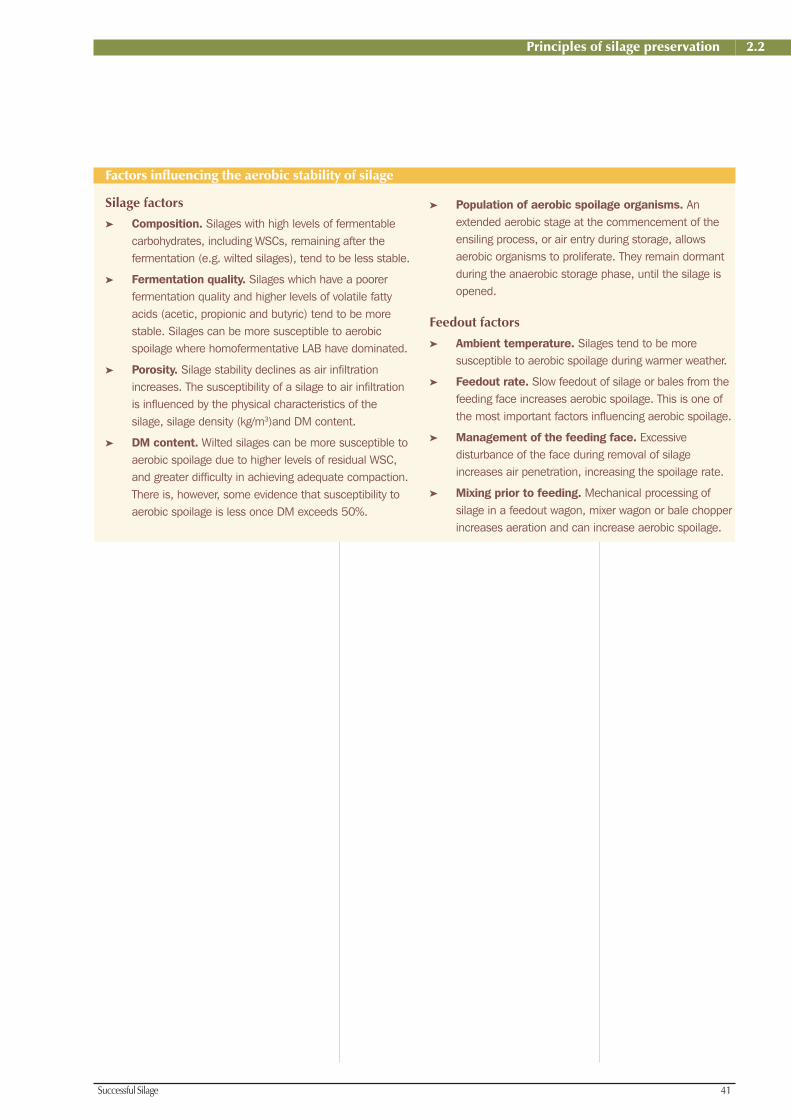
Silage factors
➤ Composition. Silages with high levels of fermentablecarbohydrates, including WSCs, remaining after thefermentation (e.g. wilted silages), tend to be less stable.
➤ Fermentation quality. Silages which have a poorerfermentation quality and higher levels of volatile fattyacids (acetic, propionic and butyric) tend to be morestable. Silages can be more susceptible to aerobicspoilage where homofermentative LAB have dominated.
➤ Porosity. Silage stability declines as air infiltrationincreases. The susceptibility of a silage to air infiltrationis influenced by the physical characteristics of thesilage, silage density (kg/m3)and DM content.
➤ DM content. Wilted silages can be more susceptible toaerobic spoilage due to higher levels of residual WSC,and greater difficulty in achieving adequate compaction.There is, however, some evidence that susceptibility toaerobic spoilage is less once DM exceeds 50%.
➤ Population of aerobic spoilage organisms. Anextended aerobic stage at the commencement of theensiling process, or air entry during storage, allowsaerobic organisms to proliferate. They remain dormantduring the anaerobic storage phase, until the silage isopened.
Feedout factors
➤ Ambient temperature. Silages tend to be moresusceptible to aerobic spoilage during warmer weather.
➤ Feedout rate. Slow feedout of silage or bales from thefeeding face increases aerobic spoilage. This is one ofthe most important factors influencing aerobic spoilage.
➤ Management of the feeding face. Excessivedisturbance of the face during removal of silageincreases air penetration, increasing the spoilage rate.
➤ Mixing prior to feeding. Mechanical processing ofsilage in a feedout wagon, mixer wagon or bale chopperincreases aeration and can increase aerobic spoilage.
Factors influencing the aerobic stability of silage
2.2
42 Top Fodder
Chapter 2
2.3.1
Lactic acid bacteria (LAB)
Bacteria belonging to this group convert
WSC to lactic acid and other fermentation
products. LAB are classified as either
homofermentative or heterofermentative
(see Appendix 2.A4, Table 2A.5).
Domination of the fermentation by
homofermentative LAB leads to a more
efficient utilisation of available WSC and a
more rapid decline in pH with less loss of
DM or energy. In forages with low WSC
content, achieving a successful
fermentation may be dependent on
homofermentative LAB dominating the
fermentation.
The population of LAB is low on growing
crops and pastures, and is concentrated on
dead and damaged plant tissue. Studies
with chopped silage show that the
population increases rapidly between
mowing and delivery to the silage pit or
bunker. Damage to the plant tissue releases
nutrients and minerals and is suggested as
a possible reason for this rapid increase in
bacteria numbers. Some studies have
shown that LAB numbers also increase
rapidly during the wilting phase, although
this is not always the case.
Commercial bacterial inoculants usually
contain cultures of homofermentative
LAB bacteria to improve the rate and
efficiency of fermentation (see Chapter 7,
Section 7.4.3). However, recent
information indicates that production of
some acetic acid may improve aerobic
stability of the silage upon opening. This
would be an advantage in warm Australian
conditions, particularly for maize silage,
which is inherently unstable. This suggests
that some heterofermentative LAB may be
desirable during fermentation. Further
studies are required to confirm this.
Section 2.3
Silage micro-organisms
Homofermentative LABconvert WSC to lacticacid only.
Heterofermentative LABconvert WSC to lacticacid plus acetic acid andother compounds (seeAppendix 2.A3).

Successful Silage 43
Principles of silage preservation
How clostridia affects silage
Clostridia adversely affect silage preservation because:
➤ they compete with LAB for WSC needed to produce lactic acid;
➤ saccharolytic clostridia degrade WSC and lactic acid to butyric acid. This raises silage pH;
➤ proteolytic clostridia degrade proteins and amino acids to ammonia, amines and volatilefatty acids, reducing the utilisation of silage nitrogen by livestock;
➤ clostridia activity increases fermentation losses of DM and energy; and
➤ clostridia activity reduces silage palatability and lowers the nutritive value of the silagethrough the loss of energy and degradation of protein.
2.3.2
Clostridia
Clostridia are classified as either
saccharolytic or proteolytic according to
whether the main substrate they ferment is
WSCs and lactic acid or protein,
respectively, although some species
possess both saccharolytic and proteolytic
activity (see Table 2A.6 in Appendix
2.A4).
Clostridia require a neutral pH (about 7.0)
and moist conditions for optimal growth.
As pH falls during an effective lactic acid
fermentation, clostridia become less able
to compete, until their growth is
completely inhibited. Wilting to a DM
content greater than 30% severely restricts
clostridial growth.
2.3.3
Enterobacteria
These bacteria prefer a neutral pH (about
7.0) and warm conditions for optimal
growth. The warm Australian conditions
are ideal for enterobacteria to flourish
early in the fermentation phase. In low
WSC forages (e.g. tropical grasses), where
pH drops slowly, these bacteria can
dominate the fermentation. If they
dominate, an acetate silage will be
produced with a pH of about 5.0. Below
this level the growth rate of enterobacteria
is inhibited.
Levels of enterobacteria are low on crops
and pasture, and decline during wilting.
However, numbers can increase rapidly
during the first few days of the
fermentation and compete with LAB for
available WSC. In most silages, they are
only likely to be significant during the
early stages of fermentation, before pH
starts to decline significantly.
The main products of their fermentation
process are acetic acid, lactic acid and
CO2, and increased ammonia-N levels due
to the degradation of protein. Although
some acetic acid production may improve
aerobic stability, DM and energy losses
can be significant if the fermentation is
prolonged and enterobacteria are
dominant. The resulting silage is also less
palatable to stock.
2.3

44 Top Fodder
Chapter 2
2.3.4
Yeasts and moulds
Yeasts and moulds are classed as fungi.
Most require oxygen to grow and multiply,
although a number of yeasts can grow and
multiply in anaerobic conditions. Yeasts
and moulds can grow over a wide range in
pH (3.0-8.0) and temperature (0-40ºC).
They do not contribute to silage
preservation and are responsible for
spoilage during the initial aerobic phase
after ensiling and during feedout (see
Sections 2.5.2 and 2.5.3).
Yeasts are common in soil and it is
believed that contamination with soil
during mechanical operations will increase
numbers on the cut forage. They multiply
on damaged plant tissue, with numbers
usually increasing during wilting. Yeasts
and moulds also multiply during the initial
aerobic phase after ensiling.
Fermentation phase
Anaerobic yeasts begin to multiply when
anaerobic conditions have been achieved
after ensiling. They compete directly with
LAB for WSC, which they ferment
primarily to ethanol. Other yeasts, less able
to ferment WSC, use lactic acid. Yeast
activity is eventually inhibited by the
increasing concentration of lactic and
acetic acids.
Because it is easy to see, mould growth is
an indicator of the presence and
distribution of oxygen in the silo or bale at
sealing. Growth can be spread throughout
poorly compacted silages or appear in
clumps in silages that contain air pockets
at the time of sealing. In well-compacted
silages, without air pockets, any mould
growth is limited to the surface of the silo
or bale. Surface mould growth can be
eliminated with effective sealing. Because
drier silages are harder to compact, they
usually contain more mould growth.
Further description of mould growth is
provided in Chapter 9, Appendices 9.A1
and 9.A2.
Feedout phase
When the silage is exposed to air during
feedout, the growth of yeasts is the
primary cause of aerobic deterioration.
Mould growth begins later. Silages that
contain significant numbers of yeast and
mould spores, carrying over from the
initial aerobic phase, tend to be less stable.
Yeasts and moulds initially use residual
WSC, lactic acid, other organic acids and
ethanol for growth. The silage begins to
deteriorate in the same way that
composting occurs, with yeast and mould
growth causing a rise in temperature and
pH, loss of DM and energy, and reduction
in silage palatability. As the decay
processes continue, the moulds break
down some of the structural carbohydrates
in the silage.

Successful Silage 45
Principles of silage preservation
2.3.5
Potentially harmfulmicro-organisms
There is no evidence to support the
misconception that silage feeding has
significantly greater animal health risks
than feeding other forms of conserved
forage. Reports of animal health problems
associated with silage feeding are not
common.
Animal health issues are only covered
briefly in this publication. Producers who
are concerned about health risks
associated with the feeding of silage
should seek veterinary advice.
The potential health risks most likely to be
associated with feeding silage to livestock
are caused by listeria (listeriosis), moulds
and Clostridium botulinum (botulism). The
risks of health problems caused by listeria
and moulds can be almost eliminated by
good silage-making practices, particularly
effective compaction and sealing. Poor
silage-making practices may increase
animal health risks. However, the main
issue is that poor practices will always
result in significant economic penalties
from increased DM and quality losses.
Listeria: Listeriosis is an infection caused
by the bacteria Listeria monocytogenes.
Listeria can cause abortions (usually in
late pregnancy), brain damage (‘circling
disease’) in sheep, or even death.
Listeriosis is more common in animals
with weakened immune systems –
particularly new-born and pregnant stock.
Sheep are inherently more susceptible than
cattle.
Listeria require aerobic conditions to grow
and multiply, but are able to survive under
anaerobic conditions. They are intolerant
of acidic conditions and, under anaerobic
conditions, activity is severely restricted
below a pH of about 5.5. Therefore,
listeriosis is generally only associated with
poor quality silages – inadequate air
exclusion, poor sealing and limited
fermentation (high pH). European studies
have found the incidence of listeriosis is
marginally more common with baled
silages, where adequate compaction and
air exclusion are more difficult to achieve,
there is a greater surface to volume ratio
and the fermentation is limited.
If listeria are present they are usually in
the surface spoilage layer. If this layer is
removed prior to feeding, the risk of
listerosis is reduced. The most effective
strategy to avoid listeriosis is
effective sealing.
2.3

46 Top Fodder
Chapter 2
Moulds: Some moulds are capable of
producing toxins, which if eaten, can be
fatal to livestock. Inhaled mould spores are
also capable of causing allergic reactions
in humans – asthma and farmer’s lung.
Moulds require aerobic conditions for
growth. In well-made silages – rapid
filling and compaction of the silo, good air
exclusion and adequate sealing – any
mould growth is limited and confined to
the surface of the silo or bale.
If mould is observed, and potential animal
health risk is a concern, take the following
precautions:
➤ Remove the mouldy material prior to
feeding, if possible.
➤ Feed sufficient silage to allow livestock
to avoid eating the mould. Because it is
unpalatable, stock will generally not eat
mouldy silage, if given a choice.
➤ Avoid feeding the silage to very hungry
livestock and to pregnant animals.
Feeding mouldy silage is more likely to
lead to animal health problems when it
is used for drought feeding.
Most authorities consider the risk to
livestock from mouldy silage to be
minimal and no greater than the risks
associated with feeding mouldy hay.
Reports of livestock deaths from either
source are not common. There is no
evidence to suggest that colour of the
mould is any indication of toxicity.
Botulism: The disease caused by the
bacteria Clostridium botulinum. When the
carcases of dead animals are ensiled, these
bacteria multiply and produce a toxin.
Although the incidence is very low, eating
contaminated silage or hay causes death
very quickly.
The most common sources are probably
rats, snakes and other small animals
picked up during harvest. As a precaution,
remains of dead livestock should be
removed prior to sowing a silage crop or
locking up pasture. Vermin that burrow
into and nest in silos and bales, and then
die may also be a source of contamination.
Plate 2.1
Mould is an indication ofaerobic spoilage. Theextent of mould growthin this bale is probablythe result of inadequatewrapping, poor qualityplastic or damage to theplastic seal.
Photograph: F. Mickan

Successful Silage 47
Principles of silage preservation
The effects of reducing chop length
Reducing chop length:
➤ increases the rate at which fermentation occurs;
➤ reduces fermentation losses of DM and energy, and degradation ofthe protein fraction;
➤ increases the chances of a successful fermentation in forages withlow WSC content;
➤ increases amount of lactic acid produced in wilted silages;
➤ can result in a lower silage pH;
➤ reduces the volume of forage transported at harvest, and storagespace required;
➤ makes compaction of the forage in the silo easier; and
➤ can increase effluent production in low DM content silages.
The chop length of the ensiled forage can
affect the rate and extent of silage
fermentation, the extent of losses during
storage and animal production.
Reducing the length of chop causes more
physical damage to plant cells, releasing
WSCs more rapidly for the silage micro-
organisms. This allows the fermentation to
develop more rapidly and the LAB to
ferment more WSC to lactic acid. The pH
will decline more rapidly, with a reduced
loss of DM and energy, and less
degradation of the protein fraction.
For forages with low levels of WSC, such
as legumes or tropical grasses, a finer
chop length will assist in the production of
more acid, which will, in turn, assist
successful preservation. As well as making
WSCs more available, short chopping
increases bacterial activity in wilted
silages by releasing moisture from the
cells. This increases the amount of WSC
fermented to lactic acid. The effect of chop
length on the silage fermentation, as
indicated by rate of pH decline, for a
wilted lucerne silage is clearly
demonstrated in Figure 2.11.
Reducing the chop length makes the silage
easier to compact and reduces the amount
of trapped oxygen in the silo. As a result,
losses due to aerobic respiration and the
risk of mould growth are lower (see
Section 2.5.2 and Chapter 9). The
advantage of a finer chop length is greater
for silages that are difficult to compact,
e.g. heavily wilted forage and grasses
compared to legumes. However, finer
chopped, low DM silages produce more
effluent, at the same DM content, due to
the release of moisture from damaged cells
(see Section 2.1.1 and Chapter 9).
Silage intake by livestock has also been
shown to increase with short versus long
forage chop length in a number of studies.
This is particularly so with sheep
compared to cattle, and with young
compared to older livestock. Increased
voluntary intake improves animal
production in almost all cases. The effects
of chop length on animal production are
discussed in Chapters 13, Section 13.2.5;
Chapter 14, Section 14.2.5; and Chapter
15, Section 15.2.5.
Section 2.4
Chop length
Figure 2.11
Effect of chop length onthe pH of lucerne silageswith a DM content of39%.
Days after ensiling0 10 30 40 50 60
pH
4.0
4.5
5.0
5.5
6.0
Round bale bagged silage (unchopped)
Chopped bagged silage
20
2.4
Source: Nicholson et al. (1991)

48 Top Fodder
Chapter 2
Even in well-managed systems, losses of
DM and energy will occur during silage
making, storage and feeding. The type and
extent of the losses are influenced by a
number of factors:
➤ crop type and composition;
➤ weather conditions;
➤ silage system; and
➤ management.
In practice, the most important factor
influencing losses is management – poor
management can substantially increase
losses, greatly reducing the efficiency of
the conservation process.
There is often considerable debate
concerning the level of losses that can
Section 2.5
Losses
occur during the ensiling process. One
source of confusion is whether the losses
quoted are ‘typical’ losses observed on-
farm or losses that occur with good
management. Clearly, the on-farm losses
are highly variable and reflect the standard
of management. So it is recommended that
the latter be adopted as the benchmark that
producers should target. This should also
be the basis for any economic appraisal of
silage, although a sensitivity analysis to
determine the penalty of greater losses due
to poor management can be very
informative (see Chapter 11, Section
11.2.4).
As there are few Australian studies on
losses occurring at various stages of the
ensiling process, data from Europe and the
United States have to be used. Loss
estimates vary considerably, and there is
some concern as to whether DM losses
have been over-estimated in some studies
due to failure to adequately account for the
volatile compounds in silage when
calculating DM losses (see Chapter 12,
Section 12.4.1).
The sources of DM and energy losses
during the ensiling and feedout process are
illustrated in Figure 2.12 and Table 2.6.
The source of losses varies between silage
systems and can be seen to be strongly
Estimated DM lossesduring harvesting andstorage of pasture silageunder Australianconditions with goodmanagement.
Figure 2.13
Figure 2.12
Typical DM losses from a chopped silage system with bunker storage.
Losses (%)
0 5 10 15 20
effluentfieldfermentationspoilage
8% 2%
8% 5% 1%
5% 9% 2%
3% 11% 2%
5% 12% 2%Unwilted pasture
Lightly wilted pasture
Moderately wilted pasture
Heavily wilted pasture
Maize
Source: Jarrige et al. (1982)
Source: Data from varioussources – Hoglund (1964);
Wilkinson (1981, 1988); Jarrigeet al. (1982); McDonald et al.
(1991); Wilkins et al. (1999) Silage DM content (%)
15 20 25 30 35 40 45 50 55 60
DM
loss
(%
)
0
5
10
15
20
25
Total storage losses
Total losses (field & storage)
Effluent losses
Storage losses
Field losses

Successful Silage 49
Principles of silage preservation
influenced by wilting (see also Figure
2.13). The data in Figures 2.12 and 2.13
indicate that, with good management, it
should be possible to keep DM losses to
12-16% in a wilted silage system.
In a direct-cut maize silage system, where
field losses are minimal, DM losses should
be kept to about 10%.
With good management, quality losses
during the ensiling process will be
minimal. With poor management, DM
losses can be considerably higher than
those illustrated, and silage quality will
suffer.
Energy losses are usually less than DM
losses. This is because some of the
fermentation products in silage have a
higher energy value than the substrates
from which they are produced and the
gross energy content of silage is usually
higher than that of the parent forage.
Energy losses at various stages of the
ensiling process are listed in Table 2.6, and
have been classified as unavoidable or
avoidable. The avoidable categories can be
eliminated with good management.
According to this European work energy
losses need be no higher than 7%.
Losses during the ensiling process
DM losses:
The quantity of forage lost (on a DM basis) at various stages of theensiling process:
DM loss (%) =
x 100Initial forage weight (kg)
Quality losses:
The loss of nutrients present in the initial forage. Most commonly appliedto changes in digestibility, energy or the nitrogen fraction during theensiling process, and loss of WSC during wilting.
Process Classified as Approximate Factors responsiblelosses (%)
Effluent Unavoidable for 5 to >7 DM content of forage at ensilingor most crops and orField losses by wilting pastures 2 to >5 Weather, technique, management,
crop/pasture (type and yield)Harvesting losses Unavoidable but 1 to 5 DM content, crop/pasture type, number
manageable of mechanical operationsResidual respiration Unavoidable 1 to 2 Plant enzymesFermentation Unavoidable 2 to 4 Micro-organismsSecondary (clostridial) Avoidable 0 to >5 Crop/pasture type, environment in silo,fermentation DM contentAerobic spoilage during storage Avoidable 0 to >10 Filling time, density, silo type and size,(including surface waste) sealing, crop/pasture typeAerobic spoilage (heating) Avoidable 0 to >10 As for aerobic spoilage above. DMduring feedout content of silage, unloading technique,
weatherTotal 7 to >40
Table 2.6Energy losses duringensiling and factorsresponsible for theselosses.
Source: Based on Zimmer (1980)
The relative importance of field and
storage losses varies with the degree of
wilting and the DM content at ensiling
(see Figures 2.12 and 2.13). Figure 2.13
shows the expected DM losses in the
production of pasture silage, under
Australian conditions, given good
management. The data in Figure 2.13 are a
composite of results from various overseas
studies – there are no Australian data, a
deficiency that needs to be addressed in
future research. Total losses are likely to
be lowest in the DM range of 30-40%
when rapid wilting is achieved.
2.5
Initial forage weight (kg) Final forage weight (kg)
Note: Some publications refer to DM recovery = 100 DM loss (%)

50 Top Fodder
Chapter 2
Operation or Type of Reason Management solutionssource of loss loss
Mowing 1. DM Cut too high, sections of Graze paddock after harvest to utilise uncutpaddock uncut forage
Tedding 2. DM, Damage to forage, with Avoid tedding crops that are tooquality some loss of leaf dry (over-wilting), especially legumes
Wilting 3. DM, Respiration of WSC and Increase rate of wilting but some lossquality degradation of protein by unavoidable
plant enzymesRaking 4. DM Cut material not all raked Graze paddock after harvest to utilise residual
into windrow forage5. DM, Damage to forage, with some Avoid over-wilting and raking crop when tooquality loss of leaf dry (especially legumes)
Harvesting of direct 6. DM Some crop uncut and left Graze paddock after harvest to utilise uncutcut crops in paddock forage
7. DM, Some loss of chopped forage Minimal if using an experienced forage harvesterquality* when blown into truck/cart operator. Graze paddock after harvest.
Harvesting wilted 8. DM Windrow not all picked up Graze paddock after harvest to utilise cutforage (windrows) forage
9. DM, Some loss of chopped forage Avoid harvesting small, light windrows. Minimalquality* when blown into truck/cart if using an experienced forage harvester
operator. Graze paddock after harvest.Transport to storage 10. DM Loss of forage from truck Avoid overloading truck/cart and avoid
during transportation harvesting crop that is too dry. Coveringmay be an option but probably not practical.
2.5.1
Field and harvesting losses
Field losses include the DM lost during
various mechanised operations in the field
(mowing, tedding and raking), during
harvest and transport to the storage site,
and due to the activity of plant enzymes.
Table 2.7 outlines the various components
of field losses. The extent of these losses
and management strategies to reduce them
are covered in more detail in Chapters 6
and 8.
Of the field losses in Table 2.7, the
physical losses due to mechanical handling
should be minimal, and will reflect the
standard of management of the field and
transport operations. Forage left in the
paddock may be utilised with post-harvest
grazing. If grazing is an option, items 1, 4,
6 and 8 in Table 2.7 account for little loss
to the system.
Direct harvested crops, such as maize,
have considerably lower field losses
(<1%, see Figure 2.12) than wilted crops
because there is less time for respiration
and fewer handling operations.
Respiration and proteolysis can account
for significant DM and quality losses,
particularly during wilting (see
Section 2.2.1). The quality losses will
mean reduced forage digestibility and ME
content and increased protein degradation.
Some respiratory loss during wilting is
unavoidable, but can be minimised (to
about 2%) by rapid wilting.
As Figure 2.13 shows, field losses increase
with forage DM content. The longer
wilting period associated with higher DM
content increases the susceptibility of the
crop to respiration losses. At the same time
the higher DM forage is susceptible to
greater mechanical losses during various
handling operations, particularly as DM
content increases above 35 to 40%.
Table 2.7
Sources of field lossesduring silage making.
* Quality losses may not occuron all occasions.

Successful Silage 51
Principles of silage preservation
2.5.2
Storage losses
Table 2.8 summarises the sources of DM
and quality losses during storage. They are:
➤ effluent;
➤ respiration and aerobic fermentation
while oxygen remains in the silo or bale
(or if the seal is damaged); and
➤ the silage fermentation.
These losses are strongly influenced by the
DM content at which the forage is ensiled.
The effluent losses decline rapidly as DM
content increases to 30% (see Figure 2.2).
Respiration and fermentation losses
decline as DM content reaches 35-45%
and then slowly increase (see Figure 2.13).
Effluent losses are influenced by forage
DM content, chop length, and the degree
of compaction or silage density. Some
additives (e.g. molasses, acids and
enzymes) will increase effluent production
(see Chapter 7), but the most important
factor is forage DM content at ensiling
(see Section 2.1.1). Chapter 9 covers the
effect of management on silage effluent
production more fully.
As described in Section 2.2.1, losses due
to respiration of WSC by plant enzymes
and fermentation by aerobic micro-
organisms will continue until anaerobic
conditions are achieved within the silo or
bale. Heating of the freshly harvested
forage in the silo or bale is an indication of
respiratory losses. Some heating and
losses due to respiration are unavoidable
(see Table 2.6).
Direct losses of WSC represent only part
of the quality loss. Heat build-up within
the silo or bale as a result of respiration
can further reduce digestibility and
damage to the protein fraction (see Section
2.2.1 and Chapter 12, Section 12.4.4).
Chapter 9, Section 9.4, covers management
strategies to reduce these losses – rapid
filling, good compaction or bale density,
and effective sealing (without delay).
While oxygen is present during the early
stages of the storage period, aerobic
bacteria, yeasts and moulds will continue
to grow. Where sealing is inadequate or the
seal is damaged during storage, air entry
will allow these organisms to grow. The
growth of aerobic organisms will result in
silage decay and the development of a
Table 2.8
Source of loss Type of Reason Management solutionsloss
Effluent losses: DM, Forage ensiled at too low a Wilt mown crops and pastures, harvest directquality DM content (<30%). cut crops at a later stage of maturity.
Aerobic losses:Respiration DM, Presence of air resulting in loss Avoid ensiling at too high a DM content.
quality of WSC due to activity of plant Fill silo rapidly, compact and seal wellenzymes (invisible in-silo losses) as soon as possible. Some loss unavoidable.
Inedible waste DM, Presence of air for longer period will As above, and maintain an air-tight sealsilage quality result in visible inedible waste (rotten throughout the storage period. Check
and mouldy silage) due to growth of regularly for damage to the sealaerobic bacteria, yeasts and moulds. and repair immediately.
Fermentation DM, Fermentation of WSC. Losses minimal Promote desired LAB fermentation, wiltlosses: quality with a homofermentative lactic acid or use additives as required, as well as
fermentation, and little or no quality loss. good silage-making practices.Losses of DM and quality higher withpoor (including secondary) fermentations.
Sources of losses duringsilage making.
2.5

52 Top Fodder
Chapter 2
Crop type, DM content, silage density, the
type of fermentation, the quantity of
residual spores present from the initial
aerobic phase, ambient temperature during
feeding, rate of feedout, and silage
removal technique can all affect the
stability of the silage after opening. Silage
additives can influence aerobic stability
(see Chapter 7, Section 7.7).
Wastage of silage during feedout is
difficult to estimate and few studies have
been conducted. In poorly managed
feeding systems, wastage is likely to reach
30-50% of silage DM fed. These losses
will be influenced by:
➤ quantity of silage offered to livestock –
if the silage is not consumed within a
reasonable time then losses will
increase (irregular feeding intervals or
overfeeding should be avoided);
➤ measures taken to prevent animals from
walking, camping, urinating and
defecating on the silage; and
➤ wet weather (trampling losses are likely
to be higher when silage is fed on the
ground).
Animals are also likely to reject silage that
is hot (aerobically spoiled), mouldy or
rotten. These losses, resulting from
rejection by animals, have been accounted
for earlier as components of storage losses
or aerobic spoilage.
surface waste layer, mouldy silage and
pockets of rotten silage.
Some loss of DM and energy during the
anaerobic fermentation of WSC to lactic
acid and other products is unavoidable.
However, if the fermentation is dominated
by homofermentative LAB, the losses are
small (see Appendix 2.A3). Higher losses
will occur if heterofermentative LAB play
a significant role in the fermentation. The
greatest fermentation losses will occur if
clostridia or enterobacteria dominate the
fermentation.
Table 2.9
Source of loss Type of Reason Management solutionsloss
Aerobic spoilage DM, Silage unstable and heats on exposure Silages vary in susceptibility, and tend to be(heating) quality to air. Due to growth of aerobic more unstable when fed out during warm
micro-organisms, and results in significant weather. Good management at ensiling isDM and quality losses. Aerobically spoiled important. Rapid rate of feedout is essential,silage is unpalatable. Intake is depressed. with minimum disturbance of the silage face.
Wastage during DM Animals drop, trample and foul silage. Silage fed on the ground is most susceptible.feeding Overfeeding is likely to increase losses. Losses are reduced by using suitable feed
barriers, feeders, feed troughs and feed pads.
Sources of losses duringthe feedout of silage.
2.5.3
Feedout losses
Losses during feedout have two sources –
aerobic spoilage or heating, and wastage
of silage by animals (see Table 2.9).
Effective management of the feedout
process can avoid most of these losses.
Once exposed to air, silage at or close to
the feeding face commences to deteriorate
as yeasts, moulds and aerobic bacteria
become active. Heating is usually the first
noticeable sign of aerobic spoilage of the
silage stack or bale (see Section 2.2.3).
Chapter 10 covers more fully management
strategies that reduce these losses.
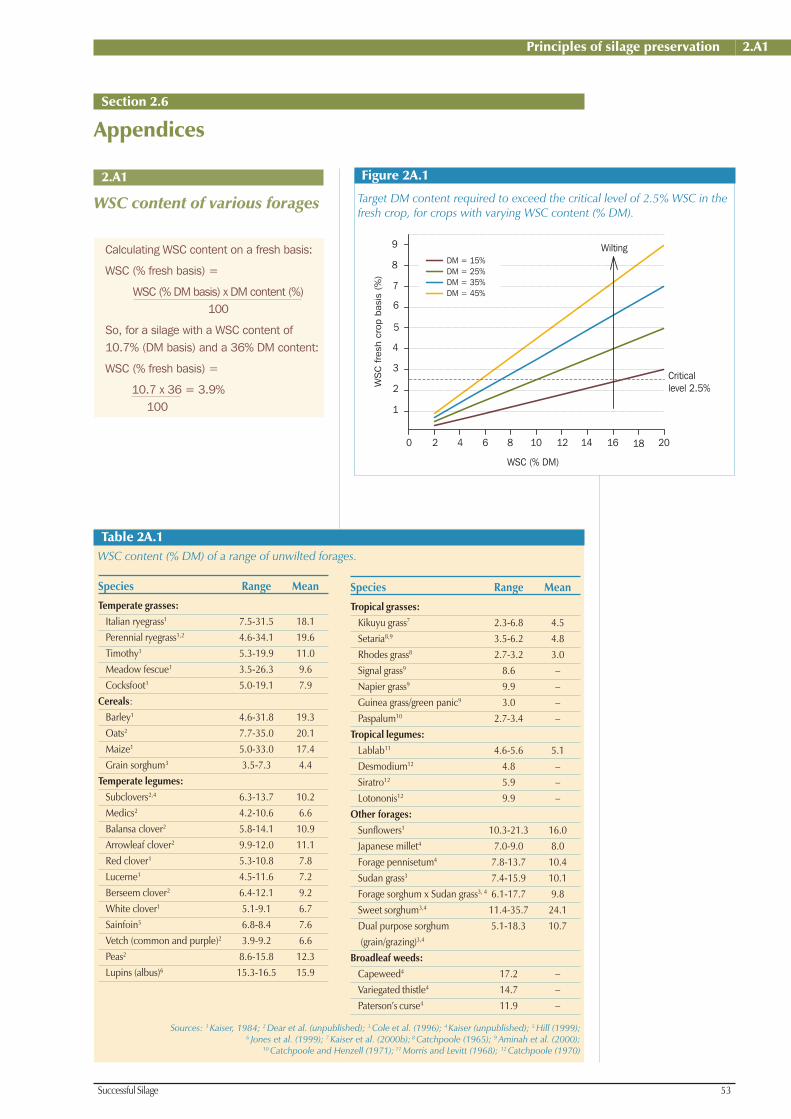
Successful Silage 53
Principles of silage preservation
Section 2.6
Appendices
Species Range Mean
Temperate grasses:Italian ryegrass1 7.5-31.5 18.1Perennial ryegrass1,2 4.6-34.1 19.6Timothy1 5.3-19.9 11.0Meadow fescue1 3.5-26.3 9.6Cocksfoot1 5.0-19.1 7.9
Cereals:Barley1 4.6-31.8 19.3Oats2 7.7-35.0 20.1Maize1 5.0-33.0 17.4Grain sorghum3 3.5-7.3 4.4
Temperate legumes:Subclovers2,4 6.3-13.7 10.2Medics2 4.2-10.6 6.6Balansa clover2 5.8-14.1 10.9Arrowleaf clover2 9.9-12.0 11.1Red clover1 5.3-10.8 7.8Lucerne1 4.5-11.6 7.2Berseem clover2 6.4-12.1 9.2White clover1 5.1-9.1 6.7Sainfoin5 6.8-8.4 7.6Vetch (common and purple)2 3.9-9.2 6.6Peas2 8.6-15.8 12.3Lupins (albus)6 15.3-16.5 15.9
2.A1
WSC content of various forages
Species Range Mean
Tropical grasses:Kikuyu grass7 2.3-6.8 4.5Setaria8,9 3.5-6.2 4.8Rhodes grass8 2.7-3.2 3.0Signal grass9 8.6 –Napier grass9 9.9 –Guinea grass/green panic9 3.0 –Paspalum10 2.7-3.4 –
Tropical legumes:Lablab11 4.6-5.6 5.1Desmodium12 4.8 –Siratro12 5.9 –Lotononis12 9.9 –
Other forages:Sunflowers1 10.3-21.3 16.0Japanese millet4 7.0-9.0 8.0Forage pennisetum4 7.8-13.7 10.4Sudan grass3 7.4-15.9 10.1Forage sorghum x Sudan grass3, 4 6.1-17.7 9.8Sweet sorghum3,4 11.4-35.7 24.1Dual purpose sorghum 5.1-18.3 10.7 (grain/grazing)3,4
Broadleaf weeds:Capeweed4 17.2 –Variegated thistle4 14.7 –Paterson’s curse4 11.9 –
Table 2A.1WSC content (% DM) of a range of unwilted forages.
Sources: 1 Kaiser, 1984; 2 Dear et al. (unpublished); 3 Cole et al. (1996); 4 Kaiser (unpublished); 5 Hill (1999);6 Jones et al. (1999); 7 Kaiser et al. (2000b); 8 Catchpoole (1965); 9 Aminah et al. (2000);
10 Catchpoole and Henzell (1971); 11 Morris and Levitt (1968); 12 Catchpoole (1970)
Figure 2A.1
Target DM content required to exceed the critical level of 2.5% WSC in thefresh crop, for crops with varying WSC content (% DM).
Calculating WSC content on a fresh basis:
WSC (% fresh basis) =
WSC (% DM basis) x DM content (%)100
So, for a silage with a WSC content of10.7% (DM basis) and a 36% DM content:
WSC (% fresh basis) =
10.7 x 36 = 3.9%100
0 2 4 6 8 10 12 14 16 18 20
WS
C fre
sh c
rop
basi
s (%
)
1
2
3
4
5
6
7
8
9
DM = 15%DM = 25% DM = 35% DM = 45%
Wilting
Critical level 2.5%
WSC (% DM)
2.A1

54 Top Fodder
Chapter 2
Forage type Range Mean
Temperate grasses:Cocksfoot1 209-438 302Italian ryegrass1 265-589 386Perennial ryegrass1,2 231-428 313
Cereals:Maize1 149-351 236Oats – immature vegetative1 732-779 756Oats – heading1,2 213-453 308
Temperate legumes:Subclovers1,2 420-877 647Subclover/annual grasses1 383-656 506Medics2 496-720 614Balansa clover2 487-623 576Arrowleaf clover2 484-588 548Red clover1 491-617 562Lucerne1 297-595 505Berseem clover2 638-790 696White clover1 512 –Sainfoin3 467-539 496Vetch (common and purple)2 504-616 549Peas2 328-502 415Lupins (albus)4 304-338 321
Forage type Range Mean
Tropical grasses and legumes:Kikuyu grass5 225-496 351Rhodes grass6 435 –Stylo6 469 –Siratro6 621 –
Other forages:Japanese millet7 343-682 519Forage pennisetum7 315-520 393Forage sorghum x Sudan grass7 333-532 416Sweet sorghum7 258-419 322
Broadleaf weeds:Capeweed1 1,082 –Variegated thistle1 682 –Paterson’s curse1 1,013 –
Source: 1 Kaiser (1984); 2 Dear et al. (unpublished); 3 Hill (1999); 4 Jones et al. (1999);5 Kaiser et al. (2000b); 6 McDonald et al. (1991); 7 Kaiser (unpublished)
Table 2A.2Buffering capacities (meq/kg DM) of a range of unwilted forages.
2.A2
Buffering capacity of various forages

Successful Silage 55
Principles of silage preservation
Table 2A.3
2.A3
Biochemical pathways, and energy and DM losses that occurduring silage fermentation
2.A3
Reaction
glucose → butyric acid + 2 CO2 + 2 H2
2 lactic acid → butyric acid + 2 CO2 + 2 H2
3 alanine → 2 propionic acid + acetic acid + 2 CO2 + 3 NH3
alanine + 2 glycine → 3 acetic acid + CO2 + 3 NH3
lysine → cadaverine + CO2
valine → isobutyric acid + NH3
leucine → isobutyric acid + NH3
Source: Adapted from McGechan (1990) from Roberts (1995)
Table 2A.4The main fermentation pathways which occur during a clostridial fermentation.
The main chemical pathways that occur during a LAB fermentation.
Reaction Fermentation DM loss Energy losstype* (%) (%)
glucose ➝ 2 lactic acid homolactic 0 0.7fructose ➝ 2 lactic acid homolactic 0 0.7pentose ➝ lactic acid + acetic acid homolactic and heterolactic 0 –glucose ➝ 2 lactic acid + ethanol + CO2 heterolactic 24.0 1.73 fructose + H2O → lactic acid + 2 mannitol + acetic acid + CO2 heterolactic 4.8 1.02 fructose + glucose + H2O → lactic acid heterolactic 4.8 –
+ 2 mannitol + acetic acid + CO2
* Homolactic – fermentation is dominated by homofermentative LAB Heterolactic – fermentation is dominated by heterofermentative LAB
Source: McGechan (1990) from Roberts (1995)

56 Top Fodder
Chapter 2
2.A4
Species of lactic acid bacteria (LAB) and clostridia found in silage
Table 2A.5Some important species of lactic acid bacteria found in silage.
Homofermentative Heterofermentative
Lactobacillus acidophilus Lactobacillus brevisL. casei L. buchneriL. coryniformis L. cellobiosusL. curvatus L. fermentumL. dulbrueckii L. viridescensL. leichmannii Leuconostoc mesenteroidesL. plantarumL. salivariusPediococcus acidilacticiP. damnosusP. pentosaceusEnterococcus faecalisE. faeciumLactococcus lactisStreptococcus bovis
Source: McDonald et al. (1991); Ross (unpublished data)
Table 2A.6Classification of main clostridia found in silage.
Lactate fermenters Amino acid fermenters Others(saccharolytic) (proteolytic)
Clostridium butyricum C. bifermentans C. perfingens*C. paraputrificum C. sporogenes C. sphenoides*C. tyrobutyricum
* Ferment both WSCs and protein.
Source: Adapted from McDonald et al. (1991)