Embed Size (px)
Citation preview

Chapter One
A LIBRARY OFFUNCTIONS
Functions are truly fundamental tomathematics. In everyday language we say,“The fuel needed to launch a rocket is afunction of its payload” or “The patient’s bloodpressure is a function of the drugs prescribed.”In each case, the word function expresses theidea that knowledge of one fact tells us another.In mathematics, the most important functionsare those in which knowledge of one numbertells us another number. If we know the lengthof the side of a square, its area is determined. Ifthe circumference of a circle is known, itsradius is determined.
Calculus starts with the study of functions.This chapter lays the foundation for calculusby surveying the behavior of the most commonfunctions, including exponential, logarithmic,and trigonometric functions. We see functionsrepresented by graphs, tables, and formulasand investigate what limits and continuity cantell us about functions.

2 Chapter One A LIBRARY OF FUNCTIONS
1.1 FUNCTIONS AND CHANGE
In mathematics, a function is used to represent the dependence of one quantity upon another.Let’s look at an example. In December 2000, the temperatures in Chicago were unusually low
over winter vacation. The daily high temperatures for December 19–28 are given in Table 1.1.
Table 1.1 Daily high temperature in Chicago, December 19–28, 2000
Date (December 2000) 19 20 21 22 23 24 25 26 27 28
High temperature (◦F) 20 17 19 7 20 11 17 19 17 20
Although you may not have thought of something so unpredictable as temperature as being afunction, the temperature is a function of date, because each day gives rise to one and only onehigh temperature. There is no formula for temperature (otherwise we would not need the weatherbureau), but nevertheless the temperature does satisfy the definition of a function: Each date, t, hasa unique high temperature, H , associated with it.
We define a function as follows:
A function is a rule that takes certain numbers as inputs and assigns to each a definite outputnumber. The set of all input numbers is called the domain of the function and the set ofresulting output numbers is called the range of the function.
The input is called the independent variable and the output is called the dependent variable. Inthe temperature example, the domain is the set of dates t = {19, 20, 21, 22, 23, 24, 25, 26, 27, 28}and the range is the set of temperatures H = {7, 11, 17, 19, 20}. We call the function f and writeH = f(t). Notice that a function may have identical outputs for different inputs (December 20, 25,and 27, for example).
Some quantities, such as date, are discrete, meaning they take only certain isolated values (datesmust be integers). Other quantities, such as time, are continuous as they can be any number. For acontinuous variable, domains and ranges are often written using interval notation:
The set of numbers t such that a ≤ t ≤ b is written [a, b].
The set of numbers t such that a < t < b is written (a, b).
Representation of Functions: Tables, Graphs, Formulas, and WordsFunctions can be represented by tables, graphs, formulas, and descriptions in words. For exam-ple, the function giving the daily high temperatures in Chicago can be represented by the graph inFigure 1.1, as well as by Table 1.1.
20 22 24 26 28
10
December
20
30
t (date)
H (◦F)
Figure 1.1: Chicago temperatures, December 2000
As another example of a function, consider the snow tree cricket. Surprisingly enough, all suchcrickets chirp at essentially the same rate if they are at the same temperature. That means that the

1.1 FUNCTIONS AND CHANGE 3
chirp rate is a function of temperature. In other words, if we know the temperature, we can determinethe chirp rate. Even more surprisingly, the chirp rate,C, in chirps per minute, increases steadily withthe temperature, T , in degrees Fahrenheit, and can be computed by the formula
C = 4T − 160
to a fair degree of accuracy. We write C = f(T ) to express the fact that we think of C as a functionof T and that we have named this function f . The graph of this function is in Figure 1.2.
100 14040
100
200
300
400
T (◦F)
C (chirps per minute)
C = 4T − 160
Figure 1.2: Cricket chirp rate versus temperature
Examples of Domain and RangeIf the domain of a function is not specified, we usually take it to be the largest possible set ofreal numbers. For example, we usually think of the domain of the function f(x) = x2 as all realnumbers. However, the domain of the function g(x) = 1/x is all real numbers except zero, sincewe cannot divide by zero.
Sometimes we restrict the domain to be smaller than the largest possible set of real numbers.For example, if the function f(x) = x2 is used to represent the area of a square of side x, we restrictthe domain to nonnegative values of x.
Example 1 The function C = f(T ) gives chirp rate as a function of temperature. We restrict this function totemperatures for which the predicted chirp rate is positive, and up to the highest temperature everrecorded at a weather station, 136◦F. What is the domain of this function f?
Solution If we consider the equationC = 4T − 160
simply as a mathematical relationship between two variables C and T , any T value is possible.However, if we think of it as a relationship between cricket chirps and temperature, then C cannotbe less than 0. Since C = 0 leads to 0 = 4T − 160, and so T = 40◦F, we see that T cannot be lessthan 40◦F. (See Figure 1.2.) In addition, we are told that the function is not defined for temperaturesabove 136◦. Thus, for the function C = f(T ) we have
Domain = All T values between 40◦F and 136◦F
= All T values with 40 ≤ T ≤ 136
= [40, 136].
Example 2 Find the range of the function f , given the domain from Example 1. In other words, find all possiblevalues of the chirp rate, C, in the equation C = f(T ).
Solution Again, if we consider C = 4T − 160 simply as a mathematical relationship, its range is all real Cvalues. However, when thinking of the meaning of C = f(T ) for crickets, we see that the functionpredicts cricket chirps per minute between 0 (at T = 40◦F) and 384 (at T = 136◦F). Hence,
Range = All C values from 0 to 384
= All C values with 0 ≤ C ≤ 384
= [0, 384].

4 Chapter One A LIBRARY OF FUNCTIONS
In using the temperature to predict the chirp rate, we thought of the temperature as the indepen-dent variable and the chirp rate as the dependent variable. However, we could do this backward, andcalculate the temperature from the chirp rate. From this point of view, the temperature is dependenton the chirp rate. Thus, which variable is dependent and which is independent may depend on yourviewpoint.
Linear FunctionsThe chirp-rate function, C = f(T ), is an example of a linear function. A function is linear if itsslope, or rate of change, is the same at every point. The rate of change of a function that is not linearmay vary from point to point.
Olympic and World Records
During the early years of the Olympics, the height of the men’s winning pole vault increased ap-proximately 8 inches every four years. Table 1.2 shows that the height started at 130 inches in 1900,and increased by the equivalent of 2 inches a year. So the height was a linear function of time from1900 to 1912. If y is the winning height in inches and t is the number of years since 1900, we canwrite
y = f(t) = 130 + 2t.
Since y = f(t) increases with t, we say that f is an increasing function. The coefficient 2 tells usthe rate, in inches per year, at which the height increases.
Table 1.2 Men’s Olympic pole vault winning height (approximate)
Year 1900 1904 1908 1912
Height (inches) 130 138 146 154
This rate of increase is the slope of the line in Figure 1.3. The slope is given by the ratio
Slope =RiseRun
=146− 138
8− 4=
8
4= 2 inches/year.
Calculating the slope (rise/run) using any other two points on the line gives the same value.What about the constant 130? This represents the initial height in 1900, when t = 0. Geomet-
rically, 130 is the intercept on the vertical axis.You may wonder whether the linear trend continues beyond 1912. Not surprisingly, it doesn’t
exactly. The formula y = 130+2t predicts that the height in the 2000 Olympics would be 330 inchesor 27 feet 6 inches, which is considerably higher than the actual value of 19 feet 4.27 inches. Thereis clearly a danger in extrapolating too far from the given data. You should also observe that the datain Table 1.2 is discrete, because it is given only at specific points (every four years). However, wehave treated the variable t as though it were continuous, because the function y = 130 + 2t makes
4 8 12
130
140
150
y (height in inches)
t (years since 1900)
-�Run = 4
6?
Rise = 8
y = 130 + 2t
Figure 1.3: Olympic pole vault records

1.1 FUNCTIONS AND CHANGE 5
sense for all values of t. The graph in Figure 1.3 is of the continuous function because it is a solidline, rather than four separate points representing the years in which the Olympics were held.
As the pole vault heights have increased over the years, the time to run the mile has decreased.If y is the world record time to run the mile, in seconds, and t is the number of years since 1900,then records show that, approximately,
y = g(t) = 260− 0.4t.
The 260 tells us that the world record was 260 seconds in 1900 (at t = 0). The slope, −0.4, tellsus that the world record decreased by about 0.4 seconds per year. We say that g is a decreasingfunction.
Difference Quotients and Delta Notation
We use the symbol ∆ (the Greek letter capital delta) to mean “change in,” so ∆x means change inx and ∆y means change in y.
The slope of a linear function y = f(x) can be calculated from values of the function at twopoints, given by x1 and x2, using the formula
m =RiseRun
=∆y
∆x=f(x2)− f(x1)
x2 − x1.
The quantity (f(x2)− f(x1))/(x2 − x1) is called a difference quotient because it is the quotient oftwo differences. (See Figure 1.4). Since m = ∆y/∆x, the units of m are y-units over x-units.
x1 x2
y = f(x)
-�Run = x2 − x1
6
?
Rise = f(x2)− f(x1)
x
y
(x2, f(x2))
(x1, f(x1))
Figure 1.4: Difference quotient =f(x2)− f(x1)
x2 − x1
Families of Linear Functions
A linear function has the form
y = f(x) = b+mx.
Its graph is a line such that• m is the slope, or rate of change of y with respect to x.• b is the vertical intercept, or value of y when x is zero.
Notice that if the slope, m, is zero, we have y = b, a horizontal line.
To recognize that a table of x and y values comes from a linear function, y = b + mx, lookfor differences in y-values that are constant for equally spaced x-values.

6 Chapter One A LIBRARY OF FUNCTIONS
Formulas such as f(x) = b + mx, in which the constants m and b can take on various values,give a family of functions. All the functions in a family share certain properties—in this case, all thegraphs are straight lines. The constants m and b are called parameters; their meaning is shown inFigures 1.5 and 1.6. Notice the greater the magnitude of m, the steeper the line.
y = xy = 2x
y = 0.5x
x
y
y = −xy = −2x
y = −0.5x
Figure 1.5: The family y = mx(with b = 0)
x
y = −1 + x
y = x
y = 1 + x
y = 2 + x
y
Figure 1.6: The family y = b+ x(with m = 1)
Increasing versus Decreasing FunctionsThe terms increasing and decreasing can be applied to other functions, not just linear ones. SeeFigure 1.7. In general,
A function f is increasing if the values of f(x) increase as x increases.A function f is decreasing if the values of f(x) decrease as x increases.
The graph of an increasing function climbs as we move from left to right.The graph of a decreasing function falls as we move from left to right.
Increasing Decreasing
Figure 1.7: Increasing and decreasing functions
ProportionalityA common functional relationship occurs when one quantity is proportional to another. For exam-ple, the area, A, of a circle is proportional to the square of the radius, r, because
A = f(r) = πr2.
We say y is (directly) proportional to x if there is a nonzero constant k suchthat
y = kx.This k is called the constant of proportionality.
We also say that one quantity is inversely proportional to another if one is proportional to thereciprocal of the other. For example, the speed, v, at which you make a 50-mile trip is inverselyproportional to the time, t, taken, because v is proportional to 1/t:
v = 50
(1
t
)=
50
t.

1.1 FUNCTIONS AND CHANGE 7
Exercises and Problems for Section 1.1Exercises
1. The population of a city, P , in millions, is a function oft, the number of years since 1950, so P = f(t). Explainthe meaning of the statement f(35) = 12 in terms of thepopulation of this city.
2. The pollutant PCB (polychlorinated biphenyl) affects thethickness of pelican eggs. Thinking of the thickness, T ,of the eggs, in mm, as a function of the concentration, P ,of PCBs in ppm (parts per million), we have T = f(P ).Explain the meaning of f(200) in terms of thickness ofpelican eggs and concentration of PCBs.
3. The value of a car, V = f(a), in thousands of dollars, isa function of the age of the car, a, in years.
(a) Interpret the statement f(5) = 6(b) Sketch a possible graph of V against a. Is f an in-
creasing or decreasing function? Explain.(c) Explain the significance of the horizontal and verti-
cal intercepts in terms of the value of the car.
For Exercises 4–6, find the equation of the line that passesthrough the given points.
4. (0, 0) and (1, 1) 5. (0, 2) and (2, 3)
6. (−2, 1) and (2, 3)
For Exercises 7–9, determine the slope and the y-intercept ofthe line whose equation is given.
7. 7y + 12x− 2 = 0 8. −4y + 2x+ 8 = 0
9. 12x = 6y + 4
10. Match the graphs in Figure 1.8 with the following equa-tions. (Note that the x and y scales may be unequal.)
(a) y = x− 5 (b) −3x+ 4 = y
(c) 5 = y (d) y = −4x− 5
(e) y = x+ 6 (f) y = x/2
x
y(I)
x
y(II)
x
y(III)
x
y(IV)
x
y(V)
x
y(VI)
Figure 1.8
11. Match the graphs in Figure 1.9 with the following equa-tions. (Note that the x and y scales may be unequal.)
(a) y = −2.72x (b) y = 0.01 + 0.001x
(c) y = 27.9− 0.1x (d) y = 0.1x− 27.9
(e) y = −5.7− 200x (f) y = x/3.14
x
y(I)
x
y(II)
x
y(III)
x
y(IV)
x
y(V)
x
y(VI)
Figure 1.9
For Exercises 12–14, use the facts that parallel lines haveequal slopes and that the slopes of perpendicular lines are neg-ative reciprocals of one another.
12. Find the equation of the line through the point (2, 1)which is perpendicular to the line y = 5x− 3.
13. Find the equations of the lines through the point (1, 5)that are parallel to and perpendicular to the line withequation y + 4x = 7.
14. Find the equations of the lines through the point (a, b)that are parallel and perpendicular to the line y = mx+c,assuming m 6= 0.
For Exercises 15–17, give the approximate domain and rangeof each function. Assume the entire graph is shown.
15.
1 3 5
1
3
5y = f(x)
x
y 16.
−2 2
−2
2
y = f(x)
x
y
17.
1 3 5
2
4
6
y = f(x)
x
y

8 Chapter One A LIBRARY OF FUNCTIONS
Find domain and range in Exercises 18–19.
18. y = x2 + 2 19. y =1
x2 + 2
20. If f(t) =√t2 − 16, find all values of t for which f(t)
is a real number. Solve f(t) = 3.21. If g(x) = (4 − x2)/(x2 + x), find the domain of g(x).
Solve g(x) = 0.
In Exercises 22–24, write a formula representing the function.
22. The strength, S, of a beam is proportional to the squareof its thickness, h.
23. The energy, E, expended by a swimming dolphin is pro-portional to the cube of the speed, v, of the dolphin.
24. The number of animal species, N , of a certain bodylength, l, is inversely proportional to the square of l.
Problems
25. Match each story to the most appropriate graph in Fig-ure 1.10. Write a story for the remaining graph.
(a) During my journey, I had a flat tire. Then after fixingthe flat tire, I had to speed up to avoid being late.
(b) My car broke down and I parked it at the road side.(c) As soon as I’d dropped off the package, I turned
around and drove home.
time
velocity
(I)
time
velocity
(II)
time
velocity
(III)
time
velocity
(IV)
Figure 1.10
26. A car starts out slowly and then goes faster and fasteruntil a tire blows out. Sketch a possible graph of the dis-tance the car has traveled as a function of time.
27. A flight from Dulles Airport in Washington, DC, to La-Guardia Airport in New York City has to circle La-Guardia several times before being allowed to land. Plot agraph of the distance of the plane from Washington, DC,against time, from the moment of takeoff until landing.
28. You drive at a constant speed from Chicago to Detroit,a distance of 275 miles. About 120 miles from Chicagoyou pass through Kalamazoo, Michigan. Sketch a graphof your distance from Kalamazoo as a function of time.
29. The monthly charge for a waste collection service is $32for 100 kg of waste and is $48 for 180 kg of waste.
(a) Find a linear formula for the cost, C, of waste col-lection as a function of the number of kilograms ofwaste, w.
(b) What is the slope of the line found in part (a)? Giveunits and interpret your answer in terms of the costof waste collection.
(c) What is the vertical intercept of the line found inpart (a)? Give units with your answer and interpret itin terms of the cost of waste collection.
30. Residents of the town of Maple Grove who are connectedto the municipal water supply are billed a fixed amountyearly plus a charge for each cubic foot of water used.A household using 1000 cubic feet was billed $90, whileone using 1600 cubic feet was billed $105.
(a) What is the charge per cubic foot?(b) Write an equation for the total cost of a resident’s
water as a function of cubic feet of water used.(c) How many cubic feet of water used would lead to a
bill of $130?
31. The graph of Fahrenheit temperature, ◦F, as a function ofCelsius temperature, ◦C, is a line. You know that 212◦Fand 100◦C both represent the temperature at which wa-ter boils. Similarly, 32◦F and 0◦C both represent water’sfreezing point.
(a) What is the slope of the graph?(b) What is the equation of the line?(c) Use the equation to find what Fahrenheit tempera-
ture corresponds to 20◦C.(d) What temperature is the same number of degrees in
both Celsius and Fahrenheit?
32. An object is put outside on a cold day at time t = 0. Itstemperature, H = f(t), in ◦C, is graphed in Figure 1.11.
(a) What does the statement f(30) = 10 mean in termsof temperature? Include units for 30 and for 10 inyour answer.
(b) Explain what the vertical intercept, a, and the hori-zontal intercept, b, represent in terms of temperatureof the object and time outside.
b
a
t (min)
H (◦C)
Figure 1.11

1.2 EXPONENTIAL FUNCTIONS 9
33. For tax purposes, you may have to report the value ofyour assets, such as cars or refrigerators. The value youreport drops with time. “Straight-line depreciation” as-sumes that the value is a linear function of time. If a $950refrigerator depreciates completely in seven years, find aformula for its value as a function of time.
34. The table gives the average weight, w, in pounds, ofAmerican men in their sixties for various heights, h, ininches.1
(a) How do you know that the data in this table couldrepresent a linear function?
(b) Find weight, w, as a linear function of height, h.What is the slope of the line? What are the units forthe slope?
(c) Find height, h, as a linear function of weight, w.What is the slope of the line? What are the units forthe slope?
h (inches) 68 69 70 71 72 73 74 75w (pounds) 166 171 176 181 186 191 196 201
35. The demand function for a certain product, q = D(p), islinear, where p is the price per item in dollars and q is thequantity demanded. If p increases by $5, market researchshows that q drops by two items. In addition, 100 itemsare purchased if the price is $550.
(a) Find a formula for(i) q as a linear function of p
(ii) p as a linear function of q(b) Draw a graph with q on the horizontal axis.
36. When a cold yam is put into a hot oven to bake, the tem-perature of the yam rises. The rate, R (in degrees perminute), at which the temperature of the yam rises is gov-erned by Newton’s Law of Heating, which says that therate is proportional to the temperature difference betweenthe yam and the oven. If the oven is at 350◦F and the tem-perature of the yam is H◦F,
(a) Write a formula giving R as a function of H .(b) Sketch the graph of R against H .
37. For small changes in temperature, the formula for the ex-pansion of a metal rod under a change in temperature is:
l − l0 = al0(t− t0),
where l is the length of the object at temperature t, and l0is the length at temperature t0, and a is a constant whichdepends on the type of metal.
(a) Express l as a linear function of t. Find the slope andvertical intercept in terms of l0, t0, and a.
(b) A rod is 100 cm long at 60◦F and made of a metalwith a = 10−5. Write an equation giving the lengthof this rod at temperature t.
(c) What does the sign of the slope tell you about the ex-pansion of a metal under a change in temperature?
38. A body of mass m is falling downward with velocity v.Newton’s Second Law of Motion, F = ma, says that thenet downward force, F , on the body is proportional to itsdownward acceleration, a. The net force, F , consists ofthe force due to gravity, Fg , which acts downward, minusthe air resistance, Fr , which acts upward. The force dueto gravity is mg, where g is a constant. Assume the airresistance is proportional to the velocity of the body.
(a) Write an expression for the net force, F , as a func-tion of the velocity, v.
(b) Write a formula giving a as a function of v.(c) Sketch a against v.
39. When Galileo was formulating the laws of motion, heconsidered the motion of a body starting from rest andfalling under gravity. He originally thought that the ve-locity of such a falling body was proportional to the dis-tance it had fallen. What do the experimental data in Ta-ble 1.3 tell you about Galileo’s hypothesis? What alter-native hypothesis is suggested by the two sets of data inTable 1.3 and Table 1.4?
Table 1.3
Distance (ft) 0 1 2 3 4Velocity (ft/sec) 0 8 11.3 13.9 16
Table 1.4
Time (sec) 0 1 2 3 4Velocity (ft/sec) 0 32 64 96 128
1.2 EXPONENTIAL FUNCTIONS
Population GrowthThe population of Mexico in the early 1980s is given in Table 1.5. To see how the population isgrowing, we look at the increase in population in the third column. If the population had beengrowing linearly, all the numbers in the third column would be the same.
1Adapted from “Average Weight of Americans by Height and Age”, The World Almanac (New Jersey: Funk and Wag-nalls, 1992), p. 956.

10 Chapter One A LIBRARY OF FUNCTIONS
Table 1.5 Population of Mexico (estimated),1980–1986
Year Population Change in
(millions) population (millions)
1980 67.38
1981 69.131.75
1982 70.931.80
1983 72.771.84
1984 74.661.89
1985 76.601.94
1986 78.591.99
−10 0 10 20 30 40 50
100
200
t (years since 1980)
P (population in millions)
P = 67.38(1.026)t
Figure 1.12: Population of Mexico (estimated): Exponentialgrowth
Suppose we divide each year’s population by the previous year’s population. For example,
Population in 1981Population in 1980
=69.13 million67.38 million
= 1.026
Population in 1982Population in 1981
=70.93 million69.13 million
= 1.026.
The fact that both calculations give 1.026 shows the population grew by about 2.6% between 1980and 1981 and between 1981 and 1982. Similar calculations for other years show that the popula-tion grew by a factor of about 1.026, or 2.6%, every year. Whenever we have a constant growthfactor (here 1.026), we have exponential growth. The population t years after 1980 is given by theexponential function
P = 67.38(1.026)t.
If we assume that the formula holds for 50 years, the population graph has the shape shown inFigure 1.12. Since the population is growing faster and faster as time goes on, the graph is bendingupward; we say it is concave up. Even exponential functions which climb slowly at first, such asthis one, eventually climb extremely quickly.
To recognize that a table of t and P values comes from an exponential function P = P0at,
look for ratios of P values that are constant for equally spaced t values.
ConcavityWe have used the term concave up2 to describe the graph in Figure 1.12. In words:
The graph of a function is concave up if it bends upward as we move left to right; it isconcave down if it bends downward. (See Figure 1.13.) A line is neither concave up norconcave down.
Concaveup Concave
down
Figure 1.13: Concavity of a graph2In Chapter 2 we consider concavity in more depth.

1.2 EXPONENTIAL FUNCTIONS 11
Elimination of a Drug from the BodyNow we look at a quantity which is decreasing exponentially instead of increasing. When a patient isgiven medication, the drug enters the bloodstream. As the drug passes through the liver and kidneys,it is metabolized and eliminated at a rate that depends on the particular drug. For the antibioticampicillin, approximately 40% of the drug is eliminated every hour. A typical dose of ampicillinis 250 mg. Suppose Q = f(t), where Q is the quantity of ampicillin, in mg, in the bloodstream attime t hours since the drug was given. At t = 0, we have Q = 250. Since every hour the amountremaining is 60% of the previous amount, we have
f(0) = 250
f(1) = 250(0.6)
f(2) = (250(0.6))(0.6) = 250(0.6)2,
and after t hours,Q = f(t) = 250(0.6)t.
This is an exponential decay function. Some values of the function are in Table 1.6; its graph is inFigure 1.14.
Notice the way the function in Figure 1.14 is decreasing. Each hour a smaller quantity of thedrug is removed than in the previous hour. This is because as time passes, there is less of the drugin the body to be removed. Compare this to the exponential growth in Figure 1.12, where each stepupward is larger than the previous one. Notice, however, that both graphs are concave up.
Table 1.6
t (hours) Q (mg)
0 250
1 150
2 90
3 54
4 32.4
5 19.41 2 3 4 5
50
100
150
200
250
t (hours)
Q (mg)
Figure 1.14: Drug elimination: Exponential decay
The General Exponential Function
We say P is an exponential function of t with base a if
P = P0at,
where P0 is the initial quantity (when t = 0) and a is the factor by which P changes when tincreases by 1.If a > 1, we have exponential growth; if 0 < a < 1, we have exponential decay.
Provided a > 0, the largest possible domain for the exponential function is all real numbers. Thereason we do not want a ≤ 0 is that, for example, we cannot define a1/2 if a < 0. Also, we do notusually have a = 1, since P = P01t = P0 is then a constant function.
The value of a is closely related to the percent growth (or decay) rate. For example, if a = 1.03,then P is growing at 3%; if a = 0.94, then P is decaying at 6%.
Example 1 Suppose that Q = f(t) is an exponential function of t. If f(20) = 88.2 and f(23) = 91.4:(a) Find the base. (b) Find the growth rate. (c) Evaluate f(25).
Solution (a) LetQ = Q0a
t.

12 Chapter One A LIBRARY OF FUNCTIONS
Substituting t = 20, Q = 88.2 and t = 23, Q = 91.4 gives two equations for Q0 and a:
88.2 = Q0a20 and 91.4 = Q0a
23.
Dividing the two equations enables us to eliminate Q0:
91.4
88.2=Q0a
23
Q0a20= a3.
Solving for the base, a, gives
a =
(91.4
88.2
)1/3
= 1.012.
(b) Since a = 1.012, the growth rate is 0.012 = 1.2%.(c) We want to evaluate f(25) = Q0a
25 = Q0(1.012)25. First we find Q0 from the equation
88.2 = Q0(1.012)20.
Solving gives Q0 = 69.5. Thus,
f(25) = 69.5(1.012)25 = 93.6.
Half-Life and Doubling TimeRadioactive substances, such as uranium, decay exponentially. A certain percentage of the massdisintegrates in a given unit of time; the time it takes for half the mass to decay is called the half-lifeof the substance.
A well-known radioactive substance is carbon-14, which is used to date organic objects. Whena piece of wood or bone was part of a living organism, it accumulated small amounts of radioactivecarbon-14. Once the organism dies, it no longer picks up carbon-14. Using the half-life of carbon-14(about 5730 years), we can estimate the age of the object. We use the following definitions:
The half-life of an exponentially decaying quantity is the time required for the quantity to bereduced by a factor of one half.The doubling time of an exponentially increasing quantity is the time required for the quan-tity to double.
The Family of Exponential FunctionsThe formula P = P0a
t gives a family of exponential functions with positive parameters P0 (theinitial quantity) and a (the base, or growth/decay factor). The base tells us whether the function isincreasing (a > 1) or decreasing (0 < a < 1). Since a is the factor by which P changes whent is increased by 1, large values of a mean fast growth; values of a near 0 mean fast decay. (SeeFigures 1.15 and 1.16.) All members of the family P = P0a
t are concave up.
1 2 3 4 5 6 7
10
20
30
40
t
P
10t5t 3t 2t
(1.5)t
Figure 1.15: Exponential growth: P = at, for a > 1
2 4 6 8 10 120
0.2
0.4
0.6
0.8
1
t
P
(0.1)t(0.5)t (0.8)t
(0.9)t
(0.95)t
Figure 1.16: Exponential decay: P = at, for 0 < a < 1

1.2 EXPONENTIAL FUNCTIONS 13
Example 2 Figure 1.17 is the graph of three exponential functions. What can you say about the values of thesix constants, a, b, c, d, p, q?
y = p · qx
y = c · dx
y = a · bxx
y
Figure 1.17
Solution All the constants are positive. Since a, c, p represent y-intercepts, we see that a = c because thesegraphs intersect on the y-axis. In addition, a = c < p, since y = p · qx crosses the y-axis above theother two.
Since y = a · bx is decreasing, we have 0 < b < 1. The other functions are increasing, so 1 < dand 1 < q.
Exponential Functions with Base eThe most frequently used base for an exponential function is the famous number e = 2.71828 . . . .This base is used so often that you will find an ex button on most scientific calculators. At firstglance, this is all somewhat mysterious. Why is it convenient to use the base 2.71828 . . .? The fullanswer to that question must wait until Chapter 3, where we show that many calculus formulas comeout neatly when e is used as the base. We often use the following result:
Any exponential growth function can be written, for some a > 1 and k > 0, in the form
P = P0at or P = P0e
kt
and any exponential decay function can be written, for some 0 < a < 1 and k > 0, as
Q = Q0at or Q = Q0e
−kt,
where P0 and Q0 are the initial quantities.
We say that P and Q are growing or decaying at a continuous3 rate of k. (For exam-ple, k = 0.02 corresponds to a continuous rate of 2%.)
Example 3 Convert the functions P = e0.5t and Q = 5e−0.2t into the form y = y0at. Use the results to explain
the shape of the graphs in Figures 1.18 and 1.19.
1 2 3 4 5 6 7
10
20
30
t
P
1
P = e0.5t
Figure 1.18: An exponential growth function
2 4 6 8 10
1
2
3
4
5
t
Q
Q = 5e−0.2t
Figure 1.19: An exponential decay function3The reason that k is called the continuous rate is explored in detail in Chapter 11.

14 Chapter One A LIBRARY OF FUNCTIONS
Solution We haveP = e0.5t = (e0.5)t = (1.65)t.
Thus, P is an exponential growth function with P0 = 1 and a = 1.65. The function is increasingand its graph is concave up, similar to those in Figure 1.15. Also,
Q = 5e−0.2t = 5(e−0.2)t = 5(0.819)t,
so Q is an exponential decay function with Q0 = 5 and a = 0.819. The function is decreasing andits graph is concave up, similar to those in Figure 1.16.
Example 4 The quantity, Q, of a drug in a patient’s body at time t is represented for positive constants S andk by the function Q = S(1 − e−kt). For t ≥ 0, describe how Q changes with time. What does Srepresent? How does the graph of Q relate to the exponential decay graph in Figure 1.19?
Solution The graph of Q is shown in Figure 1.20. Initially none of the drug is present, but the quantityincreases with time. Since the graph is concave down, the quantity increases at a decreasing rate.This is realistic because as the quantity of the drug in the body increases, so does the rate at whichthe body excretes the drug. Thus, we expect the quantity to level off. Figure 1.20 shows that S is thesaturation level.
1 2 3 4 5t (time in hours)
S
Q (quantity of drug) Saturation level
Figure 1.20: Buildup of the quantity of a drug in body
The graph in Figure 1.20 looks like an exponential decay function, but upside down. SinceQ = S − Se−kt, we have
S −Q = Se−kt.
Thus, the difference between the saturation level, S, and the quantity in the blood, Q, is decayingexponentially. The graph in Figure 1.20 can be obtained from the graph in Figure 1.19 by reflectionabout the t-axis and moving up by a distance S.
Exercises and Problems for Section 1.2Exercises
The functions in Exercises 1–4 represent exponential growthor decay. What is the initial quantity? What is the growth rate?State if the growth rate is continuous.
1. P = 5(1.07)t 2. P = 7.7(0.92)t
3. P = 3.2e0.03t 4. P = 15e−0.06t
5. A town has a population of 1000 people at time t = 0.In each of the following cases, write a formula for thepopulation, P , of the town as a function of year t.
(a) The population increases by 50 people a year.(b) The population increases by 5% a year.
6. An air-freshener starts with 30 grams and evaporates. Ineach of the following cases, write a formula for the quan-tity, Q grams, of air-freshener remaining t days after thestart and sketch a graph of the function. The decrease is:
(a) 2 grams a day (b) 12% a day

1.2 EXPONENTIAL FUNCTIONS 15
In Exercises 7–10, decide whether the graph is concave up,concave down, or neither.
7.
x
8.
x
9.
x
10.x
11. Identify the x-intervals on which the function graphed inFigure 1.21 is:
(a) Increasing and concave up(b) Increasing and concave down(c) Decreasing and concave up(d) Decreasing and concave down
A
B
C
D
E
FG
H
I
x
Figure 1.21
Problems
12. In 1999, the world’s population reached 6 billion and wasincreasing at a rate of 1.3% per year. Assume that thisgrowth rate remains constant. (In fact, the growth ratehas decreased since 1987.)
(a) Write a formula for the world population (in bil-lions) as a function of the number of years since1999.
(b) Use your formula to estimate the population of theworld in the year 2020.
(c) Sketch a graph of world population as a function ofyears since 1999. Use the graph to estimate the dou-bling time of the population of the world.
13. A photocopy machine can reduce copies to 80% of theiroriginal size. By copying an already reduced copy, fur-ther reductions can be made.
(a) If a page is reduced to 80%, what percent enlarge-ment is needed to return it to its original size?
(b) Estimate the number of times in succession that apage must be copied to make the final copy less than15% of the size of the original.
14. (a) Niki invested $10,000 in the stock market. The in-vestment was a loser, declining in value 10% peryear each year for 10 years. How much was the in-vestment worth after 10 years?
(b) After 10 years, the stock began to gain value at 10%per year. After how long will the investment regainits initial value ($10,000)?
15. When a new product is advertised, more and more peopletry it. However, the rate at which new people try it slowsas time goes on.
(a) Graph the total number of people who have triedsuch a product against time.
(b) What do you know about the concavity of the graph?
16. Sketch reasonable graphs for the following. Pay particu-lar attention to the concavity of the graphs.
(a) The total revenue generated by a car rental business,plotted against the amount spent on advertising.
(b) The temperature of a cup of hot coffee standing in aroom, plotted as a function of time.
Give a possible formula for the functions in Problems 17–20.
17.
3
y
x
(2, 12)
18. y
x
(−1, 8) (1, 2)
19. y
x(1, 6)
(2, 18)
20.4
y
(1, 2)
x
In Problems 21–22, let f(t) = Q0at = Q0(1 + r)t.
(a) Find the base, a.(b) Find the percentage growth rate, r.
21. f(5) = 75.94 and f(7) = 170.86
22. f(0.02) = 25.02 and f(0.05) = 25.06
Write the functions in Problems 23–26 in the form P = P0at.
Which represent exponential growth and which represent ex-ponential decay?
23. P = 15e0.25t 24. P = 2e−0.5t
25. P = P0e0.2t 26. P = 7e−πt

16 Chapter One A LIBRARY OF FUNCTIONS
27. (a) A population, P , grows at a continuous rate of 2%a year and starts at 1 million. Write P in the formP = P0e
kt, with P0, k constants.(b) Plot the population in part (a) against time.
28. When the Olympic Games were held outside MexicoCity in 1968, there was much discussion about the effectthe high altitude (7340 feet) would have on the athletes.Assuming air pressure decays exponentially by 0.4% ev-ery 100 feet, by what percentage is air pressure reducedby moving from sea level to Mexico City?
29. During 1988, Nicaragua’s inflation rate averaged 1.3% aday. This means that, on average, prices went up by 1.3%from one day to the next.
(a) By what percentage did Nicaraguan prices increasein June of 1988?
(b) What was Nicaragua’s annual inflation rate during1988?
30. (a) The half-life of radium-226 is 1620 years. Write aformula for the quantity, Q, of radium left after tyears, if the initial quantity is Q0.
(b) What percentage of the original amount of radium isleft after 500 years?
31. In the early 1960s, radioactive strontium-90 was re-leased during atmospheric testing of nuclear weaponsand got into the bones of people alive at the time. Ifthe half-life of strontium-90 is 29 years, what fraction ofthe strontium-90 absorbed in 1960 remained in people’sbones in 1990?
32. A certain region has a population of 10,000,000 and anannual growth rate of 2%. Estimate the doubling time byguessing and checking.
33. Estimate graphically the doubling time of the exponen-tially growing population shown in Figure 1.22. Checkthat the doubling time is independent of where you starton the graph. Show algebraically that if P = P0a
t dou-bles between time t and time t + d, then d is the samenumber for any t.
1 2 3 4 5 6 7 8 9
20,000
40,000
60,000
80,000
time (years)
population
Figure 1.22
34. Aircrafts require longer takeoff distances, called takeoffrolls, at high altitude airports because of diminished airdensity. The table shows how the takeoff roll for a certainlight airplane depends on the airport elevation. (Takeoff
rolls are also strongly influenced by air temperature; thedata shown assume a temperature of 0◦ C.) Determine aformula for this particular aircraft that gives the takeoffroll as an exponential function of airport elevation.
Elevation (ft) Sea level 1000 2000 3000 4000
Takeoff roll (ft) 670 734 805 882 967
35. Each of the functions g, h, k in Table 1.7 is increasing,but each increases in a different way. Which of the graphsin Figure 1.23 best fits each function?
(a) (b)
(c)
Figure 1.23
Table 1.7
t g(t) h(t) k(t)
1 23 10 2.22 24 20 2.53 26 29 2.84 29 37 3.15 33 44 3.46 38 50 3.7
36. (a) Which (if any) of the functions in the following tablecould be linear? Find formulas for those functions.
(b) Which (if any) of these functions could be exponen-tial? Find formulas for those functions.
x f(x) g(x) h(x)
−2 12 16 37
−1 17 24 34
0 20 36 31
1 21 54 28
2 18 81 25
37. Match the functions h(s), f(s), and g(s), whose valuesare in Table 1.8, with the formulas
y = a(1.1)s , y = b(1.05)s , y = c(1.03)s,
assuming a, b, and c are constants. Note that the functionvalues have been rounded to two decimal places.
Table 1.8
s h(s) s f(s) s g(s)
2 1.06 1 2.20 3 3.47
3 1.09 2 2.42 4 3.65
4 1.13 3 2.66 5 3.83
5 1.16 4 2.93 6 4.02
6 1.19 5 3.22 7 4.22

1.3 NEW FUNCTIONS FROM OLD 17
38. Table 1.9 shows some values of a linear function f andan exponential function g. Find exact values (not decimalapproximations) for each of the missing entries.
Table 1.9
x 0 1 2 3 4f(x) 10 ? 20 ? ?g(x) 10 ? 20 ? ?
39. The median price, P , of a home rose from $50,000 in1970 to $100,000 in 1990. Let t be the number of yearssince 1970.
(a) Assume the increase in housing prices has been lin-ear. Give an equation for the line representing price,P , in terms of t. Use this equation to complete col-umn (a) of Table 1.10. Use units of $1000.
(b) If instead the housing prices have been rising expo-nentially, find an equation of the form P = P0a
t
to represent housing prices. Complete column (b) ofTable 1.10.
(c) On the same set of axes, sketch the functions repre-sented in column (a) and column (b) of Table 1.10.
(d) Which model for the price growth do you think ismore realistic?
Table 1.10
t
(a) Linear growthprice in
$1000 units
(b) Exponential growthprice in
$1000 units
0 50 501020 100 1003040
1.3 NEW FUNCTIONS FROM OLD
Shifts and StretchesThe graph of a constant multiple of a given function is easy to visualize: each y-value is stretchedor shrunk by that multiple. For example, consider the function f(x) and its multiples y = 3f(x)and y = −2f(x). Their graphs are shown in Figure 1.24. The factor 3 in the function y = 3f(x)stretches each f(x) value by multiplying it by 3; the factor−2 in the function y = −2f(x) stretchesf(x) by multiplying by 2 and reflects it about the x-axis. You can think of the multiples of a givenfunction as a family of functions.
3
−3
y
x
y = 3f(x)
y = −2f(x)
y = f(x)
Figure 1.24: Multiples of the function f(x)
4
y
x
y = x2 + 4
y = x2
2x
y
y = (x− 2)2
y = x2
Figure 1.25: Graphs of y = x2 with y = x2 + 4 andy = (x− 2)2
It is also easy to create families of functions by shifting graphs. For example, y− 4 = x2 is thesame as y = x2 + 4, which is the graph of y = x2 shifted up by 4. Similarly, y = (x − 2)2 is thegraph of y = x2 shifted right by 2. (See Figure 1.25.)
• Multiplying a function by a constant, c, stretches the graph vertically (if c > 1) or shrinksthe graph vertically (if 0 < c < 1). A negative sign (if c < 0) reflects the graph about thex-axis, in addition to shrinking or stretching.
• Replacing y by (y − k) moves a graph up by k (down if k is negative).• Replacing x by (x− h) moves a graph to the right by h (to the left if h is negative).

18 Chapter One A LIBRARY OF FUNCTIONS
Composite FunctionsIf oil is spilled from a tanker, the area of the oil slick grows with time. Suppose that the oil slick isalways a perfect circle. Then the area, A, of the oil slick is a function of its radius, r:
A = f(r) = πr2.
The radius is also a function of time, because the radius increases as more oil spills. Thus, the area,being a function of the radius, is also a function of time. If, for example, the radius is given by
r = g(t) = 1 + t,
then the area is given as a function of time by substitution:
A = πr2 = π(1 + t)2.
We are thinking of A as a composite function or a “function of a function,” which is written
A = f(g(t))︸ ︷︷ ︸Composite function;f is outside function,g is inside function
= π(g(t))2 = π(1 + t)2.
To calculate A using the formula π(1 + t)2, the first step is to find 1 + t, and the second step is tosquare and multiply by π. The first step corresponds to the inside function g(t) = 1 + t, and thesecond step corresponds to the outside function f(r) = πr2.
Example 1 If f(x) = x2 and g(x) = x+ 1, find each of the following:(a) f(g(2)) (b) g(f(2)) (c) f(g(x)) (d) g(f(x))
Solution (a) Since g(2) = 3, we have f(g(2)) = f(3) = 9.(b) Since f(2) = 4, we have g(f(2)) = g(4) = 5. Notice that f(g(2)) 6= g(f(2)).(c) f(g(x)) = f(x+ 1) = (x+ 1)2.(d) g(f(x)) = g(x2) = x2 + 1. Again, notice that f(g(x)) 6= g(f(x)).
Example 2 Express each of the following functions as a composition:
(a) h(t) = (1 + t3)27 (b) k(y) = e−y2
(c) l(y) = −(ey)2
Solution In each case think about how you would calculate a value of the function. The first stage of thecalculation gives you the inside function, and the second stage gives you the outside function.(a) For (1 + t3)27, the first stage is cubing and adding 1, so an inside function is g(t) = 1 + t3. The
second stage is taking the 27th power, so an outside function is f(y) = y27. Then
f(g(t)) = f(1 + t3) = (1 + t3)27.
In fact, there are lots of different answers: g(t) = t3 and f(y) = (1+y)27 is another possibility.(b) To calculate e−y
2
we square y, take its negative, and then take e to that power. So if g(y) = −y2
and f(z) = ez, then we havef(g(y)) = e−y
2
.
(c) To calculate −(ey)2, we find ey , square it, and take the negative. Using the same definitions off and g as in part (b), the composition is
g(f(y)) = −(ey)2.
Since parts (b) and (c) give different answers, we see the order in which functions are composedis important.

1.3 NEW FUNCTIONS FROM OLD 19
Odd and Even Functions: SymmetryThere is a certain symmetry apparent in the graphs of f(x) = x2 and g(x) = x3 in Figure 1.26. Foreach point (x, x2) on the graph of f , the point (−x, x2) is also on the graph; for each point (x, x3)on the graph of g, the point (−x,−x3) is also on the graph. The graph of f(x) = x2 is symmetricabout the y-axis, whereas the graph of g(x) = x3 is symmetric about the origin. The graph of anypolynomial involving only even powers of x has symmetry about the y-axis, while polynomialswith only odd powers of x are symmetric about the origin. Consequently, any functions with thesesymmetry properties are called even and odd, respectively.
−x x
f(x) = x2
x
Evenfunction
(−x, x2) (x, x2)−x
x
g(x) = x3
x
Oddfunction
(−x,−x3)
(x, x3)
Figure 1.26: Symmetry of even and odd functions
For any function f ,f is an even function if f(−x) = f(x) for all x.f is an odd function if f(−x) = −f(x) for all x.
For example, g(x) = ex2
is even and h(x) = x1/3 is odd. However, many functions do nothave any symmetry and are neither even nor odd.
Inverse FunctionsOn August 18, 1989, the runner Arturo Barrios of Mexico set a world record for the 10,000-meterrace. His times, in seconds, at 2000-meter intervals are recorded in Table 1.11, where t = f(d) isthe number of seconds Barrios took to complete the first d meters of the race. For example, Barriosran the first 4000 meters in 650.10 seconds, so f(4000) = 650.10. The function f was useful toathletes planning to compete with Barrios.
Let us now change our point of view and ask for distances rather than times. If we ask how farBarrios ran during the first 650.10 seconds of his race, the answer is clearly 4000 meters. Goingbackward in this way from numbers of seconds to numbers of meters gives f−1, the inverse func-tion4 of f . We write f−1(650.10) = 4000. Thus, f−1(t) is the number of meters that Barrios randuring the first t seconds of his race. See Table 1.12 which contains values of f−1.
The independent variable for f is the dependent variable for f−1, and vice versa. The domainsand ranges of f and f−1 are also interchanged. The domain of f is all distances d such that 0 ≤d ≤ 10000, which is the range of f−1. The range of f is all times t, such that 0 ≤ t ≤ 1628.23,which is the domain of f−1.
Table 1.11 Barrios’s running time
d (meters) t = f(d) (seconds)
0 0.00
2000 325.90
4000 650.10
6000 975.50
8000 1307.00
10000 1628.23
Table 1.12 Distance run by Barrios
t (seconds) d = f−1(t) (meters)
0.00 0
325.90 2000
650.10 4000
975.50 6000
1307.00 8000
1628.23 10000
4The notation f−1 represents the inverse function, which is not the same as the reciprocal, 1/f .

20 Chapter One A LIBRARY OF FUNCTIONS
Which Functions Have Inverses?
If a function has an inverse, we say it is invertible. Let’s look at a function which is not invertible.Consider the flight of the Mercury spacecraft Freedom 7, which carried Alan Shepard, Jr. into spacein May 1961. Shepard was the first American to journey into space. After launch, his spacecraft roseto an altitude of 116 miles, and then came down into the sea. The function f(t) giving the altitudein miles t minutes after lift-off does not have an inverse. To see why not, try to decide on a value forf−1(100), which should be the time when the altitude of the spacecraft was 100 miles. However,there are two such times, one when the spacecraft was ascending and one when it was descending.(See Figure 1.27.)
The reason the altitude function does not have an inverse is that the altitude has the same valuefor two different times. The reason the Barrios time function did have an inverse is that each runningtime, t, corresponds to a unique distance, d.
t1 t2
100
116
t (min)
d (miles)
f(t)
Figure 1.27: Two times, t1 and t2, at whichaltitude of spacecraft is 100 miles
y
f(x)
f−1(y)x
Originalfunction
Inverse functiony = f(x)
-
?
6�
Figure 1.28: A function which has aninverse
Figure 1.28 suggests when an inverse exists. The original function, f , takes us from an x-valueto a y-value, as shown in Figure 1.28. Since having an inverse means there is a function going froma y-value to an x-value, the crucial question is whether we can get back. In other words, does eachy-value correspond to a unique x-value? If so, there’s an inverse; if not, there is not. This principlemay be stated geometrically, as follows:
A function has an inverse if (and only if) its graph intersects any horizontal line at most once.
For example, the function f(x) = x2 does not have an inverse because many horizontal linesintersect the parabola twice.
Definition of an Inverse Function
If the function f is invertible, its inverse is defined as follows:
f−1(y) = x means y = f(x).
Formulas for Inverse Functions
If a function is defined by a formula, it is sometimes possible to find a formula for the inversefunction. In Section 1.1, we looked at the snow tree cricket, whose chirp rate, C, in chirps perminute, is approximated at the temperature, T , in degrees Fahrenheit, by the formula
C = f(T ) = 4T − 160.
So far we have used this formula to predict the chirp rate from the temperature. But it is also possibleto use this formula backward to calculate the temperature from the chirp rate.

1.3 NEW FUNCTIONS FROM OLD 21
Example 3 Find the formula for the function giving temperature in terms of the number of cricket chirps perminute; that is, find the inverse function f−1 such that
T = f−1(C).
Solution Since C is an increasing function, f is invertible. We know C = 4T − 160. We solve for T , giving
T =C
4+ 40,
sof−1(C) =
C
4+ 40.
Graphs of Inverse Functions
The function f(x) = x3 is increasing everywhere and so has an inverse. To find the inverse, wesolve
y = x3
for x, givingx = y1/3.
The inverse function isf−1(y) = y1/3
or, if we want to call the independent variable x,
f−1(x) = x1/3.
The graphs of y = x3 and y = x1/3 are shown in Figure 1.29. Notice that these graphs are thereflections of one another about the line y = x. For example, (8, 2) is on the graph of y = x1/3
because 2 = 81/3, and (2, 8) is on the graph of y = x3 because 8 = 23. The points (8, 2) and (2, 8)are reflections of one another about the line y = x. In general, if the x- and y-axes have the samescales:
The graph of f−1 is the reflection of the graph of f about the line y = x.
−2
2 4 6 8−2
2
4
6
8
x
yy = x3 y = x
y = x1/3
x3
x1/3
Figure 1.29: Graphs of inverse functions, y = x3 and y = x1/3, are reflections about the line y = x
Exercises and Problems for Section 1.3Exercises
For the functions f and g in Exercises 1–4, find
(a) f(g(1)) (b) g(f(1)) (c) f(g(x))(d) g(f(x)) (e) f(t)g(t)
1. f(x) = x2, g(x) = x+ 1
2. f(x) =√x+ 4, g(x) = x2
3. f(x) = ex, g(x) = x2
4. f(x) = 1/x, g(x) = 3x+ 4

22 Chapter One A LIBRARY OF FUNCTIONS
In Exercises 5–8, use Figure 1.30 to graph the functions.
−3
5−1
2m(t)
t
Figure 1.30
5. n(t) = m(t) + 2 6. p(t) = m(t− 1)
7. k(t) = m(t+ 1.5)
8. w(t) = m(t− 0.5)− 2.5
In Exercises 9–13, use Figure 1.31 to graph the function.
−4 −2 2
5
10
f(x)
x
Figure 1.31
9. f(−x) 10. f(x) + 5
11. f(x+ 5) 12. 5f(x)
13. f(5x)
14. For g(x) = x2 + 2x+ 3, find and simplify:
(a) g(2 + h) (b) g(2)
(c) g(2 + h)− g(2)
15. If f(x) = x2 + 1, find and simplify:
(a) f(t+ 1) (b) f(t2 + 1) (c) f(2)
(d) 2f(t) (e) [f(t)]2 + 1
16. For f(n) = 3n2−2 and g(n) = n+1, find and simplify:
(a) f(n) + g(n)(b) f(n)g(n)(c) The domain of f(n)/g(n)(d) f(g(n))(e) g(f(n))
Simplify the quantities in Exercises 17–20 using m(z) = z2.
17. m(z + 1)−m(z) 18. m(z + h)−m(z)
19. m(z)−m(z − h) 20. m(z+h)−m(z−h)
21. Let p be the price of an item and q be the number of itemssold at that price, where q = f(p). What do the followingquantities mean in terms of prices and quantities sold?
(a) f(25) (b) f−1(30)
22. Let C = f(A) be the cost, in dollars, of building a storeof area A square feet. In terms of cost and square feet,what do the following quantities represent?
(a) f(10,000) (b) f−1(20,000)
23. Let f(x) be the temperature (◦F) when the column ofmercury in a particular thermometer is x inches long.What is the meaning of f−1(75) in practical terms?
24. Let m = f(A) be the minimum annual gross income,in thousands of dollars, needed to obtain a 30-year homemortgage loan ofA thousand dollars at an interest rate of9%. What do the following quantities represent in termsof the income needed for a loan?
(a) f(100) (b) f−1(75)
For Exercises 25–26, decide if the function y = f(x) is in-vertible.
25.
f
y
x
26.
x
y
f
27. (a) Use Figure 1.32 to estimate f−1(2).(b) Sketch a graph of f−1 on the same axes.
−4 4
−4
4
f(x)
x
y
Figure 1.32
Find possible formulas for the graphs in Exercises 28–29 us-ing shifts of x2 or x3.
28.
x
y
(−1, 3)
29.
x
y
(2,−1)
Are the functions in Exercises 30–37 even, odd, or neither?
30. f(x) = x6 + x3 + 1 31. f(x) = x3 + x2 + x
32. f(x) = x4 − x2 + 3 33. f(x) = x3 + 1
34. f(x) = 2x 35. f(x) = ex2−1
36. f(x) = x(x2 − 1) 37. f(x) = ex − x

1.4 LOGARITHMIC FUNCTIONS 23
Problems
38. (a) Write an equation for a graph obtained by verticallystretching the graph of y = x2 by a factor of 2, fol-lowed by a vertical upward shift of 1 unit. Sketch it.
(b) What is the equation if the order of the transfor-mations (stretching and shifting) in part (a) is inter-changed?
(c) Are the two graphs the same? Explain the effect ofreversing the order of transformations.
For Problems 39–42, decide if the function f is invertible.
39. f(t) is the number of customers in Macy’s departmentstore at t minutes past noon on December 18, 2000.
40. f(n) is the number of students in your calculus classwhose birthday is on the nth day of the year.
41. f(x) is the volume in liters of x kg of water at 4◦C.42. f(w) is the cost of mailing a letter weighing w grams.
For Problems 43–48, use the graphs in Figure 1.33.
−3 3
−3
3
x
f(x)
−3 3
−3
3
x
g(x)
Figure 1.33
43. Estimate f(g(1)). 44. Estimate g(f(2)).
45. Estimate f(f(1)). 46. Graph f(g(x)).
47. Graph g(f(x)). 48. Graph f(f(x)).
For Problems 49–50, determine functions f and g such thath(x) = f(g(x)). [Note: There is more than one correct an-swer. Do not choose f(x) = x or g(x) = x.]
49. h(x) = (x+ 1)3 50. h(x) = x3 + 1
51. A tree of height y meters has, on average, B branches,where B = y− 1. Each branch has, on average, n leaveswhere n = 2B2 −B. Find the average number of leavesof a tree as a function of height.
52. The cost of producing q articles is given by the functionC = f(q) = 100 + 2q.
(a) Find a formula for the inverse function.(b) Explain in practical terms what the inverse function
tells you.
53. A kilogram weighs about 2.2 pounds.
(a) Write a formula for the function, f , which gives anobject’s mass in kilograms, k, as a function of itsweight in pounds, p.
(b) Find a formula for the inverse function of f . Whatdoes this inverse function tell you, in practicalterms?
54. Complete the following table with values for the func-tions f , g, and h, given that:
(a) f is an even function.(b) g is an odd function.(c) h is the composition h(x) = g(f(x)).
x f(x) g(x) h(x)
−3 0 0
−2 2 2
−1 2 20 0 0123
1.4 LOGARITHMIC FUNCTIONS
In Section 1.2, we approximated the population of Mexico (in millions) by the function
P = f(t) = 67.38(1.026)t,
where t is the number of years since 1980. Now suppose that instead of calculating the population attime t, we ask when the population will reach 200 million. We want to find the value of t for which
200 = f(t) = 67.38(1.026)t.
We use logarithms to solve for a variable in an exponent.

24 Chapter One A LIBRARY OF FUNCTIONS
Logarithms to Base 10 and to Base eWe define the logarithm function, log10 x, to be the inverse of the exponential function, 10x, asfollows:
The logarithm to base 10 of x, written log10 x, is the power of 10 we need to get x. In otherwords,
log10 x = c means 10c = x.
We often write log x in place of log10 x.
The other frequently used base is e. The logarithm to base e is called the natural logarithm ofx, written lnx and defined to be the inverse function of ex, as follows:
The natural logarithm of x, written lnx, is the power of e needed to get x. In other words,
lnx = c means ec = x.
Values of log x are in Table 1.13. Because no power of 10 gives 0, log 0 is undefined. The graphof y = log x is shown in Figure 1.34. The domain of y = log x is positive real numbers; the range isall real numbers. In contrast, the inverse function y = 10x has domain all real numbers and range allpositive real numbers. The graph of y = log x has a vertical asymptote at x = 0, whereas y = 10x
has a horizontal asymptote at y = 0.One big difference between y = 10x and y = log x is that the exponential function grows
extremely quickly whereas the log function grows extremely slowly. However, log x does go toinfinity, albeit slowly, as x increases. Since y = log x and y = 10x are inverse functions, the graphsof the two functions are reflections of one another about the line y = x, provided the scales alongthe x- and y-axes are equal.
Table 1.13 Values for log x and 10x
x log x
0 undefined
1 0
2 0.3
3 0.5
4 0.6...
...
10 1
x 10x
0 1
1 10
2 100
3 103
4 104
......
10 1010
2 4 6 8 10
2
4
6
8
10
x
yy = 10x
y = log x
(1, 10)
(1, 0)
(10, 1)(0, 1) -
Exponential: grows quickly
Log: grows slowly
6
�
?
Figure 1.34: Graphs of log x and 10x
The graph of y = lnx in Figure 1.35 has roughly the same shape as the graph of y = log x. Thex-intercept is x = 1, since ln 1 = 0.The graph of y = lnx also climbs very slowly as x increases.
1 10
1
x
y
y = lnx
Figure 1.35: Graph of the natural logarithm

1.4 LOGARITHMIC FUNCTIONS 25
The following properties of logarithms may be deduced from the properties of exponents:
Properties of LogarithmsNote that log x and lnx are not defined when x is negative or 0.
1. log(AB) = logA+ logB
2. log
(A
B
)= logA− logB
3. log (Ap) = p logA
4. log (10x) = x
5. 10log x = x
1. ln (AB) = lnA+ lnB
2. ln
(A
B
)= lnA− lnB
3. ln (Ap) = p lnA
4. ln ex = x
5. eln x = x
In addition, log 1 = 0 because 100 = 1, and ln 1 = 0 because e0 = 1.
Solving Equations Using LogarithmsLogs are frequently useful when we have to solve for unknown exponents, as in the next examples.
Example 1 Find t such that 2t = 7.
Solution First, notice that we expect t to be between 2 and 3 (because 22 = 4 and 23 = 8). To calculate t, wetake logs to base 10. (Natural logs could also be used.)
log(2t) = log 7.
Then use the third property of logs, which says log(2t) = t log 2, and get:
t log 2 = log 7.
Using a calculator to find the logs gives
t =log 7
log 2≈ 2.81.
Example 2 Find when the population of Mexico reaches 200 million by solving 200 = 67.38(1.026)t.
Solution Dividing both sides of the equation by 67.38, we get200
67.38= (1.026)t.
Now take logs of both sides:
log
(200
67.38
)= log(1.026t).
Using the fact that log(At) = t logA, we get
log
(200
67.38
)= t log(1.026).
Solving this equation using a calculator to find the logs, we get
t =log(200/67.38)
log(1.026)≈ 42.4 years
which is between t = 42 and t = 43. This value of t corresponds to the year 2022.

26 Chapter One A LIBRARY OF FUNCTIONS
Example 3 The release of chlorofluorocarbons used in air conditioners and in household sprays (hair spray,shaving cream, etc.) destroys the ozone in the upper atmosphere. Currently, the amount of ozone,Q, is decaying exponentially at a continuous rate of 0.25% per year. What is the half-life of ozone?
Solution We want to find how long it takes for half the ozone to disappear. If Q0 is the initial quantity ofozone, then
Q = Q0e−0.0025t.
We want to find T , the value of t making Q = Q0/2, that is,
Q0e−0.0025T =
Q0
2.
Dividing by Q0 and then taking natural logs yields
ln(e−0.0025T
)= −0.0025T = ln
(1
2
)≈ −0.6931,
soT ≈ 277 years.
The half-life of ozone is about 277 years.
In Example 3 the decay rate was given. However, in many situations where we expect to findexponential growth or decay, the rate is not given. To find it, we must know the quantity at twodifferent times and then solve for the growth or decay rate, as in the next example.
Example 4 The population of Kenya was 19.5 million in 1984 and 21.2 million in 1986. Assuming it increasesexponentially, find a formula for the population of Kenya as a function of time.
Solution If we measure the population, P , in millions and time, t, in years since 1984, we can say
P = P0ekt = 19.5ekt,
where P0 = 19.5 is the initial value of P . We find k by using the fact that P = 21.2 when t = 2, so
21.2 = 19.5ek·2.
To find k, we divide both sides by 19.5, giving
21.2
19.5= 1.087 = e2k.
Now take natural logs of both sides:
ln(1.087) = ln(e2k).
Using a calculator and the fact that ln(e2k) = 2k, this becomes
0.0834 = 2k.
Sok ≈ 0.042,
and thereforeP = 19.5e0.042t.
Since k = 0.042 = 4.2%, the population of Kenya was growing at a continuous rate of 4.2% peryear.
In Example 4 we chose to use e for the base of the exponential function representing Kenya’spopulation, making clear that the continuous growth rate was 4.2%. If we had wanted to emphasizethe annual growth rate, we could have expressed the exponential function in the form P = P0a
t.

1.4 LOGARITHMIC FUNCTIONS 27
Example 5 Give a formula for the inverse of the following function (that is, solve for t in terms of P ):
P = f(t) = 67.38(1.026)t.
Solution We want a formula expressing t as a function of P . Take logs:
logP = log(67.38(1.026)t).
Since log(AB) = logA+ logB, we have
logP = log 67.38 + log((1.026)t).
Now use log(At) = t logA:
logP = log 67.38 + t log 1.026.
Solve for t in two steps, using a calculator at the final stage:
t log 1.026 = logP − log 67.38
t =logP
log 1.026− log 67.38
log 1.026≈ 89.7 logP − 164.0.
Thus,f−1(P ) = 89.7 logP − 164.0.
Note thatf−1(200) = 89.7(log 200)− 164.0 ≈ (89.7)(2.301)− 164.0 ≈ 42.4,
which agrees with the result of Example 2.
Exercises and Problems for Section 1.4Exercises
Simplify the expressions in Exercises 1–6 completely.
1. eln(1/2) 2. 10log(AB)
3. 5eln(A2) 4. ln(e2AB)
5. ln (1/e) + ln(AB) 6. 2 ln(eA)
+ 3 lnBe
For Exercises 7–17, solve for x using logs.
7. 3x = 11 8. 17x = 2
9. 20 = 50(1.04)x 10. 4 · 3x = 7 · 5x
11. 2x = ex+1 12. 50 = 600e−0.4x
13. 2e3x = 4e5x 14. 7x+2 = e17x
15. 10x+3 = 5e7−x 16. 2x− 1 = eln x2
17. 9x = 2ex2
For Exercises 18–23, solve for t. Assume a and b are positiveconstants and k is nonzero.
18. a = bt 19. P = P0 at
20. Q = Q0 ant 21. P0 a
t = Q0 bt
22. a = bet 23. P = P0 ekt
In Exercises 24–27, put the functions in the form P = P0ekt.
24. P = 15(1.5)t 25. P = 10(1.7)t
26. P = 174(0.9)t 27. P = 4(0.55)t
Find the inverse function in Exercises 28–30.
28. p(t) = (1.04)t 29. f(t) = 50e0.1t
30. f(t) = 1 + ln t

28 Chapter One A LIBRARY OF FUNCTIONS
Problems
31. Without a calculator or computer, match the functions ex,lnx, x2, and x1/2 to their graphs in Figure 1.36.
x
AB
CD
Figure 1.36
32. The population of a region is growing exponentially.There were 40,000,000 people in 1980 (t = 0) and56,000,000 in 1990. Find an expression for the popula-tion at any time t, in years. What population would youpredict for the year 2000? What is the doubling time?
33. What is the doubling time of prices which are increasingby 5% a year?
34. If the size of a bacteria colony doubles in 5 hours, howlong will it take for the number of bacteria to triple?
35. One hundred kilograms of a radioactive substance decayto 40 kg in 10 years. How much remains after 20 years?
36. Find the half-life of a radioactive substance that is re-duced by 30% in 20 hours.
37. The sales at Borders bookstores went from $78 million in1991 to $412 million in 1994. Find an exponential func-tion to model the sales as a function of years since 1991.What is the continuous percent growth rate, per year, ofsales?
38. Owing to an innovative rural public health program, in-fant mortality in Senegal, West Africa, is being reducedat a rate of 10% per year. How long will it take for infantmortality to be reduced by 50%?
39. Find the equation of the line l in Figure 1.37.
log 2x
lf(x) = 10x
Figure 1.37
40. At time t hours after taking the cough suppressant hy-drocodone bitartrate, the amount, A, in mg, remaining inthe body is given by A = 10(0.82)t.
(a) What was the initial amount taken?
(b) What percent of the drug leaves the body each hour?(c) How much of the drug is left in the body 6 hours
after the dose is administered?(d) How long is it until only 1 mg of the drug remains
in the body?
41. A cup of coffee contains 100 mg of caffeine, whichleaves the body at a continuous rate of 17% per hour.
(a) Write a formula for the amount,Amg, of caffeine inthe body t hours after drinking a cup of coffee.
(b) Graph the function from part (a). Use the graph toestimate the half-life of caffeine.
(c) Use logarithms to find the half-life of caffeine.
42. In 1980, there were about 170 million vehicles (cars andtrucks) and about 227 million people in the United States.The number of vehicles has been growing at 4% a year,while the population has been growing at 1% a year.When was there, on average, one vehicle per person?
43. The air in a factory is being filtered so that the quantityof a pollutant, P (in mg/liter), is decreasing according tothe function P = P0e
−kt, where t is time in hours. If10% of the pollution is removed in the first five hours:
(a) What percentage of the pollution is left after 10hours?
(b) How long is it before the pollution is reduced by50%?
(c) Plot a graph of pollution against time. Show the re-sults of your calculations on the graph.
(d) Explain why the quantity of pollutant might de-crease in this way.
44. Air pressure, P , decreases exponentially with the height,h, in meters above sea level:
P = P0e−0.00012h
where P0 is the air pressure at sea level.
(a) At the top of Mount McKinley, height 6198 meters(about 20,330 feet), what is the air pressure, as a per-cent of the pressure at sea level?
(b) The maximum cruising altitude of an ordinary com-mercial jet is around 12,000 meters (about 39,000feet). At that height, what is the air pressure, as apercent of the sea level value?
45. The half-life of radioactive strontium-90 is 29 years. In1960, radioactive strontium-90 was released into the at-mosphere during testing of nuclear weapons, and was ab-sorbed into people’s bones. How many years does it takeuntil only 10% of the original amount absorbed remains?
46. A picture supposedly painted by Vermeer (1632–1675)contains 99.5% of its carbon-14 (half-life 5730 years).From this information decide whether the picture is afake. Explain your reasoning.

1.5 TRIGONOMETRIC FUNCTIONS 29
1.5 TRIGONOMETRIC FUNCTIONS
Trigonometry originated as part of the study of triangles. The name tri-gon-o-metry means themeasurement of three-cornered figures, and the first definitions of the trigonometric functions werein terms of triangles. However, the trigonometric functions can also be defined using the unit circle,a definition that makes them periodic, or repeating. Many naturally occurring processes are alsoperiodic. The water level in a tidal basin, the blood pressure in a heart, an alternating current, andthe position of the air molecules transmitting a musical note all fluctuate regularly. Such phenomenacan be represented by trigonometric functions.
We use the three trigonometric functions found on a calculator: the sine, the cosine, and thetangent.
RadiansThere are two commonly used ways to represent the input of the trigonometric functions: radiansand degrees. The formulas of calculus, as you will see, are neater in radians than in degrees.
An angle of 1 radian is defined to be the angle at the center of a unit circle which cuts off anarc of length 1, measured counterclockwise. (See Figure 1.38(a).) A unit circle has radius 1.
An angle of 2 radians cuts off an arc of length 2 on a unit circle. A negative angle, such as−1/2radians, cuts off an arc of length 1/2, but measured clockwise. (See Figure 1.38(b).)
(a)
1 radian
Arc length = 11
}(b) Arc length = 2
− 12
radArc length = 1
2
12 radians
�
�
Figure 1.38: Radians defined using unit circle
It is useful to think of angles as rotations, since then we can make sense of angles larger than360◦; for example, an angle of 720◦ represents two complete rotations counterclockwise. Since onefull rotation of 360◦ cuts off an arc of length 2π, the circumference of the unit circle, it follows that
360◦ = 2π radians, so 180◦ = π radians.
In other words, 1 radian = 180◦/π, so one radian is about 60◦. The word radians is often dropped,so if an angle or rotation is referred to without units, it is understood to be in radians.
Radians are useful for computing the length of an arc in any circle. If the circle has radius r andthe arc cuts off an angle θ, as in Figure 1.39, then we have the following relation:
Arc length = s = rθ.s
r
θ
Figure 1.39: Arc length of a sector of a circle

30 Chapter One A LIBRARY OF FUNCTIONS
The Sine and Cosine FunctionsThe two basic trigonometric functions—the sine and cosine—are defined using a unit circle. InFigure 1.40, an angle of t radians is measured counterclockwise around the circle from the point(1, 0). If P has coordinates (x, y), we define
cos t = x and sin t = y.
We assume that the angles are always in radians unless specified otherwise.Since the equation of the unit circle is x2 +y2 = 1, we have the following fundamental identity
cos2 t+ sin2 t = 1.
As t increases and P moves around the circle, the values of sin t and cos t oscillate between 1 and−1, and eventually repeat as P moves through points where it has been before. If t is negative, theangle is measured clockwise around the circle.
Amplitude, Period, and Phase
The graphs of sine and cosine are shown in Figure 1.41. Notice that sine is an odd function, andcosine is even. The maximum and minimum values of sine and cosine are +1 and−1, because thoseare the maximum and minimum values of y and x on the unit circle. After the point P has movedaround the complete circle once, the values of cos t and sin t start to repeat; we say the functionsare periodic.
For any periodic function of time, the• Amplitude is half the distance between the maximum and minimum values (if it exists).• Period is the smallest time needed for the function to execute one complete cycle.
The amplitude of cos t and sin t is 1, and the period is 2π. Why 2π? Because that’s the value oft when the point P has gone exactly once around the circle. (Remember that 360◦ = 2π radians.)
6
?
y
-�x (1, 0)
(0, 1)P x = cos t
y = sin t
t
Figure 1.40: The definitions of sin tand cos t
−3π −2π −π π 2π 3π
−1
1sin t 6
?
Amplitude = 1
-� Period = 2π
cos t
t
Figure 1.41: Graphs of cos t and sin t
In Figure 1.41, we see that the sine and cosine graphs are exactly the same shape, only shiftedhorizontally. Since the cosine graph is the sine graph shifted π/2 to the left,
cos t = sin(t+ π/2).

1.5 TRIGONOMETRIC FUNCTIONS 31
Equivalently, the sine graph is the cosine graph shifted π/2 to the right, so
sin t = cos(t− π/2).
We say that the phase difference between sin t and cos t is π/2.Functions whose graphs are the shape of a sine or cosine curve are called sinusoidal functions.
To describe arbitrary amplitudes and periods of sinusoidal functions, we use functions of theform
f(t) = A sin(Bt) and g(t) = A cos(Bt),
where |A| is the amplitude and 2π/|B| is the period.To represent arbitrary phase differences, we shift a graph of the correct amplitude and periodhorizontally by replacing t with t− h or t+ h.Functions of the form f(t) = A sin(Bt) + C and g(t) = A cos(Bt) + C have graphs whichare shifted vertically and oscillate about the value C.
Example 1 Find and show on a graph the amplitude and period of the functions
(a) y = 5 sin(2t) (b) y = −5 sin
(t
2
)(c) y = 1 + 2 sin t
Solution (a) From Figure 1.42, you can see that the amplitude of y = 5 sin(2t) is 5 because the factor of 5stretches the oscillations up to 5 and down to−5. The period of y = sin(2t) is π, because whent changes from 0 to π, the quantity 2t changes from 0 to 2π, so the sine function goes throughone complete oscillation.
(b) Figure 1.43 shows that the amplitude of y = −5 sin (t/2) is again 5, because the negative signreflects the oscillations in the t-axis, but does not change how far up or down they go. The periodof y = −5 sin (t/2) is 4π because when t changes from 0 to 4π, the quantity t/2 changes from0 to 2π, so the sine function goes through one complete oscillation.
(c) The 1 shifts the graph y = 2 sin t up by 1. Since y = 2 sin t has an amplitude of 2 and a periodof 2π, the graph of y = 1 + 2 sin t goes up to 3 and down to −1, and has a period of 2π. (SeeFigure 1.44.) Thus, y = 1 + 2 sin t also has amplitude 2.
−π π
2π
5
t
yy = 5 sin 2t
6
?
Amplitude
-�PeriodFigure 1.42: Amplitude = 5,
period = π
−π 2π 4π
5y = −5 sin(t/2)
t
y
6
?
Amplitude
-� PeriodFigure 1.43: Amplitude = 5,
period = 4π
π 2π−1
1
3
t
yy = 1 + 2 sin t
6
?
Amplitude
-� Period
Figure 1.44: Amplitude = 2, period = 2π
Example 2 Find possible formulas for the following sinusoidal functions.
−6π 12π6π
g(t)
−3
3
t
(a)
−1 1 2 3 4
−2
f(t)2
t
(b)
−5π π 7π 13π
−3
3
t
h(t)(c)

32 Chapter One A LIBRARY OF FUNCTIONS
Solution (a) This function looks like a sine function of amplitude 3, so g(t) = 3 sin(Bt). Since the functionexecutes one full oscillation between t = 0 and t = 12π, when t changes by 12π, the quantityBt changes by 2π. This means B · 12π = 2π, so B = 1/6. Therefore, g(t) = 3 sin(t/6) hasthe graph shown.
(b) This function looks like an upside down cosine function with amplitude 2, so f(t) = −2 cos(Bt).The function completes one oscillation between t = 0 and t = 4. Thus, when t changes by 4,the quantity Bt changes by 2π, so B · 4 = 2π, or B = π/2. Therefore, f(t) = −2 cos(πt/2)has the graph shown.
(c) This function looks like the function g(t) in part (a), but shifted a distance of π to the right.Since g(t) = 3 sin(t/6), we replace t by (t− π) to obtain h(t) = 3 sin[(t− π)/6].
Example 3 On February 10, 1990, high tide in Boston was at midnight. The water level at high tide was 9.9feet; later, at low tide, it was 0.1 feet. Assuming the next high tide is at exactly 12 noon and that theheight of the water is given by a sine or cosine curve, find a formula for the water level in Boston asa function of time.
Solution Let y be the water level in feet, and let t be the time measured in hours from midnight. The os-cillations have amplitude 4.9 feet (= (9.9 − 0.1)/2) and period 12, so 12B = 2π and B = π/6.Since the water is highest at midnight, when t = 0, the oscillations are best represented by a cosinefunction. (See Figure 1.45.) We can say
Height above average = 4.9 cos(π
6t).
Since the average water level was 5 feet (= (9.9 + 0.1)/2), we shift the cosine up by adding 5:
y = 5 + 4.9 cos(π
6t).
12 mid. 6 am 12 noon
12
6 pm 12 mid.
24
5
9.9
t
y
y = 5 + 4.9 cos(π6t)
Figure 1.45: Function approximating the tide in Boston on February 10, 1990
Example 4 Of course, there’s something wrong with the assumption in Example 3 that the next high tide isat noon. If so, the high tide would always be at noon or midnight, instead of progressing slowlythrough the day, as in fact it does. The interval between successive high tides actually averagesabout 12 hours 24 minutes. Using this, give a more accurate formula for the height of the water as afunction of time.
Solution The period is 12 hours 24 minutes = 12.4 hours, so B = 2π/12.4, giving
y = 5 + 4.9 cos
(2π
12.4t
)= 5 + 4.9 cos(0.507t).

1.5 TRIGONOMETRIC FUNCTIONS 33
Example 5 Use the information from Example 4 to write a formula for the water level in Boston on a day whenthe high tide is at 2 pm.
Solution When the high tide is at midnight
y = 5 + 4.9 cos(0.507t).
Since 2 pm is 14 hours after midnight, we replace t by (t− 14). Therefore, on a day when the hightide is at 2 pm,
y = 5 + 4.9 cos(0.507(t− 14)).
The Tangent FunctionIf t is any number with cos t 6= 0, we define the tangent function as follows
tan t =sin t
cos t.
Figure 1.40 on page 30 shows the geometrical meaning of the tangent function: tan t is theslope of the line through the origin (0, 0) and the point P = (cos t, sin t) on the unit circle.
The tangent function is undefined wherever cos t = 0, namely, at t = ±π/2,±3π/2, . . . , and ithas a vertical asymptote at each of these points. The function tan t is positive where sin t and cos thave the same sign. The graph of the tangent is shown in Figure 1.46.
−π π
−10
10
t
tan t
-� Period
Figure 1.46: The tangent function
−π π
−10
10
t
3 tan t
tan t
-
-
-� Period
Figure 1.47: Multiple of tangent
The tangent function has period π, because it repeats every π units. Does it make sense to talkabout the amplitude of the tangent function? Not if we’re thinking of the amplitude as a measure ofthe size of the oscillation, because the tangent becomes infinitely large near each vertical asymptote.We can still multiply the tangent by a constant, but that constant no longer represents an amplitude.(See Figure 1.47.)
The Inverse Trigonometric FunctionsOn occasion, you may need to find a number with a given sine. For example, you might want to findx such that
sinx = 0
or such thatsinx = 0.3.
The first of these equations has solutions x = 0, ±π, ±2π, . . . . The second equation also hasinfinitely many solutions. Using a calculator, we get
x ≈ 0.305, 2.84, 0.305± 2π, 2.84± 2π, . . . .

34 Chapter One A LIBRARY OF FUNCTIONS
For each equation, we pick out the solution between −π/2 and π/2 as the preferred solution.For example, the preferred solution to sinx = 0 is x = 0, and the preferred solution to sinx = 0.3is x = 0.305. We define the inverse sine, written “arcsin” or “sin−1,” as the function which givesthe preferred solution.
For −1 ≤ y ≤ 1,arcsin y = x
means sinx = y with −π2≤ x ≤ π
2.
Thus the arcsine is the inverse function to the piece of the sine function having domain [−π/2, π/2].(See Table 1.14 and Figure 1.48.) On a calculator, the arcsine function5 is usually denoted by sin−1 .
Table 1.14 Values of sinx and sin−1 x
x sinx
−π2
−1.000
−1.0 −0.841
−0.5 −0.479
0.0 0.000
0.5 0.479
1.0 0.841π2
1.000
x sin−1 x
−1.000 −π2
−0.841 −1.0
−0.479 −0.5
0.000 0.0
0.479 0.5
0.841 1.0
1.000 π2
−π2−1 1 π
2
−π2
−1
1
π2 y = sin−1 x
y = sinx
x
Figure 1.48: The arcsine function
The inverse tangent, written “arctan” or “tan−1,” is the inverse function for the piece of thetangent function having the domain −π/2 < x < π/2. On a calculator, the inverse tangent isusually denoted by tan−1 . The graph of the arctangent is shown in Figure 1.50.
For any y,arctan y = x
means tanx = y with −π2< x <
π
2.
The inverse cosine function, written “arccos” or “cos−1,” is discussed in Problem 47. The rangeof the arccosine function is 0 ≤ x ≤ π.
−π2
π2
−1
1
y = tanx
x
Figure 1.49: The tangent function
−1 1
−π2
π2
y = tan−1 x
x
Figure 1.50: The arctangent function
5Note that sin−1 x = arcsinx is not the same as (sinx)−1 = 1/ sinx.

1.5 TRIGONOMETRIC FUNCTIONS 35
Exercises and Problems for Section 1.5Exercises
For Exercises 1–9, draw the angle using a ray through the ori-gin, and determine whether the sine, cosine, and tangent ofthat angle are positive, negative, zero, or undefined.
1. 3π2
2. 2π 3. π4
4. 3π 5. π6
6. 4π3
7. −4π3
8. 4 9. −1
Given that sin (π/12) = 0.259 and cos (π/5) = 0.809, com-pute (without using the trigonometric functions on your cal-culator) the quantities in Exercises 10–12. You may want todraw a picture showing the angles involved, and then checkyour answers on a calculator.
10. cos (−π5
) 11. sin π5
12. cos π12
13. Consider the function y = 5 + cos(3x).
(a) What is its amplitude?(b) What is its period?(c) Sketch its graph.
Find the period and amplitude in Exercises 14–17.
14. y = 7 sin(3t) 15. z = 3 cos(u/4) + 5
16. w = 8− 4 sin(2x+ π) 17. r = 0.1 sin(πt) + 2
18. Without a calculator or computer, match the formulaswith the graphs in Figure 1.51.
(a) y = 2 cos (t− π/2) (b) y = 2 cos t
(c) y = 2 cos (t+ π/2)
2π
2
−2
t
y
� f(t)
� g(t)
� h(t)
Figure 1.51
For Exercises 19–28, find a possible formula for each graph.
19.
8π
2
x
y 20.
6π
5
x
y
21.
π
4
x
y 22.
20π
8
x
y
23.
3
6
−5
5
x
y 24.
− 4π5
4π5
−2
2
x
y
25.
−2π 2π
1
3
x
y 26.
−2π 2π
1
3
x
y
27.
8π
2
4
x
y 28.
4 8
3
6
x
y
In Exercises 29–33, find a solution to the equation if possible.Give the answer in exact form and in decimal form.
29. 2 = 5 sin(3x) 30. 1 = 8 cos(2x+ 1)− 3
31. 8 = 4 tan(5x) 32. 1 = 8 tan(2x+ 1)− 3
33. 8 = 4 sin(5x)
Problems
34. A compact disk spins at a rate of 200 to 500 revolutionsper minute. What are the equivalent rates measured in ra-dians per second?
35. When a car’s engine makes less than about 200 revolu-tions per minute, it stalls. What is the period of the rota-tion of the engine when it is about to stall?

36 Chapter One A LIBRARY OF FUNCTIONS
36. What is the difference between sinx2, sin2 x, andsin(sinx)? Express each of the three as a composition.(Note: sin2 x is another way of writing (sinx)2.)
37. On the graph of y = sinx, points P and Q are at con-secutive lowest and highest points. Find the slope of theline through P and Q.
38. The Bay of Fundy in Canada has the largest tides in theworld. The difference between low and high water lev-els is 15 meters (nearly 50 feet). At a particular point thedepth of the water, y meters, is given as a function oftime, t, in hours since midnight by
y = D +A cos (B(t− C)) .
(a) What is the physical meaning of D?(b) What is the value of A?(c) What is the value of B? Assume the time between
successive high tides is 12.4 hours.(d) What is the physical meaning of C?
39. A mass is oscillating on the end of a spring. The distance,y, of the mass from its equilibrium position is given by
y = y0 cos(2πωt).
Here y is in centimeters, t is time in seconds, and y0 andω are positive constants.
(a) What is the meaning of y0 in terms of oscillations?(b) How many oscillations are completed in 1 second?
40. In an electrical outlet, the voltage, V , in volts, is given asa function of time, t, in seconds, by the formula
V = V0 sin(120πt).
(a) What does V0 represent in terms of voltage?(b) What is the period of this function?(c) How many oscillations are completed in 1 second?
41. In a US household, the voltage in volts in an electric out-let is given by
V = 156 sin(120πt),
where t is in seconds. However, in a European house, thevoltage is given (in the same units) by
V = 339 sin(100πt).
Compare the voltages in the two regions, considering themaximum voltage and number of cycles (oscillations) persecond.
42. A baseball hit at an angle of θ to the horizontal with ini-tial velocity v0 has horizontal range, R, given by
R =v2
0
gsin(2θ).
Here g is the acceleration due to gravity. Sketch R as afunction of θ for 0 ≤ θ ≤ π/2. What angle gives themaximum range? What is the maximum range?
43. A population of animals oscillates sinusoidally betweena low of 700 on January 1 and a high of 900 on July 1.
(a) Graph the population against time.(b) Find a formula for the population as a function of
time, t, in months since the start of the year.
44. The desert temperature, H , oscillates daily between 40◦
F at 5 am and 80◦ F at 5 pm. Write a possible formulafor H in terms of t, measured in hours from 5 am.
45. The point P is rotating around a circle of radius 5 shownin Figure 1.52. The angle θ, in radians, is given as a func-tion of time, t, by the graph in Figure 1.53.
(a) Estimate the coordinates of P when t = 1.5.(b) Describe in words the motion of the point P on the
circle.
P
5
θ x
y
Figure 1.52
1 2 3 4 5
1
2
3
4
5
6
7
t
θ
Figure 1.53
46. Find the area of the trapezoidal cross-section of the irri-gation canal shown in Figure 1.54.
θθ
6
?
h
-� w
Figure 1.54
47. This problem introduces the arccosine function, or in-verse cosine, denoted by cos−1 on most calculators.
(a) Using a calculator set in radians, make a table of val-ues, to two decimal places, of g(x) = arccosx, forx = −1,−0.8,−0.6, . . . , 0, . . . , 0.6, 0.8, 1.
(b) Sketch the graph of g(x) = arccosx.(c) Why is the domain of the arccosine the same as the
domain of the arcsine?(d) Why is the range of the arccosine not the same as the
range of the arcsine? To answer this, look at how thedomain of the original sine function was restrictedto construct the arcsine. Why can’t the domain ofthe cosine be restricted in exactly the same way toconstruct the arccosine?

1.6 POWERS, POLYNOMIALS, AND RATIONAL FUNCTIONS 37
1.6 POWERS, POLYNOMIALS, AND RATIONAL FUNCTIONS
Power FunctionsA power function is a function in which the dependent variable is proportional to a power of theindependent variable:
A power function has the form
f(x) = kxp, where k and p are constant.
For example, the volume, V , of a sphere of radius r is given by
V = g(r) =4
3πr3.
As another example, the gravitational force, F , on a unit mass at a distance r from the center of theearth is given by Newton’s Law of Gravitation, which says that, for some positive constant k,
F =k
r2or F = kr−2.
We consider the graphs of the power functions xn, with n a positive integer. Figures 1.55and 1.56 show that the graphs fall into two groups: odd and even powers. For n greater than 1, theodd powers have a “seat” at the origin and are increasing everywhere else. The even powers arefirst decreasing and then increasing. For large x, the higher the power of x, the faster the functionclimbs.
−2 −1
1 2
−10
−5
5
10
x
x5 x3
x
Figure 1.55: Odd powers of x: “Seat”shaped for n > 1
−3 −2 −1 1 2 3
−5
5
10
x
x4
x2
Figure 1.56: Even powers of x:⋃
-shaped
Exponentials and Power Functions: Which Dominate?In everyday language, the word exponential is often used to imply very fast growth. But do expo-nential functions always grow faster than power functions? To determine what happens “in the longrun,” we often want to know which functions dominate as x gets arbitrarily large.

38 Chapter One A LIBRARY OF FUNCTIONS
Let’s consider y = 2x and y = x3. The close-up view in Figure 1.57(a) shows that betweenx = 2 and x = 4, the graph of y = 2x lies below the graph of y = x3. The far-away view in Fig-ure 1.57(b) shows that the exponential function y = 2x eventually overtakes y = x3. Figure 1.57(c),which gives a very far–away view, shows that, for large x, the value of x3 is insignificant comparedto 2x. Indeed, 2x is growing so much faster than x3 that the graph of 2x appears almost vertical incomparison to the more leisurely climb of x3.
We say that Figure 1.57(a) gives a local view of the functions’ behavior, whereas Figure 1.57(c)gives a global view.
(a)
1 2 3 4
10
20
x
y
x3 2x
Close up(Local)
(b)
5 10
1,000
2,000
x
y
2x x3
(c)
5 10 15
5,000
104
x
y
2x
x3
Far away(Global)
Figure 1.57: Comparison of y = 2x and y = x3: Notice that y = 2x eventually dominates y = x3
In fact, every exponential growth function eventually dominates every power function. Al-though an exponential function may be below a power function for some values of x, if we lookat large enough x-values, ax (with a > 1) will eventually dominate xn, no matter what n is.
PolynomialsPolynomials are the sums of power functions with nonnegative integer exponents:
y = p(x) = anxn + an−1x
n−1 + · · ·+ a1x+ a0.
Here n is a nonnegative integer called the degree of the polynomial, and an, an−1, . . . , a1, a0 areconstants, with leading coefficient an 6= 0. An example of a polynomial of degree n = 3 is
y = p(x) = 2x3 − x2 − 5x− 7.
In this case a3 = 2, a2 = −1, a1 = −5, and a0 = −7. The shape of the graph of a polynomialdepends on its degree; typical graphs are shown in Figure 1.58. These graphs correspond to apositive coefficient for xn; a negative leading coefficient turns the graph upside down. Notice thatthe quadratic “turns around” once, the cubic “turns around” twice, and the quartic (fourth degree)“turns around” three times. An nth degree polynomial “turns around” at most n− 1 times (where nis a positive integer), but there may be fewer turns.
Quadratic(n = 2)
Cubic(n = 3)
Quartic(n = 4)
Quintic(n = 5)
Figure 1.58: Graphs of typical polynomials of degree n

1.6 POWERS, POLYNOMIALS, AND RATIONAL FUNCTIONS 39
Example 1 Find possible formulas for the polynomials whose graphs are in Figure 1.59.
−2 2
4
x
f(x)(a)
−3 1 2
−12
x
g(x)(b)
−3 2x
h(x)
(c)
Figure 1.59: Graphs of polynomials
Solution (a) This graph appears to be a parabola, turned upside down, and moved up by 4, so
f(x) = −x2 + 4.
The negative sign turns the parabola upside down and the +4 moves it up by 4. Notice that thisformula does give the correct x-intercepts since 0 = −x2 + 4 has solutions x = ±2. Thesevalues of x are called zeros of f .
We can also solve this problem by looking at the x-intercepts first, which tell us that f(x)has factors of (x+ 2) and (x− 2). So
f(x) = k(x+ 2)(x− 2).
To find k, use the fact that the graph has a y-intercept of 4, so f(0) = 4, giving
4 = k(0 + 2)(0− 2),
or k = −1. Therefore, f(x) = −(x+ 2)(x− 2), which multiplies out to −x2 + 4.Note that f(x) = 4 − x4/4 also has the same basic shape, but is flatter near x = 0. There
are many possible answers to these questions.(b) This looks like a cubic with factors (x+ 3), (x− 1), and (x− 2), one for each intercept:
g(x) = k(x+ 3)(x− 1)(x− 2).
Since the y-intercept is −12, we have
−12 = k(0 + 3)(0− 1)(0− 2).
So k = −2, and we get the cubic polynomial
g(x) = −2(x+ 3)(x− 1)(x− 2).
(c) This also looks like a cubic with zeros at x = 2 and x = −3. Notice that at x = 2 the graph ofh(x) touches the x-axis but does not cross it, whereas at x = −3 the graph crosses the x-axis.We say that x = 2 is a double zero, but that x = −3 is a single zero.
To find a formula for h(x), imagine the graph of h(x) to be slightly lower down, so that thegraph has one x-intercept near x = −3 and two near x = 2, say at x = 1.9 and x = 2.1. Thena formula would be
h(x) ≈ k(x+ 3)(x− 1.9)(x− 2.1).
Now move the graph back to its original position. The zeros at x = 1.9 and x = 2.1 movetoward x = 2, giving
h(x) = k(x+ 3)(x− 2)(x− 2) = k(x+ 3)(x− 2)2.
The double zero leads to a repeated factor, (x−2)2. Notice that when x > 2, the factor (x−2)2
is positive, and when x < 2, the factor (x − 2)2 is still positive. This reflects the fact thath(x) does not change sign near x = 2. Compare this with the behavior near the single zero atx = −3, where h does change sign.
We cannot find k, as no coordinates are given for points off of the x-axis. Any positivevalue of k stretches the graph vertically but does not change the zeros, so any positive k works.

40 Chapter One A LIBRARY OF FUNCTIONS
Example 2 Using a calculator or computer, graph y = x4 and y = x4 − 15x2 − 15x for −4 ≤ x ≤ 4 and for−20 ≤ x ≤ 20. Set the y range to −100 ≤ y ≤ 100 for the first domain, and to −100 ≤ y ≤200,000 for the second. What do you observe?
Solution From the graphs in Figure 1.60 we see that close up (−4 ≤ x ≤ 4) the graphs look different; fromfar away, however, they are almost indistinguishable. The reason is that the leading terms (thosewith the highest power of x) are the same, namely x4, and for large values of x, the leading termdominates the other terms.
−4 4
−100
100
x
y
y = x4
Close-upor
Local−4
4
−100
100
x
y
y = x4 − 15x2 − 15x
Far awayor
Global
−20 20
2 · 105
x
y
y = x4
−20 20
2 · 105
x
y
y = x4 − 15x2 − 15x
Figure 1.60: Local and global views of y = x4 and y = x4 − 15x2 − 15x
Rational FunctionsRational functions are ratios of polynomials, p and q:
f(x) =p(x)
q(x).
Example 3 Look at a graph and explain the behavior of y =1
x2 + 4.
Solution The function is even, so the graph is symmetric about the y-axis. As x gets larger, the denominatorgets larger, making the value of the function closer to 0. Thus the graph gets arbitrarily close to thex-axis as x increases without bound. See Figure 1.61.
x
y
Figure 1.61: Graph of y = 1x2+4

1.6 POWERS, POLYNOMIALS, AND RATIONAL FUNCTIONS 41
In the previous example, we say that y = 0 (i.e. the x-axis) is a horizontal asymptote. Writing”→” to mean “tends to,” we have y → 0 as x→∞ and y → 0 as x→ −∞.
If the graph of y = f(x) approaches a horizontal line y = L as x → ∞ or x → −∞, thenthe line y = L is called a horizontal asymptote.6 This occurs when
f(x)→ L as x→∞ or f(x)→ L as x→ −∞.
If the graph of y = f(x) approaches the vertical line x = K as x→ K from one side or theother, that is, if
y →∞ or y → −∞ when x→ K,
then the line x = K is called a vertical asymptote.
The graphs of rational functions may have vertical asymptotes where the denominator is zero.For example, the function in Example 3 has no vertical asymptotes as the denominator is neverzero. The function in Example 4 has two vertical asymptotes corresponding to the two zeros in thedenominator.
Rational functions have horizontal asymptotes if f(x) approaches a finite number as x → ∞or x→ −∞. We call the behavior of a function as x→ ±∞ its end behavior.
Example 4 Look at a graph and explain the behavior of y =3x2 − 12
x2 − 1, including end behavior.
Solution Factoring gives
y =3x2 − 12
x2 − 1=
3(x+ 2)(x− 2)
(x+ 1)(x− 1)
so x = ±1 are vertical asymptotes. If y = 0, then 3(x + 2)(x − 2) = 0 or x = ±2; these are thex-intercepts. Note that zeros of the denominator give rise to the vertical asymptotes, whereas zerosof the numerator give rise to x-intercepts. Substituting x = 0 gives y = 12; this is the y-intercept.The function is even, so the graph is symmetric about the y-axis.
To see what happens as x→ ±∞, look at the y-values in Table 1.15. Clearly y is getting closerto 3 as x gets large positively or negatively. Alternatively, realize that as x→ ±∞, only the highestpowers of x matter. For large x, the 12 and the 1 are insignificant compared to x2, so
y =3x2 − 12
x2 − 1≈ 3x2
x2= 3 for large x.
So y → 3 as x → ±∞, and therefore the horizontal asymptote is y = 3. See Figure 1.62. Since,for x > 1, the denominator is positive and the numerator is less than the denominator, the graph liesbelow its asymptote. (Why doesn’t the graph lie below y = 3 when −1 < x < 1?)
Table 1.15 Values ofy = 3x2−12
x2−1
x y =3x2−12
x2−1
±10 2.909091
±100 2.999100
±1000 2.999991
−4 4−10
20
x
y
Horizontal asymptotey = 3
Vertical asymptotex = 1
Vertical asymptotex = −1
Figure 1.62: Graph of the function y = 3x2−12x2−1
6We are assuming that f(x) gets arbitrarily close to L as x→∞.

42 Chapter One A LIBRARY OF FUNCTIONS
Exercises and Problems for Section 1.6Exercises
In Exercises 1–2, which function dominates as x→∞?
1. 10 · 2x or 72,000x12 2. 0.25√x or 25,000x−3
For Problems 3–4, what happens to the value of the functionas x→∞ and as x→ −∞?
3. y = 0.25x3 + 3 4. y = 2 · 104x
5. Each of the graphs in Figure 1.63 is of a polynomial. Thewindows are large enough to show global behavior.
(a) What is the minimum possible degree of the polyno-mial?
(b) Is the leading coefficient of the polynomial positiveor negative?
(I) (II) (III)
(IV) (V)
Figure 1.63
6. For each function, fill in the blanks in the statements:f(x)→ as x→ −∞,f(x)→ as x→ +∞.
(a) f(x) = 17 + 5x2 − 12x3 − 5x4
(b) f(x) =3x2 − 5x+ 2
2x2 − 8(c) f(x) = ex
Find possible formulas for the graphs in Exercises 7–10.
7.
−3 1 4x
8.
−3 4x
9.
−2 1 3 5x
10.
−2 2 5x
11. Use Figure 1.64 to graph each of the following. Labelany intercepts or asymptotes that can be determined.
(a) y = f(x) + 3 (b) y = 2f(x)
(c) y = f(x+ 4) (d) y = 4− f(x)
−5 −3 −1 2 5
−1
1
2
x
y
Figure 1.64
Problems
Find cubic polynomials for the graphs in Exercises 12–13.
12.
−2 1 5
2
x
13.
−2 2
4
x
14. Which of the functions I–III meet each of the followingdescriptions? There may be more than one function foreach description, or none at all.
(a) Horizontal asymptote of y = 1.(b) The x-axis is a horizontal asymptote.(c) Symmetric about the y-axis.(d) An odd function.(e) Vertical asymptotes at x = ±1.
I. y =x− 1
x2 + 1II. y =
x2 − 1
x2 + 1III. y =
x2 + 1
x2 − 1
15. The DuBois formula relates a person’s surface area, s,in m2, to weight w, in kg, and height h, in cm, by
s = 0.01w0.25h0.75.
(a) What is the surface area of a person who weighs65 kg and is 160 cm tall?
(b) What is the weight of a person whose height is180 cm and who has a surface area of 1.5 m2?
(c) For people of fixed weight 70 kg, solve for h as afunction of s. Simplify your answer.
16. A box of fixed volume V has a square base with sidelength x. Write a formula for the height, h, of the box interms of x and V . Sketch a graph of h versus x.

1.6 POWERS, POLYNOMIALS, AND RATIONAL FUNCTIONS 43
17. According to Car and Driver, an Alfa Romeo going at 70mph requires 177 feet to stop. Assuming that the stoppingdistance is proportional to the square of velocity, find thestopping distances required by an Alfa Romeo going at35 mph and at 140 mph (its top speed).
18. Water is flowing down a cylindrical pipe of radius r.
(a) Write a formula for the volume, V , of water thatemerges from the end of the pipe in one second ifthe water is flowing at a rate of
(i) 3 cm/sec (ii) k cm/sec
(b) Graph your answer to part (a)(ii) as a function of(i) r, assuming k is constant
(ii) k, assuming r is constant
19. Poiseuille’s law gives the rate of flow,R, of a gas througha cylindrical pipe in terms of the radius of the pipe, r, fora fixed drop in pressure between the two ends of the pipe.
(a) Find a formula for Poiseuille’s Law, given that therate of flow is proportional to the fourth power ofthe radius.
(b) If R = 400 cm3/sec in a pipe of radius 3 cm for acertain gas, find a formula for the rate of flow of thatgas through a pipe of radius r cm.
(c) What is the rate of flow of the same gas through apipe with a 5 cm radius?
20. The height of an object above the ground at time t isgiven by
s = v0t− g
2t2,
where v0 is the initial velocity and g is the accelerationdue to gravity.
(a) At what height is the object initially?(b) How long is the object in the air before it hits the
ground?(c) When will the object reach its maximum height?(d) What is that maximum height?
21. A pomegranate is thrown from ground level straight upinto the air at time t = 0 with velocity 64 feet per sec-ond. Its height at time t seconds is f(t) = −16t2 + 64t.Find the time it hits the ground and the time it reaches itshighest point. What is the maximum height?
22. (a) If f(x) = ax2 + bx+ c, what can you say about thevalues of a, b, and c if:
(i) (1, 1) is on the graph of f(x)?(ii) (1, 1) is the vertex of the graph of f(x)? [Hint:
The axis of symmetry is x = −b/(2a).](iii) The y intercept of the graph is (0, 6)?
(b) Find a quadratic function satisfying all three condi-tions.
23. Values of three functions are given in Table 1.16, roundedto two decimal places. One function is of the form y =abt, one is of the form y = ct2, and one is of the formy = kt3. Which function is which?
Table 1.16
t f(t) t g(t) t h(t)
2.0 4.40 1.0 3.00 0.0 2.04
2.2 5.32 1.2 5.18 1.0 3.06
2.4 6.34 1.4 8.23 2.0 4.59
2.6 7.44 1.6 12.29 3.0 6.89
2.8 8.62 1.8 17.50 4.0 10.33
3.0 9.90 2.0 24.00 5.0 15.49
24. Values of three functions are given in Table 1.17, roundedto two decimal places. Two are power functions andone is an exponential. One of the power functions is aquadratic and one a cubic. Which one is exponential?Which one is quadratic? Which one is cubic?
Table 1.17
x f(x) x g(x) x k(x)
8.4 5.93 5.0 3.12 0.6 3.24
9.0 7.29 5.5 3.74 1.0 9.01
9.6 8.85 6.0 4.49 1.4 17.66
10.2 10.61 6.5 5.39 1.8 29.19
10.8 12.60 7.0 6.47 2.2 43.61
11.4 14.82 7.5 7.76 2.6 60.91
25. A cubic polynomial with positive leading coefficient isshown in Figure 1.65 for −10 ≤ x ≤ 10 and −10 ≤y ≤ 10. What can be concluded about the total numberof zeros of this function? What can you say about thelocation of each of the zeros? Explain.
−10 −5 5 10
−10
−5
5
10
x
y
Figure 1.65
26. How many distinct roots can a polynomial of degree 5have? (List all possibilities.) Sketch a possible graph foreach case.
27. Suppose f(x) = (x+ a1)2 and g(x) = (x+ a2)2. Sup-pose c > 0 and a1 = −2a2 = 2c.
(a) Solve f(x) = g(x). Your answer should involve cbut no other constants.
(b) Sketch f(x) and g(x) on the same axes, labeling in-tercepts.
(c) As c increases, what happens to the x- and y-coordinates of the point of intersection?

44 Chapter One A LIBRARY OF FUNCTIONS
28. A rational function y = f(x) is graphed in Figure 1.66.If f(x) = g(x)/h(x) with g(x) and h(x) both quadraticfunctions, give possible formulas for g(x) and h(x).
1
y = 2y
y = f(x)
x
Figure 1.66
29. Match the following functions with the graphs in Fig-ure 1.67. Assume 0 < b < a.
(a) y =a
x− x (b) y =
(x− a)(x+ a)
x
(c) y =(x− a)(x2 + a)
x2(d) y =
(x− a)(x+ a)
(x− b)(x+ b)
x
y(I)
x
y(II)
x
y(III)
x
y(IV)
Figure 1.67
30. Find a calculator window in which the graphs of f(x) =x3 + 1000x2 + 1000 and g(x) = x3 − 1000x2 − 1000appear indistinguishable.
31. Use a graphing calculator or a computer to graph y = x4
and y = 3x. Determine approximate domains and rangesthat give each of the graphs in Figure 1.68.
x
y
x4 3x(a)
x
y
x4
3x
(b)
x
y
x4
3x(c)
Figure 1.68
32. Newton’s Second Law of Motion, F = ma, tells us thatthe net force,F , on a train of massm is proportional to itsacceleration, a. Suppose that the only forces are those ofthe engine, which exerts a constant force, FE , in the di-rection of motion, and the wind resistance, which exertsa force proportional to the square of the train’s velocity,v, but in the opposite direction.
(a) Write a formula giving a as a function of v.(b) Sketch a graph of a against v.
1.7 INTRODUCTION TO CONTINUITY
This section introduces the idea of continuity on an interval and at a point. This leads to the conceptof limit, which is investigated in the next section.
Continuity of a Function on an Interval: Graphical ViewpointRoughly speaking, a function is said to be continuous on an interval if its graph has no breaks,jumps, or holes in that interval. Continuity is important because, as we shall see, continuous func-tions have many desirable properties.
For example, to locate the zeros of a function, we often look for intervals where the functionchanges sign. In the case of the function f(x) = 3x3 − x2 + 2x − 1, for instance, we expect7 tofind a zero between 0 and 1 because f(0) = −1 and f(1) = 3. (See Figure 1.69.) To be sure that
7This is due to the Intermediate Value Theorem, which is discussed on page 46.

1.7 INTRODUCTION TO CONTINUITY 45
f(x) has a zero there, we need to know that the graph of the function has no breaks or jumps init. Otherwise the graph could jump across the x-axis, changing sign but not creating a zero. Forexample, f(x) = 1/x has opposite signs at x = −1 and x = 1, but no zeros for −1 ≤ x ≤ 1because of the break at x = 0. (See Figure 1.70.) To be certain that a function has a zero in aninterval on which it changes sign, we need to know that the function is defined and continuous inthat interval.
−2 −1 1 2
−5
5 f(x)
x
Figure 1.69: The graph off(x) = 3x3 − x2 + 2x− 1
−1
f(x) =1
x
1x
Figure 1.70: No zero althoughf(−1) and f(1) have opposite signs
1 2 3
37
60
83p(x)
x (ounces)
y (cents)
Figure 1.71: Cost of mailing a letter
A continuous function has a graph which can be drawn without lifting the pencil from the paper.Example: The function f(x) = 3x3 − x2 + 2x − 1 is continuous on any interval. (See Fig-
ure 1.69.)Example: The function f(x) = 1/x is not defined at x = 0. It is continuous on any interval not
containing the origin. (See Figure 1.70.)Example: Suppose p(x) is the price of mailing a first-class letter weighing x ounces. It costs
34c/ for one ounce or less, 55c/ between the first and second ounces, and so on. So the graph (inFigure 1.71) is a series of steps. This function is not continuous on any open interval containing apositive integer because the graph jumps at these points.
Which Functions are Continuous?
Requiring a function to be continuous on an interval is not asking very much, as any function whosegraph is an unbroken curve over the interval is continuous. For example, exponential functions, poly-nomials, and the sine and cosine are continuous on every interval. Rational functions are continuouson any interval in which their denominators are not zero. Functions created by adding, multiplying,or composing continuous functions are also continuous.
The Intermediate Value TheoremContinuity tells us about the values taken by a function. In particular, a continuous function cannotskip values. For example, the function in the next example must have a zero because its graph cannotskip over the x-axis.
Example 1 What do the values in Table 1.18 tell you about the zeros of f(x) = cosx− 2x2?
Table 1.18
x f(x)
0 1.00
0.2 0.90
0.4 0.60
0.6 0.11
0.8 −0.58
1.0 −1.46
0.2 0.4 0.6 0.8 1
−1
1
x
f(x) = cosx− 2x2
Figure 1.72: Zeros occur where the graph of acontinuous function crosses the horizontal axis

46 Chapter One A LIBRARY OF FUNCTIONS
Solution Since f(x) is the difference of two continuous functions, it is continuous. We conclude that f(x)has at least one zero in the interval 0.6 < x < 0.8, since f(x) changes from positive to negative onthat interval. The graph of f(x) in Figure 1.72 suggests that there is only one zero in the interval0 ≤ x ≤ 1, but we cannot be sure of this from the graph or the table of values.
In the previous example, we concluded that f(x) = cosx − 2x2 has a zero between x = 0and x = 1 because f(x) is positive at x = 0 and negative at x = 1. More generally, an intuitivenotion of continuity tells us that, as we follow the graph of a continuous function f from some point(a, f(a)) to another point (b, f(b)), then f takes on all intermediate values between f(a) and f(b).(See Figure 1.73.) This is:
Theorem 1.1: Intermediate Value TheoremSuppose f is continuous on a closed interval [a, b]. If k is any number between f(a) and f(b),then there is at least one number c in [a, b] such that f(c) = k.
A proof of this result needs the formal definition of continuity in Section 2.6 and is given atwww.wiley.com/college/hugheshallett. The key idea is to find successively smaller subintervals of[a, b] on which f changes from less than k to more than k. These subintervals converge on thenumber c.
a c b
k
(a, f(a))
(b, f(b))
x
Figure 1.73: The Intermediate Value Theorem
Continuity of a Function at a Point: Numerical ViewpointA function is continuous if nearby values of the independent variable give nearby values of the func-tion. In practical work, continuity is important because it means that small errors in the independentvariable lead to small errors in the value of the function.
Example: Suppose that f(x) = x2 and that we want to compute f(π). Knowing f is continuoustells us that taking x = 3.14 should give a good approximation to f(π), and that we can get asaccurate an approximation to f(π) as we want by using enough decimals of π.
Example: If p(x) is the cost of mailing a letter weighing x ounces, then p(0.99) = p(1) = 37c/,whereas p(1.01) = 60c/, because as soon as we get over 1 ounce, the price jumps up to 60c/. Soa small difference in the weight of a letter can lead to a significant difference in its mailing cost.Hence p is not continuous at x = 1.
In other words, if f(x) is continuous at x = c, the values of f(x) approach f(c) as x ap-proaches c. In Section 1.8, we discuss the concept of a limit, which allows us to define more pre-cisely what it means for the values of f(x) to approach f(c) as x approaches c.

1.7 INTRODUCTION TO CONTINUITY 47
Example 2 Investigate the continuity of f(x) = x2 at x = 2.
Solution From Table 1.19, it appears that the values of f(x) = x2 approach f(2) = 4 as x approaches 2.Thus f appears to be continuous at x = 2. Continuity at a point describes behavior of a functionnear a point, as well as at the point.
Table 1.19 Values of x2 near x = 2
x 1.9 1.99 1.999 2.001 2.01 2.1
x2 3.61 3.96 3.996 4.004 4.04 4.41
Exercises and Problems for Section 1.7Exercises
Are the functions in Exercises 1–10 continuous on the givenintervals?
1. 2x+ x2/3 on [−1, 1] 2. 2x+ x−1 on [−1, 1]
3. 1
x− 2on [−1, 1] 4. 1
x− 2on [0, 3]
5. 1√2x− 5
on [3, 4] 6. x
x2 + 2on [−2, 2]
7. 1
cosxon [0, π] 8. 1
sinxon [−π
2, π
2]
9. ex
ex − 1on [−1, 1] 10. esin θ
cos θon [−π
4, π
4]
In Exercises 11–14, show that there is a number c, with0 ≤ c ≤ 1, such that f(c) = 0.
11. f(x) = x3 + x2 − 1 12. f(x) = ex − 3x
13. f(x) = x− cosx 14. f(x) = 2x − 1/x
Problems
15. An electrical circuit switches instantaneously from a 6volt battery to a 12 volt battery 7 seconds after beingturned on. Graph the battery voltage against time. Giveformulas for the function represented by your graph.What can you say about the continuity of this function?
16. A car is coasting down a hill at a constant speed. A truckcollides with the rear of the car, causing it to lurch ahead.Graph the car’s speed from a time shortly before impactto a time shortly after impact. Graph the distance fromthe top of the hill for this time period. What can you sayabout the continuity of each of these functions?
17. Find k so that the following function is continuous onany interval:
f(x) =
{kx 0 ≤ x < 2
3x2 2 ≤ x.
18. Is the following function continuous on [−1, 1]?
f(x) =
{ x
|x| x 6= 0
0 x = 0
19. If possible, choose k so that the following function iscontinuous on any interval:
f(x) =
5x3 − 10x2
x− 2x 6= 2
k x = 2.
20. Discuss the continuity of the function g graphed in Fig-ure 1.74 and defined as follows:
g(θ) =
sin θ
θfor θ 6= 0
1/2 for θ = 0.
−2π −π π 2π
1
θ
g(θ)
12
Figure 1.74

48 Chapter One A LIBRARY OF FUNCTIONS
21. Sketch the graphs of three different functions that arecontinuous on 0 ≤ x ≤ 1 and that have the values givenin the table. The first function is to have exactly one zeroin [0, 1], the second is to have at least two zeros in the in-terval [0.6, 0.8], and the third is to have at least two zerosin the interval [0, 0.6].
x 0 0.2 0.4 0.6 0.8 1.0f(x) 1.00 0.90 0.60 0.11 −0.58 −1.46
22. (a) Sketch the graph of a continuous function f with allof the following properties:
(i) f(0) = 2
(ii) f(x) is decreasing for 0 ≤ x ≤ 3
(iii) f(x) is increasing for 3 < x ≤ 5
(iv) f(x) is decreasing for x > 5
(v) f(x)→ 9 as x→∞(b) Is it possible that the graph of f is concave down for
all x > 6? Explain.
23. A 0.6 ml dose of a drug is injected into a patient steadilyfor half a second. At the end of this time, the quantity,Q, of the drug in the body starts to decay exponentiallyat a continuous rate of 0.2% per second. Using formulas,express Q as a continuous function of time, t in seconds.
24. Use a computer or calculator to sketch the functions
y(x) = sinx and zk(x) = ke−x
for k = 1, 2, 4, 6, 8, 10. In each case find the smallestpositive solution of the equation y(x) = zk(x). Now de-fine a new function f by
f(k) = {Smallest positive solution of y(x) = zk(x)}.
Explain why the function f(k) is not continuous on theinterval 0 ≤ k ≤ 10.
1.8 LIMITS
The concept of limit is the underpinning of calculus. In Section 1.7, we said that a function f iscontinuous at x = c if the values of f(x) approach f(c) as x approaches c. In this section, we definea limit, which makes precise what we mean by approaching.
The Idea of a LimitWe first introduce some notation:
We write limx→c
f(x) = L if the values of f(x) approach L as x approaches c.
How should we find L, or even know whether such a number exists? We will look for trends in thevalues of f(x) as x gets closer to c, but x 6= c. A graph from a calculator or computer often helps.
Example 1 Use a graph to estimate limθ→0
(sin θ
θ
). (Use radians.)
θ−2π −π π 2π
1
f(θ) =sin θ
θ
Figure 1.75: Find the limit as θ → 0

1.8 LIMITS 49
Solution Figure 1.75 shows that as θ approaches 0 from either side, the value of sin θ/θ appears to approach1, suggesting that lim
θ→0(sin θ/θ) = 1. Zooming in on the graph near θ = 0 provides further support
for this conclusion. Notice that sin θ/θ is undefined at θ = 0.
Figure 1.75 strongly suggests that limθ→0
(sin θ/θ) = 1, but to be sure we need to be more precise
about words like “approach” and “close”.
Definition of LimitBy the beginning of the 19th century, calculus had proved its worth, and there was no doubt aboutthe correctness of its answers. However, it was not until the work of the French mathematicianAugustin Cauchy (1789–1857) that calculus was put on a rigorous footing. Cauchy gave a formaldefinition of the limit, similar to the following:
A function f is defined on an interval around c, except perhaps at the point x = c. We definethe limit of the function f(x) as x approaches c, written limx→c f(x), to be a number L (ifone exists) such that f(x) is as close to L as we want whenever x is sufficiently close to c(but x 6= c). If L exists, we write
limx→c
f(x) = L.
Shortly, we see how “as close as we want” and “sufficiently close” are expressed using inequalities.First, we look at lim
θ→0(sin θ/θ) more closely (see Example 1).
Example 2 By graphing y = (sin θ)/θ in an appropriate window, find how close θ should be to 0 in order tomake (sin θ)/θ within 0.01 of 1.
Solution Since we want (sin θ)/θ to be within 0.01 of 1, we set the y-range on the graphing window to gofrom 0.99 to 1.01. Our first attempt with −0.5 ≤ θ ≤ 0.5 yields the graph in Figure 1.76. Sincewe want the y-values to stay within the range 0.99 < y < 1.01, we do not want the graph toleave the window through the top or bottom. By trial and error, we find that changing the θ-rangeto −0.2 ≤ θ ≤ 0.2 gives the graph in Figure 1.77. Thus, the graph suggests that (sin θ)/θ is within0.01 of 1 whenever θ is within 0.2 of 0. Proving this requires an analytical argument, not just graphsfrom a calculator.
1.01
0.99−0.5 0.5
y
Figure 1.76: (sin θ)/θ with−0.5 ≤ θ ≤ 0.5
1.01
0.99−0.2 0.2
y
Figure 1.77: (sin θ)/θ with−0.2 ≤ θ ≤ 0.2

50 Chapter One A LIBRARY OF FUNCTIONS
When we say “f(x) is close to L,” we measure closeness by the distance between f(x) and L,expressed using absolute values:
|f(x)− L| = Distance between f(x) and L.
When we say “as close to L as we want,” we use ε (the Greek letter epsilon) to specify how close.We write
|f(x)− L| < ε
to indicate that we want the distance between f(x) and L to be less than ε. In Example 2 we usedε = 0.01. Similarly, we interpret “x is sufficiently close to c” as specifying a distance between xand c:
|x− c| < δ,
where δ (the Greek letter delta) tells us how close x should be to c. In Example 2 we found δ = 0.2.If limx→c
f(x) = L, we know that no matter how narrow the horizontal band determined by ε inFigure 1.78, there is always a δ which makes the graph stay within that band, for c− δ < x < c+ δ.
Thus we restate the definition of a limit, using symbols:
Definition of LimitWe define lim
x→cf(x) to be the number L (if one exists) such that for any ε > 0 (as small
as we want), there is a δ > 0 (sufficiently small) such that if |x − c| < δ and x 6= c, then|f(x)− L| < ε.
We have arrived at a formal definition of limit. Let’s see if it agrees with our intuition.
c− δ c c+ δ
L− εL
L+ ε
6?ε
6?ε
f(x)
x
Figure 1.78: What the definition of the limit means graphically
Example 3 Use the definition of limit to show that limx→3
2x = 6.
Solution We must show how, given any ε > 0, we can find a δ > 0 such that
If |x− 3| < δ and x 6= 3, then |2x− 6| < ε.
Since |2x− 6| = 2|x− 3|, to get |2x− 6| < ε we require that |x− 3| < ε/2. Thus we take δ = ε/2.

1.8 LIMITS 51
It is important to understand that the ε, δ definition does not make it easier to calculate limits;rather the ε, δ definition makes it possible to put calculus on a rigorous foundation. From thisfoundation, we can prove the following properties. See Problems 49–51.
Theorem 1.2: Properties of LimitsAssuming all the limits on the right hand side exist:
1. If b is a constant, then limx→c
(bf(x)) = b(
limx→c
f(x))
.
2. limx→c
(f(x) + g(x)) = limx→c
f(x) + limx→c
g(x).
3. limx→c
(f(x)g(x)) =(
limx→c
f(x))(
limx→c
g(x))
.
4. limx→c
f(x)
g(x)=
limx→c f(x)
limx→c g(x), provided lim
x→cg(x) 6= 0.
5. For any constant k, limx→c
k = k.
6. limx→c
x = c.
These properties underlie many limit calculations, though we may not acknowledge them explicitly.
Example 4 Explain how the limit properties are used in the following calculation:
limx→3
x2 + 5x
x+ 9=
32 + 5 · 33 + 9
= 2.
Solution We calculate this limit in stages, using the limit properties to justify each step:
limx→3
x2 + 5x
x+ 9=
limx→3
(x2 + 5x)
limx→3
(x+ 9)(Property 4, since limx→3(x+ 9) 6= 0)
=limx→3
(x2) + limx→3
(5x)
limx→3
x+ limx→3
9(Property 2)
=
(limx→3
x)2
+ 5(
limx→3
x)
limx→3
x+ limx→3
9(Properties 1 and 3)
=32 + 5 · 3
3 + 9= 2. (Properties 5 and 6)
One- and Two-Sided Limits
When we writelimx→2
f(x),
we mean the number that f(x) approaches as x approaches 2 from both sides. We examine valuesof f(x) as x approaches 2 through values greater than 2 (such as 2.1, 2.01, 2.003) and values lessthan 2 (such as 1.9, 1.99, 1.994). If we want x to approach 2 only through values greater than 2, wewrite
limx→2+
f(x)

52 Chapter One A LIBRARY OF FUNCTIONS
for the number that f(x) approaches (assuming such a number exists). Similarly,
limx→2−
f(x)
denotes the number (if it exists) obtained by letting x approach 2 through values less than 2. We calllimx→2+
f(x) a right-hand limit and limx→2−
f(x) a left-hand limit. Problems 24 and 25 ask for formal
definitions of left and right-hand limits.
2
L1
L2
f(x)
x
Figure 1.79: Left- and right-hand limitsat x = 2
For the function graphed in Figure 1.79, we have
limx→2−
f(x) = L1 limx→2+
f(x) = L2.
If the left- and right-hand limits were equal, that is, if L1 = L2, then it can be proved that limx→2
f(x)
exists and limx→2
f(x) = L1 = L2. Since L1 6= L2 in Figure 1.79, we see that limx→2
f(x) does notexist in this case.
When Limits Do Not Exist
Whenever there is no number L such that limx→c
f(x) = L, we say limx→c
f(x) does not exist. Here arethree examples in which limits fail to exist.
Example 5 Explain why limx→2
|x− 2|x− 2
does not exist.
Solution Figure 1.80 shows the problem: The right-hand limit and the left-hand limit are different. For x > 2,we have |x− 2| = x− 2, so as x approaches 2 from the right,
limx→2+
|x− 2|x− 2
= limx→2+
x− 2
x− 2= limx→2+
1 = 1.
Similarly, if x < 2, then |x− 2| = 2− x so
limx→2−
|x− 2|x− 2
= limx→2−
2− xx− 2
= limx→2−
(−1) = −1.
So if limx→2
|x− 2|x− 2
= L then L would have to be both 1 and −1. Since L cannot have two different
values, the limit does not exist.

1.8 LIMITS 53
2
−1
1
x
Figure 1.80: Graph of|x− 2|/(x− 2)
x
Figure 1.81: Graph of 1/x2
− 12π
12π
x
Figure 1.82: Graph of sin (1/x)
Example 6 Explain why limx→0
1
x2does not exist.
Solution As x approaches zero, 1/x2 becomes arbitrarily large, so it cannot approach any finite number L.See Figure 1.81. Therefore we say 1/x2 has no limit as x→ 0.
If limx→a
f(x) does not exist because f(x) gets arbitrarily large on both sides of a, we also say
limx→a
f(x) =∞. So in Example 6 we could say limx→0
1/x2 =∞. This behavior may also be describedas “diverging to infinity.”
Example 7 Explain why limx→0
sin
(1
x
)does not exist.
Solution The sine function has values between −1 and 1. The graph in Figure 1.82 oscillates more and morerapidly as x→ 0. There are x-values approaching 0 where sin(1/x) = −1. There are also x-valuesapproaching 0 where sin(1/x) = 1. So if the limit existed, it would have to be both−1 and 1. Thus,the limit does not exist.
Limits at Infinity
Sometimes we want to know what happens to f(x) as x gets large, that is, the end behavior of f .
If f(x) gets as close to a number L as we please when x gets sufficiently large, then we write
limx→∞
f(x) = L.
Similarly, if f(x) approaches Lwhen x is negative and has a sufficiently large absolute value,then we write
limx→−∞
f(x) = L.
The symbol∞ does not represent a number. Writing x→∞means that we consider arbitrarilylarge values of x. If the limit of f(x) as x → ∞ or x → −∞ is L, we say that the graph of f hasy = L as a horizontal asymptote. Problem 26 asks for a formal definition of limx→∞ f(x).

54 Chapter One A LIBRARY OF FUNCTIONS
Example 8 Investigate limx→∞
1
xand lim
x→−∞1
x.
Solution A graph of f(x) = 1/x in a large window shows 1/x approaching zero as x increases in either thepositive or the negative direction (See Figure 1.83). This is as we would expect, since dividing 1 bylarger and larger numbers yields answers which are smaller and smaller. This suggests that
limx→∞
1
x= limx→−∞
1
x= 0,
and that f(x) = 1/x has y = 0 as a horizontal asymptote as x→ ±∞.
x
y
f(x) = 1x
Figure 1.83: The end behavior of f(x) = 1/x
Definition of ContinuityWe can now give a precise definition of continuity using limits.
The function f is continuous at x = c if f is defined at x = c and if
limx→c
f(x) = f(c).
In other words, f(x) is as close as we want to f(c) provided x is close enough to c. Thefunction is continuous on an interval [a, b] if it is continuous at every point in the interval.8
Constant functions and f(x) = x are continuous for all x. Using the continuity of sums andproducts, we can show that any polynomial is continuous. Proving that sinx, cosx, and ex arecontinuous is more difficult. The following theorem, based on the properties of limits on page 51,makes it easier to decide whether certain combinations of functions are continuous.
Theorem 1.3: Continuity of Sums, Products, and Quotients of FunctionsSuppose that f and g are continuous on an interval and that b is a constant. Then, on thatsame interval,
1. bf(x) is continuous2. f(x) + g(x) is continuous3. f(x)g(x) is continuous4. f(x)/g(x) is continuous, provided g(x) 6= 0 on the interval.
We prove the third of these properties.8If c is an endpoint of the interval, we define continuity at x = c using one-sided limits at c.
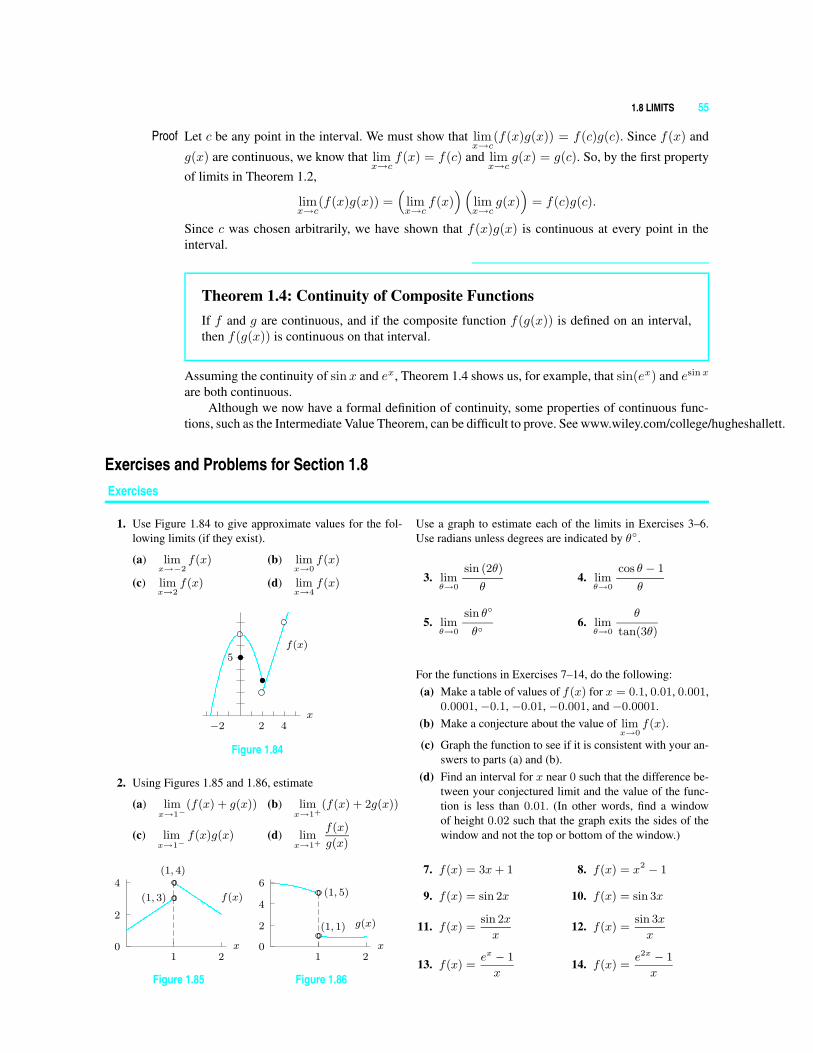
1.8 LIMITS 55
Proof Let c be any point in the interval. We must show that limx→c
(f(x)g(x)) = f(c)g(c). Since f(x) and
g(x) are continuous, we know that limx→c
f(x) = f(c) and limx→c
g(x) = g(c). So, by the first propertyof limits in Theorem 1.2,
limx→c
(f(x)g(x)) =(
limx→c
f(x))(
limx→c
g(x))
= f(c)g(c).
Since c was chosen arbitrarily, we have shown that f(x)g(x) is continuous at every point in theinterval.
Theorem 1.4: Continuity of Composite FunctionsIf f and g are continuous, and if the composite function f(g(x)) is defined on an interval,then f(g(x)) is continuous on that interval.
Assuming the continuity of sinx and ex, Theorem 1.4 shows us, for example, that sin(ex) and esinx
are both continuous.Although we now have a formal definition of continuity, some properties of continuous func-
tions, such as the Intermediate Value Theorem, can be difficult to prove. See www.wiley.com/college/hugheshallett.
Exercises and Problems for Section 1.8Exercises
1. Use Figure 1.84 to give approximate values for the fol-lowing limits (if they exist).
(a) limx→−2
f(x) (b) limx→0
f(x)
(c) limx→2
f(x) (d) limx→4
f(x)
−2 2 4
5
x
f(x)
Figure 1.84
2. Using Figures 1.85 and 1.86, estimate
(a) limx→1−
(f(x) + g(x)) (b) limx→1+
(f(x) + 2g(x))
(c) limx→1−
f(x)g(x) (d) limx→1+
f(x)
g(x)
(1, 3) o
(1, 4)o
1 2
f(x)
0
2
4
x
Figure 1.85
(1, 1)o
(1, 5)o
1 2
g(x)
0
2
4
6
x
Figure 1.86
Use a graph to estimate each of the limits in Exercises 3–6.Use radians unless degrees are indicated by θ◦.
3. limθ→0
sin (2θ)
θ4. lim
θ→0
cos θ − 1
θ
5. limθ→0
sin θ◦
θ◦6. lim
θ→0
θ
tan(3θ)
For the functions in Exercises 7–14, do the following:(a) Make a table of values of f(x) for x = 0.1, 0.01, 0.001,
0.0001, −0.1, −0.01, −0.001, and −0.0001.(b) Make a conjecture about the value of lim
x→0f(x).
(c) Graph the function to see if it is consistent with your an-swers to parts (a) and (b).
(d) Find an interval for x near 0 such that the difference be-tween your conjectured limit and the value of the func-tion is less than 0.01. (In other words, find a windowof height 0.02 such that the graph exits the sides of thewindow and not the top or bottom of the window.)
7. f(x) = 3x+ 1 8. f(x) = x2 − 1
9. f(x) = sin 2x 10. f(x) = sin 3x
11. f(x) =sin 2x
x12. f(x) =
sin 3x
x
13. f(x) =ex − 1
x14. f(x) =
e2x − 1
x

56 Chapter One A LIBRARY OF FUNCTIONS
For the functions in Exercises 15–18, do the following:
(a) Make a table of values of f(x) for x = a+0.1, a+0.01,a + 0.001, a + 0.0001, a − 0.1, a − 0.01, a − 0.001,and a− 0.0001.
(b) Make a conjecture about the value of limx→a
f(x).
(c) Graph the function to see if it is consistent with your an-swers to parts (a) and (b).
(d) Find an interval for x containing a such that the differ-ence between your conjectured limit and the value ofthe function is less than 0.01 on that interval. (In otherwords, find a window of height 0.02 such that the graphexits the sides of the window and not the top or bottomof the window.)
15. f(x) =x2 − 4
x− 2, a = 2
16. f(x) =x2 − 9
x− 3, a = 3
17. f(x) =sinx− 1
x− π/2 , a =π
2
18. f(x) =e2x−2 − 1
x− 1, a = 1
For the functions in Exercises 19–21, use algebra to evaluatethe limits lim
x→a+f(x), lim
x→a−f(x), and lim
x→af(x) if they ex-
ist. Sketch a graph to confirm your answers.
19. a = 4, f(x) =|x− 4|x− 4
20. a = 2, f(x) =|x− 2|x
21. a = 3, f(x) =
x2 − 2, 0 < x < 3
2, x = 3
2x+ 1, 3 < x
22. Estimate how close θ should be to 0 to make (sin θ)/θstay within 0.001 of 1.
23. Write the definition of the following statement both inwords and in symbols:
limh→a
g(h) = K.
Problems
In Problems 24–26, modify the definition of limit on page 50to give a definition of each of the following.
24. A right-hand limit 25. A left-hand limit
26. limx→∞
f(x) = L
27. If p(x) is the function on page 45 giving the price ofmailing a first-class letter, explain why lim
x→1p(x) does not
exist.
28. Investigate limh→0
(1 + h)1/h numerically.
29. The notation limx→0+ means that we only consider val-ues of x greater than 0. Estimate the limit
limx→0+
xx,
either by evaluating xx for smaller and smaller positivevalues of x (say x = 0.1, 0.01, 0.001, . . .) or by zoomingin on the graph of y = xx near x = 0.
Assuming that limits as x→∞ have the properties listed forlimits as x → c on page 51, use algebraic manipulations toevaluate lim
x→∞for the functions in Problems 30–36.
30. f(x) =x+ 3
2− x 31. f(x) =x2 + 2x− 1
3 + 3x2
32. f(x) =x2 + 4
x+ 333. f(x) =
2x3 − 16x2
4x2 + 3x3
34. f(x) =x4 + 3x
x4 + 2x535. f(x) =
3ex + 2
2ex + 3
36. f(x) =2e−x + 3
3e−x + 2
In Problems 37–44, find a value of the constant k such that thelimit exists.
37. limx→4
x2 − k2
x− 438. lim
x→1
x2 − kx+ 4
x− 1
39. limx→−2
x2 + 4x+ k
x+ 240. lim
x→∞
x2 + 3x+ 5
4x+ 1 + xk
41. limx→−∞
e2x − 5
ekx + 342. lim
x→∞
x3 − 6
xk + 3
43. limx→∞
3kx + 6
32x + 444. lim
x→−∞
3kx + 6
32x + 4
For each value of ε in Problems 45–46, find a positive valueof δ such that the graph of the function leaves the windowa − δ < x < a + δ, b − ε < y < b + ε by the sides and notthrough the top or bottom.
45. f(x) = −2x + 3; a = 0; b = 3; ε = 0.2, 0.1, 0.02,0.01, 0.002, 0.001.
46. g(x) = −x3 + 2; a = 0; b = 2; ε = 0.1, 0.01, 0.001.
47. Show that limx→0
(−2x+ 3) = 3. [Hint: Use Problem 45.]

1.8 LIMITS 57
48. Consider the function f(x) = sin(1/x).
(a) Find a sequence of x-values that approach 0 suchthat sin(1/x) = 0.[Hint: Use the fact that sin(π) = sin(2π) =sin(3π) = . . . = sin(nπ) = 0.]
(b) Find a sequence of x-values that approach 0 suchthat sin(1/x) = 1.[Hint: Use the fact that sin(nπ/2) = 1 if n =1, 5, 9, . . . .]
(c) Find a sequence of x-values that approach 0 suchthat sin(1/x) = −1.
(d) Explain why your answers to any two of parts (a)–(c) show that lim
x→0sin(1/x) does not exist.
49. This problem suggests a proof of the first property of lim-its on page 51: lim
x→cbf(x) = b lim
x→cf(x).
(a) First, prove the property in the case b = 0.(b) Now suppose that b 6= 0. Let ε > 0. Show that if|f(x)− L| < ε/|b|, then |bf(x)− bL| < ε.
(c) Finally, prove that if limx→c
f(x) = L then
limx→c
bf(x) = bL. [Hint: Choose δ so that if |x−c| <δ, then |f(x)− L| < ε/|b|.]
50. Prove the second property of limits: limx→c
(f(x) + g(x)) =
limx→c
f(x)+ limx→c
g(x). Assume that the limits on the right
exist.
51. This problem suggests a proof of the third property oflimits (assuming the limits on the right exist):
limx→c
(f(x)g(x)) =(
limx→c
f(x))(
limx→c
g(x))
Let L1 = limx→c f(x) and L2 = limx→c g(x).
(a) First, show that if limx→c
f(x) = limx→c
g(x) = 0, then
limx→c
(f(x)g(x)) = 0.
(b) Show algebraically that f(x)g(x) =(f(x)− L1) (g(x)− L2) + L1g(x) + L2f(x) −L1L2.
(c) Use the second limit property (see Problem 50) toexplain whylimx→c
(f(x)− L1) = limx→c
(g(x)− L2) = 0.
(d) Use parts (a) and (c) to explain whylimx→c
(f(x)− L1) (g(x)− L2) = 0.
(e) Finally, use parts (b) and (d) and the first and secondlimit properties to show that
limx→c
(f(x)g(x)) =(
limx→c
f(x))(
limx→c
g(x))
.
52. Show f(x) = x is continuous everywhere.
53. Use Problem 52 to show that for any positive integer n,the function xn is continuous everywhere.
54. Use Theorem 1.2 on page 51 to explain why if f and gare continuous on an interval, then so are f + g, fg, andf/g (assuming g(x) 6= 0 on the interval).
CHAPTER SUMMARY (see also Ready Reference at the end of the book)
• Function terminologyDomain/range, increasing/decreasing, concavity, zeros(roots), even/odd, end behavior, asymptotes.
• Linear functionsSlope, vertical intercept. Grow by equal amounts in equaltimes.
• Exponential functionsExponential growth and decay, with base e, growth rate,continuous growth rate, doubling time, half life. Grow byequal percentages in equal times.
• Logarithmic functionsLog base 10, natural logarithm.
• Trigonometric functionsSine and cosine, tangent, amplitude, period, arcsine, arc-tangent.
• Power functions• Polynomials and rational functions
• New functions from oldInverse functions, composition of functions, shifting,stretching, shrinking.
• Working with functionsFind a formula for a linear, exponential, power, logarith-mic, or trigonometric function, given graph, table of val-ues, or verbal description. Find vertical and horizontalasymptotes. End behavior.
• Comparisons between functionsExponential functions dominate power and linear func-tions.
• ContinuityInterpret graphically and numerically. Intermediate ValueTheorem.
• LimitsGraphical interpretation, ε-δ definition, properties, one-sided limits, limits to infinity.

58 Chapter One A LIBRARY OF FUNCTIONS
REVIEW EXERCISES AND PROBLEMS FOR CHAPTER ONE
Exercises
1. The entire graph of f(x) is shown in Figure 1.87.
(a) What is the domain of f(x)?(b) What is the range of f(x)?(c) List all zeros of f(x).(d) List all intervals on which f(x) is decreasing.(e) Is f(x) concave up or concave down at x = 6?(f) What is f(4)?(g) Is this function invertible? Explain.
f(x)
1 2 3 4 5 6 7
−2
−1
0
1
2
3
4
5
x
Figure 1.87
For Exercises 2–5, solve for x using logs.
2. 10 = 4x
3. 25 = 2(5)x
4. 2 · 5x = 11 · 7x
5. 7 = 5e0.2x
Find the amplitudes and periods in Exercises 6–7.
6. y = 5 sin (x/3) 7. y = 4− 2 cos(5x)
Find possible formulas for the graphs in Exercises 8–21.
8.
7
3
x
y 9.
x
y
(0, 1)
(3, 4)
10.
3
y
t
(5, 9)
11.
−5x
y
12.
x
y
(0, 2)
(2, 1)
13.
π 3π2π 4π
2
θ
z
14.
−2
−1 1x
y 15.4
y
x
16.
20
−5
5
t
y 17.
−5 −1 3x
y
18.
−2 2
3x
y 19.
x
yy = 1
20.
−9
9
18
−3
3
x
y 21.
5−1
1x
y
For Exercises 22–23, find functions f and g such that h(x) =f(g(x)). [Note: Do not choose f(x) = x or g(x) = x.]
22. h(x) = ln(x3) 23. h(x) = (lnx)3
State whether the functions in Exercises 24–27 are continuouson the interval [−1, 1].
24. f(x) = |x| 25. g(x) =|x|x
26. h(θ) = θ sin θ 27. f(t) =sin t
t2

REVIEW EXERCISES AND PROBLEMS FOR CHAPTER ONE 59
For the functions in Exercises 28–31, do the following:(a) Make a table of values of f(x) for x = a+0.1, a+0.01,
a + 0.001, a + 0.0001, a − 0.1, a − 0.01, a − 0.001,and a− 0.0001.
(b) Make a conjecture about the value of limx→a
f(x).
(c) Graph the function to see if it is consistent with your an-swers to parts (a) and (b).
(d) Find an interval for x containing a such that the differ-ence between your conjectured limit and the value ofthe function is less than 0.01 on that interval. (In otherwords, find a window of height 0.02 such that the graphexits the sides of the window and not the top or bottomof the window.)
28. f(x) =cos 2x− 1 + 2x2
x3, a = 0
29. f(x) =cos 3x− 1 + 4.5x2
x3, a = 0
30. f(x) =sin 5x− 1
x− π/2 , a =π
2
31. f(x) =e0.5x−1 − 1
x− 2, a = 2
For the functions in Exercises 32–33, use algebra to evaluatethe limits lim
x→a+f(x), lim
x→a−f(x), and lim
x→af(x) if they ex-
ist. Sketch a graph to confirm your answers.
32. a = 3, f(x) =x3|2x− 6|x− 3
33. a = 0, f(x) =
ex, −1 < x < 0
1, x = 0
cosx, 0 < x < 1
Problems
34. The yield, Y , of an apple orchard (in bushels) as a func-tion of the amount, a, of fertilizer (in pounds) used on theorchard is shown in Figure 1.88.
(a) Describe the effect of the amount of fertilizer on theyield of the orchard.
(b) What is the vertical intercept? Explain what it meansin terms of apples and fertilizer.
(c) What is the horizontal intercept? Explain what itmeans in terms of apples and fertilizer.
(d) What is the range of this function for 0 ≤ a ≤ 80?(e) Is the function increasing or decreasing at a = 60?(f) Is the graph concave up or down near a = 40?
10 20 30 40 50 60 70 80 90
100
200
300
400
500
600
a (lbs)
Y (bushels)
Figure 1.88
35. A rock is dropped from a window and falls to the groundbelow. The height, s (in meters), of the rock aboveground is a function of the time, t (in seconds), since therock was dropped, so s = f(t).
(a) Sketch a possible graph of s as a function of t.(b) Explain what the statement f(7) = 12 tells us about
the rock’s fall.(c) The graph drawn as the answer for part (a) should
have a horizontal and vertical intercept. Interpreteach intercept in terms of the rock’s fall.
36. A culture of 100 bacteria doubles after 2 hours. How longwill it take for the number of bacteria to reach 3,200?
37. A controversial 1992 Danish study9 reported that men’saverage sperm count has decreased from 113 million permilliliter in 1940 to 66 million per milliliter in 1990.
(a) Express the average sperm count, S, as a linear func-tion of the number of years, t, since 1940.
(b) A man’s fertility is affected if his sperm count dropsbelow about 20 million per milliliter. If the linearmodel found in part (a) is accurate, in what year willthe average male sperm count fall below this level?
38. Different kinds of the same element (called different iso-topes) can have very different half-lives. The decay ofplutonium-240 is described by the formula
Q = Q0e−0.00011t,
whereas the decay of plutonium-242 is described by
Q = Q0e−0.0000018t.
Find the half-lives of plutonium-240 and plutonium-242.
39. A culture of bacteria originally numbers 500. After 2hours there are 1500 bacteria in the culture. Assumingexponential growth, how many are there after 6 hours?
40. The population of the United States was 226.5 millionin 1980 and 248.7 million in 1990. Assuming exponen-tial growth, in what year is the population expected to goover 300 million?
9“Investigating the Next Silent Spring”, US News and World Report, p. 50-52, (March 11, 1996).

60 Chapter One A LIBRARY OF FUNCTIONS
41. One of the main contaminants of a nuclear accident, suchas that at Chernobyl, is strontium-90, which decays ex-ponentially at a continuous rate of approximately 2.47%per year. After the Chernobyl disaster, it was suggestedthat it would be about 100 years before the region wouldagain be safe for human habitation. What percent of theoriginal strontium-90 would still remain then?
42. In the early 1920s, Germany had tremendously high in-flation, called hyperinflation. Photographs of the timeshow people going to the store with wheelbarrows fullof money. If a loaf of bread cost 1/4 RM in 1919 and2,400,000 RM in 1922, what was the average yearly in-flation rate between 1919 and 1922?
43. An airplane uses a fixed amount of fuel for takeoff, a (dif-ferent) fixed amount for landing, and a third fixed amountper mile when it is in the air. How does the total quantityof fuel required depend on the length of the trip? Writea formula for the function involved. Explain the meaningof the constants in your formula.
44. Each planet moves around the sun in an elliptical orbit.The orbital period, T , of a planet is the time it takes theplanet to go once around the sun. The semimajor axis ofeach planet’s orbit is the average of the largest and thesmallest distances between the planet and the sun. Jo-hannes Kepler (1571-1630) discovered that the period ofa planet is proportional to the 3
2power of its semimajor
axis. What is the orbiting period (in days) of Mercury,the closest planet to the sun, with a semimajor axis of58 million km? What is the period (in years) of Pluto,the farthest planet, with a semimajor axis of 6000 mil-lion km? The semimajor axis of the earth is 150 millionkm. [Hint: What is the earth’s period?]
45. A closed cylindrical can of fixed volume V has radius r.
(a) Find the surface area, S, as a function of r.(b) What happens to the value of S as r →∞?(c) Sketch a graph of S against r, if V = 10 cm3.
46. (a) Consider the functions graphed in Figure 1.89(a).Find the coordinates of C.
(b) Consider the functions in Figure 1.89(b). Find thecoordinates of C in terms of b.
y = x2
(0, 2)
(1, 1)
C
(a) y
x
y = x2
(0, b)
(1, 1)
C
(b) y
x
Figure 1.89
47. The depth of water in a tank oscillates sinusoidally onceevery 6 hours. If the smallest depth is 5.5 feet and thelargest depth is 8.5 feet, find a possible formula for thedepth in terms of time in hours.
48. The visitors’ guide to St. Petersburg, Florida, containsthe chart shown in Figure 1.90 to advertise their goodweather. Fit a trigonometric function approximately tothe data, where H is temperature in degrees Fahrenheit,and the independent variable is time in months. In orderto do this, you will need to estimate the amplitude and pe-riod of the data, and when the maximum occurs. (Thereare many possible answers to this problem, depending onhow you read the graph.)
Jan Feb Mar Apr May June July Aug Sept Oct Nov DecH (◦F)
50◦60◦70◦80◦90◦100◦
Figure 1.90: “St. Petersburg...where we’re famous for ourwonderful weather and year-round sunshine.” (Reprinted
with permission)
49. Figure 1.91 is the graph10 of the function f , where f(t)is the number (in millions) of motor vehicles registeredin the world in the year t. (In 1988, one-third of the reg-istered vehicles in the world were in the United States.)
(a) Is f invertible? Explain.(b) What is the meaning of f−1(400) in practical terms?
Evaluate f−1(400).(c) Sketch the graph of f−1.
’88’82’76’70’64’58’46 ’520
100
200
400
500
300
Figure 1.91
10From D. Blerics and P. Walzer, “Energy for Motor Vehicles,” Scientific American, September 1990.

REVIEW EXERCISES AND PROBLEMS FOR CHAPTER ONE 61
50. Each of the functions in the table is increasing over itsdomain, but each increases in a different way. Match thefunctions f , g, h to the graphs in Figure 1.92.
x f(x)
1 12 24 37 4
11 516 622 729 837 947 10
x g(x)
3.0 13.2 23.4 33.6 43.8 54.0 64.2 74.4 84.6 94.8 10
x h(x)
10 120 228 334 439 543 646.5 749 851 952 10
(a) (b) (c)
Figure 1.92
51. (a) Use a graphing calculator or computer to estimatethe period of 2 sin θ + 3 cos(2θ).
(b) Explain your answer, given that the period of sin θis 2π and the period of cos(2θ) is π.
52. Glucose is fed by intravenous injection at a constant rate,k, into a patient’s bloodstream. Once there, the glucose isremoved at a rate proportional to the amount of glucosepresent. If R is the net rate at which the quantity, G, ofglucose in the blood is increasing:
(a) Write a formula giving R as a function of G.(b) Sketch a graph of R against G.
53. A catalyst in a chemical reaction is a substance whichspeeds up the reaction but which does not itself change.If the product of a reaction is itself a catalyst, the reac-tion is said to be autocatalytic. The rate, r, of an autocat-alytic reaction is proportional to the quantity of the orig-inal material remaining times the quantity of product, p,
produced. The initial quantity of the original material isA and the amount remaining is A− p.
(a) Express r as a function of p.(b) What is the value of p when the reaction is proceed-
ing fastest?
54. What approximate domains and ranges make the graphsof y = x2 and y = 0.01e0.01x look like each of thegraphs in Figure 1.93?
y
x
0.01e0.01x
x2
(a) y
x
0.01e0.01x
x2
(b)
y
x
0.01e0.01x
x2
(c)
Figure 1.93
For each value of ε in Problems 55–56, find a positive valueof δ such that the graph of the function leaves the windowa − δ < x < a + δ, b − ε < y < b + ε by the sides and notthrough the top or bottom.
55. h(x) = sinx, a = b = 0, ε = 0.1, 0.05, 0.0007.
56. k(x) = cosx, a = 0, b = 1, ε = 0.1, 0.001, 0.00001.
CAS Challenge Problems
57. (a) Factor f(x) = x4 + bx3 − cx3 − a2x2 − bcx2 −a2bx + a2cx + a2bc using a computer algebra sys-tem.
(b) Assuming a, b, c are constants with 0 < a < b < c,use your answer to part (a) to make a hand sketch ofthe graph of f . Explain how you know its shape.
58. (a) Using a computer algebra system, factor f(x) =−x5 + 11x4 − 46x3 + 90x2 − 81x+ 27.
(b) Use your answer to part (a) to make a hand sketch ofthe graph of f . Explain how you know its shape.
59. Let f(x) = e6x+e5x−2e4x−10e3x−8e2x+16ex+16.
(a) What happens to the value of f(x) as x → ∞? Asx→ −∞? Explain your answer.
(b) Using a computer algebra system, factor f(x) andpredict the number of zeros of the function f(x).
(c) What are the exact values of the zeros? What is therelationship between successive zeros?
60. Let f(x) = x2 − x.
(a) Find the polynomials f(f(x)) and f(f(f(x))) inexpanded form.
(b) What do you expect to be the degree of the polyno-mial f(f(f(f(f(f(x))))))? Explain.

62 Chapter One A LIBRARY OF FUNCTIONS
61. (a) Use a computer algebra system to rewrite the ratio-nal function
f(x) =x3 − 30
x− 3in the form
f(x) = p(x) +r(x)
q(x),
where p(x), q(x), r(x) are polynomials and the de-gree of r(x) is less than the degree of q(x).
(b) What is the vertical asymptote of f? Use your an-swer to part (a) to write the formula for a functionwhose graph looks like the graph of f for x near thevertical asymptote.
(c) Use your answer to part (a) to write the formula fora function whose graph looks like the graph of f forx→∞ and x→ −∞.
(d) Using graphs, confirm the asymptote you found inpart (b) and the formula you found in part (c).
We say that a function can be written as a polynomial insinx (or cosx) if it is of the form p(sinx) (or p(cosx)) forsome polynomial p(x). For example, cos 2x can be writtenas a polynomial in sinx because cos(2x) = 1 − 2 sin2 x =p(sinx), where p(x) = 1− 2x2.
62. Use the trigonometric capabilities of your computer alge-bra system to express sin(5x) as a polynomial in sinx.
63. Use the trigonometric capabilities of your computer al-gebra system to express cos(4x) as a polynomial in
(a) sinx(b) cosx.
CHECK YOUR UNDERSTANDING
Are the statements in Problems 1–30 true or false? Give anexplanation for your answer.
1. For any two points in the plane, there is a linear functionwhose graph passes through them.
2. The graph of f(x) = 100(10x) is a horizontal shift ofthe graph of g(x) = 10x.
3. The graph of f(x) = lnx is concave down.
4. The graph of g(x) = log(x − 1) crosses the x-axis atx = 1.
5. Every polynomial of odd degree has at least one zero.
6. The function y = 2 + 3e−t has a y-intercept of y = 3.
7. The function y = 5 − 3e−4t has a horizontal asymptoteof y = 5.
8. If y = f(x) is a linear function, then increasing x by 1unit changes the corresponding y bym units, wherem isthe slope.
9. If y = f(x) is an exponential function and if increasingx by 1 increases y by a factor of 5, then increasing x by2 increases y by a factor of 10.
10. If y = Abx and increasing x by 1 increases y by a factorof 3, then increasing x by 2 increases y by a factor of 9.
11. The function f(θ) = cos θ − sin θ is increasing on0 ≤ θ ≤ π/2.
12. The function f(t) = sin(0.05πt) has period 0.05.
13. If t is in seconds, g(t) = cos(200πt) executes 100 cyclesin one second.
14. The function f(θ) = tan(θ − π/2) is not defined atθ = π/2, 3π/2, 5π/2 . . ..
15. The function f(x) = sin(x2) is periodic, with period2π.
16. The function g(θ) = esin θ is periodic.
17. If f(x) is a periodic function with period k, then f(g(x))is periodic with period k for every function g(x).
18. If g(x) is a periodic function, then f(g(x)) is periodicfor every function f(x).
19. The function f(x) = e−x2
is decreasing for all x.
20. The inverse function of y = log x is y = 1/ log x.
21. If f is an increasing function, then f−1 is an increasingfunction.
22. The function f(x) = | sinx| is even.
23. If a function is even, then it does not have an inverse.
24. If a function is odd, then it does not have an inverse func-tion.
25. If a and b are positive constants, b 6= 1, then y = a+abx
has a horizontal asymptote.
26. If a and b are positive constants, then y = ln(ax+b) hasno vertical asymptote.
27. The function y = 20/(1 + 2e−kt) with k > 0, has ahorizontal asymptote at y = 20.
28. If g(x) is an even function then f(g(x)) is even for everyfunction f(x).
29. If f(x) is an even function then f(g(x)) is even for everyfunction g(x).
30. If limh→0 f(h) = L, then f(0.0001) is closer to L thanis f(0.01).

CHECK YOUR UNDERSTANDING 63
In Problems 31–36, give an example of a function with thespecified properties. Express your answer using formulas.
31. Continuous on [0, 1] but not continuous on [1, 3].
32. Increasing but not continuous on [0, 10].
33. Has a vertical asymptote at x = −7π.
34. Has exactly 17 vertical asymptotes.
35. Has a vertical asymptote which is crossed by a horizontalasymptote.
36. Two functions f(x) and g(x) such that moving the graphof f to the left 2 units gives the graph of g and movingthe graph of f up 3 also gives the graph of g.
Suppose f is an increasing function and g is a decreasingfunction. In Problems 37–40, give an example for f and gfor which the statement is true, or say why such an example isimpossible.
37. f(x) + g(x) is decreasing for all x.
38. f(x)− g(x) is decreasing for all x.
39. f(x)g(x) is decreasing for all x.
40. f(g(x)) is increasing for all x.
Are the statements in Problems 41–49 true or false? If a state-ment is true, explain how you know. If a statement is false,give a counterexample.
41. Every rational function that is not a polynomial has a ver-tical asymptote.
42. If a function is increasing on an interval, then it is con-cave up on that interval.
43. If y is a linear function of x, then the ratio y/x is constantfor all points on the graph at which x 6= 0.
44. An exponential function can be decreasing.
45. If y = f(x) is a linear function, then increasing x by 2units adds m + 2 units to the corresponding y, where mis the slope.
46. If a function is not continuous at a point, then it is notdefined at that point.
47. If f is continuous on the interval [0, 10] and f(x) = 0and f(10) = 100, then f(c) cannot be negative for c in[0, 10].
48. If f(x) is not continuous on the interval [a, b], then f(x)must omit at least one value between f(a) and f(b).
49. There is a function which is both even and odd.
Suppose that limx→3 f(x) = 7. Are the statements in Prob-lems 50–56 true or false? If a statement is true, explain howyou know. If a statement is false, give a counterexample.
50. limx→3(xf(x)) = 21.
51. If g(3) = 4, then limx→3(f(x)g(x)) = 28.
52. If limx→3 g(x) = 5, then limx→3(f(x) + g(x)) = 12.
53. If limx→3(f(x) + g(x)) = 12, then limx→3 g(x) = 5.
54. f(2.99) is closer to 7 than f(2.9) is.
55. If f(3.1) > 0, then f(3.01) > 0.
56. If limx→3 g(x) does not exist, then limx→3(f(x)g(x))does not exist.
Which of the statements in Problems 57–61 are true about ev-ery function f(x) such that lim
x→cf(x) = L? Give a reason for
your answer.
57. If f(x) is within 10−3 of L, then x is within 10−3 of c.
58. There is a positive ε such that, provided x is within 10−3
of c, and x 6= c, we can be sure f(x) is within ε of L.
59. For any positive ε, we can find a positive δ such that, pro-vided x is within δ of c, and x 6= c, we can be sure thatf(x) is within ε of L.
60. For each ε > 0, there is a δ > 0 such that if x is notwithin δ of c, then f(x) is not within ε of L.
61. For each ε > 0, there is some δ > 0 such that if f(x) iswithin ε of L, then we can be sure that x is within δ of c.
62. Which of the following statements is a direct conse-quence of the statement: “If f and g are continuous atx = a and g(a) 6= 0 then f/g is continuous at x = a”?
(a) If f and g are continuous at x = a and f(a) 6= 0then g/f is continuous at x = a.
(b) If f and g are continuous at x = a and g(a) = 0,then f/g is not continuous at x = a.
(c) If f , g, are continuous at x = a, but f/g is not con-tinuous at x = a, then g(a) = 0.
(d) If f and f/g are continuous at x = a and g(a) 6= 0,then g is continuous at x = a.

64 Chapter One A LIBRARY OF FUNCTIONS
PROJECTS FOR CHAPTER ONE
1. Matching Functions to DataFrom the data in Table 1.20, determine a possible formula for each function.11 Write an
explanation of your reasoning.
Table 1.20x f(x) g(x) h(x) F (x) G(x) H(x)
−5 −10 20 25 0.958924 0.544021 2.958924
−4.5 − 9 19 20.25 0.97753 −0.412118 2.97753
−4 − 8 18 16 0.756802 −0.989358 2.756802
−3.5 − 7 17 12.25 0.350783 −0.656987 2.350783
−3 − 6 16 9 −0.14112 0.279415 1.85888
−2.5 − 5 15 6.25 −0.598472 0.958924 1.401528
−2 − 4 14 4 −0.909297 0.756802 1.090703
−1.5 − 3 13 2.25 −0.997495 −0.14112 1.002505
−1 − 2 12 1 −0.841471 −0.909297 1.158529
−0.5 − 1 11 0.25 −0.479426 −0.841471 1.520574
0 0 10 0 0 0 2
0.5 1 9 0.25 0.479426 0.841471 2.479426
1 2 8 1 0.841471 0.909297 2.841471
1.5 3 7 2.25 0.997495 0.14112 2.997495
2 4 6 4 0.909297 −0.756802 2.909297
2.5 5 5 6.25 0.598472 −0.958924 2.598472
3 6 4 9 0.14112 −0.279415 2.14112
3.5 7 3 12.25 −0.350783 0.656987 1.649217
4 8 2 16 −0.756802 0.989358 1.243198
4.5 9 1 20.25 −0.97753 0.412118 1.02247
5 10 0 25 −0.958924 −0.544021 1.041076
2. Compound InterestThe newspaper article below is from The New York Times, May 27, 1990. Fill in the three
blanks. (For the first blank, assume that daily compounding is essentially the same as continuouscompounding. For the last blank, assume the interest has been compounded yearly, and giveyour answer in dollars. Ignore the occurrence of leap years.)
213 Years After Loan,Uncle Sam Is Dunned
By LISA BELKINSpecial to The New York Times
SAN ANTONIO, May 26 — More than 200 years ago,
a wealthy Pennsylvania merchant named Jacob DeHaven lent
$450,000 to the Continental Congress to rescue the troops at Val-
ley Forge. That loan was apparently never repaid.
So Mr. DeHaven’s descendants are taking the United States
Government to court to collect what they believe they are owed.
The total: in today’s dollars if the interest is
compounded daily at 6 percent, the going rate at
the time. If compounded yearly, the bill is only .
Family Is FlexibleThe descendants say that they are willing to be flexible about
the amount of a settlement and that they might even accept a
heartfelt thank you or perhaps a DeHaven statue. But they also
note that interest is accumulating at a second.
11Based on a problem by Lee Zia

![arXiv:2003.12789v1 [cs.CV] 28 Mar 2020 · M= T+R; (1) where Tand Rare transmission and reflection, respectively. ... [cs.CV] 28 Mar 2020. ance of reflection, we leverage polarization](https://img.pdfslide.us/doc/110x75/5fc78b6448a36370ae2cfbb3/arxiv200312789v1-cscv-28-mar-2020-m-tr-1-where-tand-rare-transmission.jpg)