Embed Size (px)
Citation preview
General Structure of the Atmosphere, and Atmospheric Temperature and Pressure 1-1
CHAPTER ONE
General Structure of the Atmosphere, and Atmospheric Temperature and Pressure 100. INTRODUCTION The purpose of this assignment sheet is to introduce the student to the general composition and structure of the atmosphere, the properties of temperature and atmospheric pressure, and their effect on aircraft altimeters. This lesson will discuss the basic building blocks of the atmosphere, beginning with the lower layers in which most flight activity occurs. These layers have particular temperature characteristics affecting many aspects of weather and are important to the understanding of later chapters. Pressure is another characteristic of the atmosphere, which enables meteorologists to track weather phenomena as they move across the surface of the Earth. Additionally, pressure is important to the aviation community since one of the most basic flight instruments, the barometric altimeter, operates from the action of atmospheric pressure upon its sensors. Additionally, in order to gain a complete understanding of the altimeter, the effects of temperature and pressure variations on altimeter readings will be discussed. 101. LESSON TOPIC LEARNING OBJECTIVES Terminal Objective: Completely supported by this lesson topic: 2.0 Upon completion of this unit of instruction, student aviators and flight officers will demonstrate knowledge of meteorological theory enabling them to make intelligent decisions when confronted with various weather phenomena and hazards. Enabling Objectives: Completely supported by this lesson topic: 2.1 Describe the characteristics of the troposphere, tropopause, and stratosphere. 2.2 Describe the flight conditions associated with the troposphere, tropopause, and stratosphere. 2.3 Define a lapse rate. 2.4 State the average lapse rate in degrees Celsius. 2.5 Define atmospheric pressure. 2.6 State the standard units of pressure measurement. 2.7 Define the standard atmosphere to include temperature and pressure. 2.8 Differentiate between sea level pressure and station pressure.
CHAPTER ONE AVIATION WEATHER
1-2 General Structure of the Atmosphere, and Atmospheric Temperature and Pressure
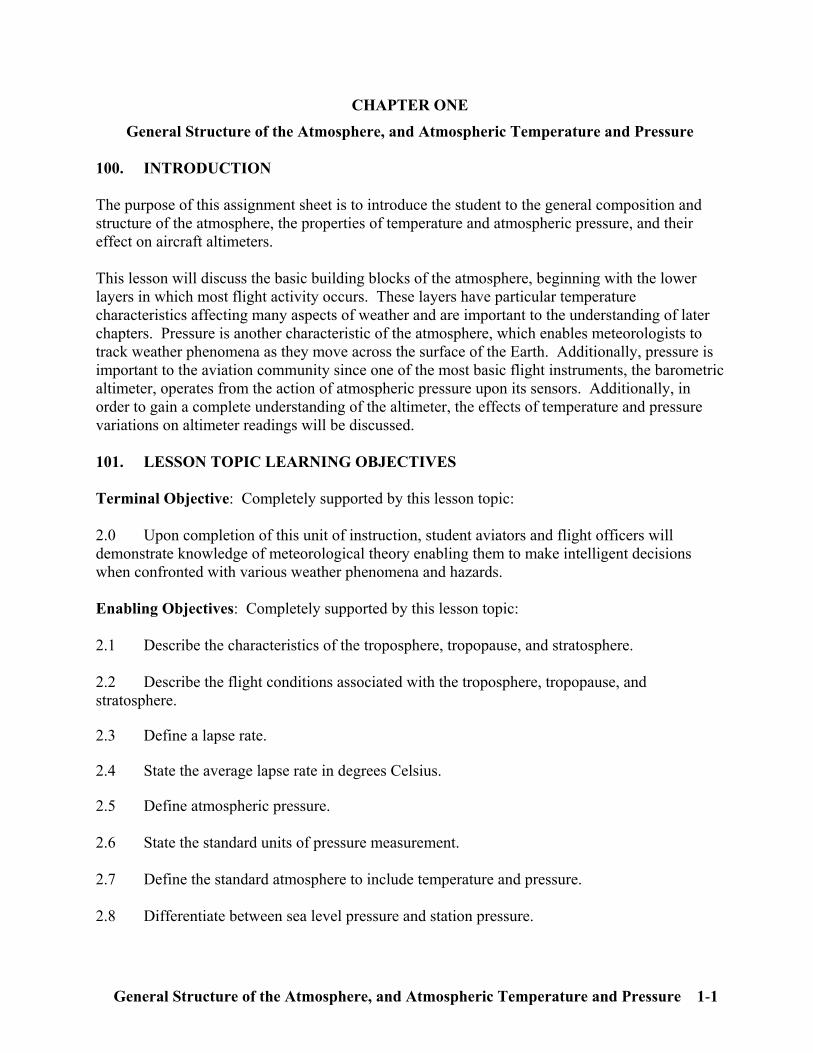
2.9 Define indicated altitude, calibrated altitude, Mean Sea Level (MSL) altitude, Above Ground Level (AGL) altitude, pressure altitude, and density altitude. 2.10 Describe the effects of pressure changes on aircraft altimeters. 2.11 State the effects of temperature deviations from the standard lapse rate on aircraft altimeters. 102. REFERENCES 1. Weather for Aircrews, AFH 11-203, Volume 1, Chapters 1, 3, and 4. 2. Aviation Weather for Pilots and Flight Operations Personnel, Chapters 1-3. 103. STUDY ASSIGNMENT Review Chapter One and answer the study questions. 104. THE ATMOSPHERE The atmosphere is the gaseous covering of the Earth. This envelope of air rotates with the Earth but also has a continuous motion relative to the Earth’s surface, called circulation. It is created primarily by the large temperature difference between the tropics and polar regions, and is complicated by uneven heating of land and water areas by the Sun. 105. ATMOSPHERIC LAYERS If the Earth were compared to a baseball, the gaseous covering would be about as thick as the baseball’s cover (Figure 1-1).
Figure 1-1 Thickness of the Earth’s Atmosphere It is divided into layers that have certain properties and characteristics (Figure 1-2). The lowest two layers are the troposphere and stratosphere, with the tropopause being a region between these two. The troposphere is the layer adjacent to the Earth’s surface. It varies in height from an average 55,000 feet over the equator to 28,000 feet over the poles.
AVIATION WEATHER CHAPTER ONE
General Structure of the Atmosphere, and Atmospheric Temperature and Pressure 1-3
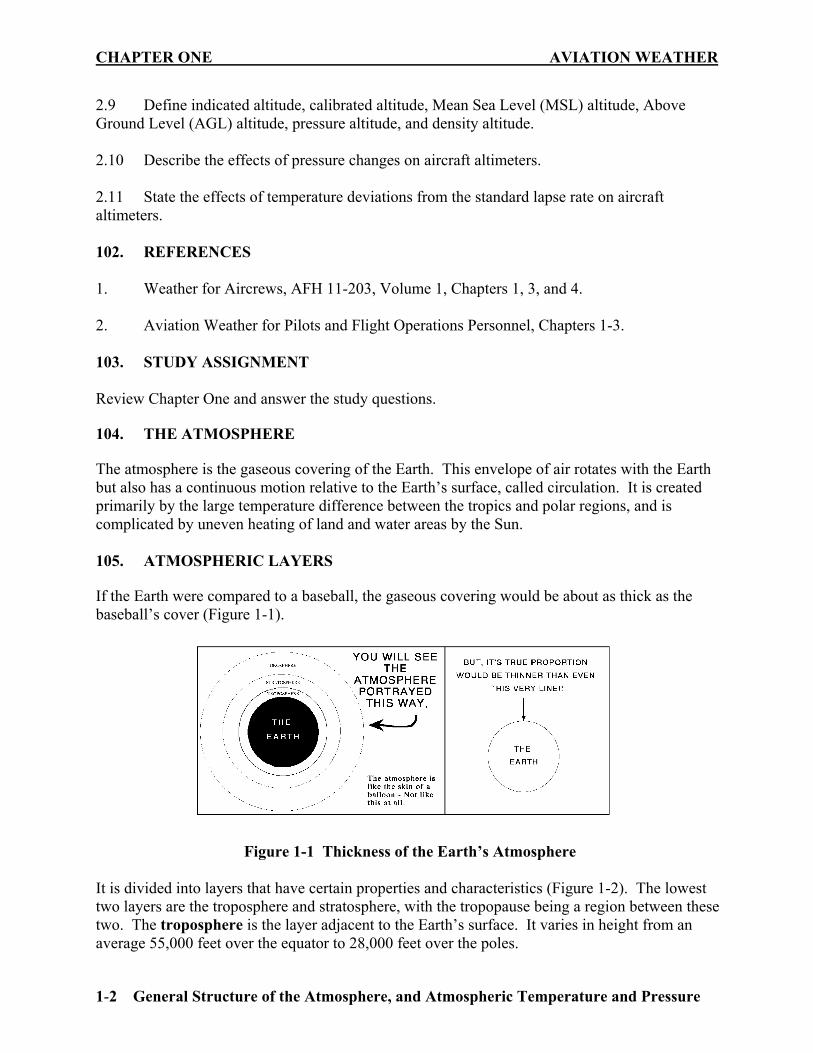
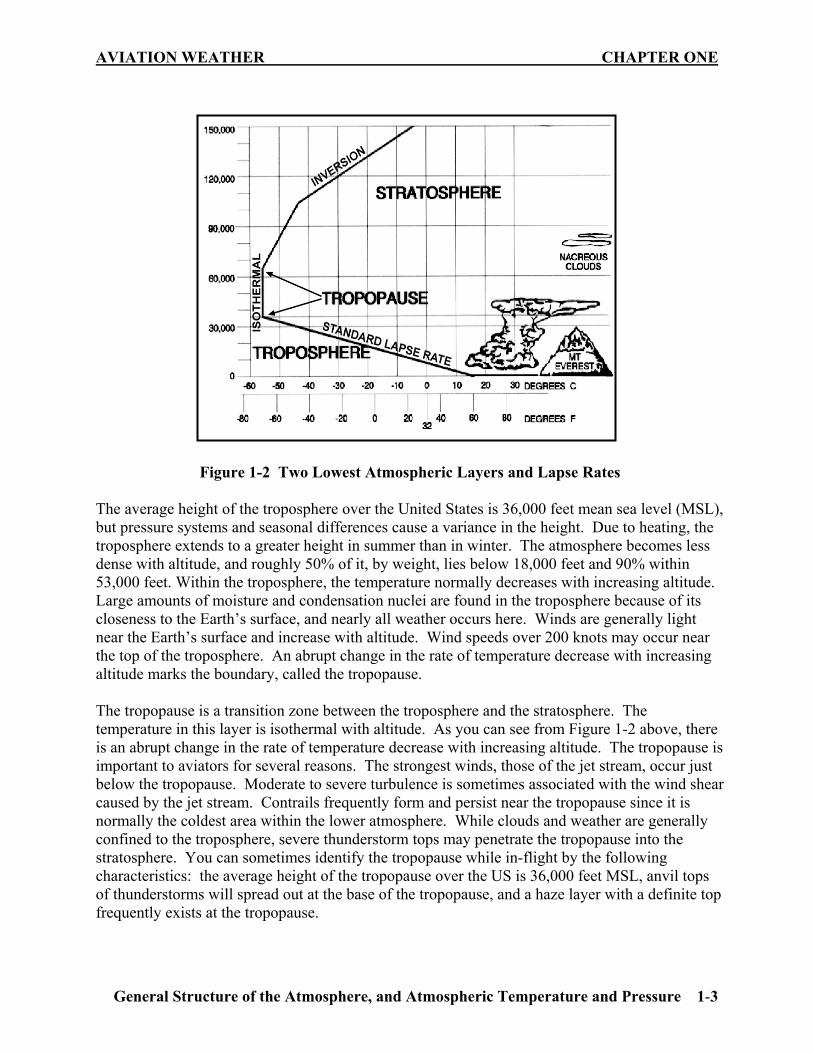
Figure 1-2 Two Lowest Atmospheric Layers and Lapse Rates The average height of the troposphere over the United States is 36,000 feet mean sea level (MSL), but pressure systems and seasonal differences cause a variance in the height. Due to heating, the troposphere extends to a greater height in summer than in winter. The atmosphere becomes less dense with altitude, and roughly 50% of it, by weight, lies below 18,000 feet and 90% within 53,000 feet. Within the troposphere, the temperature normally decreases with increasing altitude. Large amounts of moisture and condensation nuclei are found in the troposphere because of its closeness to the Earth’s surface, and nearly all weather occurs here. Winds are generally light near the Earth’s surface and increase with altitude. Wind speeds over 200 knots may occur near the top of the troposphere. An abrupt change in the rate of temperature decrease with increasing altitude marks the boundary, called the tropopause. The tropopause is a transition zone between the troposphere and the stratosphere. The temperature in this layer is isothermal with altitude. As you can see from Figure 1-2 above, there is an abrupt change in the rate of temperature decrease with increasing altitude. The tropopause is important to aviators for several reasons. The strongest winds, those of the jet stream, occur just below the tropopause. Moderate to severe turbulence is sometimes associated with the wind shear caused by the jet stream. Contrails frequently form and persist near the tropopause since it is normally the coldest area within the lower atmosphere. While clouds and weather are generally confined to the troposphere, severe thunderstorm tops may penetrate the tropopause into the stratosphere. You can sometimes identify the tropopause while in-flight by the following characteristics: the average height of the tropopause over the US is 36,000 feet MSL, anvil tops of thunderstorms will spread out at the base of the tropopause, and a haze layer with a definite top frequently exists at the tropopause.
CHAPTER ONE AVIATION WEATHER
1-4 General Structure of the Atmosphere, and Atmospheric Temperature and Pressure
The stratosphere is the layer characterized by increasing temperature with increasing altitude. This increase in temperature is due to the gas ozone, which plays a major part in heating the air at this altitude. Flying in the stratosphere is generally smooth with excellent visibility. The air is thin and offers very little resistance to the aircraft. The general lack of weather in this layer makes for outstanding flying. 106. COMPOSITION Air is a mixture of gases having weight, elasticity, and compressibility. Pure, dry air contains 78% nitrogen, 21% oxygen, a 1% mixture of ten other gases. The atmosphere also contains water vapor ranging from 0% to 5% by volume. Water vapor (for ordinary considerations) acts as an independent gas mixed with air. The atmosphere appears clear, but it contains many nongaseous substances such as dust and salt particles, pollen, which are referred to as condensation nuclei. When these particles are relatively numerous, they appear as haze and reduce visibility. 107. LAPSE RATES – TEMPERATURE AND PRESSURE The decrease in atmospheric temperature with increasing altitude is called the temperature lapse rate. In order to determine how temperature changes with increasing altitude, meteorologists send up a weather balloon to take the temperature (among other readings) at different altitudes. The resulting temperature profile is known as the environmental lapse rate (a.k.a. the existing lapse rate (ELR)). The average or standard lapse rate is 2°C (3.5°F) per 1000 feet. Even though this is the average lapse rate of the troposphere, close to the surface of the Earth the ELR may indicate an increase, decrease, or a constant temperature when measured at increasing altitudes. These different ELRs give meteorologists a clue to the type of weather that exists, and there are names for these various types of ELRs, as well. The standard lapse rate is actually a shallow lapse rate (between 1.5 and 3.0°C/1000 feet). Any lapse rate greater than 3° Celsius/1,000 feet is called a steep lapse rate. An isothermal lapse rate indicates the temperature is the same at different altitudes, and an inversion is a lapse rate where the temperature increases with increasing altitude, such as occurs in the stratosphere. Inversions can be anywhere from a few hundred to a few thousand feet thick, and stable conditions are generally found within them. These three major types of lapse rates (the standard, isothermal, and inverted) are shown in Figure 1-2 as a graph of temperature vs altitude overlaid on a profile of the atmosphere. Example of using standard lapse rates: If the temperature is –2°C at 8000 feet and the existing lapse rate is standard, at what altitude is the temperature +4°C? Algebraic difference of –2°C and +4°C = 6°C = 3000 feet 2°C/1000 feet 2°/1000 feet 8000 feet - 3000 feet = 5000 feet
AVIATION WEATHER CHAPTER ONE
General Structure of the Atmosphere, and Atmospheric Temperature and Pressure 1-5
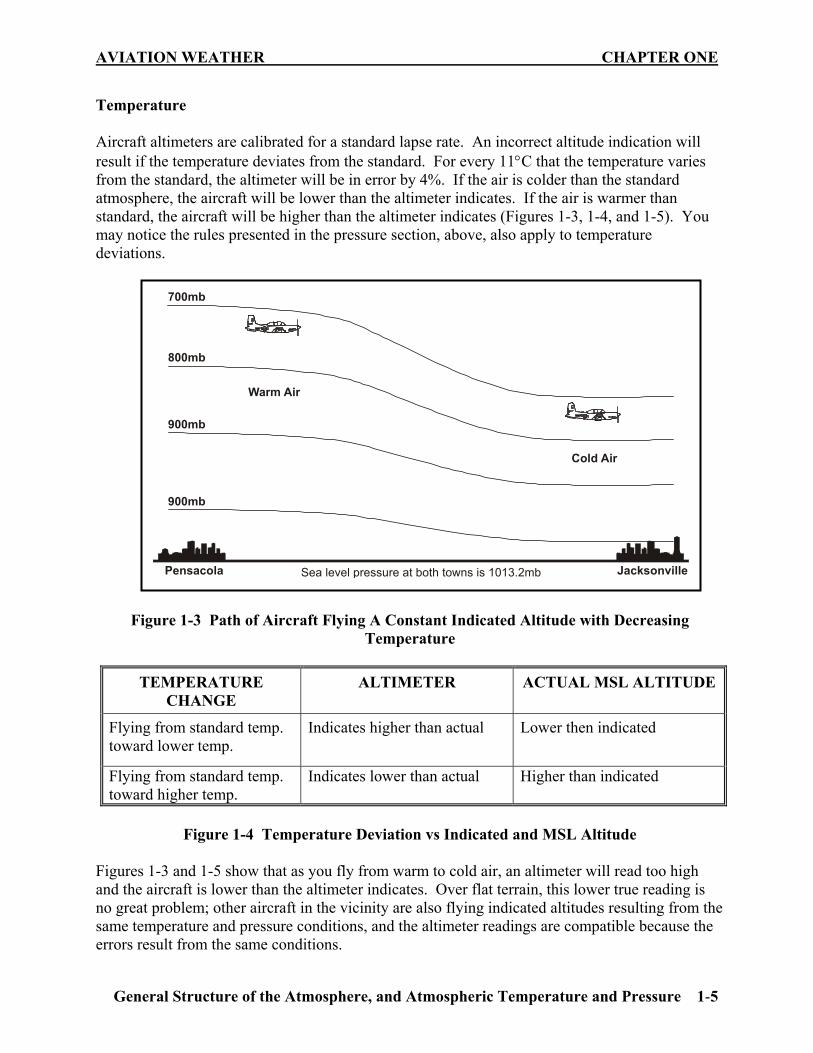
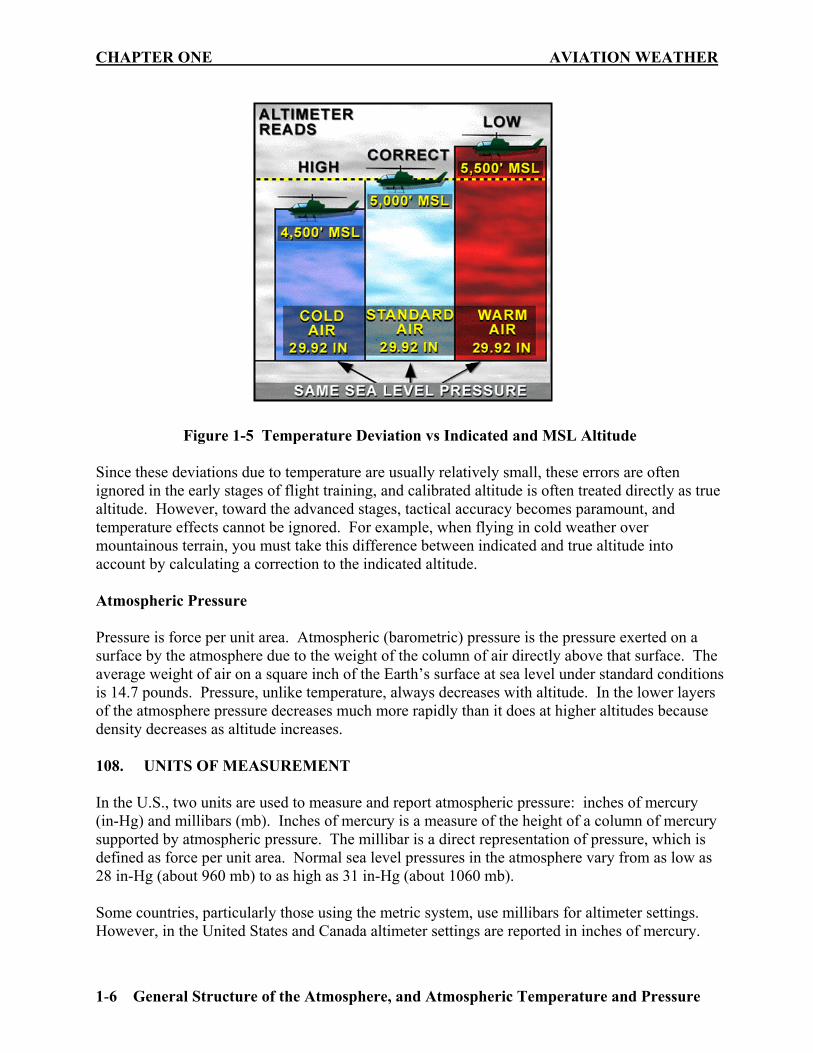
Temperature Aircraft altimeters are calibrated for a standard lapse rate. An incorrect altitude indication will result if the temperature deviates from the standard. For every 11°C that the temperature varies from the standard, the altimeter will be in error by 4%. If the air is colder than the standard atmosphere, the aircraft will be lower than the altimeter indicates. If the air is warmer than standard, the aircraft will be higher than the altimeter indicates (Figures 1-3, 1-4, and 1-5). You may notice the rules presented in the pressure section, above, also apply to temperature deviations.
Figure 1-3 Path of Aircraft Flying A Constant Indicated Altitude with Decreasing Temperature
TEMPERATURE
CHANGE ALTIMETER ACTUAL MSL ALTITUDE
Flying from standard temp. toward lower temp.
Indicates higher than actual Lower then indicated
Flying from standard temp. toward higher temp.
Indicates lower than actual Higher than indicated
Figure 1-4 Temperature Deviation vs Indicated and MSL Altitude
Figures 1-3 and 1-5 show that as you fly from warm to cold air, an altimeter will read too high and the aircraft is lower than the altimeter indicates. Over flat terrain, this lower true reading is no great problem; other aircraft in the vicinity are also flying indicated altitudes resulting from the same temperature and pressure conditions, and the altimeter readings are compatible because the errors result from the same conditions.
Warm Air
Sea level pressure at both towns is 1013.2mb
700mb
Cold Air
800mb
900mb
900mb
Pensacola Jacksonville
CHAPTER ONE AVIATION WEATHER
1-6 General Structure of the Atmosphere, and Atmospheric Temperature and Pressure
Figure 1-5 Temperature Deviation vs Indicated and MSL Altitude Since these deviations due to temperature are usually relatively small, these errors are often ignored in the early stages of flight training, and calibrated altitude is often treated directly as true altitude. However, toward the advanced stages, tactical accuracy becomes paramount, and temperature effects cannot be ignored. For example, when flying in cold weather over mountainous terrain, you must take this difference between indicated and true altitude into account by calculating a correction to the indicated altitude. Atmospheric Pressure Pressure is force per unit area. Atmospheric (barometric) pressure is the pressure exerted on a surface by the atmosphere due to the weight of the column of air directly above that surface. The average weight of air on a square inch of the Earth’s surface at sea level under standard conditions is 14.7 pounds. Pressure, unlike temperature, always decreases with altitude. In the lower layers of the atmosphere pressure decreases much more rapidly than it does at higher altitudes because density decreases as altitude increases. 108. UNITS OF MEASUREMENT In the U.S., two units are used to measure and report atmospheric pressure: inches of mercury (in-Hg) and millibars (mb). Inches of mercury is a measure of the height of a column of mercury supported by atmospheric pressure. The millibar is a direct representation of pressure, which is defined as force per unit area. Normal sea level pressures in the atmosphere vary from as low as 28 in-Hg (about 960 mb) to as high as 31 in-Hg (about 1060 mb). Some countries, particularly those using the metric system, use millibars for altimeter settings. However, in the United States and Canada altimeter settings are reported in inches of mercury.
AVIATION WEATHER CHAPTER ONE
General Structure of the Atmosphere, and Atmospheric Temperature and Pressure 1-7
109. THE STANDARD ATMOSPHERE For a standard reference, a concept called a standard day is used. In aviation, everything is related to standard day conditions at sea level, which are 29.92 in-Hg (1013.2 mb) and 15°C (59°F). In the lower atmosphere, and thus for most aviation applications, a 1000 foot increase in altitude will result in a pressure decrease of approximately 1 in-Hg (34 mb) and a temperature decrease of 2°C (3.5 °F). These values are the standard day pressure and temperature lapse rates. 110. STATION AND SEA LEVEL PRESSURE Station pressure is the atmospheric pressure measured directly at an airfield or other weather station. Sea level pressure (or Reported Altimeter Setting) is the pressure measured from the existing weather if the station were at MSL. This can be measured directly at sea level, or calculated if the station is not at sea level using the standard pressure lapse rate. Surface analysis charts, such as the one in Figure 1-6, use MSL as the reference level for the depicted isobars (to provide a common reference), even though the pressure was first measured at a weather station. This is done so that daily pressure variations associated with weather systems can be tracked as they move across the country, as mentioned above. If, instead, station pressures were used, the pressure charts would depict the inverse of the land topography, reflecting the contour lines of a map. Mountain tops would always have lows over them, and valleys would have highs. In other words, high altitude stations such as Denver would always reflect lower pressure than surrounding stations at lower altitudes regardless of the day-to-day pressure variations that occur with passing weather systems. Thus, for pressure to be meaningful, all stations (even those far from the ocean) will report sea level pressure. To calculate sea level pressure use the formula: SLP = SP + Terrain correction (2 in-Hg/1000 feet). Example: Barometer reads 28.95 and elevation at the station is 1050 feet.
SLP = 28.95 + 1.05
SLP = 30.00
Set 30.00 in your altimeter (Figure 1-7)
CHAPTER ONE AVIATION WEATHER
1-8 General Structure of the Atmosphere, and Atmospheric Temperature and Pressure
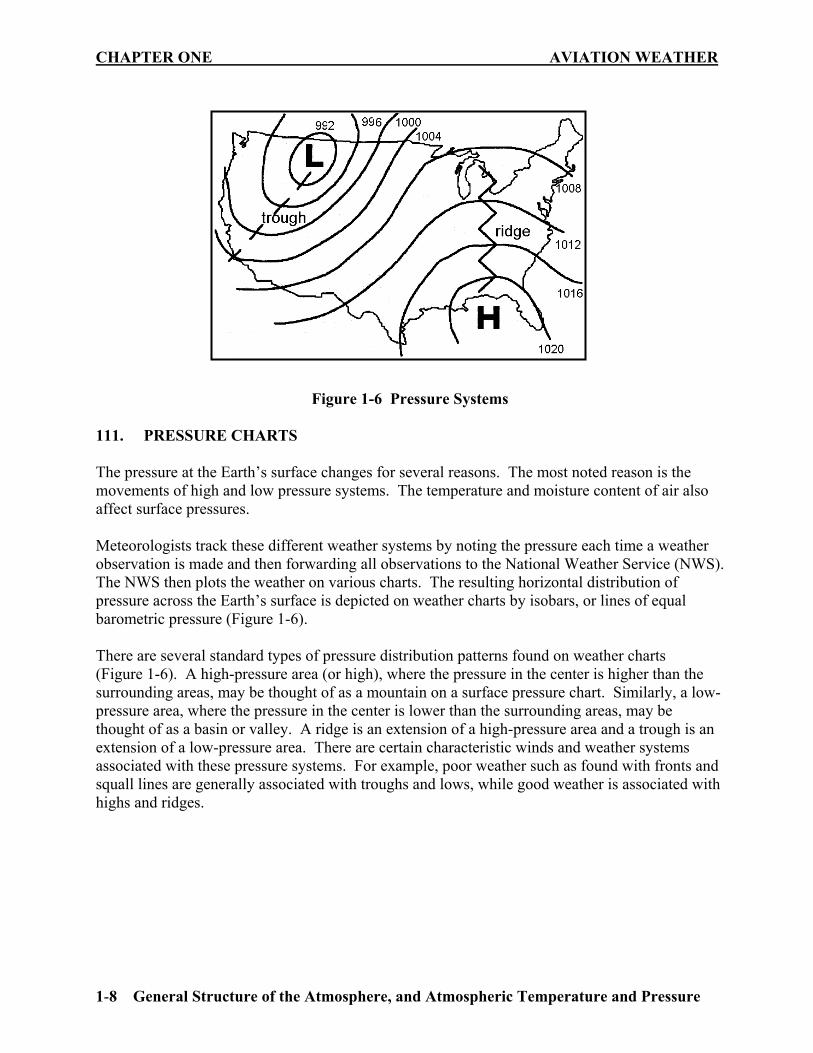
Figure 1-6 Pressure Systems 111. PRESSURE CHARTS The pressure at the Earth’s surface changes for several reasons. The most noted reason is the movements of high and low pressure systems. The temperature and moisture content of air also affect surface pressures. Meteorologists track these different weather systems by noting the pressure each time a weather observation is made and then forwarding all observations to the National Weather Service (NWS). The NWS then plots the weather on various charts. The resulting horizontal distribution of pressure across the Earth’s surface is depicted on weather charts by isobars, or lines of equal barometric pressure (Figure 1-6). There are several standard types of pressure distribution patterns found on weather charts (Figure 1-6). A high-pressure area (or high), where the pressure in the center is higher than the surrounding areas, may be thought of as a mountain on a surface pressure chart. Similarly, a low-pressure area, where the pressure in the center is lower than the surrounding areas, may be thought of as a basin or valley. A ridge is an extension of a high-pressure area and a trough is an extension of a low-pressure area. There are certain characteristic winds and weather systems associated with these pressure systems. For example, poor weather such as found with fronts and squall lines are generally associated with troughs and lows, while good weather is associated with highs and ridges.
AVIATION WEATHER CHAPTER ONE
General Structure of the Atmosphere, and Atmospheric Temperature and Pressure 1-9
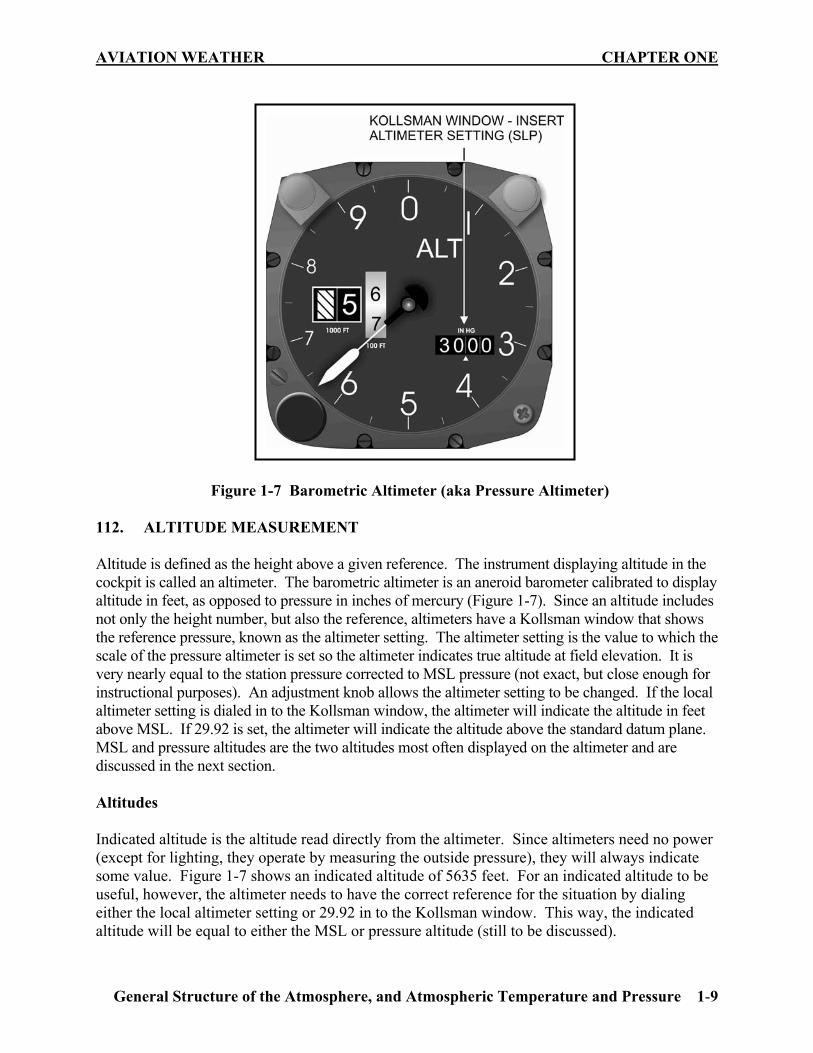
Figure 1-7 Barometric Altimeter (aka Pressure Altimeter) 112. ALTITUDE MEASUREMENT Altitude is defined as the height above a given reference. The instrument displaying altitude in the cockpit is called an altimeter. The barometric altimeter is an aneroid barometer calibrated to display altitude in feet, as opposed to pressure in inches of mercury (Figure 1-7). Since an altitude includes not only the height number, but also the reference, altimeters have a Kollsman window that shows the reference pressure, known as the altimeter setting. The altimeter setting is the value to which the scale of the pressure altimeter is set so the altimeter indicates true altitude at field elevation. It is very nearly equal to the station pressure corrected to MSL pressure (not exact, but close enough for instructional purposes). An adjustment knob allows the altimeter setting to be changed. If the local altimeter setting is dialed in to the Kollsman window, the altimeter will indicate the altitude in feet above MSL. If 29.92 is set, the altimeter will indicate the altitude above the standard datum plane. MSL and pressure altitudes are the two altitudes most often displayed on the altimeter and are discussed in the next section. Altitudes Indicated altitude is the altitude read directly from the altimeter. Since altimeters need no power (except for lighting, they operate by measuring the outside pressure), they will always indicate some value. Figure 1-7 shows an indicated altitude of 5635 feet. For an indicated altitude to be useful, however, the altimeter needs to have the correct reference for the situation by dialing either the local altimeter setting or 29.92 in to the Kollsman window. This way, the indicated altitude will be equal to either the MSL or pressure altitude (still to be discussed).
CHAPTER ONE AVIATION WEATHER
1-10 General Structure of the Atmosphere, and Atmospheric Temperature and Pressure
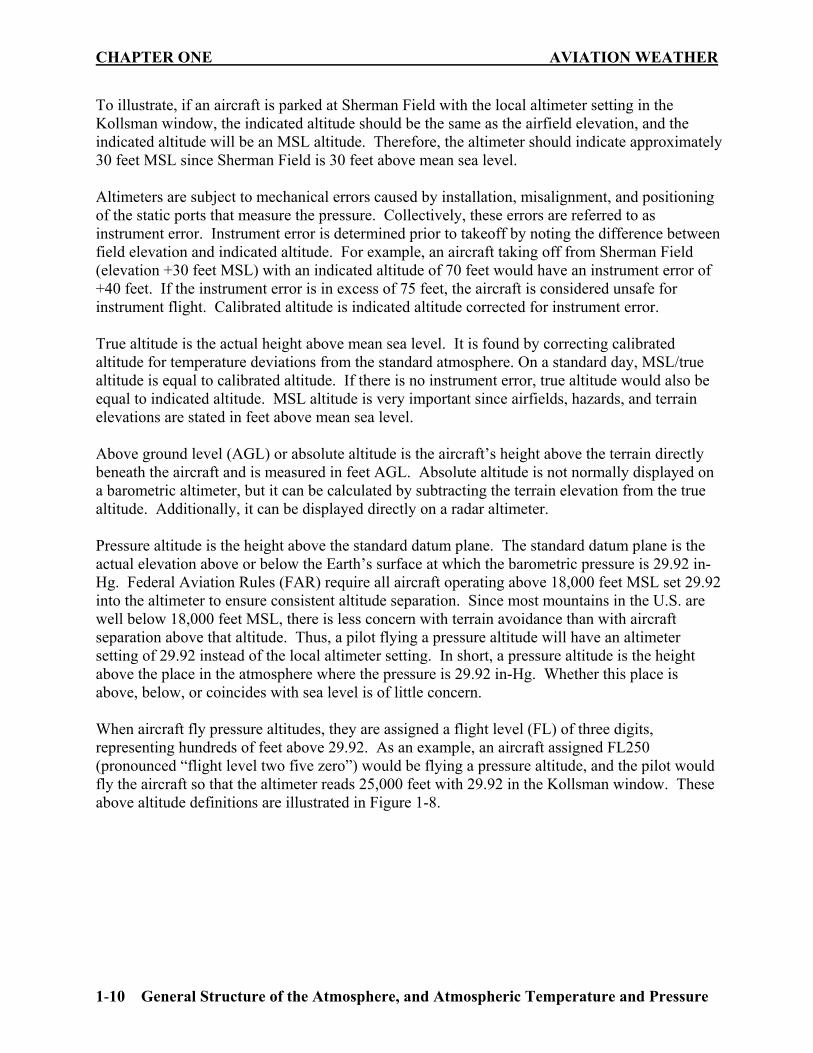
To illustrate, if an aircraft is parked at Sherman Field with the local altimeter setting in the Kollsman window, the indicated altitude should be the same as the airfield elevation, and the indicated altitude will be an MSL altitude. Therefore, the altimeter should indicate approximately 30 feet MSL since Sherman Field is 30 feet above mean sea level. Altimeters are subject to mechanical errors caused by installation, misalignment, and positioning of the static ports that measure the pressure. Collectively, these errors are referred to as instrument error. Instrument error is determined prior to takeoff by noting the difference between field elevation and indicated altitude. For example, an aircraft taking off from Sherman Field (elevation +30 feet MSL) with an indicated altitude of 70 feet would have an instrument error of +40 feet. If the instrument error is in excess of 75 feet, the aircraft is considered unsafe for instrument flight. Calibrated altitude is indicated altitude corrected for instrument error. True altitude is the actual height above mean sea level. It is found by correcting calibrated altitude for temperature deviations from the standard atmosphere. On a standard day, MSL/true altitude is equal to calibrated altitude. If there is no instrument error, true altitude would also be equal to indicated altitude. MSL altitude is very important since airfields, hazards, and terrain elevations are stated in feet above mean sea level. Above ground level (AGL) or absolute altitude is the aircraft’s height above the terrain directly beneath the aircraft and is measured in feet AGL. Absolute altitude is not normally displayed on a barometric altimeter, but it can be calculated by subtracting the terrain elevation from the true altitude. Additionally, it can be displayed directly on a radar altimeter. Pressure altitude is the height above the standard datum plane. The standard datum plane is the actual elevation above or below the Earth’s surface at which the barometric pressure is 29.92 in-Hg. Federal Aviation Rules (FAR) require all aircraft operating above 18,000 feet MSL set 29.92 into the altimeter to ensure consistent altitude separation. Since most mountains in the U.S. are well below 18,000 feet MSL, there is less concern with terrain avoidance than with aircraft separation above that altitude. Thus, a pilot flying a pressure altitude will have an altimeter setting of 29.92 instead of the local altimeter setting. In short, a pressure altitude is the height above the place in the atmosphere where the pressure is 29.92 in-Hg. Whether this place is above, below, or coincides with sea level is of little concern. When aircraft fly pressure altitudes, they are assigned a flight level (FL) of three digits, representing hundreds of feet above 29.92. As an example, an aircraft assigned FL250 (pronounced “flight level two five zero”) would be flying a pressure altitude, and the pilot would fly the aircraft so that the altimeter reads 25,000 feet with 29.92 in the Kollsman window. These above altitude definitions are illustrated in Figure 1-8.
AVIATION WEATHER CHAPTER ONE
General Structure of the Atmosphere, and Atmospheric Temperature and Pressure 1-11
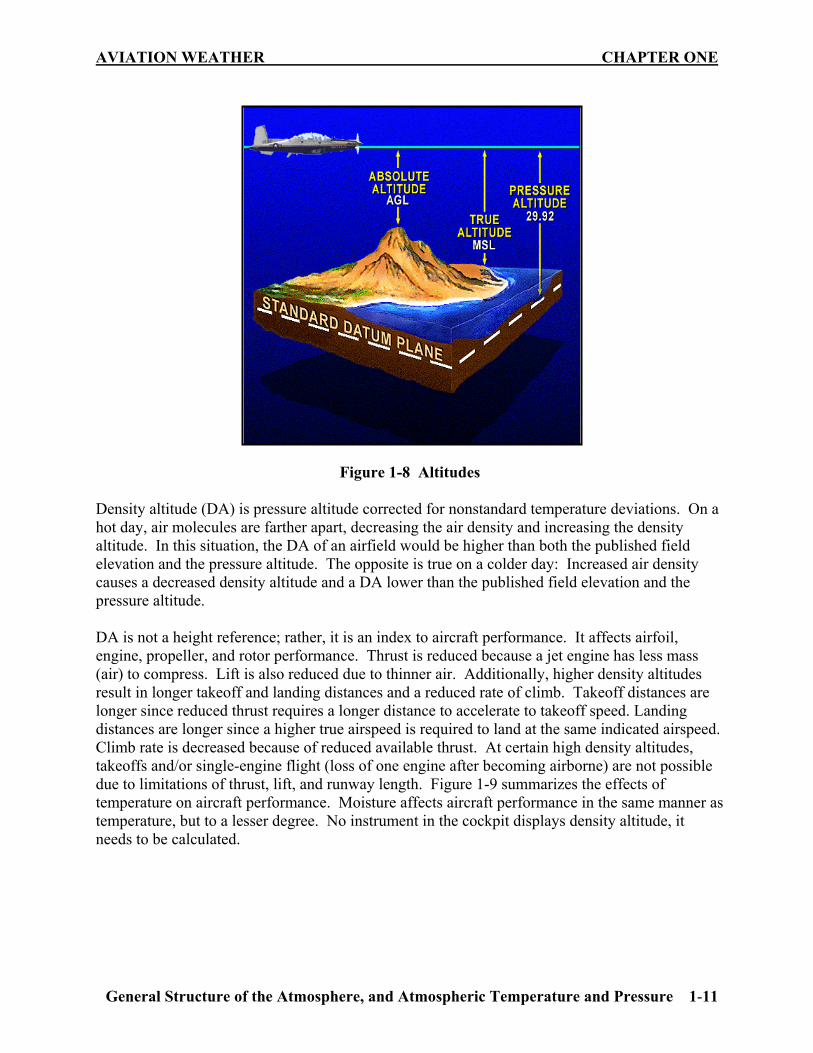
Figure 1-8 Altitudes Density altitude (DA) is pressure altitude corrected for nonstandard temperature deviations. On a hot day, air molecules are farther apart, decreasing the air density and increasing the density altitude. In this situation, the DA of an airfield would be higher than both the published field elevation and the pressure altitude. The opposite is true on a colder day: Increased air density causes a decreased density altitude and a DA lower than the published field elevation and the pressure altitude. DA is not a height reference; rather, it is an index to aircraft performance. It affects airfoil, engine, propeller, and rotor performance. Thrust is reduced because a jet engine has less mass (air) to compress. Lift is also reduced due to thinner air. Additionally, higher density altitudes result in longer takeoff and landing distances and a reduced rate of climb. Takeoff distances are longer since reduced thrust requires a longer distance to accelerate to takeoff speed. Landing distances are longer since a higher true airspeed is required to land at the same indicated airspeed. Climb rate is decreased because of reduced available thrust. At certain high density altitudes, takeoffs and/or single-engine flight (loss of one engine after becoming airborne) are not possible due to limitations of thrust, lift, and runway length. Figure 1-9 summarizes the effects of temperature on aircraft performance. Moisture affects aircraft performance in the same manner as temperature, but to a lesser degree. No instrument in the cockpit displays density altitude, it needs to be calculated.
CHAPTER ONE AVIATION WEATHER
1-12 General Structure of the Atmosphere, and Atmospheric Temperature and Pressure
HIGH TEMPERATURE OR MOISTURE
LOW TEMPERATURE OR MOISTURE
Lower Air Density Higher Air Density Higher Density Altitude Lower Density Altitude Decreased Thrust and Lift Increased Thrust and Lift Longer Takeoffs and Landings Shorter Takeoffs and Landings
Figure 1-9 Density Altitude Effects on Aircraft Performance
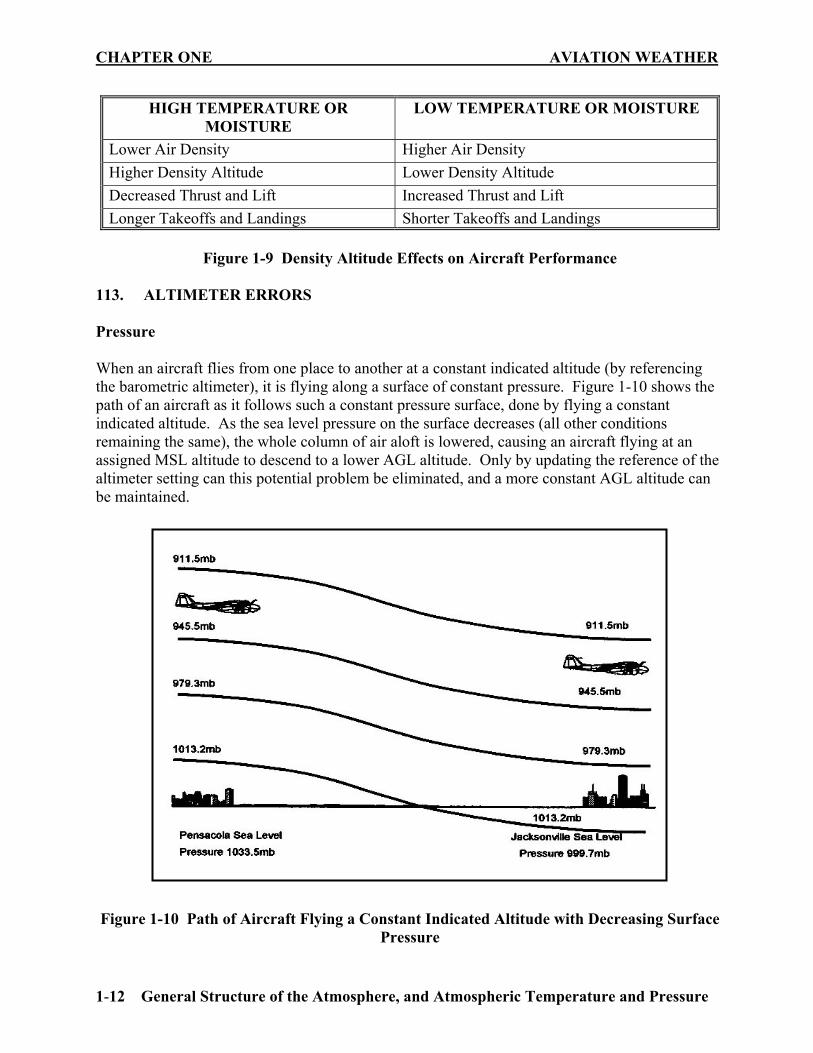
113. ALTIMETER ERRORS Pressure When an aircraft flies from one place to another at a constant indicated altitude (by referencing the barometric altimeter), it is flying along a surface of constant pressure. Figure 1-10 shows the path of an aircraft as it follows such a constant pressure surface, done by flying a constant indicated altitude. As the sea level pressure on the surface decreases (all other conditions remaining the same), the whole column of air aloft is lowered, causing an aircraft flying at an assigned MSL altitude to descend to a lower AGL altitude. Only by updating the reference of the altimeter setting can this potential problem be eliminated, and a more constant AGL altitude can be maintained. Figure 1-10 Path of Aircraft Flying a Constant Indicated Altitude with Decreasing Surface
Pressure
AVIATION WEATHER CHAPTER ONE
General Structure of the Atmosphere, and Atmospheric Temperature and Pressure 1-13
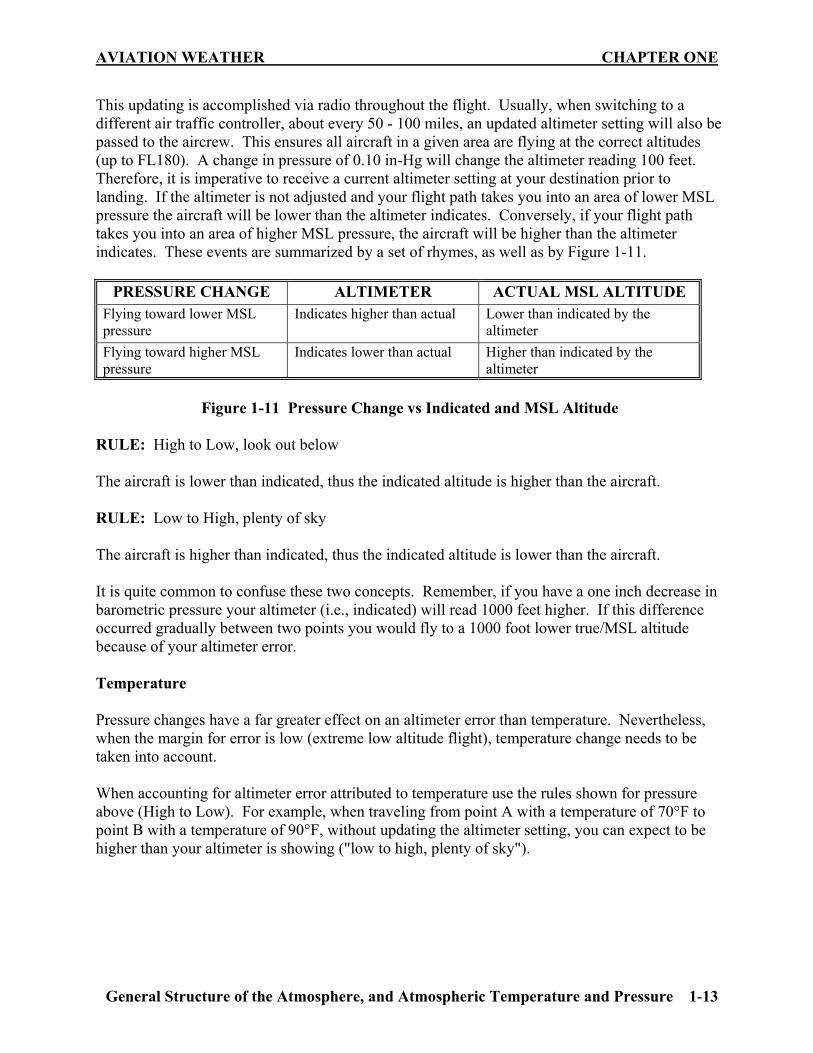
This updating is accomplished via radio throughout the flight. Usually, when switching to a different air traffic controller, about every 50 - 100 miles, an updated altimeter setting will also be passed to the aircrew. This ensures all aircraft in a given area are flying at the correct altitudes (up to FL180). A change in pressure of 0.10 in-Hg will change the altimeter reading 100 feet. Therefore, it is imperative to receive a current altimeter setting at your destination prior to landing. If the altimeter is not adjusted and your flight path takes you into an area of lower MSL pressure the aircraft will be lower than the altimeter indicates. Conversely, if your flight path takes you into an area of higher MSL pressure, the aircraft will be higher than the altimeter indicates. These events are summarized by a set of rhymes, as well as by Figure 1-11.
PRESSURE CHANGE ALTIMETER ACTUAL MSL ALTITUDE Flying toward lower MSL pressure
Indicates higher than actual Lower than indicated by the altimeter
Flying toward higher MSL pressure
Indicates lower than actual Higher than indicated by the altimeter
Figure 1-11 Pressure Change vs Indicated and MSL Altitude
RULE: High to Low, look out below The aircraft is lower than indicated, thus the indicated altitude is higher than the aircraft. RULE: Low to High, plenty of sky The aircraft is higher than indicated, thus the indicated altitude is lower than the aircraft. It is quite common to confuse these two concepts. Remember, if you have a one inch decrease in barometric pressure your altimeter (i.e., indicated) will read 1000 feet higher. If this difference occurred gradually between two points you would fly to a 1000 foot lower true/MSL altitude because of your altimeter error. Temperature Pressure changes have a far greater effect on an altimeter error than temperature. Nevertheless, when the margin for error is low (extreme low altitude flight), temperature change needs to be taken into account. When accounting for altimeter error attributed to temperature use the rules shown for pressure above (High to Low). For example, when traveling from point A with a temperature of 70°F to point B with a temperature of 90°F, without updating the altimeter setting, you can expect to be higher than your altimeter is showing ("low to high, plenty of sky").
CHAPTER ONE AVIATION WEATHER
1-14 General Structure of the Atmosphere, and Atmospheric Temperature and Pressure
STUDY QUESTIONS General Structure of the Atmosphere, and Atmospheric Temperature and Pressure 1. At the top of the troposphere, there is a transition zone called the ____________. a. tropopause b. ozone layer c. atmospheric layer d. stratosphere 2. The two lower layers of the atmosphere are the ______________. a. tropopause and mesosphere b. troposphere and stratosphere c. tropopause and stratopause d. mesosphere and thermosphere 3. Which one of the following best describes the flight conditions found in the stratosphere? a. The strongest winds occur in the stratosphere. b. Contrails frequently form and persist in this part of the atmosphere. c. 50% of the atmosphere, by weight, is found in the stratosphere. d. Flying in the stratosphere is generally smooth with excellent visibility. 4. What is the standard temperature lapse rate of the atmosphere in degrees Celsius per 1000 feet? a. 1.5 b. 2.0 c. 3.0 d. 3.5 5. Using the standard lapse rate, a pilot flying at 10,000 feet MSL and at a temperature of -8°C should do what to find an altitude at which the temperature is +4 °C? a. Descend to approximately 2000 feet MSL. b. Descend to approximately 4000 feet MSL. c. Descend to approximately 6000 feet MSL. d. Climb to 15,000 feet MSL.
AVIATION WEATHER CHAPTER ONE
General Structure of the Atmosphere, and Atmospheric Temperature and Pressure 1-15
6. A condition where the air temperature aloft is higher than that of the lower atmosphere is generally referred to as____________________. a. a low-pressure area b. turbulence c. a temperature inversion d. convection currents 7. Which one of the following best describes the change in atmospheric pressure with increasing altitude? a. Increases b. Decreases c. May increase or decrease, depending on weather conditions d. Remains constant 8. Which one of the following correctly lists the standard day conditions of sea level pressure, temperature, pressure lapse rate, and temperature lapse rate? a. 30.00 in-Hg, 15°C, 1.5 in-Hg/1000 feet, 3.0°C/1000 feet b. 29.92 in-Hg, 59°C, 34 in-Hg/100 feet, 5°C/100 feet c. 29.92 in-Hg, 15°C, 1 in-Hg/1000 feet, 2°C/1000 feet d. 30.02 in-Hg, 20°C, 2 in-Hg/1000 feet, 1°C/1000 feet 9. The horizontal distribution of pressure on the Earth’s surface is depicted on weather charts by_______________. a. isotherms b. isotachs c. isogonic lines d. isobars 10. The weight of the air mass over any point on the Earth’s surface defines_____________. a. density altitude b. atmospheric pressure c. pressure altitude d. true weight 11. The quantities 1013.2 mb and 29.92 in-Hg are two different expressions for the_________. a. atmospheric density at a standard air temperature of 15°C b. atmospheric pressure at sea level at an air temperature of 0°C c. standard atmospheric pressure at mean sea level and at a standard air temperature of
15°C d. weight of the atmosphere at the surface of the Earth
CHAPTER ONE AVIATION WEATHER
1-16 General Structure of the Atmosphere, and Atmospheric Temperature and Pressure
12. In the lower 5000 feet of the atmosphere, a decrease of one inch of mercury in atmospheric pressure would cause a change in an altimeter reading of approximately ________ feet (assuming constant elevation and altimeter setting). a. minus 100 b. plus 100 c. minus 1000 d. plus 1000 13. Which one of the following correctly describes the meteorological feature of a trough? a. An elongated area of relatively low pressure. b. An elongated area of relatively high pressure that extends from the center of a high
pressure area. c. An area where the pressure in the center is higher than the surrounding areas. d. A long shallow often V-shaped receptacle for the drinking water or feed of domestic
animals. 14. Which one of the following items would have a value closest to that used as a Kollsman window setting for an altimeter in the U.S. (assuming an airfield above sea level)? a. Station pressure b. Station temperature c. AGL pressure d. Sea level pressure 15. The height of an aircraft above the ground is known as_______________. a. MSL/True altitude b. AGL/absolute altitude c. indicated altitude (IA) d. pressure altitude (PA) 16. Which one of the following types of altitudes would be assigned in the U.S. above 18,000 feet MSL? a. MSL/True altitude b. AGL/absolute altitude c. Indicated altitude (IA) d. Pressure altitude (PA) 17. Density altitude is_____________. a. the same as an MSL/True altitude b. pressure altitude corrected for nonstandard field elevations c. an indicator of aircraft performance d. the height above the standard datum plane
AVIATION WEATHER CHAPTER ONE
General Structure of the Atmosphere, and Atmospheric Temperature and Pressure 1-17
Situation for items 18-20: The altimeter setting at Randolph AFB is 29.85 in-Hg, and at Vance AFB it is 30.15 in-Hg. A pilot sets the altimeter correctly at Randolph and flies to Vance at an indicated altitude of 5000 feet without changing the altimeter setting. 18. Assuming a standard lapse rate, what is the MSL/true altitude when flying over Vance at the assigned indicated altitude? a. 4700 feet b. 5000 feet c. 5030 feet d. 5300 feet 19. If Vance’s elevation is 1307 feet MSL, what is the AGL/absolute altitude over Vance? a. 3393 feet b. 3693 feet c. 3723 feet d. 3993 feet 20. If the pilot lands successfully at Vance (elevation 1307 feet MSL) without resetting the altimeter, what altitude will the altimeter indicate? a. 0 feet b. 1007 feet c. 1307 feet d. 1607 feet 21. When flying a constant indicated altitude of 4000 feet from an area where the outside air temperature is 10°C to an area that is 15°C, the aircraft would be at_______________. a. a lower altitude than indicated b. the altitude indicated c. a higher altitude than indicated d. the absolute altitude