Embed Size (px)
Citation preview

Chapter-ll Distribution of Ethnic Groups in Assam

Chapter-II
DISTRIBUTION OF ETHNIC GROUPS IN ASSAM
2.1 Generalities
In this chapter, an attempt has been made to understand the
spatial distribution of the population classified by ethnic groups in Assam
while trying to understand the distributional pattern of Deoris. The study
of regional distribution of different ethnic groups will be helpful to
identify the areas of concentration of tribal segments. State and district
level census data of different segments are analyzed. The spatial changes
in their distribution in different time points are compared by different
diagrams, tables and maps. The North-Eastem part of India comprises of
many tribal communities each with its perceived separate cultural identity.
The state of Assam has a number of racial and ethnic groups with their
own specific and traditional cultures. The tribes of Assam display a very
high degree of ethnic diversity in their racial composition and distribution.
Ethnic diversity has led to spatial distribution of population in Assam.
27

2.2 Physical Settings of Assam
Assam can be broadly divided in to three physical units: the
north-eastern, central hill tracts, and the valleys of the Barak and
Brahmaputra. On the north of Assam lie the Eastern Himalayas reaching
the highest altitude in the northeast at Namcha Burwa, at 7,756 feet above
the mean sea level. The different parts of the sub Himalayan region are
named after the semi Mongoloid tribes who inhabit these hills such as the
Bhutias, Akas, Duflas (Nishis), Abors (Adis), Miris (Mishings) and
Mishimis. This range continues towards the southeast and joins the Patkai
hills, the natural boundary between Assam and Myanmar. The Assam
Range in the middle is occupied from the east to the west by the various
tribes such as the Nagas, the Jaintias, the Khasis and the Garos. On the
south lie Chin and Lushai (Mizo) Hills, Chittagong Hill Tract and Hill
Tipperah. Though surrounded by mountain barriers, Assam were linked
with the neighboring countries by several routes. The Assam-Burma route
helped the migration of the racial elements from Southeast Asia. The
Ahoms and other Tibeto-Burmans followed the Patkai route from the
northeast. The hill passes of Bhutan, Tibet and Nepal were probably used
by certain waves of the Tibeto- Burman migrants (Barua, 1960). The most
frequented route was on the west; the valley of the Ganges and the
Brahmaputra through which the Aryans are supposed to have penetrated in
28

to Pragjyotisha-Kamrupa. Assam is, thus, located in one of the great
migration routes of mankind.
The physical divisions of Assam have led to the emergence of
two distinct ethnic, cultural and linguistic groups, namely the dwellers of
the hills and those of the plains. It is said that the process of
^Aryanisation' or ^Sanskritizatiori' was nearly completed in the
Brahmaputra Valley by 1200 A.D (Baruah, 1991). This was not the case
of all those who have been living for centuries far away from the
mainstream, in a relatively isolated and inaccessible and less fertile and
less agriculturally productive regions of forests, hills and mountains. They
continued to maintain their identity in speech, tradition, customs, usages,
institutions and religious beliefs. Land was the backbone of their
economy, but the nature and extent of land forced them to practice
Jhuming or shifting cultivation. There had been frequent interaction
between the people of the hills and the plains particularly in economic
spheres notwithstanding the natural barriers like the hill tracts and rivers
(Logan, 1848). The hill men depended largely on the plains for their
foodstuff and other necessities, and the plainsmen provided them with
their requirements. Some of them even preferred to settle in the plains or
at the foothills, and consequently there had been a process of assimilation-
racial, linguistic and cultural, though at very limited scale.
29

2.3 Distribution of Population in Assam
Demographic characteristics of the population in Assam show a
striking variation across different regions. The spatial distribution of
population as well as the density is getting accentuated with changes in the
ethnic composition and migration from neighboring states and other
countries. An understanding of the changing distribution of population is
expected to throw some light on the tendency to resettle of population in
the state.
2.3.1 State Level Pattern of Population Distribution
Distribution of population in Assam is greatly affected by
various factors, such as Physiography (fertile land), socio-cultural and
demographic elements. The 1901 census enumerated 3,290 thousand
persons on Assam as a whole with an overall density of 42 persons per
square kilometers, and with a sex ratio of 918 females per thousand
males. By the year 1911, the total population increased to 3,849
thousand persons; the density increased to 49 persons but the sex ratio
decreased to 915 females per thousand males. The population
increased rapidly thereafter. The census years 1971 enumerated 14,625
thousand people in Assam with an overall density of 186 persons with
a sex ratio of 896 females per thousand males. By the year 2001, the
30

population increased to 26,638 thousand persons, and the density, too,
nearly doubled. The sex ratio reached to 932 (Table-2.1 and Fig.-2.1).
This figure directly indicates the role played by immigration in
increasing the population as well as the density in the state of Assam.
The phenomenal increase in population since 1971 clearly indicates
the role played by immigration in increasing the population as the
natural increase cant singularly explained such a large rise.
Table: 2.1Population Trend in Assam, 1901-2001 Census Years
1901 1911
1921
1931 1941
1951 1961 1971 1981*
1991
2001
Population in Thousand 3290 3849
4637
5560
6695
8029 108375 14625 18041
22414
26638
Sex Ratio 918 915 897 875 875 868 869 896 NA 923 932
*The 1981 Census is not conducted in Assam. The population figure is based on Interpolation. Source: Census of Assam, 1971, 1991 and 2001
31

Population Trend in Assam, 1901-2001
30000
25000 -
o 20000
15000
g- 10000 a.
5000
I Population
M M I I I 1901 1921 1941 1961
Census Years
1981 2001
Figure: 2.1
2.3.2 Growth of Population in Assam
The study of population growth is directly linked to the density
of population. Density of population depends on the growth rate of
population m a particular time frame. However, the study of population
growth and density may provide valuable insights in the distribution of
Deoris.
32
-- 'iiw»'<liUfi^Wiu»<aK.-J=»JiEa>w»- '^•^'U^^l^

state
A S S A M
Census Year
1901 1911 1921 1931 1941 1951 1961 1971 1981 1991 2001
Population in
Thousand
3290 3849 4637 5560 6695 8029 10837 14625 18041 22414 26638
Table: 2.2 Growth of Population in Assam, 1991-2001 Decadal Growtli
Absolute -
559 788 923 1135 1134 2808 3788 3416 4373 4224
Percent -
16 99 20 47 1991 2041 16 94 34 97 34.95 23 36 24.24 18 85
Change in Decadal Growth
Absolute Percent --
229 3 48 135 -0 56 212 050 -I -3 47
1674 18 03 980 -0 02 -372 -1159 957 0 88 -149 -5 39
Average annual exponential growth rate
-1 57 1 86 1 82 1 86 1 82 3 00 3 00 2 10 2 17 1 73
Progressive growth rate over 1901
-16.99 37 46 57.37 77 78 94 72 129.69 164 40 188.00 212.24 231.09
Source: Census of Assam, 1971-2001. The 1981 Census could not be held in Assam. The population figures for 1981 has been worked out by Interpolation
The growth of population implies the changes in the size of
residents of region during a specific period of time; whether the change is
positive or negative. This is mainly due to the differential birth and death
rates as well as due to the effects of migration. Assam had a total
population of 26638 thousand person in 2001, which increased from a
meager 3290 thousands in 1901, with a growth rate nearly 710 percent
during 1901-2001 (Table-2.2 and Figure-2.2). The growth trends have an
alteration of ups and downs after every decade in terms of percentage. The
rate of growth in each decade has been positive, though the extent of
growth has been varying.
33

Assam: Growth of Population (1901-2001)
30000
I 25000 3 £ 20000 -\
•E 15000 c •2 10000 n g. 5000 o Q- n
1 2 3 4 5 6 7 8 9 10 11 12
Census Year
L ^
Figure: 2.2
The growth rate greatly fluctuated between 1901 till about 1951
ranging between 15 and 20 percent. The population grew at a much faster
rate in the following two decades up to 1971 the rate of growth as high as
34 percent or more during these two decades. There has been a slowing
down in the rate of population growth since 1981. The 2001 census
records a much lower rate of population growth at 18.85 percent only. It
may be noted that Assam's population growth has never been uniform as
the growth rates have fluctuated alarmingly over the decades since the turn
of the 20' century. The most notable rise in the population however took
place during 1951 to 1971.
34

Table: 2.3 Assam: Growth of Population by Ethnic Groups, 1951-2001
Census Year
2001 1991 1971 1961 1951
Total Population in Assam
26655528 22414322 14957542 11872772 8029505 Source: E
Scheduled Caste Population
1825949 1659412 912639 732756 313219
)epartment o:
% of SC to Total Population
6.85 7.40 6.10 6.17 3.90
Scheduled Tribe Population
3308570 2874441 1919947 2068364 1867113
% of ST to Total Population
12.41 12.82 12.84 17.42 23.25
Non-Scheduled population
21521009 20467469 12124956 9071652 5849173
'Plain Tribes and Backward Classes, Assam
% of Non-Scheduled population to Total population 80.74 91.31 81.06 76.41 72.84
The above table shows the percentages of SC, ST, and Non-
Scheduled population to total population of Assam from 1951 to 2001.
SC population constitutes 3.90 percent in 1951 while the percentages for
ST and Non-Scheduled population are 23.25 and 72.84 respectively. On
the other hand 2001 census shows that the percentages of SC, ST and
Non-Scheduled population are 6.58, 12.41 and 80.74 respectively. The
decadal growth of the populations of different ethnic groups is almost
proportionate from 1951 to 2001. Share of SC population is below 10
percent in all the decades while ST population is between 10 to 20
percent (except 1951) and Non-Scheduled population is highest in all the
decades except 1951(72.84%) and 1961(76.41%) having more than 80
percent.
35

Assam: Growth of Population by Ethnic Groups (1951-2001)
Q % of SC to Total Population
B % of ST to Total Population
8 % of Non-Scheduled population to Total population
2001 1991 1971 1961 1951 Census Years
Figure: 2.3
From the census data for 1971, 1991 and 2001 in the Table: 2.4 it
can be compared the different percentages of Scheduled caste. Scheduled
Tribe, Non-Scheduled and Deori population in Assam.
Table2.4 Assam: Distribution of Population by Ethnic Groups (1971-2001)
State
Assam
Census Year
1971 1991 2001
Scheduled Caste
6.24 7.40 6.85
Scheduled Tribe
10.98 12.83 12.41
Non-Scheduled 82.78 79.77 80.70
Deori
1.28 1.25 1.34
Source: Department of Plain tribes and Backward Classes, Assam
36

Assam: Distribution of Population by Ethnic Groups (1971-2001)
Deori
a. Non-Scheduled 3 O O .a Scheduled Tribe
HI
Scheduled Caste
02001
B1991
B1971
20 40 60 80 Percentage of Population
100
Figure: 2.4
As the population of Deoris are small as compared to other
tribes, its percentage to total population lies between 1 and 2 only. But it
is noteworthy that in the census years, district level data with detailed
village populations for Deoris was not conducted. There are many non-
census Deori villages where a large number of Deori population live.
Hence the census data mentioned here cannot be considered as actual
data.
An mteresting fact of the ethnic composition of the population
relates to large increase in the share of the scheduled caste population
between 1971 and 1991, and substantial decrease in their population in
the following decade. The share of scheduled tribe population also
37

showed a very increase during 1971-91 decades but decreased marginally
in the following decade.
The increase in the proportion of scheduled population during
1971-91 decades is followed by a corresponding decrease in the share of
the Non-Scheduled population, which declined, from 82.78 percent in
1971 to 79.77 percent in 1991. The proportion of this group has
marginally increased in the year 2001 (Table- 2.4 and Fig.2.4). In the last
thirty years, the share of tribal population shows a positive change
compared to other ethnic groups in the state as a whole.
There are about 23 Scheduled Tribes (Hills& Plains) in Assam
residing in different districts. (Appendix-Ill) shows the population of
different Scheduled Tribes in Assam during 1971, 1991 and 2001 Census.
Boro-Boro Kachari group has the highest proportion of population among
all the tribes throughout the three decades (Fig: 2.5). They shared 33.36
percent of total tribal population in 1971. This figure increased to 44.07
and 44.08 percent during 1991 and 2001 respectively. Miri (Mishing) is
the second largest group having 13.52 and 16.27 percent of tribal
population in 1991 and 2001. This figure for the year 1971 was 13.52. The
third largest group is Mikir (Karbi). Their percentage to total ST
population in 1971 was 9.23 and it is increased to 9.94 during 1991 and
38

2001. Deoris shared 1.20 percent of total tribal population of Assam in
1971 census. During 1991 census their proportion was 1.25 percent and in
2001 it increased to 1.34 percent. Lekher, Synteng and Pawi are the
smaller groups having less than 0.05 percent of tribal population.
Figure: 2.5
2.3.3 Growth of Literacy Rates among the Tribes
The literacy rates among different tribes living in Assam
(Appendix-II and Fig-2.6) reveals that any Mizo tribes (Lushai) have the
highest literacy rate (66.53%) and Hmar having 61.43 percent in the
second position. The main reason of this is that these tribes are found in a
small quantity (Lushai-1031, Hmar-11,189). Total eight tribes have the
literacy rate above 50 percent.
39

In case of Deoris, a sharp rise in literacy rate is noticed from
1971(27.72%) to 1991(54.13%). The lowest percentage in 1991 is found
among Chakmas (11.84). Besides Chakma, there are five other tribes
having the literacy rate below 30 percent. These are Synteng (22.28%),
Khasi and Jayantia (24.56%), Hojai (14.9%), Hajong (26.19%), Dimasa
(22.3%) respectively. An increasing trend of literacy rate is found in most
of the tribes. The educational policies adopted by the Govt, of India as
well as Assam have influenced the rise of literacy rate.
Assam : Literacy Rates of Scheduled Tribes in 1971 -1991 70 T-
§ 40
« 20 IS I
ji • , 1 ; 5 t i l ;
11971 11991
. x < ^ '
Scheduled tribes r̂
Figure: 2.6
.^' .<i? ^^"
40

2.3.4 Growth of Language Speakers among the Tribes of Assam
Each of the tribes of Assam has their own dialect or language.
But in course of time the numbers of their own language speakers are
decreasing gradually as a result of acculturation and assimilation with
greater Assamese society. So it is noticed that, there is a difference
between actual population and number of dialect speakers. The language
wise distribution of scheduled tribe population as per 1991 census is
shown in (Table: 2.5). It would be relevant to compare the figures of
language speakers among the tribes as per 1971 census.
Table: 2.5 Frequencies of Lang Name of the Languages
Boro/ Bodo Deori Dimasa Garo Hmar Mikir/Karbi Koch Kuki Lalung Lushai/Mizo Miri/Mishing Rabha Rengma
Total (1971)
6,40,459 23080 39342 9139 5380 177194 NA 13524 95,609 711 259551 138630 NA
uage Speakers among the Tri Language speakers
(1971) 5,33,713 12,190 33,507 7,600 4,836 161354 NA 5,098 9,954 4,00 1,77,226 32,400 NA
Total (1991)
1267015 35849 65009 17998 11189 285811 NA 21883 143746 1031 467740 236931 NA
besof Assam, 1971,1991 Language speakers (1991)
11,84,569 15,955 64,654 14,779 9,054 2,55,032 3,596 15,209 32,633 719 3,81,562 1,12,424 1,35,905
Source: Census of India 1971 and 1991
41
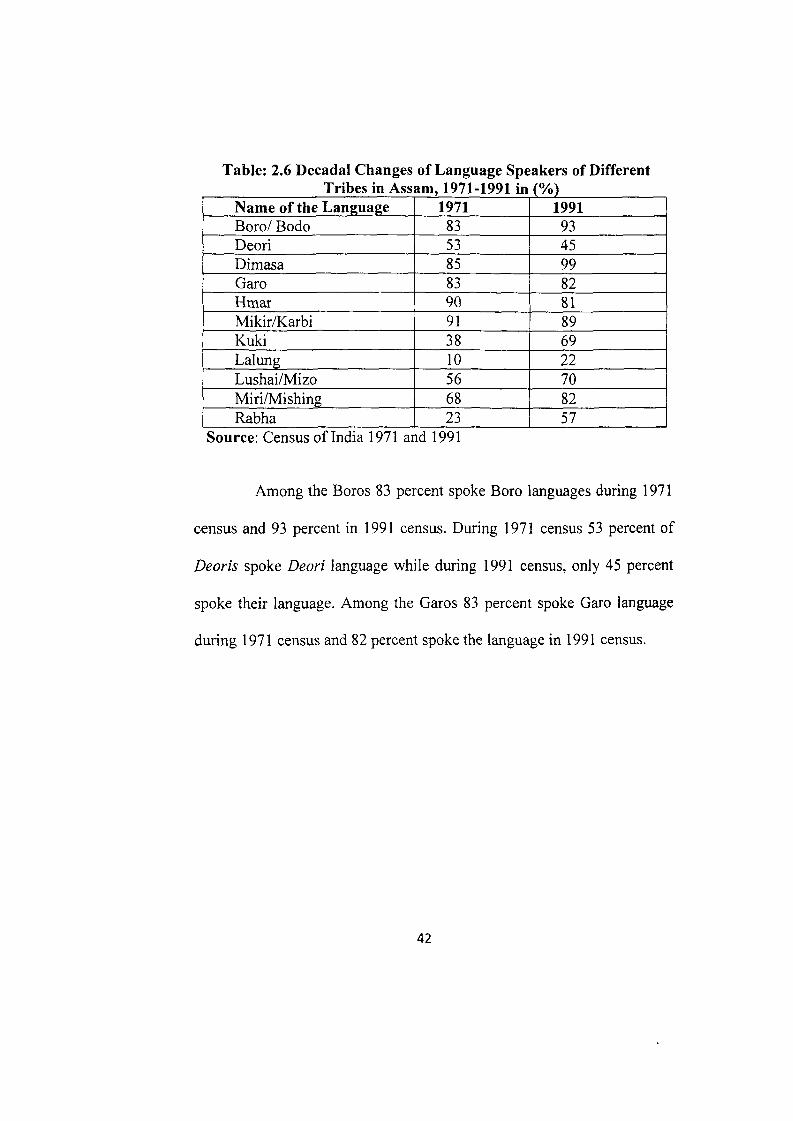
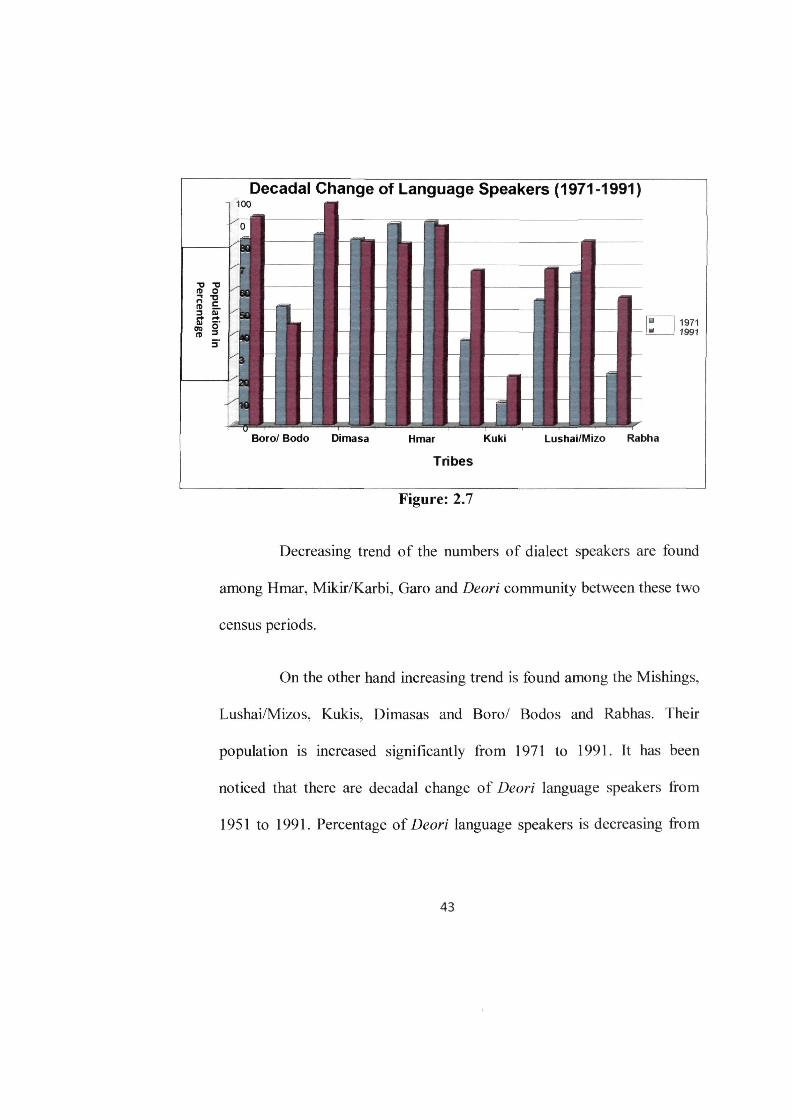
Table: 2.6 Decadal Changes of Language Speakers of Different Tribes in Assam, 1971-1991 in (%)
Name of the Language Boro/ Bodo Deori Dimasa Garo Hmar Mikir/Karbi Kuki Lalung Lushai/Mizo Miri/Mishing Rabha
1971 83 53 85 83 90 91 38 10 56 68 23
1991 93 45 99 82 81 89 69 22 70 82 57
Source: Census of India 1971 and 1991
Among the Boros 83 percent spoke Boro languages during 1971
census and 93 percent in 1991 census. During 1971 census 53 percent of
Deoris spoke Deori language while during 1991 census, only 45 percent
spoke their language. Among the Garos 83 percent spoke Garo language
during 1971 census and 82 percent spoke the language in 1991 census.
42
Decadal Change of Language Speakers (1971-1991)
1971 1991
Boro/ Bodo Dimasa Hmar Kuki
Tribes
Lushai/MJzo Rabha
Figure: 2.7
Decreasing trend of the numbers of dialect speakers are found
among Hmar, Mikir/Karbi, Garo and Deori community between these two
census periods.
On the other hand increasing trend is found among the Mishings,
Lushai/Mizos, Kukis, Dimasas and Boro/ Bodos and Rabhas. Their
population is increased significantly from 1971 to 1991. It has been
noticed that there are decadal change of Deori language speakers from
1951 to 1991. Percentage of Deori language speakers is decreasing from
43

1961 (65.60%) to 1971(52.81%) and from 1971 to 1991(44.50%)
correspondingly.
?able: 2.7 Decadal Variation of Deori Language Speakers in Assam Census year
1891 1931 1951 1961 1971 1981 1991
Total Deori population
4000 NA 12503 13876 23080
No census 35849
Number of Deori language speakers
NA 4000 6715 9103 12190 No census 15955
Percentage of Deori language speakers to total Deori population
53 71 65 60 52 81 No census 44 50
Source: Department of plains tribe and backward classes, Assam, 2001 NA-Not Available
Decadal Variation of Deori Language Speakers (1951-1991)in Percentage
c
a. a a.
1951 1961 1971 1991
Figure: 2.8
44

2.3.5 Distribution of Rural Population in Assam
According to the 1971 census, more than 91 percent (91.17%) of
the population of Assam lived in rural areas. The fact that the rural
component of the population in Assam decreased to 88.89 percent in 1991
shows little changes in the rural urban composition of the population in
two decades. Even the 2001 census records 87.10 percent rural population
displaying very little change in the rural urban composition of the
population in the last decade.
The following table reveals that the vast majority of the
population irrespective of the ethnic differentiation lived in rural areas in
the districts. The Scheduled Tribe population in sharp contrast remains
vastly rural in their population composition and there is a little inter-
district variation in this feature of population composition.
Table: 2.8 Assam Proportion of Rural Population by Ethnic Groups 1971-1991 (in %)
District
1 .Goalpara 2. Kamrup 3. Darrang 4, Nagaon 5,Sibsagar 6.Lakhimpur 7.K.Anglong 8.N.C. Hills 9. Cachar Assam
Schedulec 1971 100 98.96 99.64 99.66 99.59 98.88 99.29 98.42 99.65 99.36
1991 98.20 94.79 98.98 96.52 98.57 97.63 93.41 88.24 98.29 96.62
Tribe Change -1.8 -4.17 -0.66 -3.14 -1.02 -1.25 -5.88 -10.18 -1.36 -2,74
•
1971 91.4 87.2 93.44 91.89 90.97 86.33 94.64 81.71 91.54 90.12
Von-Scheduled 1991 90.09 80.93 93.29 89.95 89.81 85.60 84.34 55.16 91.12 87.90
Change -1.31 -6.27 -0.15 -1.94 -1.16 -0.73 -10.3 -26.55 -0.42 -2.22
Source: Census of Assam, 1971-1991
45

Table 2.9 reveals that the majority of the population spaced out
to the ethnic differentiation lived in rural areas in all districts (2001).
There were, however, important inter district variations in the proportion
of rural population. The Scheduled Tribe population in sharp contrast
remains vastly rural in their population composition and there is little
inter-district variation in this feature of population composition.
Districts
l.Dhubri 2.Kokrajhar S.Bongaigaon 4. Goalpara 5. Barpeta 6. Nalbari 7. Kamrup 8. Darrang 9. Sonitpur lOXakhimpur 11. Dhemaji 12. Morigaon 13. Nagaon M.Golaghat 15. Jorhat 16. Sibsagar 17. Dibrugarh 18. Tinsukia 19.K.Anglong 20. N.C. Hills 21. Karimjanj 22.Hailakandi 23. Cachar
Assam
Table: 2.9 Proportion of Rural Population in Assam (ST/Non-Scheduled/Deori) 1991-2001(in %)
Schedule( 1991 98.04 97.74 99.04 98.52 99.31 99.89 88.18 99.02 98.93 98.59 99.17 96.2 96.97 98.66 98.75 97.83 92.08 97.04 93.41 88.24 91.33 93.29 99.11 96.62
2001 97.72 96.10 96.32 98.69 99.04 99.90 87.02 98.33 98.54 98.43 97.64 96.45 98.20 97.31 98.15 96.65 89.24 95.99 92.09 81.29 88.25 94.76 97.32 95.34
Tribe Change -0.32 -1.64 -2.72 0.17 -0.27 0.01 -1.16 -0.69 -0.39 -0.16 -1.53 0.25 1.23 -1.35 -0.6 -1.18 -2.84 -1.05 -1.32 -6.95 -3.08 1.47 -1.79 -1.28
•
1991 89.16 91.86 89.34 91.63 93.00 97.35 64.69 94.66 92.12 90.90 97.13 94.49 88.69 93.60 82.38 92.85 81.98 83.19 84.34 55.16 92.79 92.19 89.55 87.90
Von-Scheduled 2001 89.49 92.09 86.8 91.09 92.44 97.25 60.86 94.75 88.43 90.41 88.76 94.92 87.55 90.67 80.19 90.84 80.51 80.02 83.81 40.20 92.76 91.65 85.04 87.90
Change 0.33 0.23 -2.54 -0.54 -0.56 -0.1 -3.83 0.09 -3.69 -0.49 -8.37 0.43 -1.14 -2.93 -2.1^ -2.01 -1.47 -3.17 -0.53 -14.96 -0.03 -0.54 -4.51 -1.90
1991
0.01
0.09 1.61 1.23
0.43 0.42 0.3 0.51
Deori 2001
0.04
1.87 4.24 1.97
0.58 0.28 2.41 1.03
Change ------
-1-0.03 -
+1.78 +2.63 +0.74
--.
+0.15 -0.14 +2.11 +0.52
-----
+7.82 Source: Census of Assam, 1991-2001
46

The rural urban composition of the Non-Scheduled population
also is not very unusual across the districts barring North-Cachar district
where majority of the population belonging to this category lives in urban
areas
2.3.6 Growth of Rural Population in Assam
Assam is the high concentration of rural population as compared
to the other states of North East India. Following table (Table-2.10) shows
the growth of rural population in whole of Assam during 1971, 1991 and
2001 respectively.
During the period 1971 and 1991, the rural population in Assam
grow at a rate of around 50 (49.39%), which is only a little lower than the
overall growth rate (53.21%) experienced in Assam during the same
period. There was a decline in the rural growth rate (even after adjusting
the growth rate for two earlier decades of 1971-1991) by the year 2001
when the rural growth fell to a low of 16.53 percent. This fall in the rural
growth may be attributed mostly to the rural to urban stream of migration.
Table: 2.10 Growth of Rural Population in Assam, Census Year 1971 1991 2001
Rural Population
13335930 19922265 23216288
Overall Growth Rate
-
53.21 18.93
I971-2001(in %) Rural Growth
Rate -
49.39 16.53
Source: Census of India (Assam State) 1971, 1991 and 2001
47

The Deori Villages are mostly restricted in the rural area either in
the extreme comer or in the periphery of the interstate boundary. They
constitute a foremost population in the seven districts of rural Assam
except in the Kamrup district where their villages are controlled near by
the urban perimeter.
The following (Table-2.11) defines the decadal change of rural
Deori population in (1991-2001). In this decade three district namely
Lakhimpur, Dibrugarh and Sonitpur experiences major decadal growth
(+2.63, +2.11 and +1.78 respectively) in terms of Total Deori population.
Kamrup district has the minimum decadal growth rate of Deori population
(+0.03). Other four districts have moderate decadal growth below 1.00
percent in the same decade.
SI. No.
1 2 3 4 5 6 7 8
Total
Table: Districts
Sonitpur Lakhimpur
Dhemaji
Tinsukia Dibrugarh
Sibsagar
Jorhat
Kamrup
2.11 Decadal C Total
population 1991
1424287
751517
478830
962298 1042457
907983
871206
2000071
lange of Deori Deori
population 1991
Deori
1333
12119
5891
4939
2168
3843
3759
611
34,663
%
0.09
1.61
1.23
0.51
0.3
0.42
0.43
0.01
4.6
Population (F Total
population 2001
1681513
889010
571944
1150062 228438
1051736
999221
2522324
lural) 1991- 2001 Deori population
2001
Deori
31461
37779
11311
11919
5506
3042
5821
1129
1,07,968
%
1.87 4.24
1.97
1.03 2.41
0.28
0.58 0.04
12.42
Change over the decade
+1.78
+2.63
+0.74
+0.52
+2.11
+0.14
+0.15
+0.03
+8.1
Source: Department of Plain Tribes and Backward Classes, Assam-2001 48

2,4 District Level Pattern of Distribution of Etlinic Groups
Scheduled Tribes, Scheduled Castes, and Non-Scheduled
populations are very unevenly distributed in different districts of Assam.
Decadal growth of the tribes in different districts are analysed in the
following tables and diagrams.
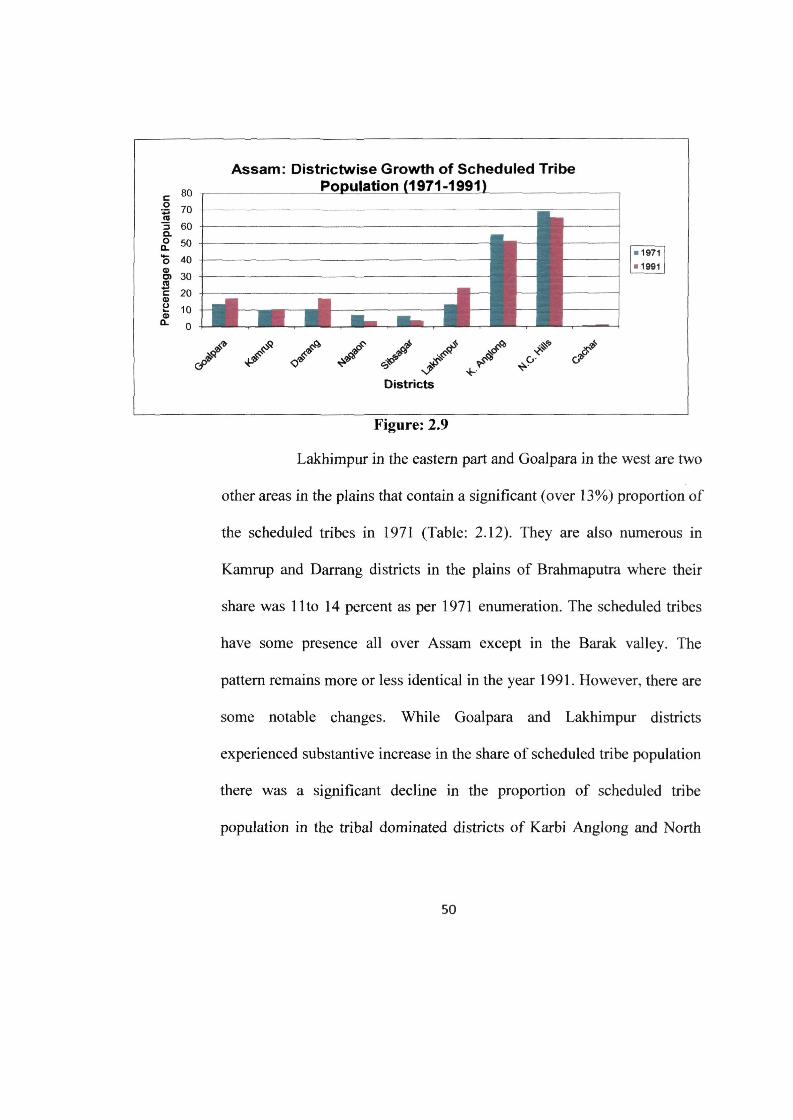
Table: 2.12 Assam: District wise Growth of Scheduled Tribe Population
(1971 andl991) District
Goalpara Kamrup Darrang Nagaon Sibsagar
Lakhimpur K. Anglong N.C. Hills
Cachar
% of ST Population to total district Population
(1971) 13.84 10.44 10.69 07.44 06.82 13.49 55.37 69.15 00.89
% of ST Population to total district Population
(1991) 17.23 10.72 17.32 3.69 3.80
23.57 51.56 65.54 1.36
Source: Census of Assam, 1991
49
Assam: Districtwise Growth of Scheduled Tribe Population (1971-1991)
• 1971
• 1991
Figure: 2.9
Lakhimpur in the eastern part and Goalpara in the west are two
other areas in the plains that contain a significant (over 13%) proportion of
the scheduled tribes in 1971 (Table: 2.12). They are also numerous in
Kamrup and Darrang districts in the plains of Brahmaputra where their
share was 11 to 14 percent as per 1971 enumeration. The scheduled tribes
have some presence all over Assam except in the Barak valley. The
pattern remains more or less identical in the year 1991. However, there are
some notable changes. While Goalpara and Lakhimpur districts
experienced substantive increase in the share of scheduled tribe population
there was a significant decline in the proportion of scheduled tribe
population in the tribal dominated districts of Karbi Anglong and North
50
Cachar Hills. Substantial incursion of the non-tribal population into these
hill districts is the chief cause in the fall of tribal proportion in these areas.
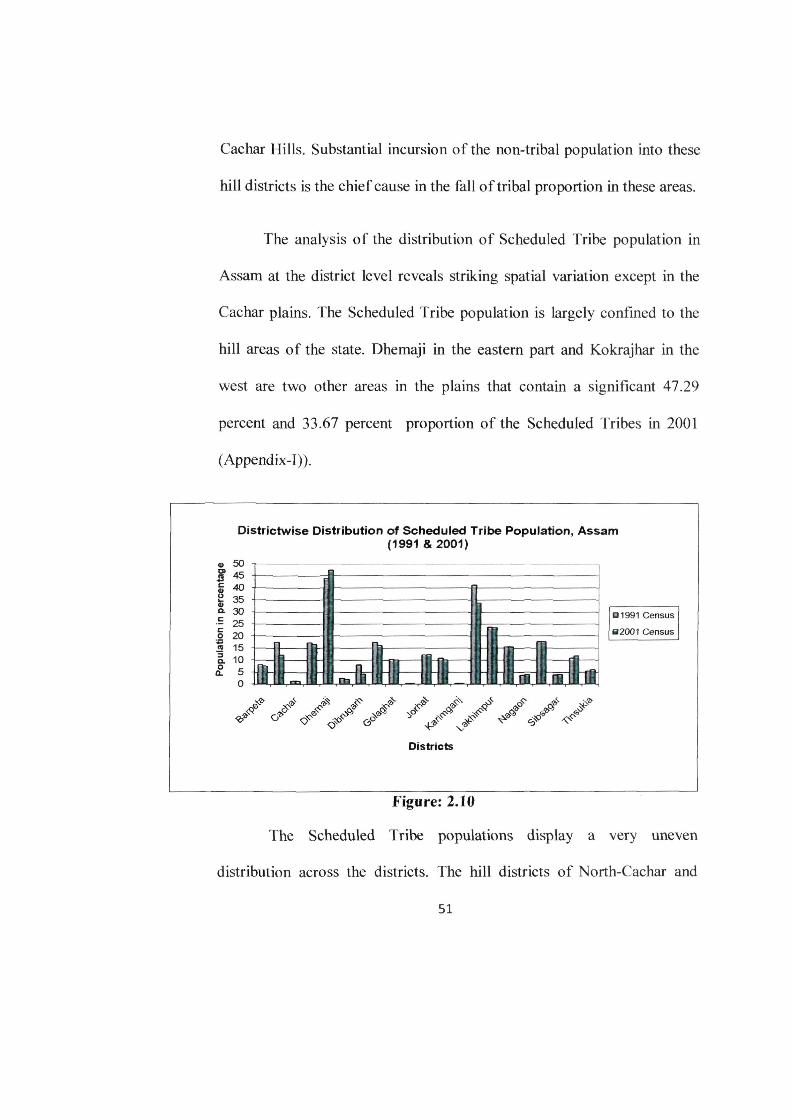
The analysis of the distribution of Scheduled Tribe population in
Assam at the district level reveals striking spatial variation except in the
Cachar plains. The Scheduled Tribe population is largely confined to the
hill areas of the state. Dhemaji in the eastern part and Kokrajhar in the
west are two other areas in the plains that contain a significant 47.29
percent and 33.67 percent proportion of the Scheduled Tribes in 2001
(Appendix-I)).
DJstrJctwise Distribution of Scheduled Tribe Population, Assam (1991 & 2001)
a 1991 Census
B2001 Census
/o^^<y/ <X/.^VV 4J>
Districts
Figure: 2.10
The Scheduled Tribe populations display a very uneven
distribution across the districts. The hill districts of North-Cachar and
51

Karbi Anglong as well as the plain districts of Dhemaji and Kokrajhar
supported a very high percentage (over 40 percent) of Scheduled Tribes in
the year 1991. The other districts in the plains, that contained a sizeable
Scheduled Tribe population include Bongaigaon, Goalpara, Nalbari
forming a contiguous zone in the lower Brahmaputra valley; and Darrang,
Lakhimpur and Morigaon forming another pocket of tribal concentration
in the Upper and Central Brahmaputra valley. The spatial pattern of
distribution of the Scheduled Tribe population underwent little change in
the year 2001 with minor modifications. The Scheduled Tribes also
experienced a fall in their proportion in the total population in many
districts. The only exceptions are found in the hill districts and Dhemaji,
where the Scheduled Tribes have actually increased their share in the total
population. Nevertheless, the fact that their share has fallen in many
districts reveals the weakness of Census data. Either the 1991 census
overestimated the Scheduled Caste and Scheduled Tribe Population or has
under enumerated them in the 2001 census
The Scheduled Tribe population consists more than forty
percent of the total population in Dhemaji and Kokrajhar district in 2001.
Scheduled Tribe population in Lakhimpur district shares 23.49 percent of
total district population. While tribal population in Dhemaji district is
52

increasing, it is decreasing in tribal dominated Kokrajhar district. (Fig-
2.10).On the other hand, most of the districts, except the above mentioned
has scheduled tribe population below 20 percent. Growth of Scheduled
Tribe population is noticed in Nagaon, Sibsagar, sonitpur and Tinsukia
districts within this decade.
The Non-Scheduled population accounted for over 80 percent in
most of the district of Assam except the two hill districts containing a
majority of the Scheduled Tribe population. However, their proportion has
been declining in nearly all districts except in the hill district of Karbi
Anglong and North-Cachar Hills
It is interesting that the proportion of Non-Scheduled population
in all has increased in a majority of the districts with the possible
exception of those in which the proportion of Scheduled Tribe population
shows an increase during the period between 1991 and 2001(Appendix-
IV). The spatial pattern of distribution of Non-Scheduled population
however does not show much of change.
53
2.5 Spatial Distribution of Deori Population in Assam
The state of Assam occupies a unique position amidst complex
geologic, physiographic and social make up of the north-eastern regions
of India. Deoris are mostly found in the district of upper and middle
Assam and in some pockets of Lohit and Tirap district of Arunachal
Pradesh, near the Assam Arunachal Pradesh border. The concentrations
of Deori villages are found in Lakhimpur, Dhemaji, and Sonitpur
districts of north bank and in Tinsukia, Dibrugarh, Sibsagar and Jorhat
districts of south bank of the Brahmaputra Valley. Some villages are
also found in Guwahati area of Kamrup district which may of recent
migration from within Assam. In the table (Appendix-V) Total
population, Scheduled Tribe population, Deori population, total non-
Tribal population and Total non-Deori population is shown in the Deori
distributed districts of Assam.
Table-2.13 shows that in the year 2001 Lakhimpur district
alone has more than 60 percent of the Deori population to the total Deori
population of the state. Sonitpur district also endowed with 14 percent of
Deori population in the same decade. Other districts contributed a small
number of populations to the total Deori population of the state as
54

CO CM
CO CM
in CM CM
CD c _o
« Jo .5 5 ^
•^ to b i - ^ z i^
CD i -. ^ CO
:?^ CO CO
X O
CD OS
i in
iricor^odoicD-r-^cNico T - T - t - T - T - C N C N C M C N I
C3 T-̂ c\i CO T f
co-<t iocor--oocj>'<-T-T-T-T-
CO CD
CM
cn
c»
o
a. IS
CO CM
lV9N3a1S3M CM
CO CM ^ in
CM CM
a a Q
o
CO CD
CD
U
I o 0}

because they share insignificant percentage of population to the total
population of the state.
2.6 Zones of Concentration of Deoris
Over and above discussions of the demographic scenario in Assam
could be found out the districts where Deoris are highly, moderately and
least concentrated.
SI. No.
1 2 3 4 5 6 7 8
Table: 2.13 District wise Distribution of the Deori Po Districts
Lakhimpur Dhemaji Sonitpur Jorhat Dibrugarh Sibsagar Tinsukia Kamrup
Soui
Total population
889,010 571,944 1,681,513 999,221 228,438 1,051,736 1,150,062 2,522,324
•ce: Data Col
ST population
208,864 270,496 195,083 123,134 9,507 41,533 67,234 250,393 ected and Cc
Deori population
132,736 12,463 31,461 6,762 6,076 13,300 12,722 1543
)mputed by
% of Deori population to total population of the district
15 2 2 0.68 3 1 1 0.06
R.esearcher-200'
pulation, 2001 % of Deori population to total ST population of the district
64 5 16 5 64 32 19 0.62
7
Assam % of Deori population in the district to the total Deori population of the state
61 6 14 3 3 6 6 0.71
The Total population, number of Scheduled Tribe population and
number of Deori population of each of the districts are taken in to
consideration. Then percentage of Deori population to total population of
the district is calculated. The percentages of Deori population to
Scheduled Tribe population of the district and to total Deori population of
the state are also found out.
55

Ta SI. No.
1 2 3 4 5 6 7 8
)le: 2.14 Degree of Concentration of Deori Population Districts
Lakhimpur Dhemaji Sonitpur Jorhat Dibrugarh Sibsagar Tinsukia Kamrup
Degree of concentration of Deori population in the districts
47 4
11 3
23 13 9
0.46 Source: Data Collected and Computed by Researcher-2007
With a view to find out the degree of concentration the
average values of the three sets of data are calculated for each district and
these values are shown in percentages. Subsequent to analyzing the Deori
population in 2001, it is clearly point out that the degree of concentration
of Deori population is highest in Lakhimpur (47%) following Dibrugarh
(23%), Sibsagar (13%), Sonitpur (11%) and other three districts namely
Jorhat, Tinsukia and Kamrup and Dhemaji below 10 percent (TabIe-2.14).
Kamrup district has the lowest degree of concentration only (0.46%),
though four villages confined in the urban areas which consist a few
population.
56

Table: 2.15 Zones of Deori Concentration Zones High Concentration
Moderate Concentration Least Concentration
Districts Lakhimpur Dibrugarh Dhemaji.Sibsagar, Tinsukia,Sonitpur, Jorhat & kamrup
Range Above 40 20-40 Below 20
Source: Data Collected and Computed by Researcher-2007
After finding out the Concentration Indices the districts are
categorized in to three concentration zones. Districts having degree of
concentration above 40 percent are included in High Concentration Zone;
those districts which have the values within 40 to 20 are included in
Moderate Concentration Zone. The least concentration zone is
characterized by the values below 20.
Table: 2.15 show that Lakhimpur District has the Highest
Concentration of Deoris (Concentration Index 47) and Dibrugarh District
has Moderate Concentration (Concentration Index 23). The other six
districts are included in the Least Concentration Zone.
2.7 Concluding Statement:
The study of spatial distribution of ethnic groups in Assam leads to
the following generalization. As far the tribal population is concerned, this
segment is highly concentrated in three major pockets in Assam: lower
part of northern Brahmaputra valley mostly inhabited by the Bodo, Rabhas
57

oo CM CM
in CM CM
CO
•n c»
S
CO
-O)
o
6 z a.
o
00 CM
nvoNia1S3M CM
(O CM
< m
CM CM
0>
I i
CO

and Tiwa communities; in the south central parts considering of the two
hill districts (North Cachar and Karbi Anglong) of Assam where the
Karbis and Kacharis dominate and the third pocket is located in the north
eastern comer (Dhemaji district) of Assam which too contain a sizeable
proportion of the Mishing, Sonowal Kacharis and Deoris in the total
Scheduled Tribe population.
On the other hand, the Non-Scheduled population is distributed all
over the state though the extent of their dominance is inversely related to
the areas of concentration of the Scheduled Tribes. The most interesting
aspects of the ethnic composition of Assam relates to the fact that the
Scheduled Tribe population is distributed both in hills as well as in plains.
The Deori tribes are by and large confined the both bank of upper
Brahmaputra valley.
At the state level pattern of population distribution, the share of the
Scheduled Tribe population increased rapidly during the period 1971-91,
but declines subsequently. The Deori population too increased its share in
the total as well as in the Scheduled Tribe segment in the same period. The
increase in the tribal population as also of the Deoris appears to be due to
high natural increase in their population.
58

At the district level pattern of population growth, the Deori
population shows extreme clustering in eight districts located in upper and
lower Brahmaputra valley. These districts have experience rise in the
proportion Deori population during 1971-91 decades.
The Scheduled Tribe population in sharp contrast remains vastly
rural in their population composition and there is a little inter-district
variation in this feature of population composition. As far as their
redistribution across rural and urban areas is concerned, there is a very
little evidence of it except in the hill district of North Cachar and Karbi-
Anglong, where substantial erosion has taken place to the Scheduled Tribe
population living in rural areas. Elsewhere, there is only a marginal fall in
the rural component of Scheduled Tribe population.
The relative share of Deori population to the total Tribal
population of the state is very nominal. In the year 1991 it shares only 4.6
percent and in 2001 it increases up to 12.42 percent respectively. The
concentration of Deori population is highest in Lakhimpur district and
minimum in Kamrup district because of distant factor as well as rural
urban ethnic composition.
59

References:
Baruah, A. (1991): The Religious form of Life in Assam with Special Reference to Vaisnavism of Sankardeva. Unpublished Ph.D. Thesis, N.E.H.U., Shillong.
Barua, H (1960): Tribes and Races: North -East Frontier. United Asia (Bombay), 12:323-27
Census of Assam, 1971, 1991 and 2001
Census of Assam, 1971-2001
Department of Plain Tribes and Backward Classes, Assam-2001
Logan, J.R. (1848): Customs common to the Hill Tribes bordering Assam and those of the Indian Archipelago. Journal of Indian Archipelago and Eastern Asia, 2: 229-36
60