Embed Size (px)
Citation preview
32
CHAPTER IV
FINDINGS AND DISCUSSION
This chapter discusses two points. First, it presents the data gathered. Second, the
data collected are analyzed concerning the research questions stated in this paper and
elaborated based on theories established.
4.1 Findings
4.1.1 Pilot Test Result
As stated in chapter III, the pilot test went through two steps. Firstly, the
instrument was validated by an English teacher. Secondly, the instrument was
administered to five students who did not included in both control and experimental
groups in academic year 2010/2011. The result of the pilot test is shown in the
following table.
Table 4.1
The Result of Pilot Test
Topic: Describing animal
Aspect Student no. 1 Student no. 2 Student no. 3 Student no. 4 Student no. 5
Assessors’
Assessor 1
Assessor 2
Assessor 1
Assessor 2
Assessor 1
Assessor 2
Assessor 1
Assessor 2
Assessor 1
Assessor 2
Content
2 3 2 3 3 3 1 3 1 2
33
Vocabulary
2 3 3 3 2 3 2 3 2 3
Generic Structure
2 3 3 3 2 3 2 3 2 3
Language Feature
2 3 2 3 2 3 2 3 1 3
The students are able to develop the story based on the given topic that
familiar for them. It can be seen from the scores that the students got. As mentioned
before, this research adopts the rubric of Brown (1994). From the aspects, if the
students get three scores mean that the contents that the students write are
understandable, two scores mean that there are many confused words, for example;
the writing are irrelevant with the topic, and one score means that so many mistakes.
Most of the students get the score between 1 until 3. For example, in
vocabulary aspect, one student get three scores means that the words have already
been related to the topic and situation; however, they are not have any variation yet.
Four students get two scores which mean that there are still lots of unappropriate
words used in the students write. From the table it can see that although the score is
not high enough, the students can write and understand what the instruction given.
34
4.1.2 Pre-test Result
Pre-test was conducted on August 2nd, 2010 to 25 students in class VIII A and
25 students in class VIII B (2010/2011). Students’ writing in pre-test was evaluated
based on the rubric of Brown (1994) which covers content, vocabulary, generic
structure, and language features. Later, the scores were statistically analyzed by using
SPSS 16.0 for windows by following several steps.
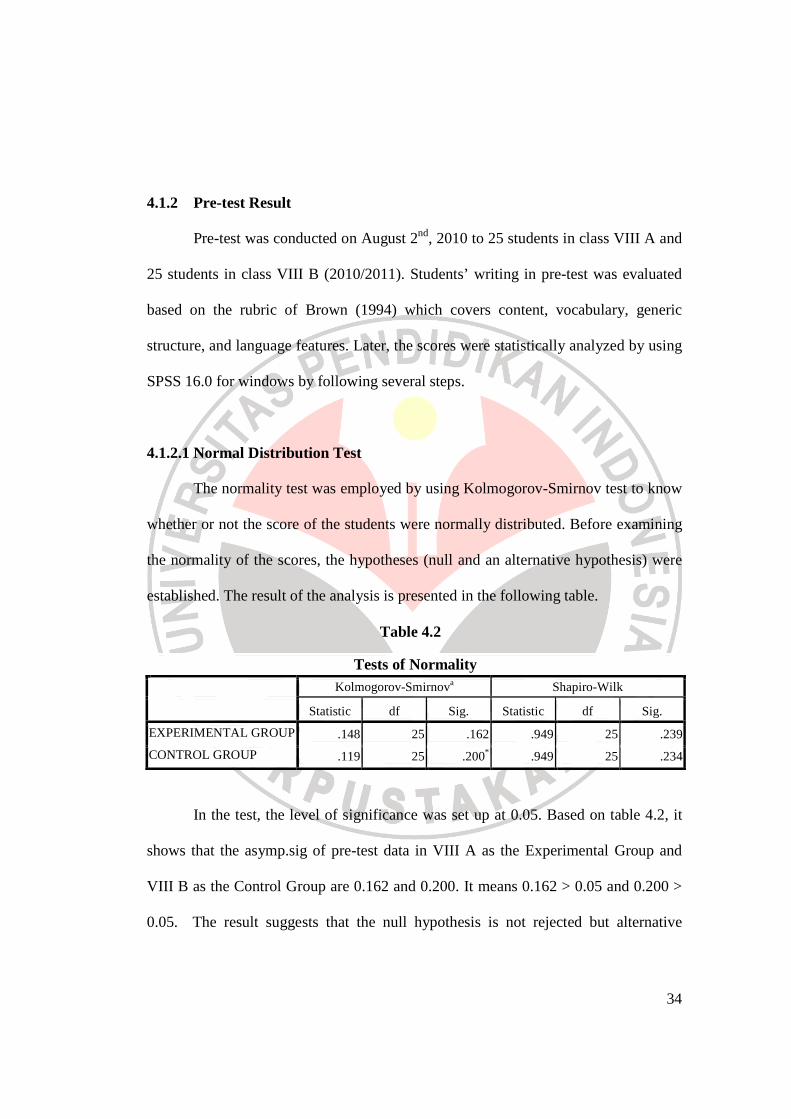
4.1.2.1 Normal Distribution Test
The normality test was employed by using Kolmogorov-Smirnov test to know
whether or not the score of the students were normally distributed. Before examining
the normality of the scores, the hypotheses (null and an alternative hypothesis) were
established. The result of the analysis is presented in the following table.
Table 4.2
Tests of Normality Kolmogorov-Smirnova Shapiro-Wilk
Statistic df Sig. Statistic df Sig.
EXPERIMENTAL GROUP .148 25 .162 .949 25 .239
CONTROL GROUP .119 25 .200* .949 25 .234
In the test, the level of significance was set up at 0.05. Based on table 4.2, it
shows that the asymp.sig of pre-test data in VIII A as the Experimental Group and
VIII B as the Control Group are 0.162 and 0.200. It means 0.162 > 0.05 and 0.200 >
0.05. The result suggests that the null hypothesis is not rejected but alternative
35
hypothesis is rejected. Therefore, it can be drawn as a conclusion that the data of both
groups are normally distributed.
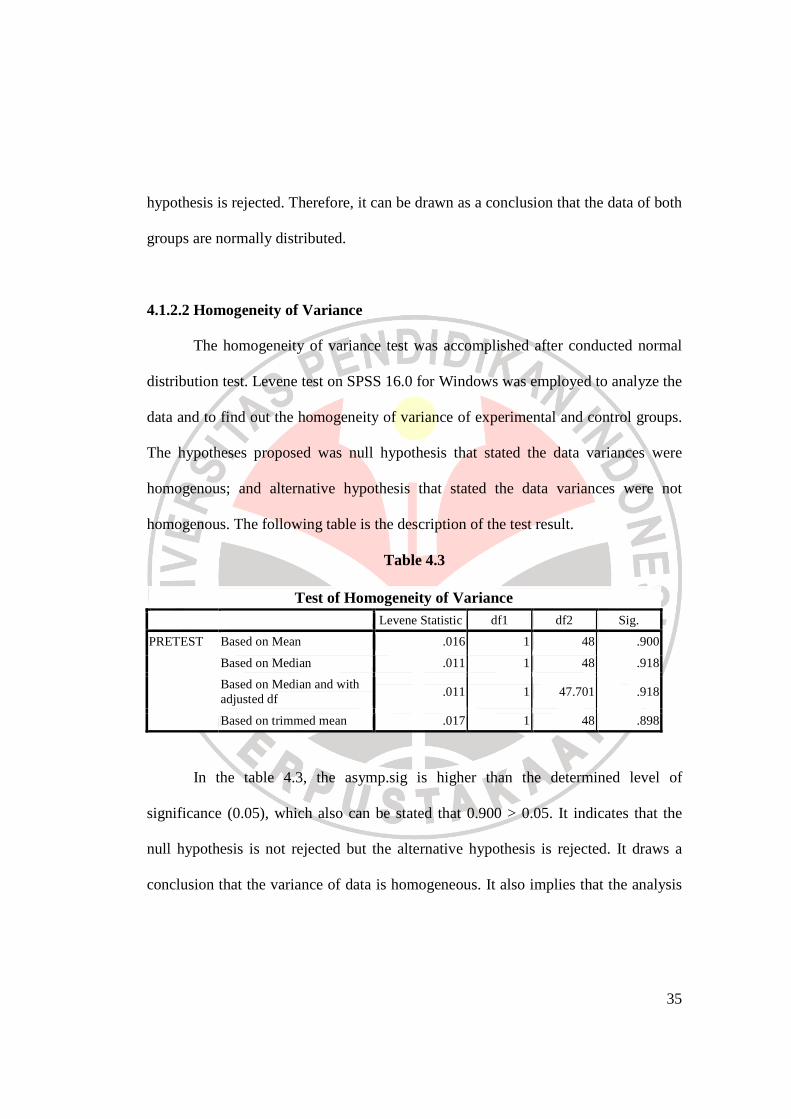
4.1.2.2 Homogeneity of Variance
The homogeneity of variance test was accomplished after conducted normal
distribution test. Levene test on SPSS 16.0 for Windows was employed to analyze the
data and to find out the homogeneity of variance of experimental and control groups.
The hypotheses proposed was null hypothesis that stated the data variances were
homogenous; and alternative hypothesis that stated the data variances were not
homogenous. The following table is the description of the test result.
Table 4.3
Test of Homogeneity of Variance Levene Statistic df1 df2 Sig.
PRETEST Based on Mean .016 1 48 .900
Based on Median .011 1 48 .918
Based on Median and with adjusted df
.011 1 47.701 .918
Based on trimmed mean .017 1 48 .898
In the table 4.3, the asymp.sig is higher than the determined level of
significance (0.05), which also can be stated that 0.900 > 0.05. It indicates that the
null hypothesis is not rejected but the alternative hypothesis is rejected. It draws a
conclusion that the variance of data is homogeneous. It also implies that the analysis
36
of t-test can be conducted since the data is normally distributed and the variances are
homogeneous.
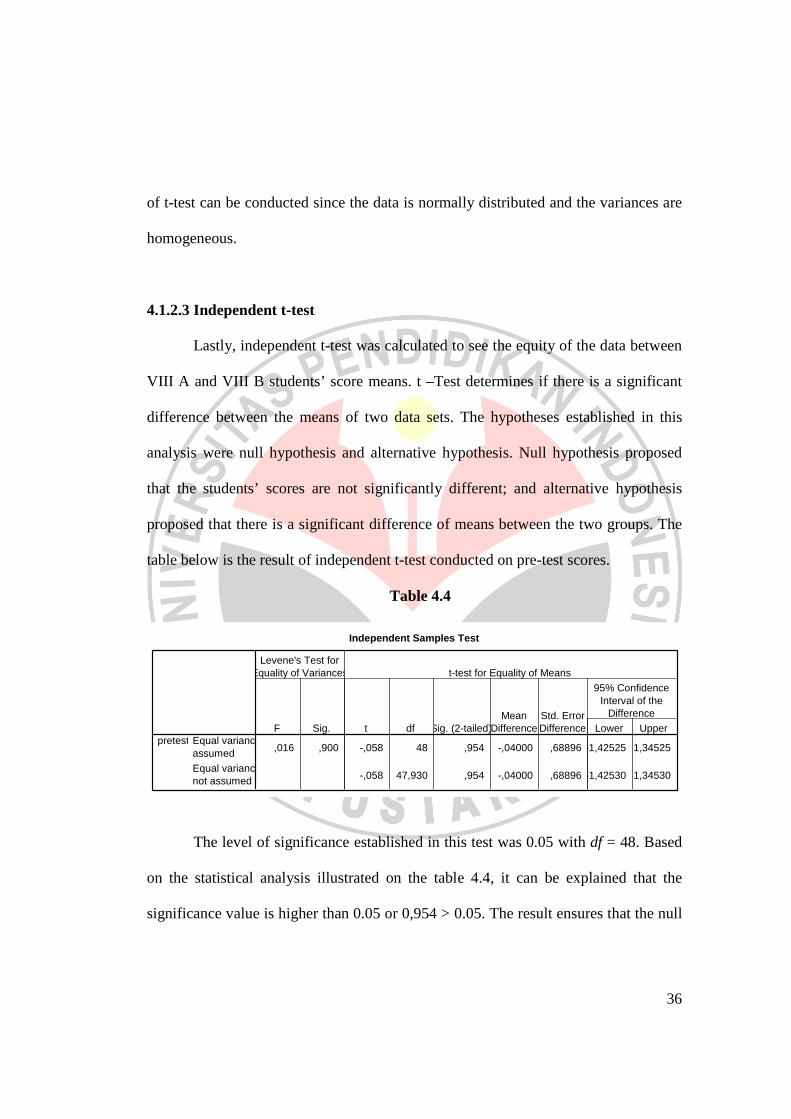
4.1.2.3 Independent t-test
Lastly, independent t-test was calculated to see the equity of the data between
VIII A and VIII B students’ score means. t –Test determines if there is a significant
difference between the means of two data sets. The hypotheses established in this
analysis were null hypothesis and alternative hypothesis. Null hypothesis proposed
that the students’ scores are not significantly different; and alternative hypothesis
proposed that there is a significant difference of means between the two groups. The
table below is the result of independent t-test conducted on pre-test scores.
Table 4.4
Independent Samples Test
,016 ,900 -,058 48 ,954 -,04000 ,68896 -1,42525 1,34525
-,058 47,930 ,954 -,04000 ,68896 -1,42530 1,34530
Equal variancesassumed
Equal variancesnot assumed
pretestF Sig.
Levene's Test forEquality of Variances
t df Sig. (2-tailed)Mean
DifferenceStd. ErrorDifference Lower Upper
95% ConfidenceInterval of the
Difference
t-test for Equality of Means
The level of significance established in this test was 0.05 with df = 48. Based
on the statistical analysis illustrated on the table 4.4, it can be explained that the
significance value is higher than 0.05 or 0,954 > 0.05. The result ensures that the null
37
hypothesis is not rejected but the alternative hypothesis is rejected. Therefore, there is
no difference between control and experimental groups’ means.
By the results of the normality, homogeneity, and independent t-test above, it
is apparent that both of the groups have equal initial ability in writing descriptive text.
Therefore, class VIII A and VIII B can be grouped as samples of research. The
students in class VIII A was selected to be the experimental group, and class VIII B
was taken as the control group.
4.1.3 Post-test Result
Post-test was administered on September 23th, 2010 to 50 samples. After
gathering the data of post-test scores, similar statistical analysis as pre-test was also
accomplished. Beside the calculation on normality, homogeneity, and independent t-
test, the effect size was also employed to discover at what value mind mapping
technique affects student’s writing score.
4.1.3.1 Normal Distribution Test
First step taken was quantifying the normality test by utilizing Kolmogorov-
Smirnov test. The hypotheses proposed were the null and alternative hypothesis.
38
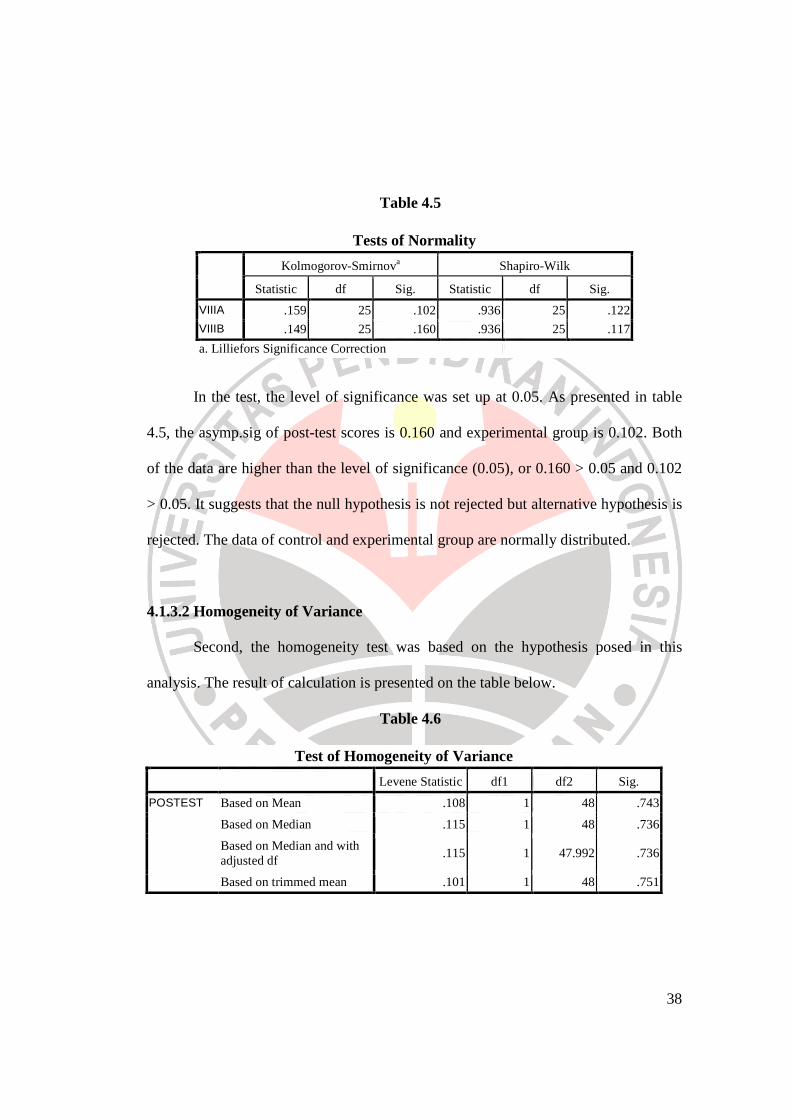
Table 4.5
Tests of Normality
Kolmogorov-Smirnova Shapiro-Wilk
Statistic df Sig. Statistic df Sig.
VIIIA .159 25 .102 .936 25 .122
VIIIB .149 25 .160 .936 25 .117
a. Lilliefors Significance Correction
In the test, the level of significance was set up at 0.05. As presented in table
4.5, the asymp.sig of post-test scores is 0.160 and experimental group is 0.102. Both
of the data are higher than the level of significance (0.05), or 0.160 > 0.05 and 0.102
> 0.05. It suggests that the null hypothesis is not rejected but alternative hypothesis is
rejected. The data of control and experimental group are normally distributed.
4.1.3.2 Homogeneity of Variance
Second, the homogeneity test was based on the hypothesis posed in this
analysis. The result of calculation is presented on the table below.
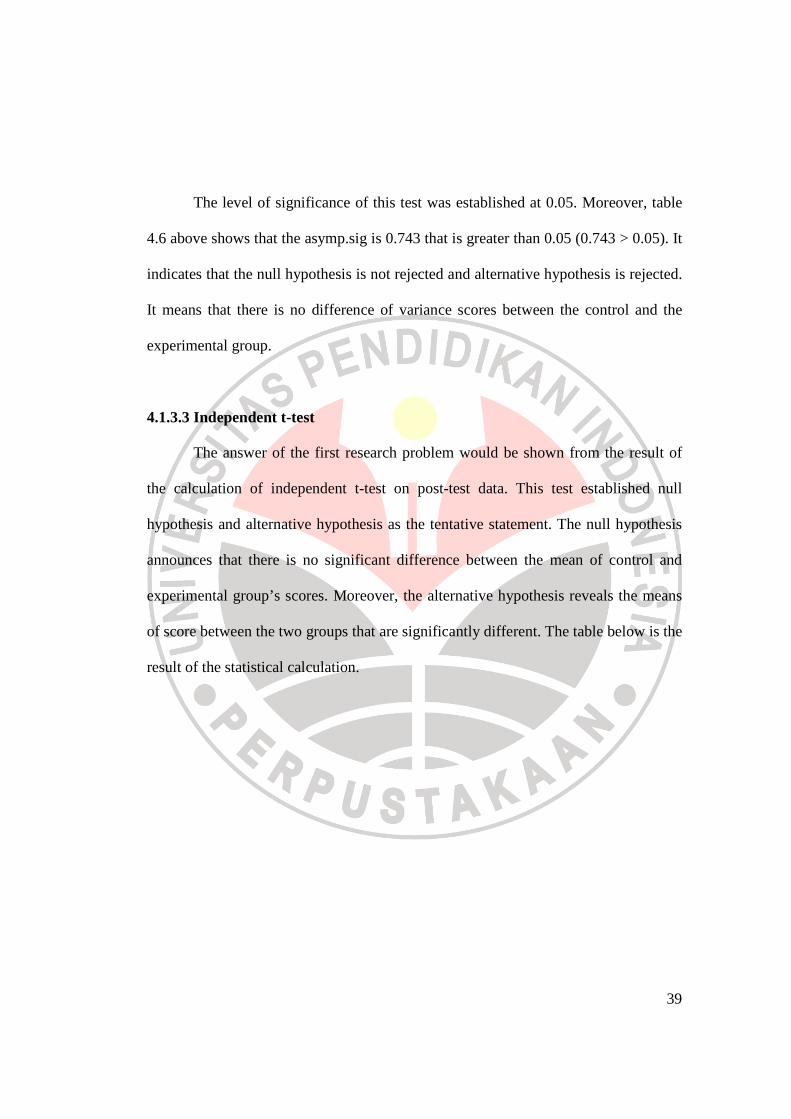
Table 4.6
Test of Homogeneity of Variance
Levene Statistic df1 df2 Sig.
POSTEST Based on Mean .108 1 48 .743
Based on Median .115 1 48 .736
Based on Median and with adjusted df
.115 1 47.992 .736
Based on trimmed mean .101 1 48 .751
39
The level of significance of this test was established at 0.05. Moreover, table
4.6 above shows that the asymp.sig is 0.743 that is greater than 0.05 (0.743 > 0.05). It
indicates that the null hypothesis is not rejected and alternative hypothesis is rejected.
It means that there is no difference of variance scores between the control and the
experimental group.
4.1.3.3 Independent t-test
The answer of the first research problem would be shown from the result of
the calculation of independent t-test on post-test data. This test established null
hypothesis and alternative hypothesis as the tentative statement. The null hypothesis
announces that there is no significant difference between the mean of control and
experimental group’s scores. Moreover, the alternative hypothesis reveals the means
of score between the two groups that are significantly different. The table below is the
result of the statistical calculation.
40
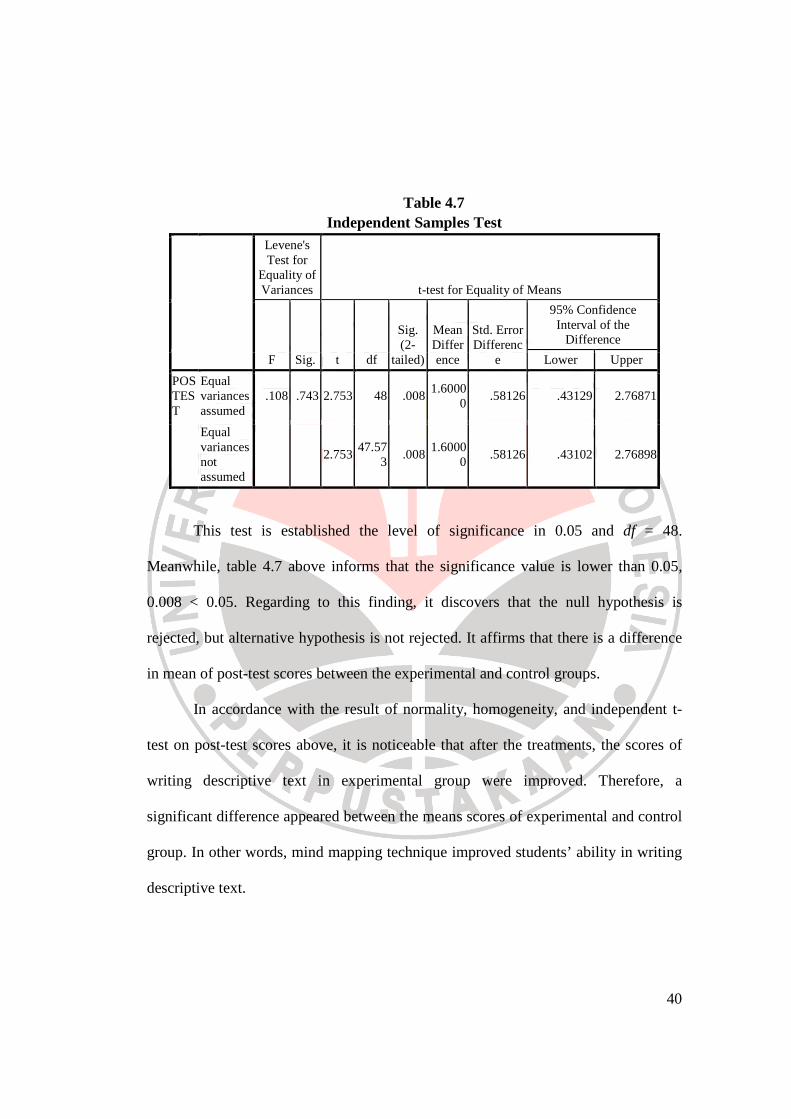
Table 4.7 Independent Samples Test
Levene's Test for
Equality of Variances t-test for Equality of Means
F Sig. t df
Sig. (2-
tailed)
Mean Difference
Std. Error Differenc
e
95% Confidence Interval of the
Difference
Lower Upper
POSTEST
Equal variances assumed
.108 .743 2.753 48 .008 1.6000
0 .58126 .43129 2.76871
Equal variances not assumed
2.753 47.57
3 .008
1.60000
.58126 .43102 2.76898
This test is established the level of significance in 0.05 and df = 48.
Meanwhile, table 4.7 above informs that the significance value is lower than 0.05,
0.008 < 0.05. Regarding to this finding, it discovers that the null hypothesis is
rejected, but alternative hypothesis is not rejected. It affirms that there is a difference
in mean of post-test scores between the experimental and control groups.
In accordance with the result of normality, homogeneity, and independent t-
test on post-test scores above, it is noticeable that after the treatments, the scores of
writing descriptive text in experimental group were improved. Therefore, a
significant difference appeared between the means scores of experimental and control
group. In other words, mind mapping technique improved students’ ability in writing
descriptive text.
41
In order to find out whether mind mapping affected students’ writing ability in
descriptive text, the calculation of effect size was conducted. The calculation was
performed manually by using the following formula developed by Coolidge (2000).
The t refers to the t value obtained from the independent t-test calculation on post-test
data. Afterward, the df is the amount of samples minus by 2 (df = N-2)
r =
Derived from table 4.7, t value is 2.753 and df is 48. Hence, after completing
the computation, it is found that r value is 0.369. Converted to the effect size table
(see table 3.1), the obtained value shows medium effect size.
4.1.4 The Paired t-test Analysis on Experimental Group Scores
A paired t-test was conducted to discover the differences in experimental
group score before and after the students was given the treatments. The calculation of
paired t-test was used to analyze the score of the experimental and control groups.
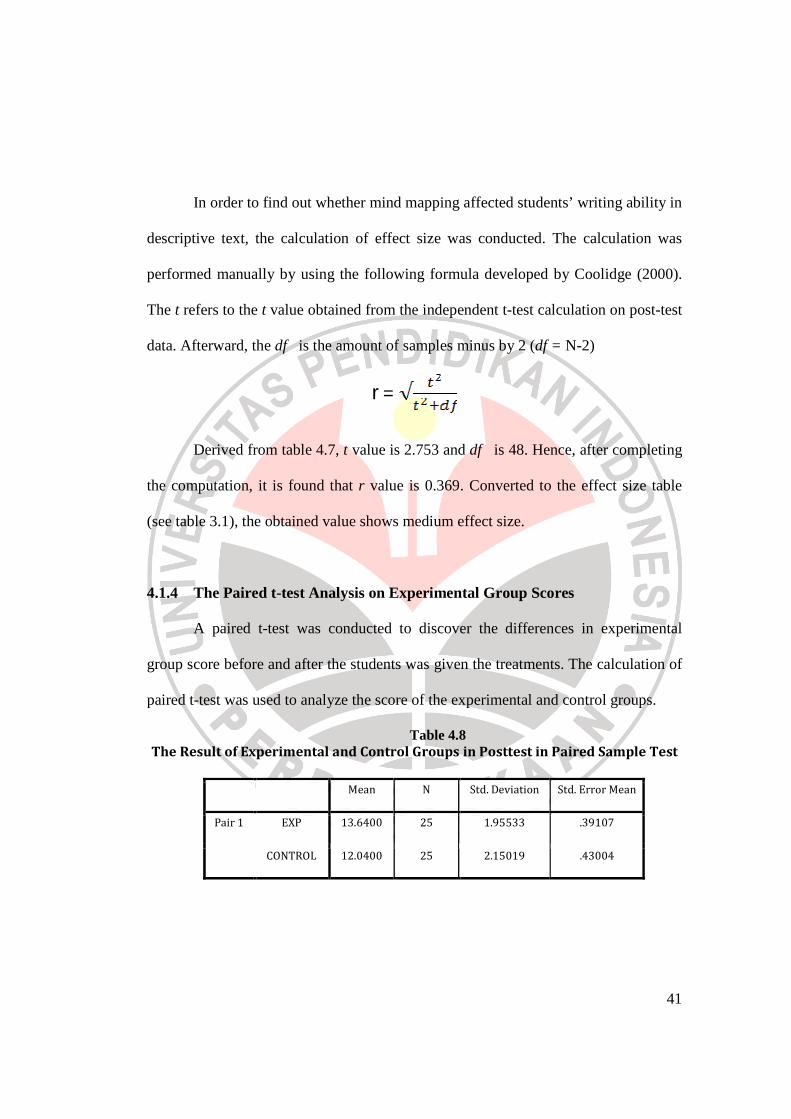
Table 4.8 The Result of Experimental and Control Groups in Posttest in Paired Sample Test
Mean N Std. Deviation Std. Error Mean
Pair 1 EXP 13.6400 25 1.95533 .39107
CONTROL 12.0400 25 2.15019 .43004
42
Based on the result, the experimental group students’ scores on posttest were
better in which the mean = 13.64 than their scores on pretest the mean= 12.04. In
addition, the two- tailed value of p was 0.000 which was lower than 0.05. In
conclusion, the calculation of paired t-test showed that there was a significant
difference between the pretest and posttest scores of experimental group. Thus, the
null hypothesis was rejected because there was a significant difference between
pretest and posttest in experimental group. It can be concluded that the use of mind
mapping as treatment in teaching descriptive text to improve students’ writing ability
was effective.
The calculation was carried out in order to know how well the treatment
worked, in term of pre-test and post-test scores for experiment group. The t value of
4.824 and df of 24 were obtained from paired sample t-test analysis.
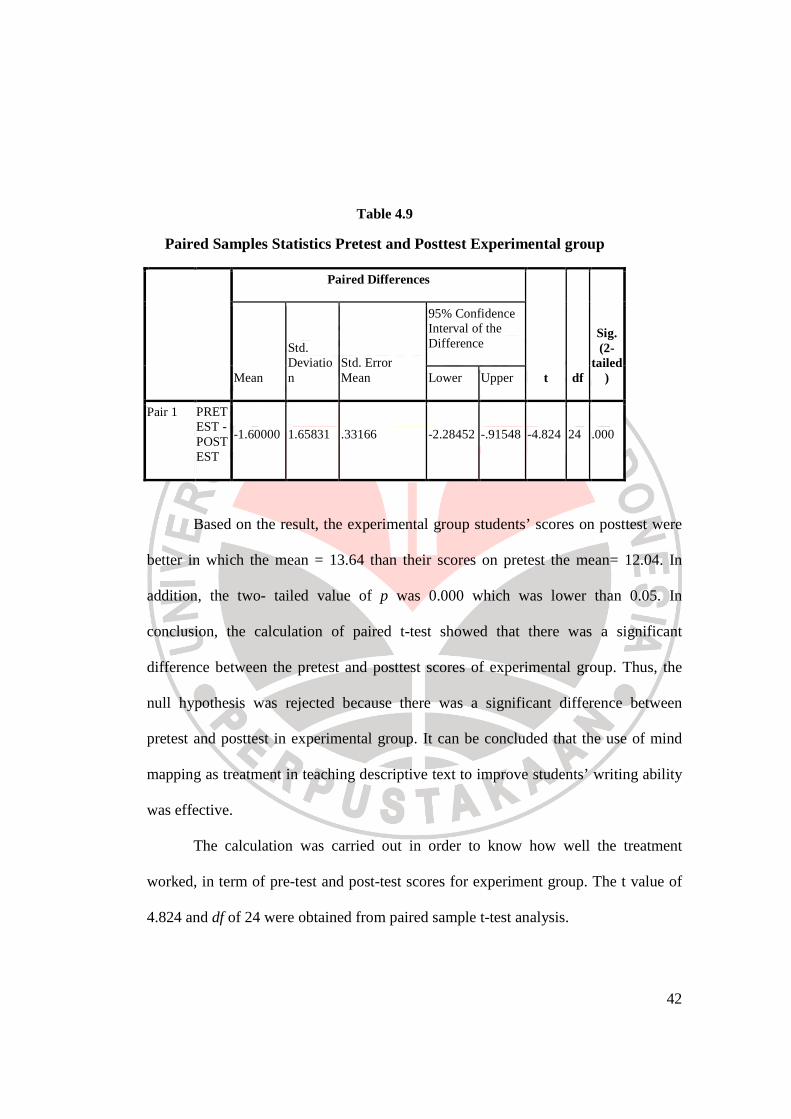
Table 4.9
Paired Samples Statistics Pretest and Posttest Experimental group
Paired Differences
t df
Sig. (2-
tailed)
Mean
Std. Deviation
Std. Error Mean
95% Confidence Interval of the Difference
Lower Upper
Pair 1 PRETEST - POSTEST
-1.60000 1.65831 .33166 -2.28452 -.91548 -4.824 24 .000
43
The result represented effect size with the value of r= 0.70 according to
Coolidge (2000: 152), the value of r was large effect. Thus, there was major effect of
mind mapping technique in students’ writing ability, in other word, the treatment
worked very well.
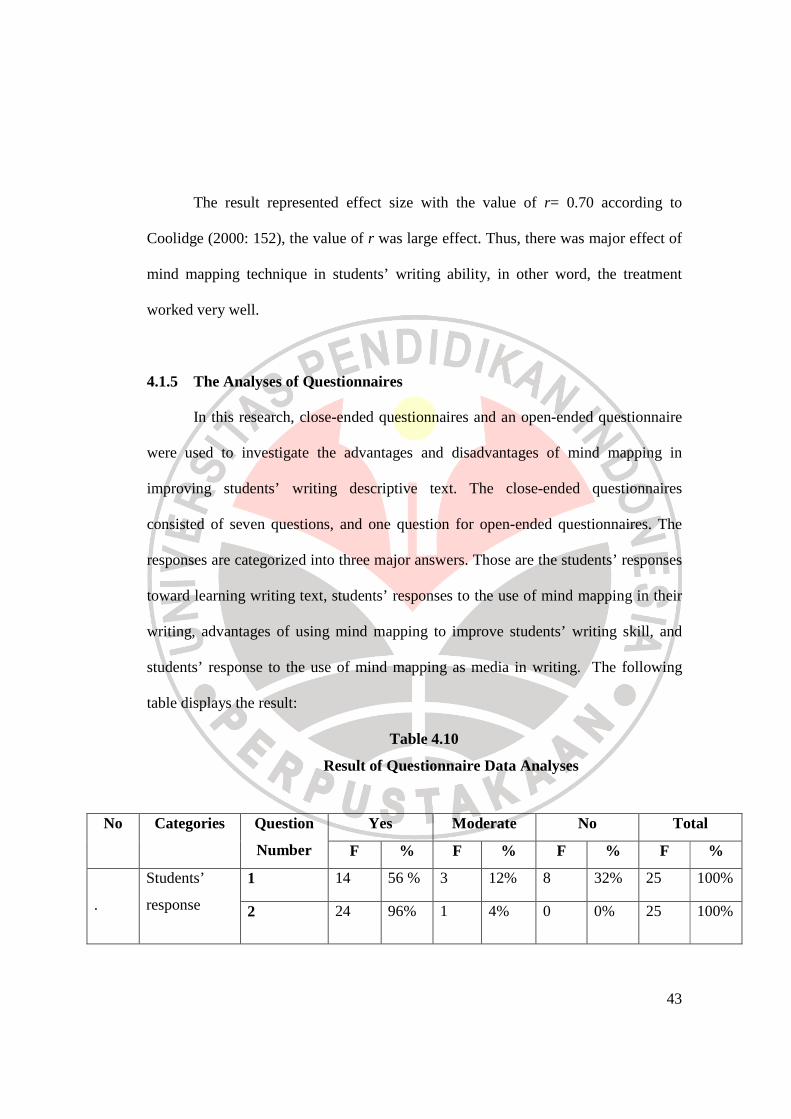
4.1.5 The Analyses of Questionnaires
In this research, close-ended questionnaires and an open-ended questionnaire
were used to investigate the advantages and disadvantages of mind mapping in
improving students’ writing descriptive text. The close-ended questionnaires
consisted of seven questions, and one question for open-ended questionnaires. The
responses are categorized into three major answers. Those are the students’ responses
toward learning writing text, students’ responses to the use of mind mapping in their
writing, advantages of using mind mapping to improve students’ writing skill, and
students’ response to the use of mind mapping as media in writing. The following
table displays the result:
Table 4.10
Result of Questionnaire Data Analyses
No Categories Question
Number
Yes Moderate No Total
F % F % F % F %
.
Students’
response
1 14 56 % 3 12% 8 32% 25 100%
2 24 96% 1 4% 0 0% 25 100%
44
toward their
learning
writing.
3 24 96% 0 0% 1 4% 25 100%
.
students’
response to
the use of
mind
mapping
technique in
their writing,
advantages of
using mind
mapping
technique to
improve
students’
writing skill
4 23 92% 2 8% 0 0% 25 100%
5 24 96 % 1 4% 0 0% 25 100%
.
Students’
response to
the use of
mind
mapping
techniques as
media in
writing.
6 7 28% 5 20% 13 52% 25 100%
7
24 96% 0 0% 1 4% 25 100%
45
The results of several categories above are interpreted into:
1. Students’ response toward their learning writing.
The result of first category in question no 1 indicates that more than half of
the students (56%) enjoy learning writing because they can increase their knowledge
through writing. In addition, the students also said that writing is fun, and they can
practice their English vocabulary. Nearly half of the students (32%) do not like
writing because the students assume that writing is boring and difficult. Small
numbers of the students (12%) moderate to answers this question.
Chart 4.1 Students’ interest in writing
Question no. 2 show almost of the students (96%) said that writing is the
important subject because writing can increase students’ knowledge; express
students’ ideas and some students said that writing is important for the better future.
Although the students enjoy learning writing, almost all of them (96 %) said that they
have problem in writing process.
46
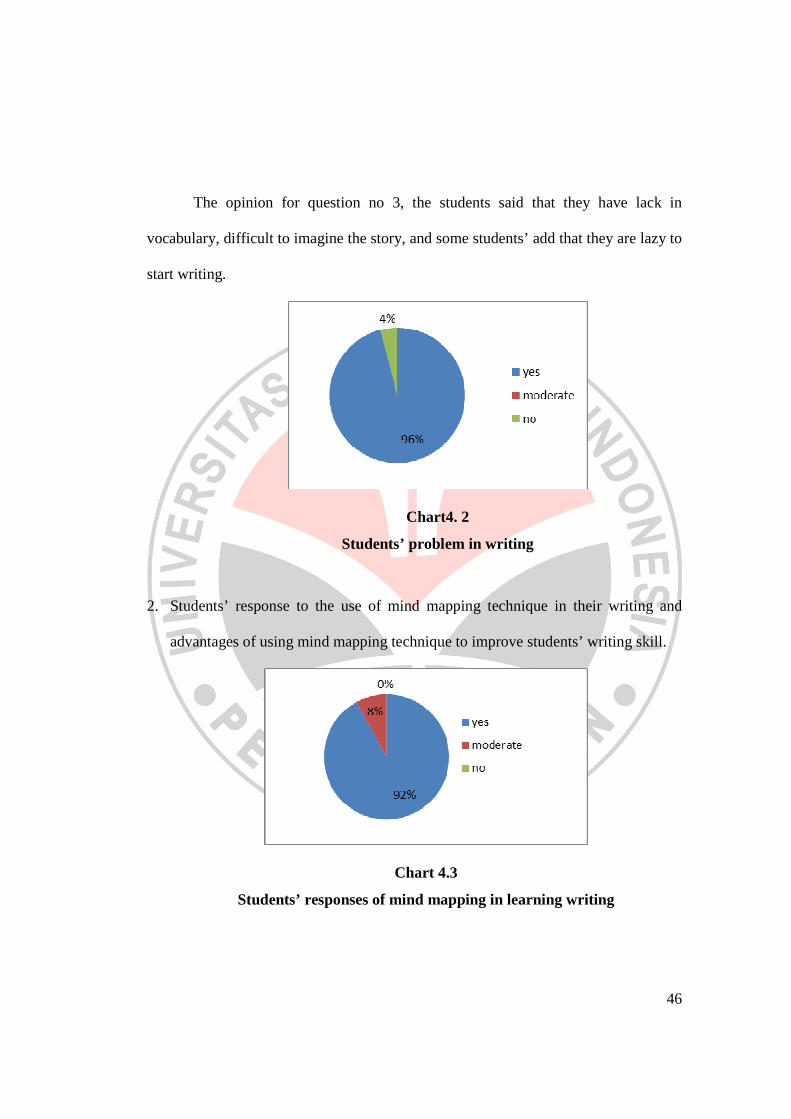
The opinion for question no 3, the students said that they have lack in
vocabulary, difficult to imagine the story, and some students’ add that they are lazy to
start writing.
Chart4. 2
Students’ problem in writing
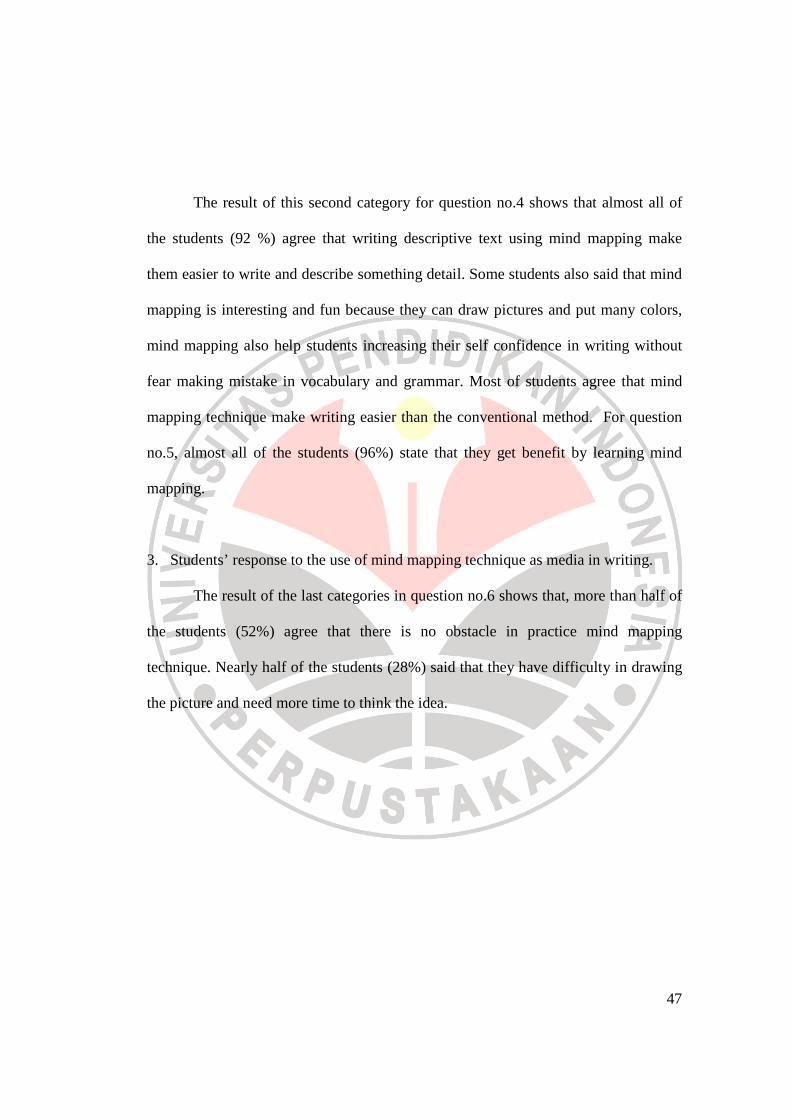
2. Students’ response to the use of mind mapping technique in their writing and
advantages of using mind mapping technique to improve students’ writing skill.
Chart 4.3
Students’ responses of mind mapping in learning writing
47
The result of this second category for question no.4 shows that almost all of
the students (92 %) agree that writing descriptive text using mind mapping make
them easier to write and describe something detail. Some students also said that mind
mapping is interesting and fun because they can draw pictures and put many colors,
mind mapping also help students increasing their self confidence in writing without
fear making mistake in vocabulary and grammar. Most of students agree that mind
mapping technique make writing easier than the conventional method. For question
no.5, almost all of the students (96%) state that they get benefit by learning mind
mapping.
3. Students’ response to the use of mind mapping technique as media in writing.
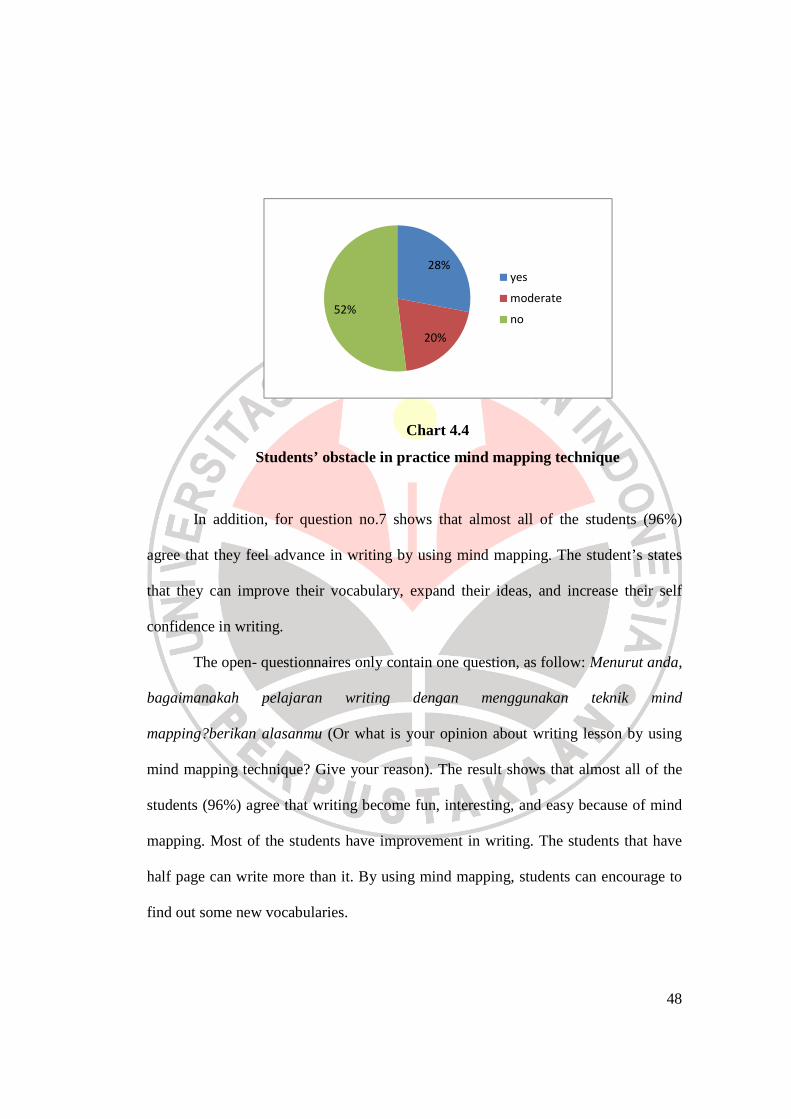
The result of the last categories in question no.6 shows that, more than half of
the students (52%) agree that there is no obstacle in practice mind mapping
technique. Nearly half of the students (28%) said that they have difficulty in drawing
the picture and need more time to think the idea.
48
28%
20%
52%
yes
moderate
no
Chart 4.4
Students’ obstacle in practice mind mapping technique
In addition, for question no.7 shows that almost all of the students (96%)
agree that they feel advance in writing by using mind mapping. The student’s states
that they can improve their vocabulary, expand their ideas, and increase their self
confidence in writing.
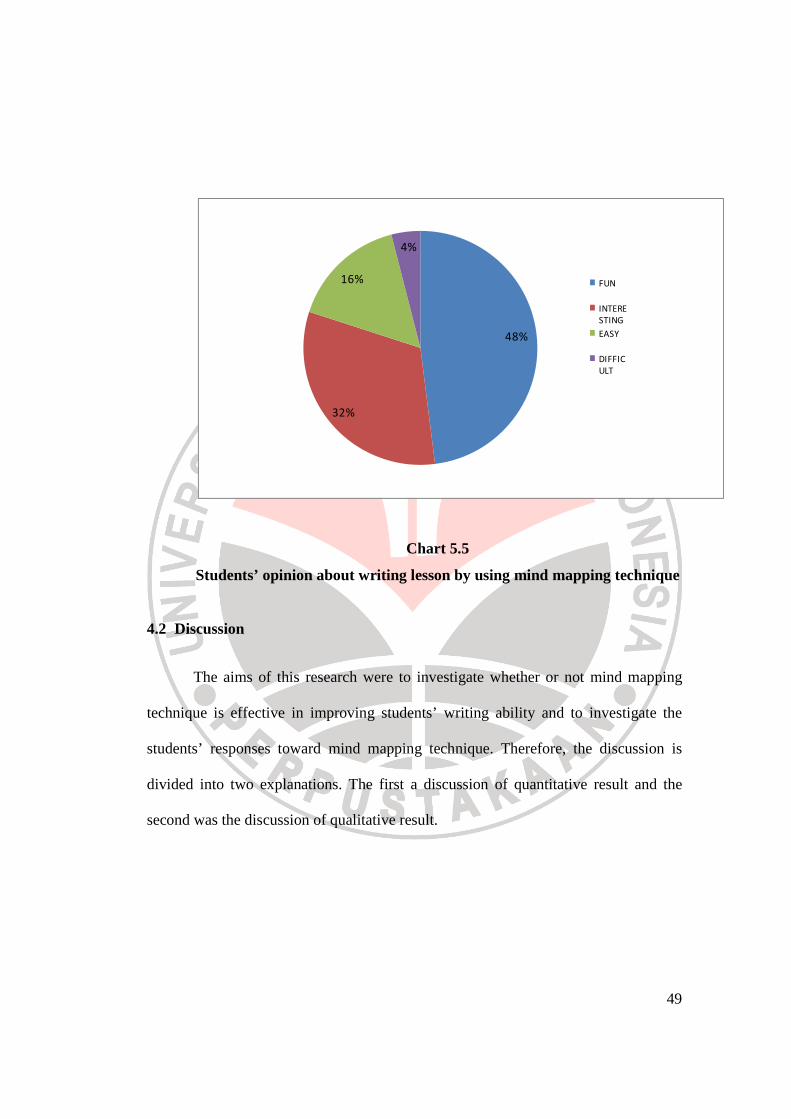
The open- questionnaires only contain one question, as follow: Menurut anda,
bagaimanakah pelajaran writing dengan menggunakan teknik mind
mapping?berikan alasanmu (Or what is your opinion about writing lesson by using
mind mapping technique? Give your reason). The result shows that almost all of the
students (96%) agree that writing become fun, interesting, and easy because of mind
mapping. Most of the students have improvement in writing. The students that have
half page can write more than it. By using mind mapping, students can encourage to
find out some new vocabularies.
49
48%
32%
16%
4%
FUN
INTERE
STING
EASY
DIFFIC
ULT
Chart 5.5
Students’ opinion about writing lesson by using mind mapping technique
4.2 Discussion
The aims of this research were to investigate whether or not mind mapping
technique is effective in improving students’ writing ability and to investigate the
students’ responses toward mind mapping technique. Therefore, the discussion is
divided into two explanations. The first a discussion of quantitative result and the
second was the discussion of qualitative result.
50
4.2.1 The Quantitative Result
The statistical computation on the pre-test scores of the experimental and
control group using SPSS 16.0 for windows show that the distribution of the
experimental and the control group’s scores are normally distributed. Since the pre-
test scores of the experimental and control groups are normally distributed, it means a
parametric test using t-test should be used. Brown (1995: 166) states that there are
two requirements to be able to make assumption from t-test result, the score in each
group were normally distributed and variance of the score of the two groups are
equal. An independent sample test using t-test shows that both of the control and
experimental groups are homogenous
The improvement of students’ writing skill can be seen from the effect size t
value is 0.008 and df is 48. It is found that r value is 0.369. It means that there is a
significant improvement in students’ writing ability. To support the data, paired
sample test is represented. It can be seen from average pre-test score (12.04) and the
average of post-test (13.64). It is increase 1.6 point, which is means that mind
mapping influence students writing ability (Coolidge, 2000).
4.2.2 The Qualitative Result
The statistical calculation is represent that there is a significant influence of
mind mapping in improving students’ writing ability. It means that in the
implementation, there are positive responses from the students toward mind mapping.
However, based on the result of questionnaires, it can be found that there are not only
51
positive responses toward mind mapping technique, but also some negative responses
from the students. It brings effect on the lack of their motivation to implement mind
mapping in the English learning.
The students’ responses toward learning writing text, it can be seen that
students do not like writing because the students assume that writing is boring and
difficult. This finding support the statement of Crider (2006:29) that writing become
more complex and spent most a lot of time to think if we do not follow the series of
steps. Unlike Crider (2006) who stated that writing does not only need skill but also
need patience, the questionnaires answers find that students was boring before they
start to write, it can be seen from students’ reason why they do not like writing.
The reason why students do not like writing it is because they have problem in
writing process, some reasons that students’ have are lack of vocabularies, difficult
to imagine the story, and lazy to start writing. As Blanchard and Root (2004: 11)
explained about three steps in writing process: prewriting; generating idea, and
organizing idea. Then, writing; using ideas to write a first draft. Last, revising and
editing; improving what have written. It became a difficult activity for students since
they have a problem in extended the idea, lack of vocabularies and finally lazy to start
writing. Hyland (2003:9) state that writing is a way of sharing personal meanings and
it is emphasized the power of personality to construct someone’s view based on a
certain topic, it became hard to implement for students in learning writing.
52
However, the students’ responses toward mind mapping technique are show
that they agree that mind mapping help them to make writing easier, especially in
descriptive text. In seven steps of making mind mapping (Buzan & Abbot: 2010 )
supported these state that image, picture and color in mind mapping technique help
students to stimulated creative thinking and keep focused to the subject that they want
to described.
As Crider (2006) states that without guidance, some students never will learn
to write. Mind mapping is a tool to facilitate students in extended their creativity by
registering and planning using harmony work of brain (Brendan: 2002). It gives
advantages in improving students’ writing ability. It can be seen from the students’
reason, they said that mind mapping is interesting and fun because they can draw
pictures and put many colors, mind mapping also help students increasing their self
confidence in writing without fear making mistake in vocabulary and grammar.
Although data statistical and students’ responses showed good result, the
students still have some difficulties in implementing mind mapping (28%), this result
is contrast to Micalko cited from Buzan and Abbot (2010) who relied that the
advantages of mind mapping help mind from mental problem, he also states that
anything can be mapped. In this research, some of the students have difficulties in
drawing; it made them stress and need more time to deliver their ideas into a good
picture or interesting colors.
Generally, mind mapping for almost of the students contribute in improving
their writing ability, mind mapping can improve their vocabulary, expand their ideas,
53
and interest to apply in writing process. This findings support the previous research
which had been conducted. Wahyudi (2008) in his study found that mind mapping
technique allows students to generate thinking in a continuous and progressive ways
in creativity, thinking, efficient planning, effective studying, enhanced
communication, and concentration, among other things. In addition, Mariani (2005)
cited from Kusumaningsih (2008: 28) in her study investigated the use of mind
mapping as a visual media in improving students’ writing skill. The result of her
study showed that there were several improvements of students’ score in writing.