Embed Size (px)
Citation preview
144
CHAPTER IV
COST STRUCTURE
4.01 Introduction
4.02 Production performance of raw cashewnut
4.02.1 General information of cashew growers
4.02.2 Age
4.02.3 Education
4.02.4 Occupation
4.02.5 Family Size
4.03 Details of Cashew Orchard
4.03.1 Bearing cashew orchard
a. Local Varieties
b. High Yielding Varieties
c. Varieties Grown
4.04 Establishment of Cashew Orchard
4.04.1 Operation wise labour utilization
4.04.2 Composition of Labour Utilization per Hectare
4.04.3 Cost incurred on Labour per Hectare
4.04.4 Other physical inputs
a) Grafts
b) Manures
c) Fertilizers
d) Plant Protection
e) Fencing
4.04.5 Cost of establishment for high yielding varieties
a) Input wise
b) Year wise
4.04.6 Cost of establishment for cashew orchard of local
varieties
145
4.05 Cost of Cultivation
4.05.1 Physical inputs utilization
4.05.2 Cost of Cultivation of local variety and HYV
cashew orchard
4.05.3 Yield, Returns and Profitability
4.06 Economic evaluation of investment in cashew orchards
4.07 Cashew Processing
4.07.1 Classification of Cashew Units
4.07.2 General Information
4.07.3 Working Season, Employment and Wage Rate
4.07.4 Fixed Capital Investment Pattern in Cashew
Processing Units
4.07.5 Working Capital Investment
4.07.6 Investment Pattern and Organizational Structure of
Cashew Processing Units
a) Capital Investment Patterns in Cashew Processing Units
b) Procurement of Raw Material
4.08 Cost of Processing
4.08.1 Quantity of main Product and by-product
4.08.2 Quantity parameters of Cashew Kernels
4.08.3 Recovery of Kernels as per grade
4.08.4 Per Unit Cost and Returns from Processing of Units
4.09 Cost and Return Structure Involved in Cashew Processing
4.10 Performance of Cashew Processing Units
4.10.1 Capacity Utilization in Cashew Processing Units
4.10.2 Added Value
4.11 Résumé
146
4.01 Introduction
In the present age of competition, the success of any enterprise in the
business of agriculture can be judged on the basis of economic benefits accured
to entrepreneur from a particular crop or livestock enterprise. It has become
necessary for the farmers to look towards agriculture as a commercial
proposition, particularly fruit crops like cashew which has long economic life
of almost 40 years. Returns from cashew are spread over longer period, on the
other hand during development stage of orchard, large investment is made in
establishment of orchard. This has to be judged economically from the point of
view of profitability over life period. This cannot be achieved unless the
farmers are conscious about various aspects of production and disposal such as
yields, prices of inputs and outputs, costs, returns and profitability etc. and
unless the tries costs are minimized and returns are maximized.
The selected cashew growers for this study have been classified into two
broad categories viz. i.) Cashew growers having local varieties plantation
(local) and ii.) Cashew growers having high yielding varieties plantation (high
yielding) as mentioned in the methodology.
The data pertinent to the present study have been collected from various
sources and analysed using appropriate technique. The results of the analysis
are presented under the following headings.
1. Production Performance of Raw Cashewnut
2. Investment pattern in cashew processing unit.
147
3. Cost and return structure in cashew processing unit.
4. Performance of cashew processing unit.
5. The problems faced by the unit and to suggest measures for
effective functioning of the unit.
4.02 Production performance of raw cashewnut:
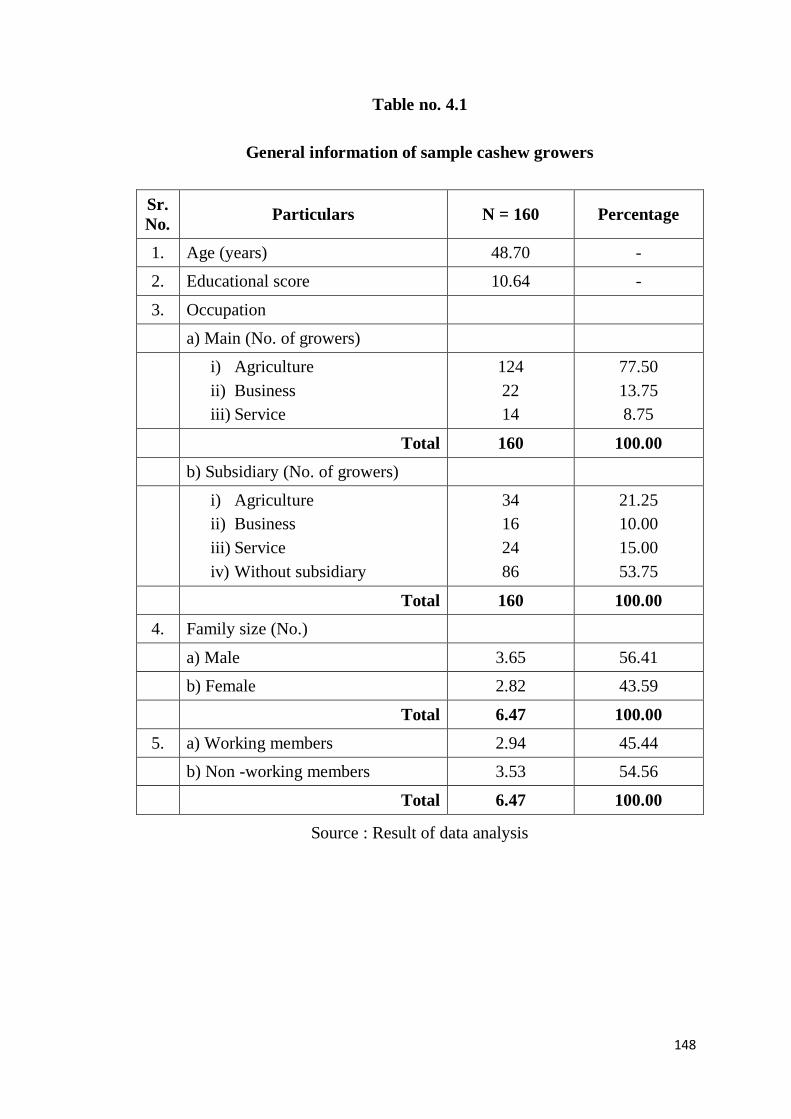
4.02.1 General information of cashew growers
The general information of the sample farmers having bearing orchards
with respect to age, educational score, occupation and family size is presented
in Table 4.1.
148
Table no. 4.1
General information of sample cashew growers
Sr.
No. Particulars N = 160 Percentage
1. Age (years) 48.70 -
2. Educational score 10.64 -
3. Occupation
a) Main (No. of growers)
i) Agriculture
ii) Business
iii) Service
124
22
14
77.50
13.75
8.75
Total 160 100.00
b) Subsidiary (No. of growers)
i) Agriculture
ii) Business
iii) Service
iv) Without subsidiary
34
16
24
86
21.25
10.00
15.00
53.75
Total 160 100.00
4. Family size (No.)
a) Male 3.65 56.41
b) Female 2.82 43.59
Total 6.47 100.00
5. a) Working members 2.94 45.44
b) Non -working members 3.53 54.56
Total 6.47 100.00
Source : Result of data analysis
149
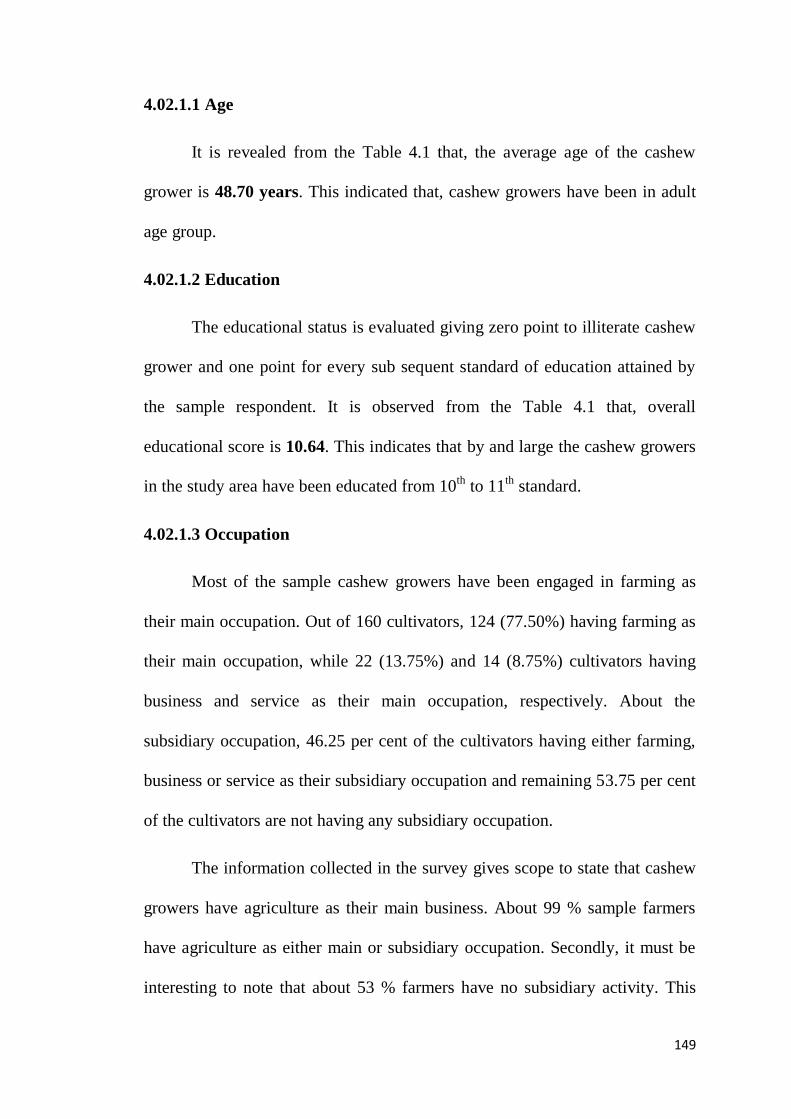
4.02.1.1 Age
It is revealed from the Table 4.1 that, the average age of the cashew
grower is 48.70 years. This indicated that, cashew growers have been in adult
age group.
4.02.1.2 Education
The educational status is evaluated giving zero point to illiterate cashew
grower and one point for every sub sequent standard of education attained by
the sample respondent. It is observed from the Table 4.1 that, overall
educational score is 10.64. This indicates that by and large the cashew growers
in the study area have been educated from 10th
to 11th
standard.
4.02.1.3 Occupation
Most of the sample cashew growers have been engaged in farming as
their main occupation. Out of 160 cultivators, 124 (77.50%) having farming as
their main occupation, while 22 (13.75%) and 14 (8.75%) cultivators having
business and service as their main occupation, respectively. About the
subsidiary occupation, 46.25 per cent of the cultivators having either farming,
business or service as their subsidiary occupation and remaining 53.75 per cent
of the cultivators are not having any subsidiary occupation.
The information collected in the survey gives scope to state that cashew
growers have agriculture as their main business. About 99 % sample farmers
have agriculture as either main or subsidiary occupation. Secondly, it must be
interesting to note that about 53 % farmers have no subsidiary activity. This
150
means that 53 % of the farmers are dependent entirely on agriculture. They
have no other source of income.
4.02.1.4 Family size
Size of the family is the important factor influencing the supply of farm
labour. It also affects income generating capacity of farmer‟s family. It is
observed from Table 4.1 that, the average size of family is 6.47 persons with
3.65 male and 2.82 female members. Out of the total family members, 45.44
per cent persons are working members.
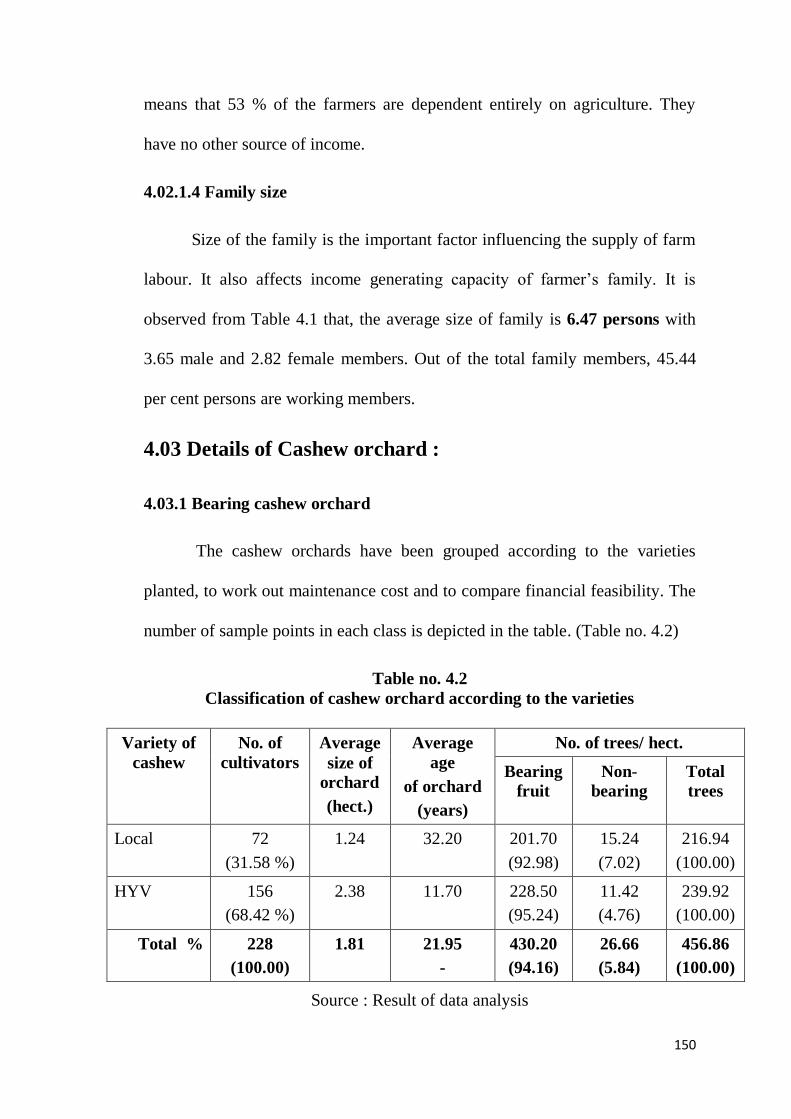
4.03 Details of Cashew orchard :
4.03.1 Bearing cashew orchard
The cashew orchards have been grouped according to the varieties
planted, to work out maintenance cost and to compare financial feasibility. The
number of sample points in each class is depicted in the table. (Table no. 4.2)
Table no. 4.2
Classification of cashew orchard according to the varieties
Variety of
cashew
No. of
cultivators
Average
size of
orchard
(hect.)
Average
age
of orchard
(years)
No. of trees/ hect.
Bearing
fruit
Non-
bearing
Total
trees
Local 72
(31.58 %)
1.24
32.20 201.70
(92.98)
15.24
(7.02)
216.94
(100.00)
HYV 156
(68.42 %)
2.38
11.70 228.50
(95.24)
11.42
(4.76)
239.92
(100.00)
Total % 228
(100.00)
1.81
21.95
-
430.20
(94.16)
26.66
(5.84)
456.86
(100.00)
Source : Result of data analysis
151
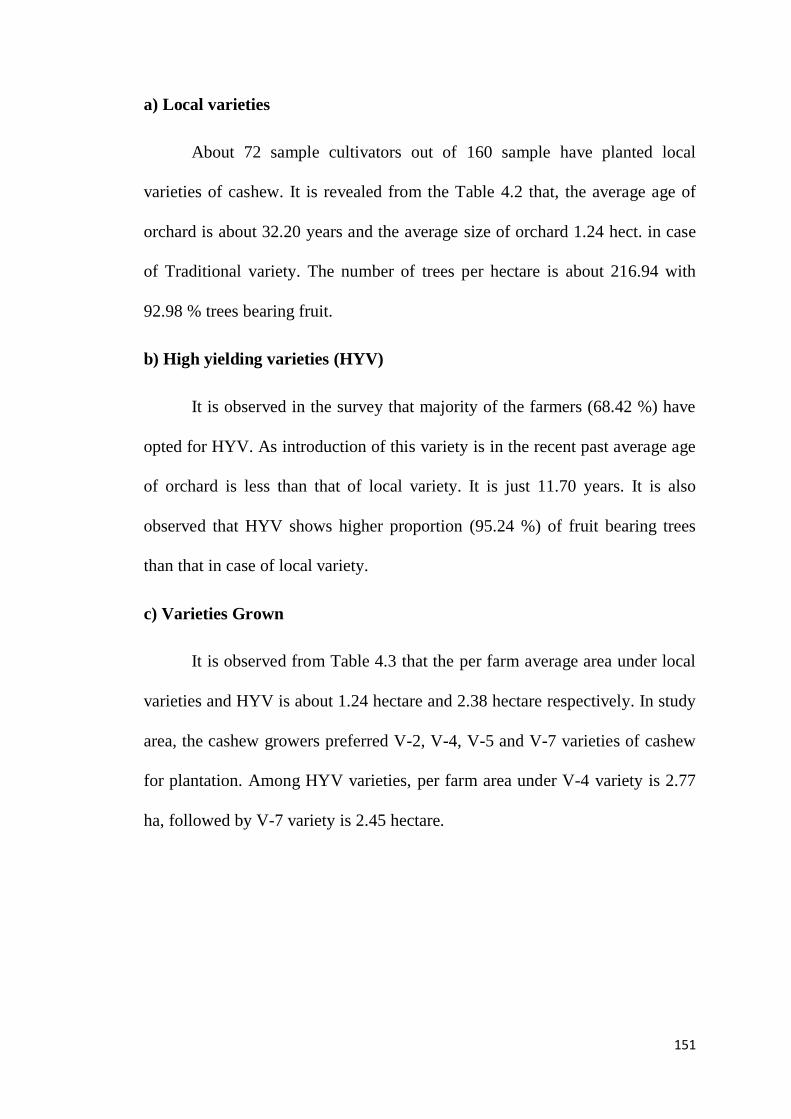
a) Local varieties
About 72 sample cultivators out of 160 sample have planted local
varieties of cashew. It is revealed from the Table 4.2 that, the average age of
orchard is about 32.20 years and the average size of orchard 1.24 hect. in case
of Traditional variety. The number of trees per hectare is about 216.94 with
92.98 % trees bearing fruit.
b) High yielding varieties (HYV)
It is observed in the survey that majority of the farmers (68.42 %) have
opted for HYV. As introduction of this variety is in the recent past average age
of orchard is less than that of local variety. It is just 11.70 years. It is also
observed that HYV shows higher proportion (95.24 %) of fruit bearing trees
than that in case of local variety.
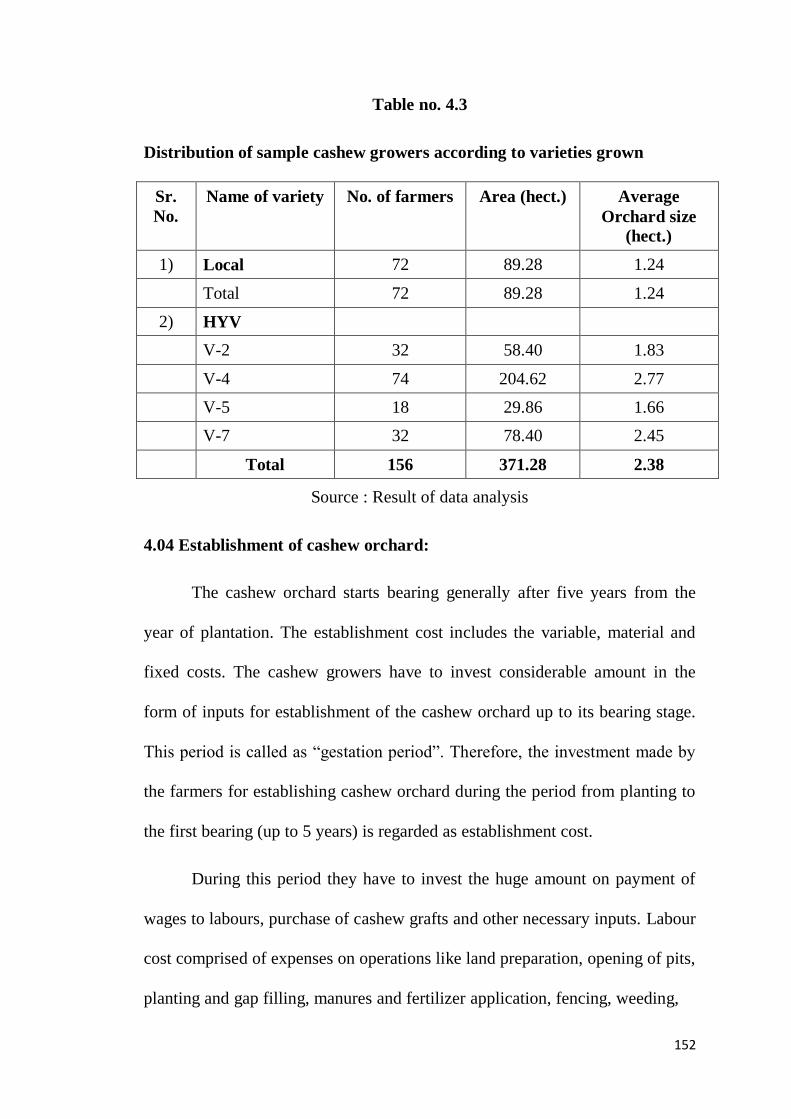
c) Varieties Grown
It is observed from Table 4.3 that the per farm average area under local
varieties and HYV is about 1.24 hectare and 2.38 hectare respectively. In study
area, the cashew growers preferred V-2, V-4, V-5 and V-7 varieties of cashew
for plantation. Among HYV varieties, per farm area under V-4 variety is 2.77
ha, followed by V-7 variety is 2.45 hectare.
152
Table no. 4.3
Distribution of sample cashew growers according to varieties grown
Sr.
No.
Name of variety No. of farmers Area (hect.) Average
Orchard size
(hect.)
1) Local 72 89.28 1.24
Total 72 89.28 1.24
2) HYV
V-2 32 58.40 1.83
V-4 74 204.62 2.77
V-5 18 29.86 1.66
V-7 32 78.40 2.45
Total 156 371.28 2.38
Source : Result of data analysis
4.04 Establishment of cashew orchard:
The cashew orchard starts bearing generally after five years from the
year of plantation. The establishment cost includes the variable, material and
fixed costs. The cashew growers have to invest considerable amount in the
form of inputs for establishment of the cashew orchard up to its bearing stage.
This period is called as “gestation period”. Therefore, the investment made by
the farmers for establishing cashew orchard during the period from planting to
the first bearing (up to 5 years) is regarded as establishment cost.
During this period they have to invest the huge amount on payment of
wages to labours, purchase of cashew grafts and other necessary inputs. Labour
cost comprised of expenses on operations like land preparation, opening of pits,
planting and gap filling, manures and fertilizer application, fencing, weeding,
153
watch and ward and spraying of chemicals etc. Therefore, the capital
investment for establishing cashew orchards on different inputs was studied
and the results are given below.
4.04.1 Operation wise labour utilization :
The requirement of human labour is observed as woman days and
manday. In the study area cost of one manday is Rs. 100/- and that of a
womanday is 70/-. The labour cost is computed on the basis average man and
womandays per hectare of cashew plantation. It is also observed (Table 4.6)
that yearly cost of human labour varies according the age of orchard. The
operationwise and yearwise per hectare human labour utilization for
establishing cashew orchards was analyzed separately and the results of the
analysis are presented in Table 4.4.
154
Table no. 4.4
Operation wise per hectare labour (Human days) required for
establishment of cashew orchard (HYV)
Sr.
No. Operation
1st
year
2nd
year
3rd
year
4th
year
5th
year Total
1. Land preparation 72.34 -- -- -- -- 72.34
(15.77)
2. Layout leveling 16.80 -- -- -- -- 16.80
(3.66)
3. Digging of pits
filling with soil
11.42 -- -- -- -- 11.42
(2.49)
4. Planting
i) Preparation of basin
ii) Providing support and shade
7.84
10.96
--
8.24
--
4.92
--
--
--
--
7.84 (1.71)
24.12 (5.26)
5. Fencing and
repairing to fence
17.28 6.56 4.56 4.14 3.28 35.82
(7.81)
6. Irrigation 62.60 32.80 25.58 -- -- 120.98 (26.37)
7. Intercultural
operation
15.14 10.08 10.52 6.96 7.94 50.64
(11.04)
8. Manu ring and
fertilization
11.19 12.38 13.20 14.82 15.20 66.79
(14.56)
9. Plant protection 3.85 4.76 5.14 5.76 5.28 24.79 (5.40)
10. Mulching 4.30 3.82 2.82 -- -- 10.94
(2.38)
11. Others 5.25 3.74 3.22 2.78 1.32 16.31
(3.56)
Total
(%)
238.97
(52.09)
82.38
(17.96)
69.96
(15.25)
34.46
(7.51)
33.02
(7.20)
458.79
(100.00)
Source : Result of data analysis
155
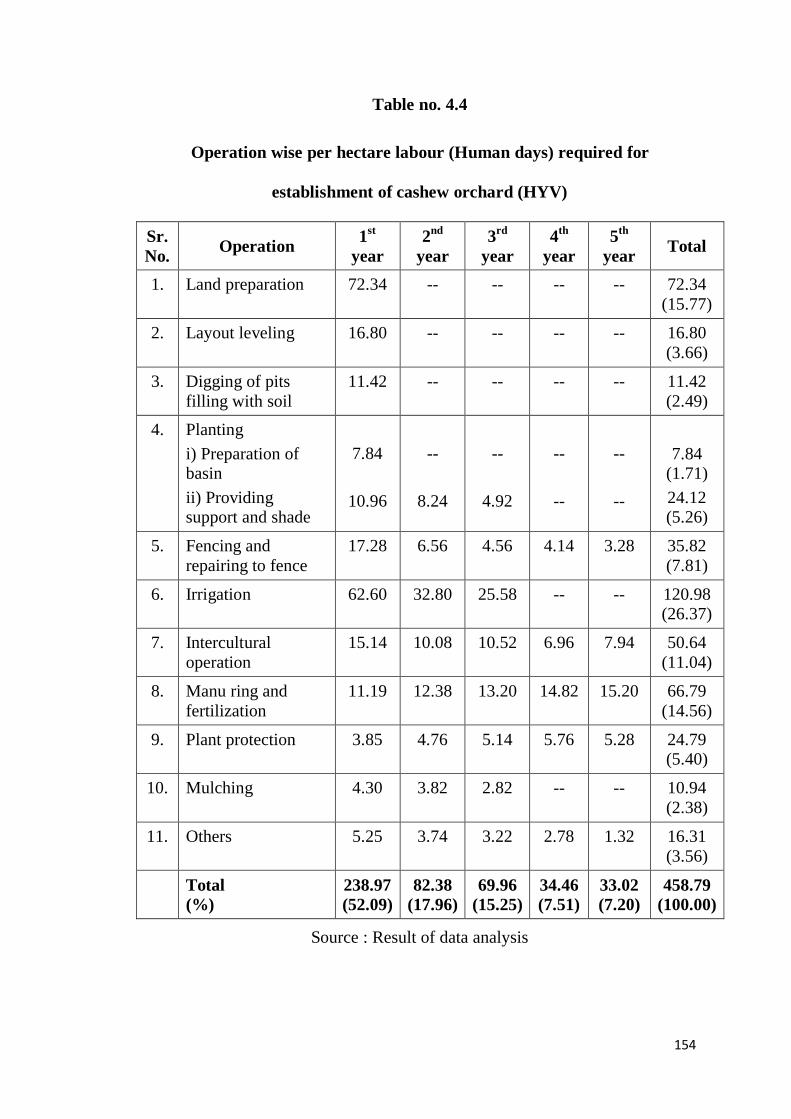
It is seen from the Table 4.4 that, total per hectare labour utilized for
establishing graft (high yielding) cashew orchard is 458.79 human days, of
which maximum i.e. 120.98 human days (26.37%) have been utilized for
irrigation/hand watering followed by 89.14 human days (19.43%) for land
preparation i.e. removal of grasses, weeds and bushes, levelling of layout etc.,
66.79 human days (14.56%) for manuring and fertilization of young plants,
50.64 human days (11.04%) for intercultural operations, 35.82 human days
(7.81%) for fencing and repairing to fence, 31.96 human days (6.97%) for
planting i.e. for preparation of basin and providing support and shade, 24.79
human days (5.40%) for plant protection measures, 10.94 human days (2.38%)
for mulching, 11.42 human days (2.49%) for digging of pits and filling with
soil and 16.31 human days (3.56%) for others i.e. after care or watching etc.
As regards yearwise utilization of labour, maximum labours (52.09%)
have been utilized during the first year of plantation. This is because of major
important operations like preparation of land, digging of pits, planting of grafts,
fencing etc. have been performed in the first year. The labour utilization
decreased from second year (17.96%) to fifth year (7.20%). The operation of
the mulching and irrigation carried out in second and third year by few
growers, however these operations are not done in fourth and fifth year of
plantation.
4.04.2 Composition of labour utilization per hectare :
Per hectare composition of labour utilized and the wages paid to the
labour are also given in Table 4.5
156
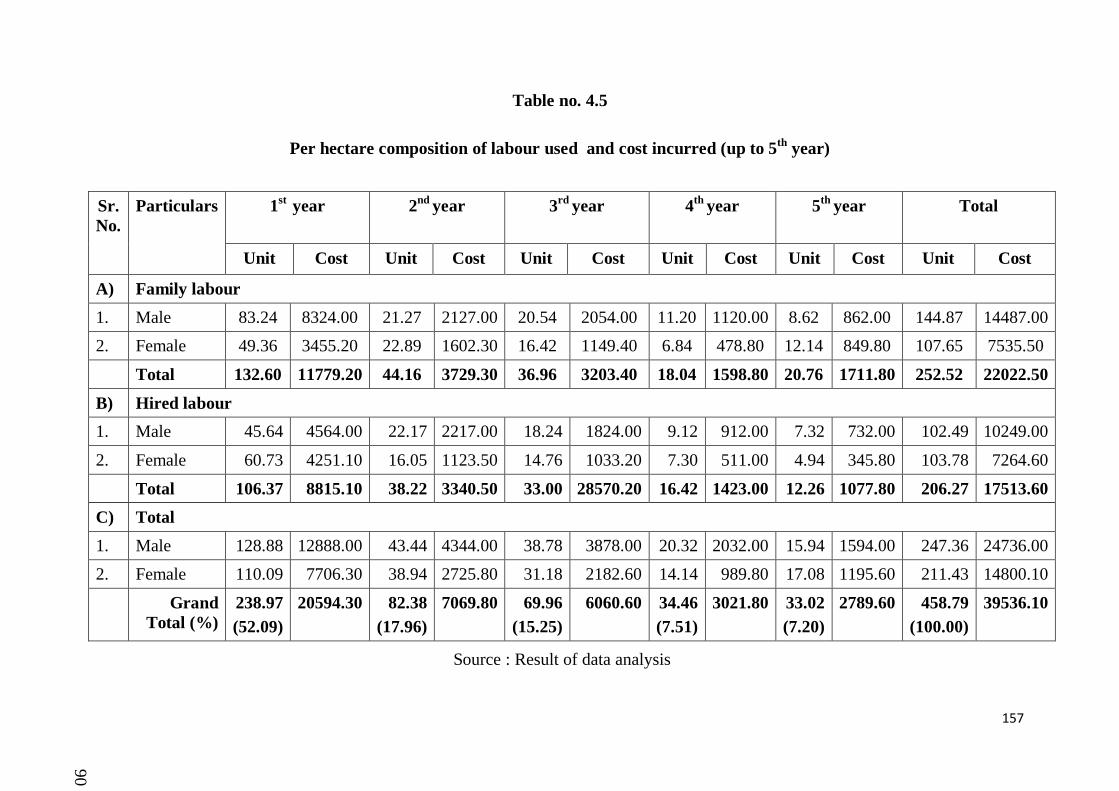
Per hectare total labour required for establishment of cashew orchard is
458.79 human days, of which 252.52 human days (55.04%) is family labour
and 206.27 human days (44.96%) is hired labour. This showed that, generally
cashew plantation is done by family members and hired labour have been taken
for few operations like harvesting, irrigation, digging of pits etc.
As regards year wise total labour utilization during five years period, it
is found that 238.97 human days (52.09%) have been used in the first year,
82.38 human days (17.96%) in the second year, 69.96 human days (15.25%) in
the third year, 34.46 human days (7.51%) in the fourth year and 33.02 human
days (7.20%) in the fifth year.
Among the total per hectare labour utilization, the composition of male
and female is 247.36 human days (53.92%) and 211.43 human days (46.08%)
respectively. This showed that, throughout the establishment period the
utilization of male labour is more than the female labour.
4.04.3 Cost incurred on labour per hectare :
It is observed from Table 4.5 revealed that total per hectare cost incurred
on labour in a period of five years for establishing cashew orchard worked out
to Rs. 39536.10. Out of this cost incurred on labour is maximum in the first
year Rs. 20594.30 because operation like land preparation, layout levelling and
planting is carried out only in first year. After that cost incurred on labour
decreased, Rs. 7069.80 in second year, Rs. 6060.60 in third year Rs. 3021.80
in fourth year and Rs. 2789.60 in fifth year.
157
Table no. 4.5
Per hectare composition of labour used and cost incurred (up to 5th
year)
Sr.
No.
Particulars
1st
year
2nd
year 3rd
year 4th
year
5th
year Total
Unit Cost Unit Cost Unit Cost Unit Cost Unit Cost Unit Cost
A) Family labour
1. Male 83.24 8324.00 21.27 2127.00 20.54 2054.00 11.20 1120.00 8.62 862.00 144.87 14487.00
2. Female 49.36 3455.20 22.89 1602.30 16.42 1149.40 6.84 478.80 12.14 849.80 107.65 7535.50
Total 132.60 11779.20 44.16 3729.30 36.96 3203.40 18.04 1598.80 20.76 1711.80 252.52 22022.50
B) Hired labour
1. Male 45.64 4564.00 22.17 2217.00 18.24 1824.00 9.12 912.00 7.32 732.00 102.49 10249.00
2. Female 60.73 4251.10 16.05 1123.50 14.76 1033.20 7.30 511.00 4.94 345.80 103.78 7264.60
Total 106.37 8815.10 38.22 3340.50 33.00 28570.20 16.42 1423.00 12.26 1077.80 206.27 17513.60
C) Total
1. Male 128.88 12888.00 43.44 4344.00 38.78 3878.00 20.32 2032.00 15.94 1594.00 247.36 24736.00
2. Female 110.09 7706.30 38.94 2725.80 31.18 2182.60 14.14 989.80 17.08 1195.60 211.43 14800.10
Grand
Total (%)
238.97
(52.09)
20594.30 82.38
(17.96)
7069.80 69.96
(15.25)
6060.60 34.46
(7.51)
3021.80 33.02
(7.20)
2789.60 458.79
(100.00)
39536.10
Source : Result of data analysis
90
158
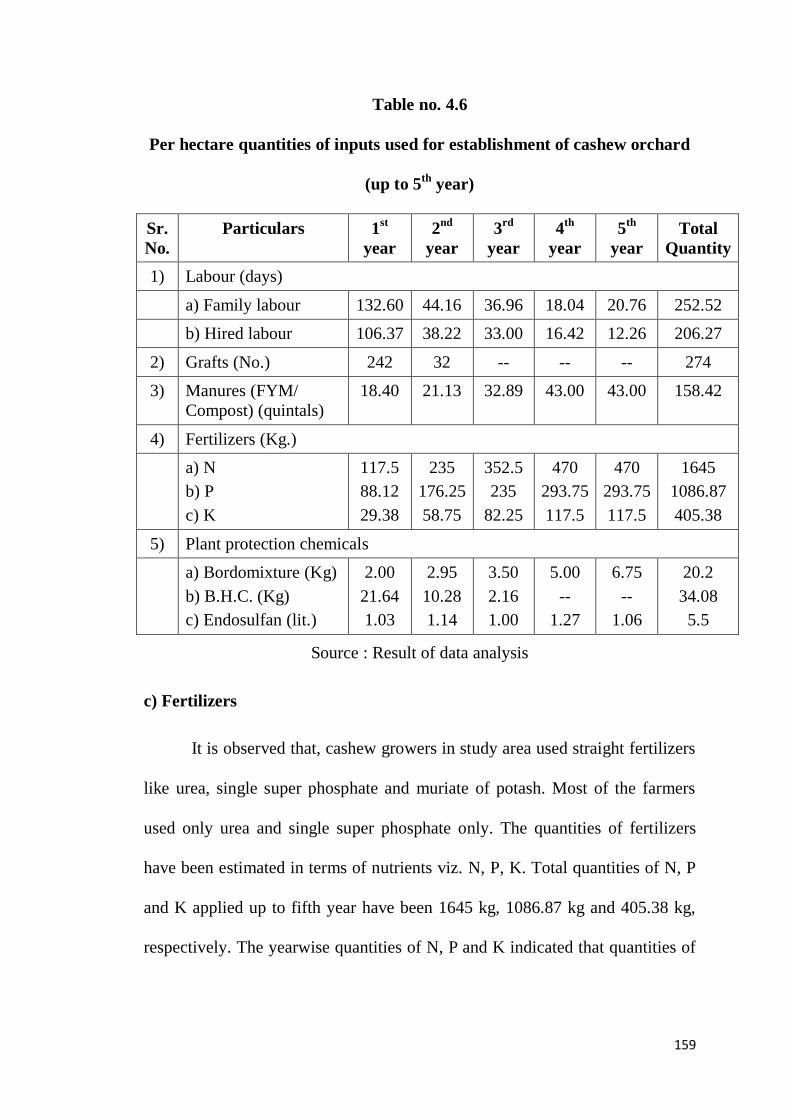
4.04.4 Other physical inputs :
Per hectare quantities and values of different inputs used for establishing
cashew orchard are given in Table 4.6 & 4.7
a) Grafts
On an average 242 grafts are planted in a hectare at the cost of Rs. 3630
in the first year. The number of grafts used for gap filling in second year is 32
on which amount spent is Rs. 480. Thus, in the establishment period of five
years, totally 274 grafts are used for establishing cashew orchard with an
amount of Rs. 4110.
b) Manures
The manures used have been mostly compost or FYM. The total
quantity of manures applied for five years worked out to 158.42 quintals on
which Rs. 23763 have been invested. Out of total quantity of manures, 18.40
quintals is used during first year, 21.13 quintals during second year, 32.89
quintals during third year and 43 quintals each during fourth and fifth year.
159
Table no. 4.6
Per hectare quantities of inputs used for establishment of cashew orchard
(up to 5th
year)
Sr.
No.
Particulars 1st
year
2nd
year
3rd
year
4th
year
5th
year
Total
Quantity
1) Labour (days)
a) Family labour 132.60 44.16 36.96 18.04 20.76 252.52
b) Hired labour 106.37 38.22 33.00 16.42 12.26 206.27
2) Grafts (No.) 242 32 -- -- -- 274
3) Manures (FYM/
Compost) (quintals)
18.40 21.13 32.89 43.00 43.00 158.42
4) Fertilizers (Kg.)
a) N
b) P
c) K
117.5
88.12
29.38
235
176.25
58.75
352.5
235
82.25
470
293.75
117.5
470
293.75
117.5
1645
1086.87
405.38
5) Plant protection chemicals
a) Bordomixture (Kg)
b) B.H.C. (Kg)
c) Endosulfan (lit.)
2.00
21.64
1.03
2.95
10.28
1.14
3.50
2.16
1.00
5.00
--
1.27
6.75
--
1.06
20.2
34.08
5.5
Source : Result of data analysis
c) Fertilizers
It is observed that, cashew growers in study area used straight fertilizers
like urea, single super phosphate and muriate of potash. Most of the farmers
used only urea and single super phosphate only. The quantities of fertilizers
have been estimated in terms of nutrients viz. N, P, K. Total quantities of N, P
and K applied up to fifth year have been 1645 kg, 1086.87 kg and 405.38 kg,
respectively. The yearwise quantities of N, P and K indicated that quantities of
160
N, P and K increased from first year to third year and remained same in fourth
and fifth year.
d) Plant Protection
The yearwise quantities of plant protection chemicals used indicated that
the quantities used during first year have been comparatively less, while the
quantities increased in subsequent years. The quantities of plant protection
chemicals included Bordeaux mixture, B.H.C. and Endosulfan. The B.H.C.
used more in the first year and then it was reduced in second and third year.
While that of Bordeaux mixture its use increased from first year to fifth year.
The Endosulfan used in very negligible quantity and showing that pest and
disease occurrence was very less or negligible at younger stage of plant. The
total amount of expenditure incurred on plant protection chemicals was about
Rs. 3797.08.
e) Fencing
Cashew growers in study area have been found to use barbed wire for
the fencing the cashew orchard of grafts. Total expenditure on fencing to
orchard was about Rs. 25550 up to fifth year. Another material used was grass
for mulching and providing shade, bamboo sticks for supporting to each plant
separately. The total expenditure incurred on that was about Rs. 3054.25.
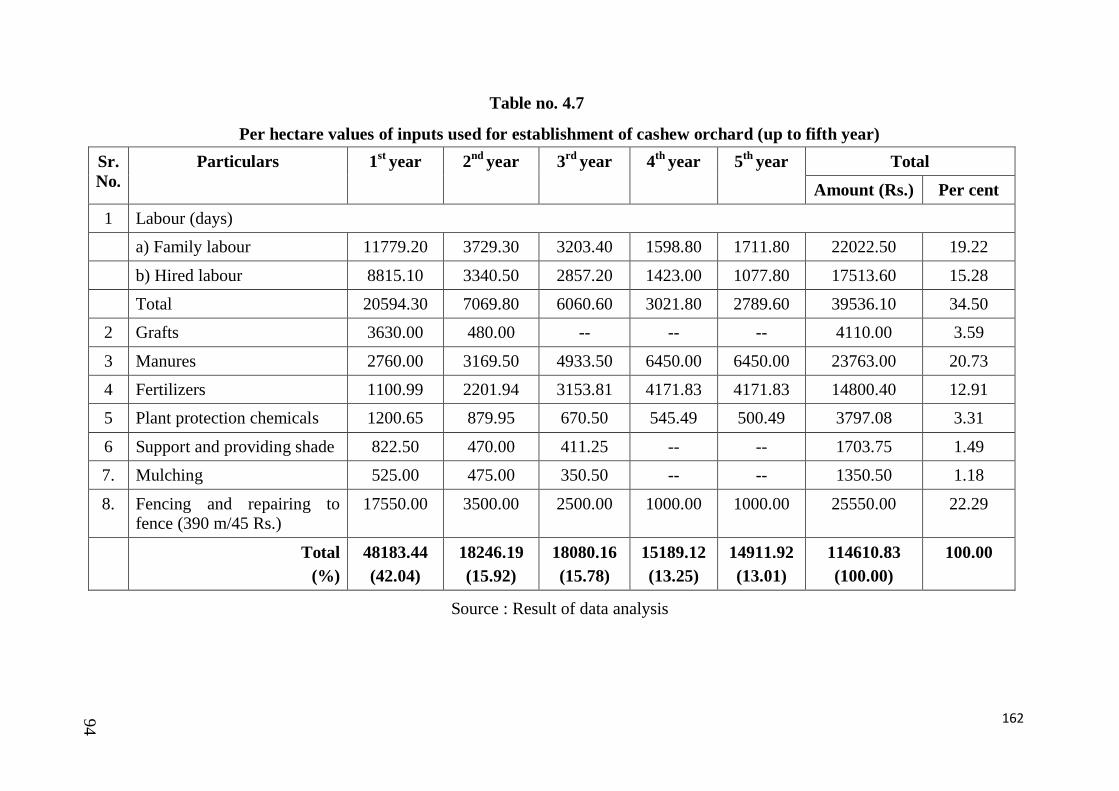
4.04.5 Cost of establishment for high yielding varieties :
Inputwise and yearwise cost incurred in the gestation period for
establishing high yielding cashew orchard is given in Table 4.7.
161
a) Inputwise
It is revealed from the Table 4.7 that, the per hectare total cost incurred
in a period of five years for establishing cashew orchards worked out to Rs.
114610.83. Out of this investment, maximum cost incurred on labour 34.50 per
cent (Rs. 39536.10) which is followed by fencing and repairing to fence
(22.29%), manures (20.73%), fertilizers (12.91%), planting material (3.59%),
plant protection chemicals (3.31%), support and providing shade (1.49%). The
very merge expenditure is incurred on mulching (1.18%). This revealed that
human labour is the important component in the establishment of cashew
orchard.
162
Table no. 4.7
Per hectare values of inputs used for establishment of cashew orchard (up to fifth year)
Sr.
No.
Particulars 1st
year 2nd
year 3rd
year 4th
year 5th
year Total
Amount (Rs.) Per cent
1 Labour (days)
a) Family labour 11779.20 3729.30 3203.40 1598.80 1711.80 22022.50 19.22
b) Hired labour 8815.10 3340.50 2857.20 1423.00 1077.80 17513.60 15.28
Total 20594.30 7069.80 6060.60 3021.80 2789.60 39536.10 34.50
2 Grafts 3630.00 480.00 -- -- -- 4110.00 3.59
3 Manures 2760.00 3169.50 4933.50 6450.00 6450.00 23763.00 20.73
4 Fertilizers 1100.99 2201.94 3153.81 4171.83 4171.83 14800.40 12.91
5 Plant protection chemicals 1200.65 879.95 670.50 545.49 500.49 3797.08 3.31
6 Support and providing shade 822.50 470.00 411.25 -- -- 1703.75 1.49
7. Mulching 525.00 475.00 350.50 -- -- 1350.50 1.18
8. Fencing and repairing to fence (390 m/45 Rs.)
17550.00 3500.00 2500.00 1000.00 1000.00 25550.00 22.29
Total
(%)
48183.44
(42.04)
18246.19
(15.92)
18080.16
(15.78)
15189.12
(13.25)
14911.92
(13.01)
114610.83
(100.00)
100.00
Source : Result of data analysis
94
b) Yearwise
Further, it is also observed from the Table 4.7 that, out of total cost of
establishment 42.04 per cent (Rs. 48183.44) is incurred during the first year,
15.92 per cent (Rs. 18246.19) during second year, 15.78 per cent (Rs. 18080.16)
during third year, 13.25 per cent (Rs. 15189.12) during fourth year and 13.01 per
cent (Rs. 14911.92) during fifth year. This indicated that maximum expenditure
was incurred during the first year and it declined in subsequent years mainly due
to decline of labour for different operations.
5.04.6 Cost of establishment for cashew orchard of local varieties :
The local variety plantation is quite old and hence it is difficult to collect
information. New cashew plantation using local variety seed is rarely available.
More or less, the same cost of establishment for new HYVs of cashew is
considered. Most of the operations would be the same. Only the change in cost of
planting material i.e. seedlings instead of grafts of cashew varieties whenever
local plantation existed they have been using thorny bushes/cactus for fencing
purpose or at the boarder the plot stone wall of 3‟×3‟ is laid. Considering above
changes, the approximate cost of establishment of local varieties of cashew
orchard is estimated to Rs. 87430.56.
4.05 Cost of cultivation :
4.05.1 Physical inputs utilization
In the utilization of cashew, inputs viz., labour, manures, fertilizers, plant
protection, etc. play a vital role. Therefore, per hectare inputs utilization for
164
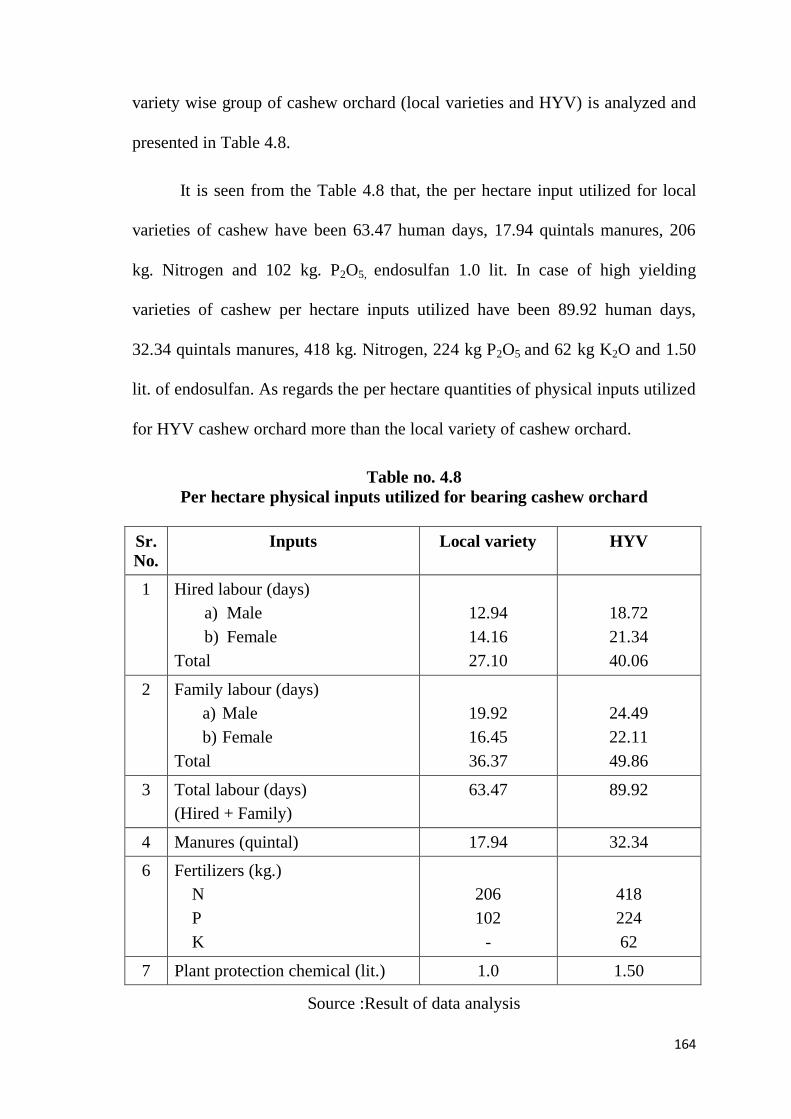
variety wise group of cashew orchard (local varieties and HYV) is analyzed and
presented in Table 4.8.
It is seen from the Table 4.8 that, the per hectare input utilized for local
varieties of cashew have been 63.47 human days, 17.94 quintals manures, 206
kg. Nitrogen and 102 kg. P2O5, endosulfan 1.0 lit. In case of high yielding
varieties of cashew per hectare inputs utilized have been 89.92 human days,
32.34 quintals manures, 418 kg. Nitrogen, 224 kg P2O5 and 62 kg K2O and 1.50
lit. of endosulfan. As regards the per hectare quantities of physical inputs utilized
for HYV cashew orchard more than the local variety of cashew orchard.
Table no. 4.8
Per hectare physical inputs utilized for bearing cashew orchard
Sr.
No.
Inputs Local variety HYV
1 Hired labour (days)
a) Male
b) Female
Total
12.94
14.16
27.10
18.72
21.34
40.06
2 Family labour (days)
a) Male
b) Female
Total
19.92
16.45
36.37
24.49
22.11
49.86
3 Total labour (days)
(Hired + Family)
63.47 89.92
4 Manures (quintal) 17.94 32.34
6 Fertilizers (kg.)
N
P
K
206
102
-
418
224
62
7 Plant protection chemical (lit.) 1.0 1.50
Source :Result of data analysis
165
4.05.2 Cost of cultivation of local variety and HYV cashew orchard :
The per hectare itemwise cost incurred for the cultivation of cashew
orchards is worked out separately for local varieties and high yielding varieties
are presented in Table 4.9.
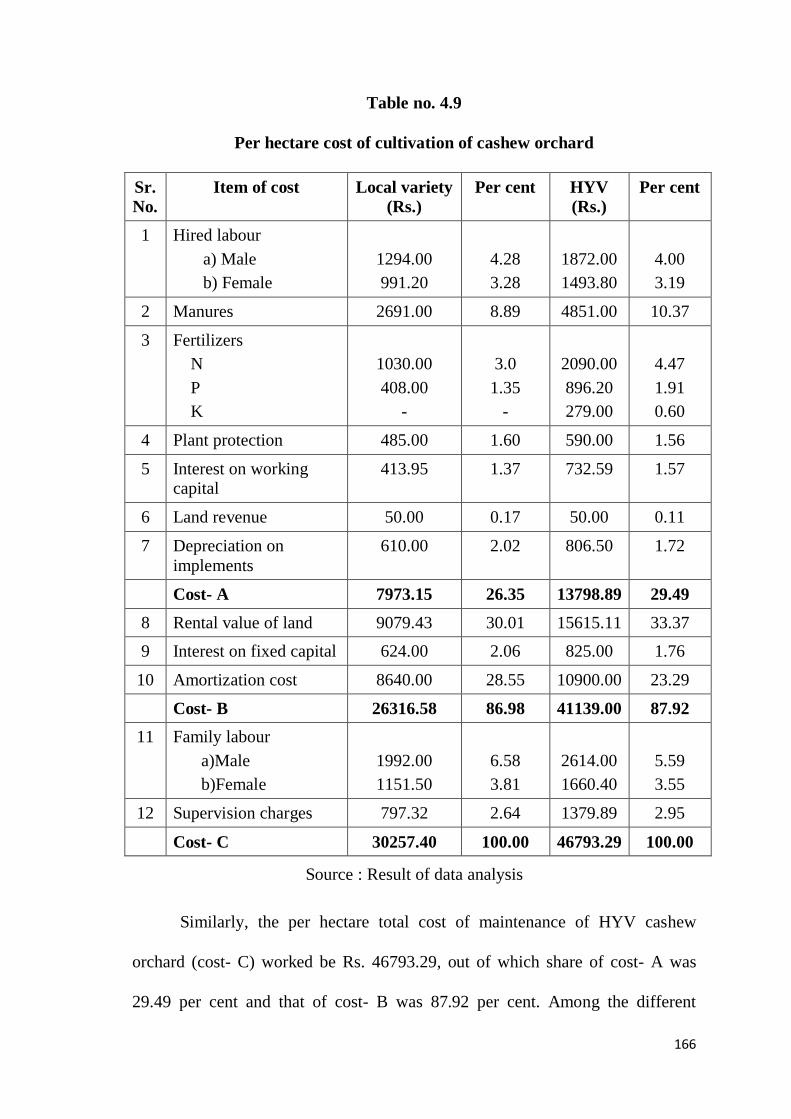
It is seen from Table 4.9 that, per hectare total cost of maintenance of
local variety cashew orchard (cost C) worked out to Rs. 30257.40 of which share
of cost- A is 26.35 per cent and that of cost- B is 86.98 per cent. As regards the
itemwise cost, it is found that the maximum cost (30.01%) was incurred on rental
value of land and amortization cost of orchard (28.55%). The contribution of
other items of cost ranged from 0.17 per cent for land revenue to 10.39 per cent
for family labour.
166
Table no. 4.9
Per hectare cost of cultivation of cashew orchard
Sr.
No.
Item of cost Local variety
(Rs.)
Per cent HYV
(Rs.)
Per cent
1 Hired labour
a) Male
b) Female
1294.00
991.20
4.28
3.28
1872.00
1493.80
4.00
3.19
2 Manures 2691.00 8.89 4851.00 10.37
3 Fertilizers
N
P
K
1030.00
408.00
-
3.0
1.35
-
2090.00
896.20
279.00
4.47
1.91
0.60
4 Plant protection 485.00 1.60 590.00 1.56
5 Interest on working capital
413.95 1.37 732.59 1.57
6 Land revenue 50.00 0.17 50.00 0.11
7 Depreciation on
implements
610.00 2.02 806.50 1.72
Cost- A 7973.15 26.35 13798.89 29.49
8 Rental value of land 9079.43 30.01 15615.11 33.37
9 Interest on fixed capital 624.00 2.06 825.00 1.76
10 Amortization cost 8640.00 28.55 10900.00 23.29
Cost- B 26316.58 86.98 41139.00 87.92
11 Family labour
a)Male
b)Female
1992.00
1151.50
6.58
3.81
2614.00
1660.40
5.59
3.55
12 Supervision charges 797.32 2.64 1379.89 2.95
Cost- C 30257.40 100.00 46793.29 100.00
Source : Result of data analysis
Similarly, the per hectare total cost of maintenance of HYV cashew
orchard (cost- C) worked be Rs. 46793.29, out of which share of cost- A was
29.49 per cent and that of cost- B was 87.92 per cent. Among the different
167
important items of cost, amortization shared 23.29 per cent of the total cost. The
maximum cost (33.37%) was incurred on rental value of land. The contribution
of other items of cost ranged from 0.11 per cent for land revenue to 10.37 per
cent for manures.
Table 4.9 observed that, per hectare cost of maintenance of local variety
and HYV, incurred on manures, fertilizers, and plant protection for high yielding
variety is almost double than local variety cashew orchard.
4.05.3 Yield, returns and profitability:
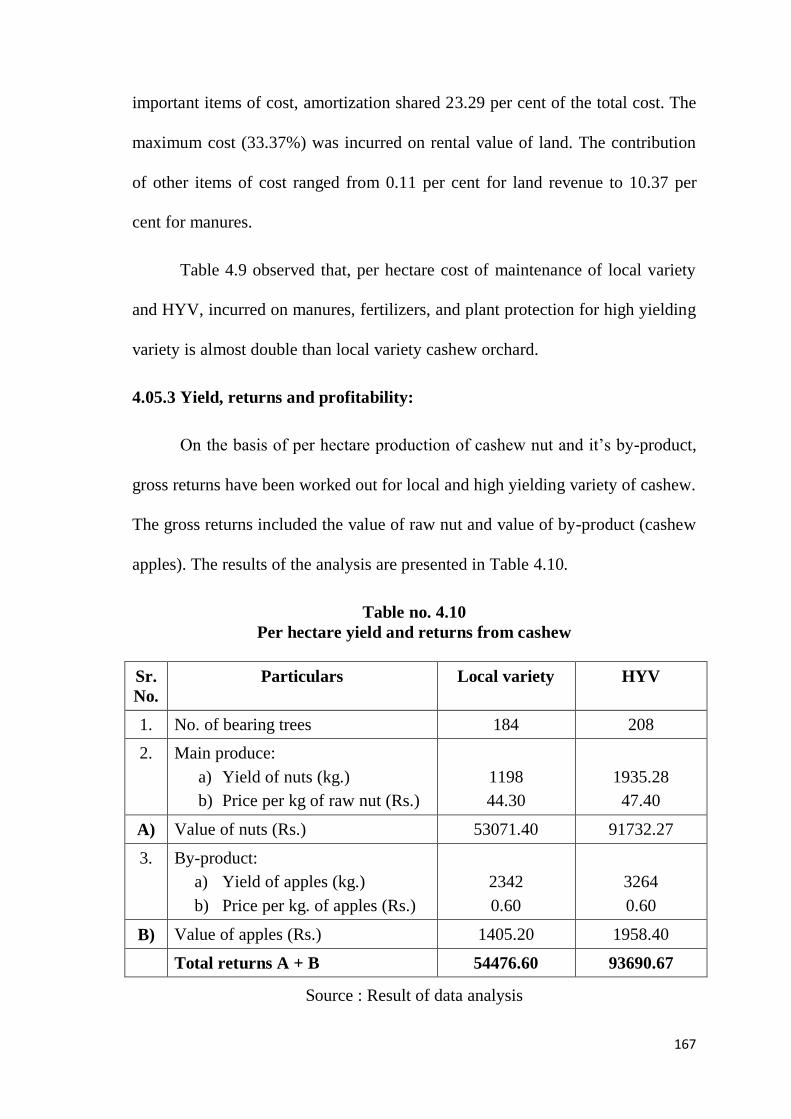
On the basis of per hectare production of cashew nut and it‟s by-product,
gross returns have been worked out for local and high yielding variety of cashew.
The gross returns included the value of raw nut and value of by-product (cashew
apples). The results of the analysis are presented in Table 4.10.
Table no. 4.10
Per hectare yield and returns from cashew
Sr.
No.
Particulars Local variety HYV
1. No. of bearing trees 184 208
2. Main produce:
a) Yield of nuts (kg.)
b) Price per kg of raw nut (Rs.)
1198
44.30
1935.28
47.40
A) Value of nuts (Rs.) 53071.40 91732.27
3. By-product:
a) Yield of apples (kg.)
b) Price per kg. of apples (Rs.)
2342
0.60
3264
0.60
B) Value of apples (Rs.) 1405.20 1958.40
Total returns A + B 54476.60 93690.67
Source : Result of data analysis
168
It is seen from Table 4.10 that, the per hectare gross returns realized have
been Rs. 54476.60 from local varieties and Rs. 93690.67 from HYV cashew
orchard.
The per hectare gross returns of high yielding variety of cashew have been
considerably higher because, per hectare number of trees (208), yield of nuts per
tree (9.30 kg.), as well as price per kg of raw nut (Rs. 47.40/kg.) was higher as
compared to local variety of cashew viz. Number of bearing trees (184/ha), yield
of nuts per tree (6.51 kg/tree), price per kg of raw nut (Rs. 44.30/kg.).
On the basis of per hectare production of cashewnut, its by-products and
price received by the growers, gross returns have been worked out for local
variety and HYV cashew orchards. The profitability at various costs level viz.
Cost A, cost B, cost C was worked out by deducting respective costs from gross
returns. The per hectare GroupWise i.e. local variety and HYV profitability of
cashew orchard presented in Table 4.11.
169
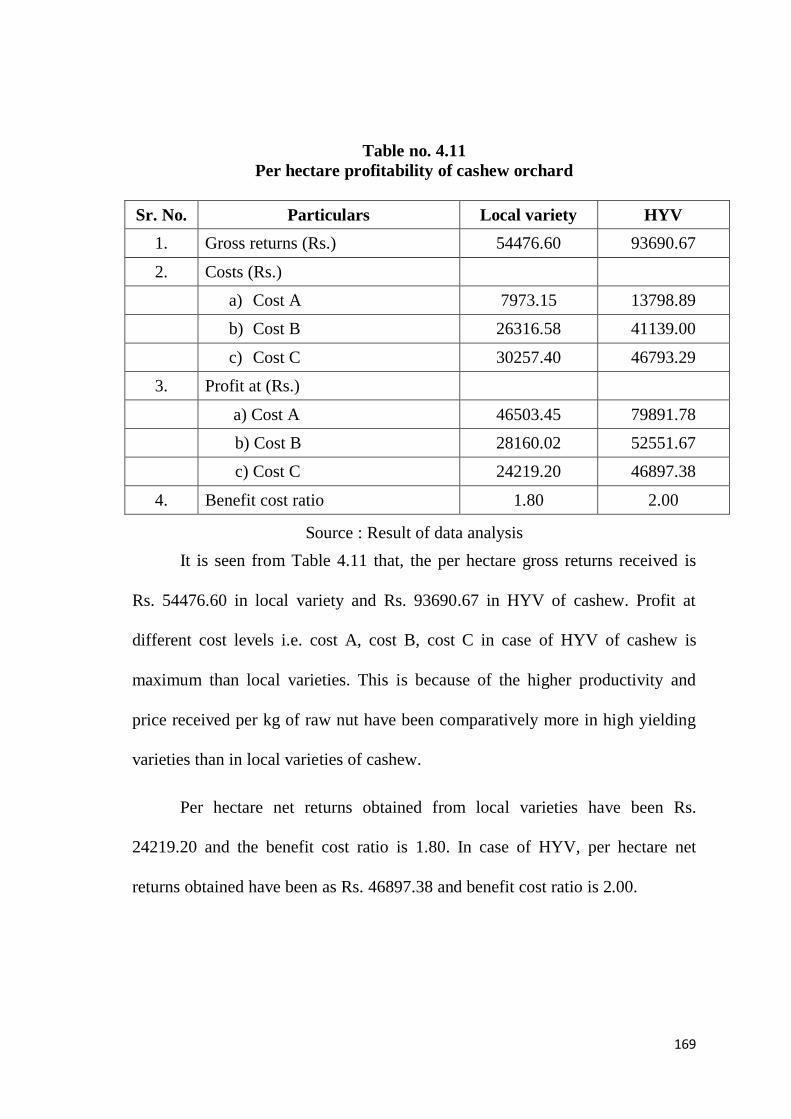
Table no. 4.11
Per hectare profitability of cashew orchard
Sr. No. Particulars Local variety HYV
1. Gross returns (Rs.) 54476.60 93690.67
2. Costs (Rs.)
a) Cost A 7973.15 13798.89
b) Cost B 26316.58 41139.00
c) Cost C 30257.40 46793.29
3. Profit at (Rs.)
a) Cost A 46503.45 79891.78
b) Cost B 28160.02 52551.67
c) Cost C 24219.20 46897.38
4. Benefit cost ratio 1.80 2.00
Source : Result of data analysis
It is seen from Table 4.11 that, the per hectare gross returns received is
Rs. 54476.60 in local variety and Rs. 93690.67 in HYV of cashew. Profit at
different cost levels i.e. cost A, cost B, cost C in case of HYV of cashew is
maximum than local varieties. This is because of the higher productivity and
price received per kg of raw nut have been comparatively more in high yielding
varieties than in local varieties of cashew.
Per hectare net returns obtained from local varieties have been Rs.
24219.20 and the benefit cost ratio is 1.80. In case of HYV, per hectare net
returns obtained have been as Rs. 46897.38 and benefit cost ratio is 2.00.
170
4.06 Economic evaluation of investment in cashew orchards :
Investment in cashew orchards demand vast resources in terms of capital
and the flow of income is spread over on large number of years. Similarly, once
the investment is made on resources for establishing cashew orchard, no retrieval
is possible. Therefore, it is necessary to evaluate such a huge investment for its
worthiness with great deal to caution and foresight.
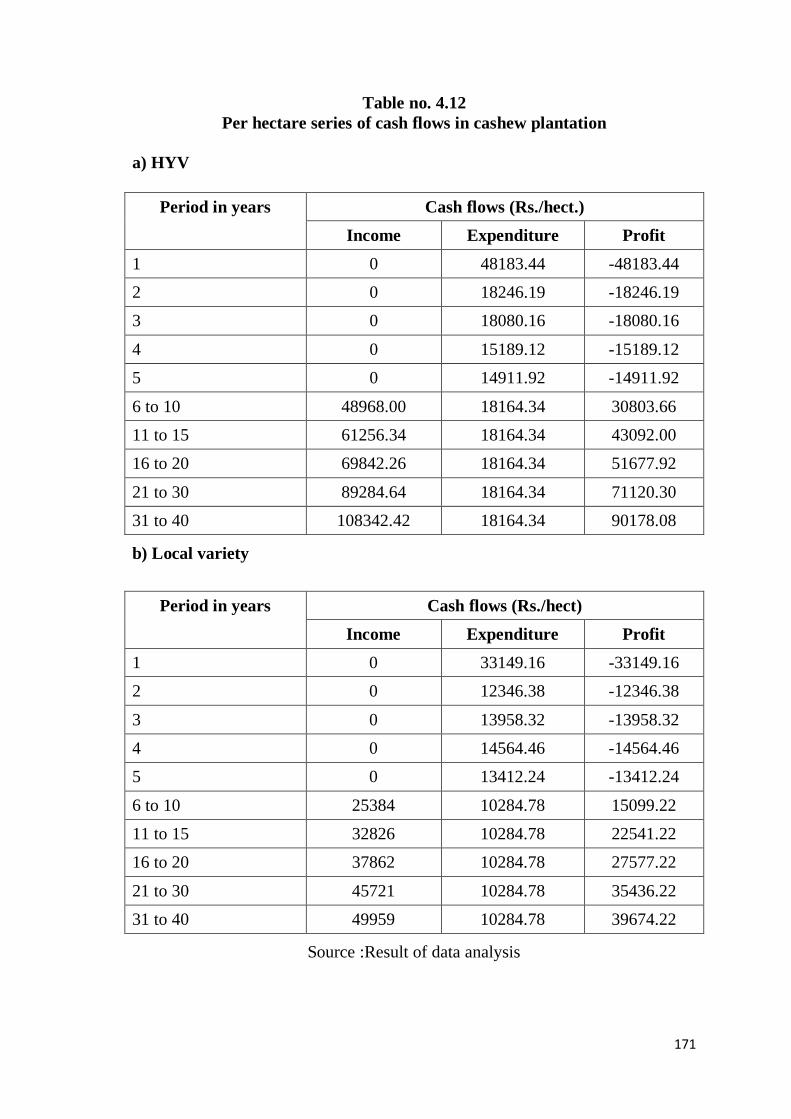
Taking into account the yearly cost of establishment of first five years and
maintenance cost for different varietal group i.e. local varieties and HYV upto 40
years age of orchard, a series of cash out flow (costs) was prepared. Similarly, a
series of cash inflow (returns) is prepared taking into account the per hectare
returns received (net of marketing cost). The outflow and inflow series i.e. cost
and returns series for local and high yielding cashew cultivation is given in Table
4.12. With the help of these series of cash flows and by using the economic
parameters namely (i) pay back period (ii) net present value (iii) benefit cost
ratio and (iv) internal rate of returns as per the procedure outlined in the
introduction chapter, the economic feasibility of investment in cashew plantation
is tested. The estimated values of these parameters for local variety cashew
orchard are presented in Table 4.13.
171
Table no. 4.12
Per hectare series of cash flows in cashew plantation
a) HYV
Period in years Cash flows (Rs./hect.)
Income Expenditure Profit
1 0 48183.44 -48183.44
2 0 18246.19 -18246.19
3 0 18080.16 -18080.16
4 0 15189.12 -15189.12
5 0 14911.92 -14911.92
6 to 10 48968.00 18164.34 30803.66
11 to 15 61256.34 18164.34 43092.00
16 to 20 69842.26 18164.34 51677.92
21 to 30 89284.64 18164.34 71120.30
31 to 40 108342.42 18164.34 90178.08
b) Local variety
Period in years Cash flows (Rs./hect)
Income Expenditure Profit
1 0 33149.16 -33149.16
2 0 12346.38 -12346.38
3 0 13958.32 -13958.32
4 0 14564.46 -14564.46
5 0 13412.24 -13412.24
6 to 10 25384 10284.78 15099.22
11 to 15 32826 10284.78 22541.22
16 to 20 37862 10284.78 27577.22
21 to 30 45721 10284.78 35436.22
31 to 40 49959 10284.78 39674.22
Source :Result of data analysis
172
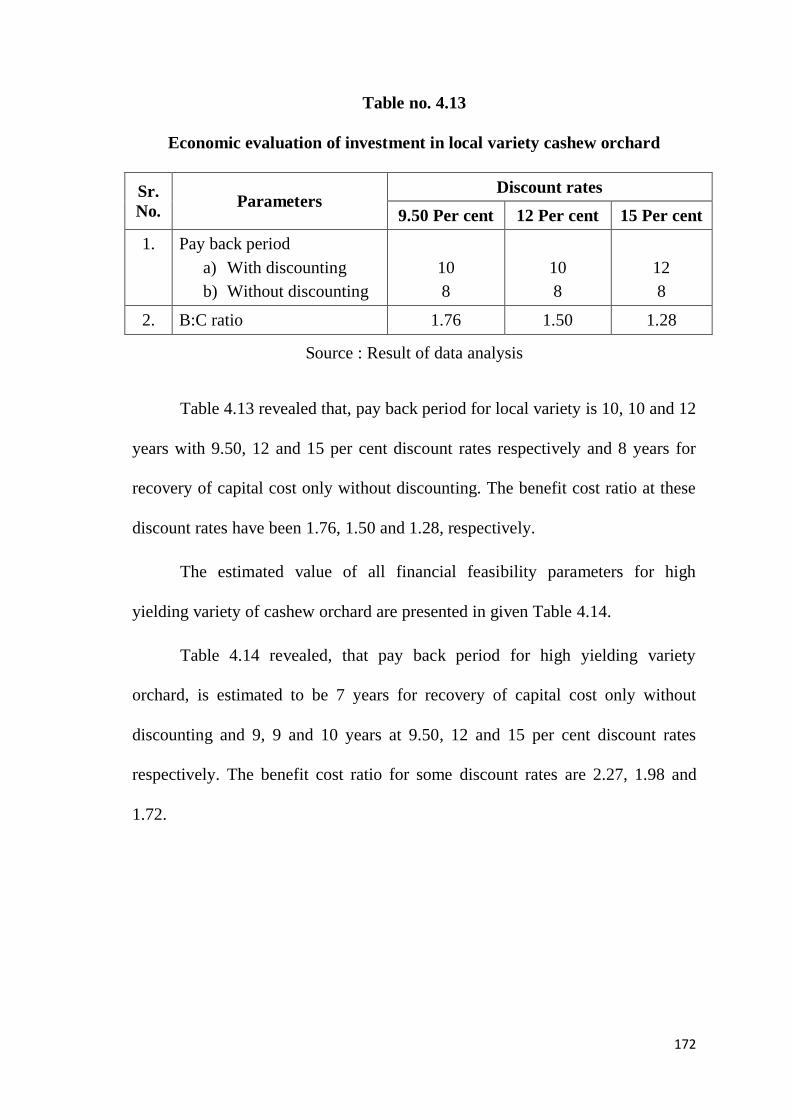
Table no. 4.13
Economic evaluation of investment in local variety cashew orchard
Sr.
No. Parameters
Discount rates
9.50 Per cent 12 Per cent 15 Per cent
1. Pay back period
a) With discounting
b) Without discounting
10
8
10
8
12
8
2. B:C ratio 1.76 1.50 1.28
Source : Result of data analysis
Table 4.13 revealed that, pay back period for local variety is 10, 10 and 12
years with 9.50, 12 and 15 per cent discount rates respectively and 8 years for
recovery of capital cost only without discounting. The benefit cost ratio at these
discount rates have been 1.76, 1.50 and 1.28, respectively.
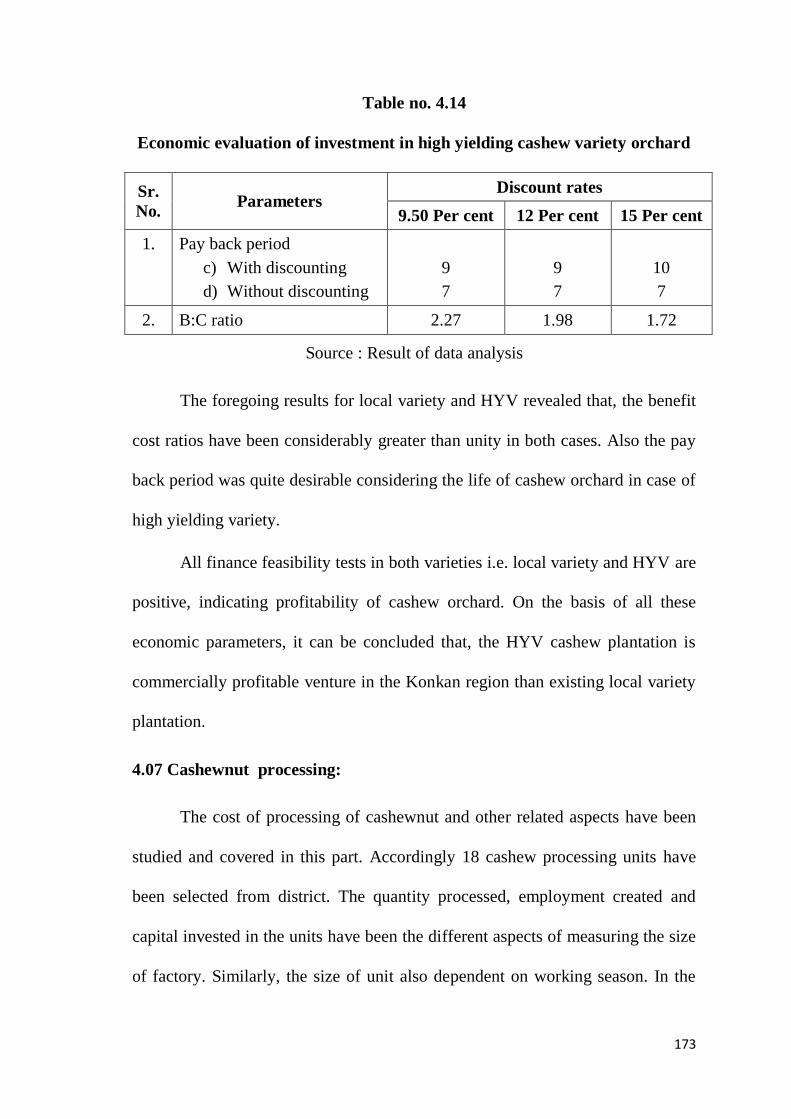
The estimated value of all financial feasibility parameters for high
yielding variety of cashew orchard are presented in given Table 4.14.
Table 4.14 revealed, that pay back period for high yielding variety
orchard, is estimated to be 7 years for recovery of capital cost only without
discounting and 9, 9 and 10 years at 9.50, 12 and 15 per cent discount rates
respectively. The benefit cost ratio for some discount rates are 2.27, 1.98 and
1.72.
173
Table no. 4.14
Economic evaluation of investment in high yielding cashew variety orchard
Sr.
No. Parameters
Discount rates
9.50 Per cent 12 Per cent 15 Per cent
1. Pay back period
c) With discounting
d) Without discounting
9
7
9
7
10
7
2. B:C ratio 2.27 1.98 1.72
Source : Result of data analysis
The foregoing results for local variety and HYV revealed that, the benefit
cost ratios have been considerably greater than unity in both cases. Also the pay
back period was quite desirable considering the life of cashew orchard in case of
high yielding variety.
All finance feasibility tests in both varieties i.e. local variety and HYV are
positive, indicating profitability of cashew orchard. On the basis of all these
economic parameters, it can be concluded that, the HYV cashew plantation is
commercially profitable venture in the Konkan region than existing local variety
plantation.
4.07 Cashewnut processing:
The cost of processing of cashewnut and other related aspects have been
studied and covered in this part. Accordingly 18 cashew processing units have
been selected from district. The quantity processed, employment created and
capital invested in the units have been the different aspects of measuring the size
of factory. Similarly, the size of unit also dependent on working season. In the
174
present study, working season was taken as basis for classifying selected cashew
processing factories.
4.07.1 Classification of cashew units :
The selected cashew processing units have been classified on the basis of
their working season as given in Table 4.15
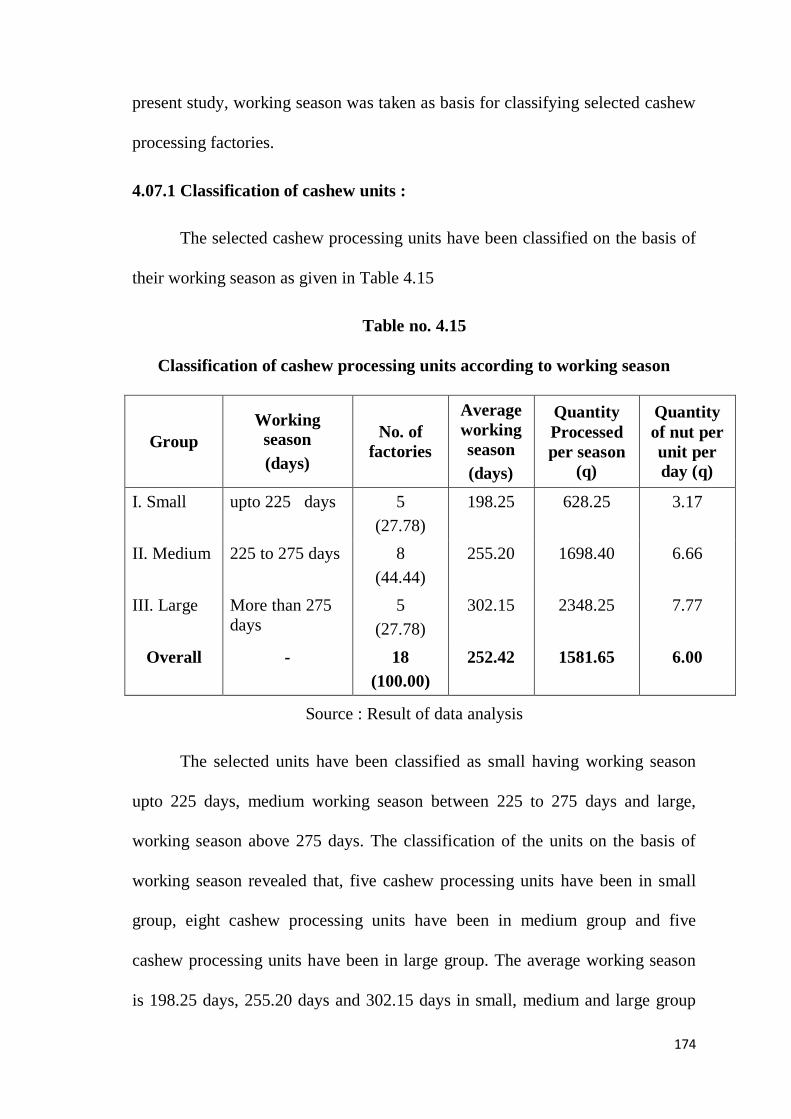
Table no. 4.15
Classification of cashew processing units according to working season
Group
Working
season
(days)
No. of
factories
Average
working
season
(days)
Quantity
Processed
per season
(q)
Quantity
of nut per
unit per
day (q)
I. Small upto 225 days 5
(27.78)
198.25 628.25 3.17
II. Medium 225 to 275 days 8
(44.44)
255.20 1698.40 6.66
III. Large More than 275
days
5
(27.78)
302.15 2348.25 7.77
Overall - 18
(100.00)
252.42 1581.65 6.00
Source : Result of data analysis
The selected units have been classified as small having working season
upto 225 days, medium working season between 225 to 275 days and large,
working season above 275 days. The classification of the units on the basis of
working season revealed that, five cashew processing units have been in small
group, eight cashew processing units have been in medium group and five
cashew processing units have been in large group. The average working season
is 198.25 days, 255.20 days and 302.15 days in small, medium and large group
175
respectively, while average working season at overall level was 252.42 days. The
per season quantity of nuts processed varied from 628.25 q. in small to 2348.25
q. in large group, while overall average quantity of nuts processed per season is
1581.65 q. The daily quantity of nuts processed by the unit in small, medium and
large groups was 3.17 q., 6.66 q. and 7.77 q. respectively, with overall average of
6.00 q. This indicated that not only the per season quantity but per day quantity
of nuts processed is also more in units which had longer working season.
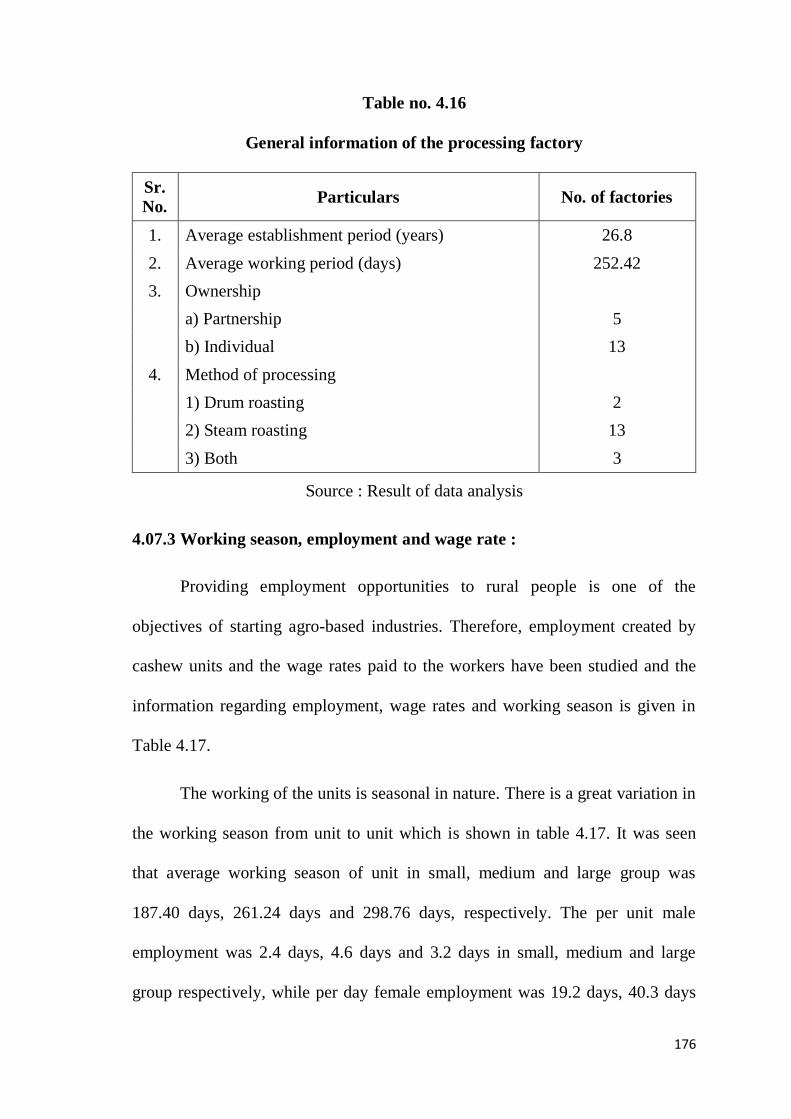
4.07.2 General Information :
The general information of the processing units including average of
establishment period, average working period, ownership and method of
processing is given in Table 4.16.
It is seen from Table 4.16 that, average establishment period is 26.8 years.
The units have been also classified on the basis of type of ownership as
partnership and individual. There have been 13 units (72.22%) owned and
managed by individual, while remaining 5 units (27.78%) in partnership. From
the sample, two units (11.11%) have been processing cashew by drum roasting
method, while 13 units (83.33 %) have been found to process cashew by steam
roasting method‟ and remaining three units have been using both these methods
of processing.
176
Table no. 4.16
General information of the processing factory
Sr.
No. Particulars No. of factories
1. Average establishment period (years) 26.8
2. Average working period (days) 252.42
3. Ownership
a) Partnership 5
b) Individual 13
4. Method of processing
1) Drum roasting 2
2) Steam roasting 13
3) Both 3
Source : Result of data analysis
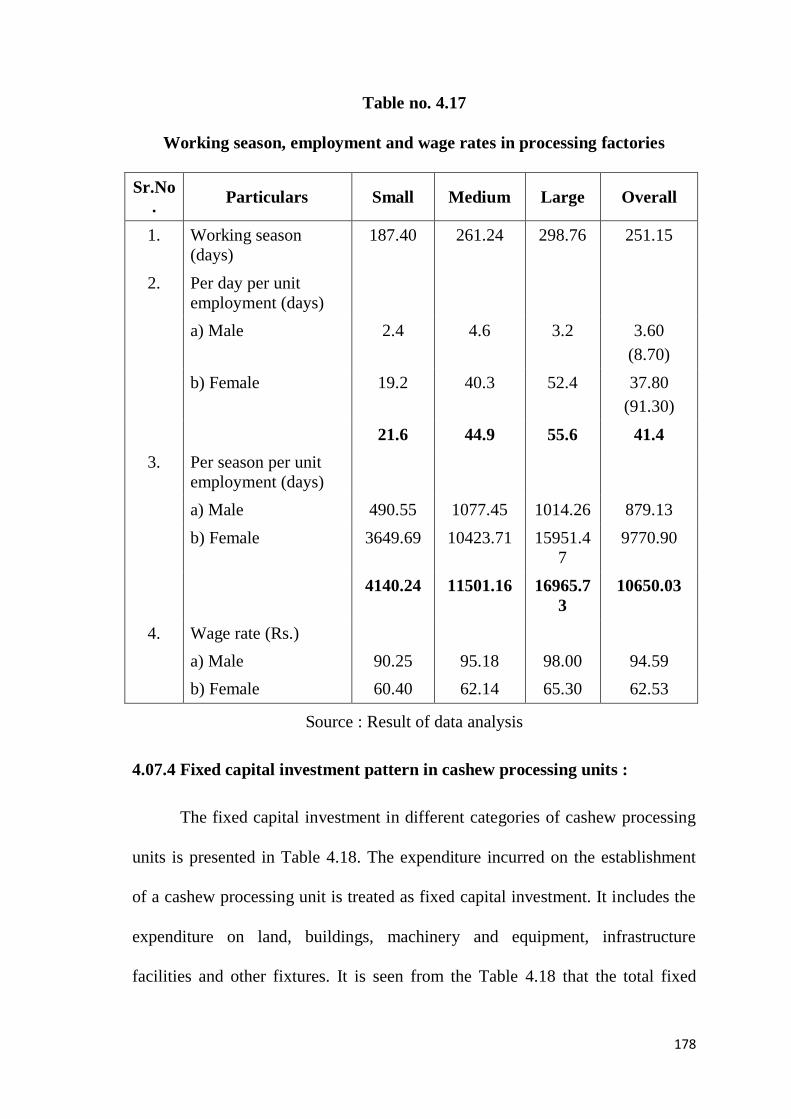
4.07.3 Working season, employment and wage rate :
Providing employment opportunities to rural people is one of the
objectives of starting agro-based industries. Therefore, employment created by
cashew units and the wage rates paid to the workers have been studied and the
information regarding employment, wage rates and working season is given in
Table 4.17.
The working of the units is seasonal in nature. There is a great variation in
the working season from unit to unit which is shown in table 4.17. It was seen
that average working season of unit in small, medium and large group was
187.40 days, 261.24 days and 298.76 days, respectively. The per unit male
employment was 2.4 days, 4.6 days and 3.2 days in small, medium and large
group respectively, while per day female employment was 19.2 days, 40.3 days
177
and 52.4 days in small, medium and large group, respectively. At the overall
level, the per unit per day employment comprised of 3.6 days male and 37.8 days
female with a total of 41.4 days. This indicated that out of total labour
employment nearly 91 per cent was female labour. It was further observed that,
the total employment per unit in a season was 4140 days in small group, 11501
days in medium group and 16966 days in large group with overall average
employment of 10650 days. Thus, the estimated labour employment of all the
sample units come to 1.92 lakh days. Regarding wage rates to male and female
labour, more wages have been given to male labour as compared to female
labour. The daily wage rate paid to male labour is Rs. 90.25, Rs. 95.18 and Rs.
98.00 in small, medium and large group, respectively, while wage rate paid to
female labour is Rs. 60.40, Rs. 62.14 and Rs. 65.30 by factories, respectively.
It is observed that large units had given higher wage rate to their workers than
small factories. The overall per day wage rate of male and female worker is Rs.
94.59 and Rs. 62.53, respectively.
178
Table no. 4.17
Working season, employment and wage rates in processing factories
Sr.No
. Particulars Small Medium Large Overall
1. Working season
(days)
187.40 261.24 298.76 251.15
2. Per day per unit
employment (days)
a) Male 2.4 4.6 3.2 3.60
(8.70)
b) Female 19.2 40.3 52.4 37.80
(91.30)
21.6 44.9 55.6 41.4
3. Per season per unit
employment (days)
a) Male 490.55 1077.45 1014.26 879.13
b) Female 3649.69 10423.71 15951.4
7
9770.90
4140.24 11501.16 16965.7
3
10650.03
4. Wage rate (Rs.)
a) Male 90.25 95.18 98.00 94.59
b) Female 60.40 62.14 65.30 62.53
Source : Result of data analysis
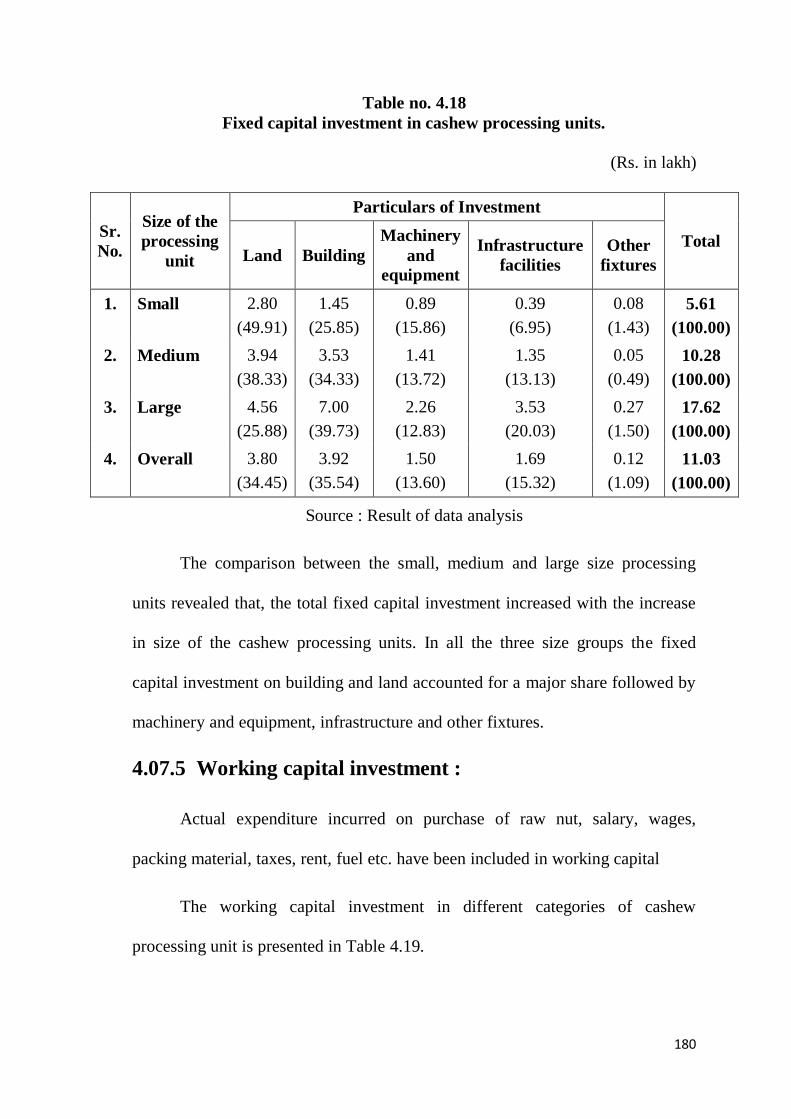
4.07.4 Fixed capital investment pattern in cashew processing units :
The fixed capital investment in different categories of cashew processing
units is presented in Table 4.18. The expenditure incurred on the establishment
of a cashew processing unit is treated as fixed capital investment. It includes the
expenditure on land, buildings, machinery and equipment, infrastructure
facilities and other fixtures. It is seen from the Table 4.18 that the total fixed
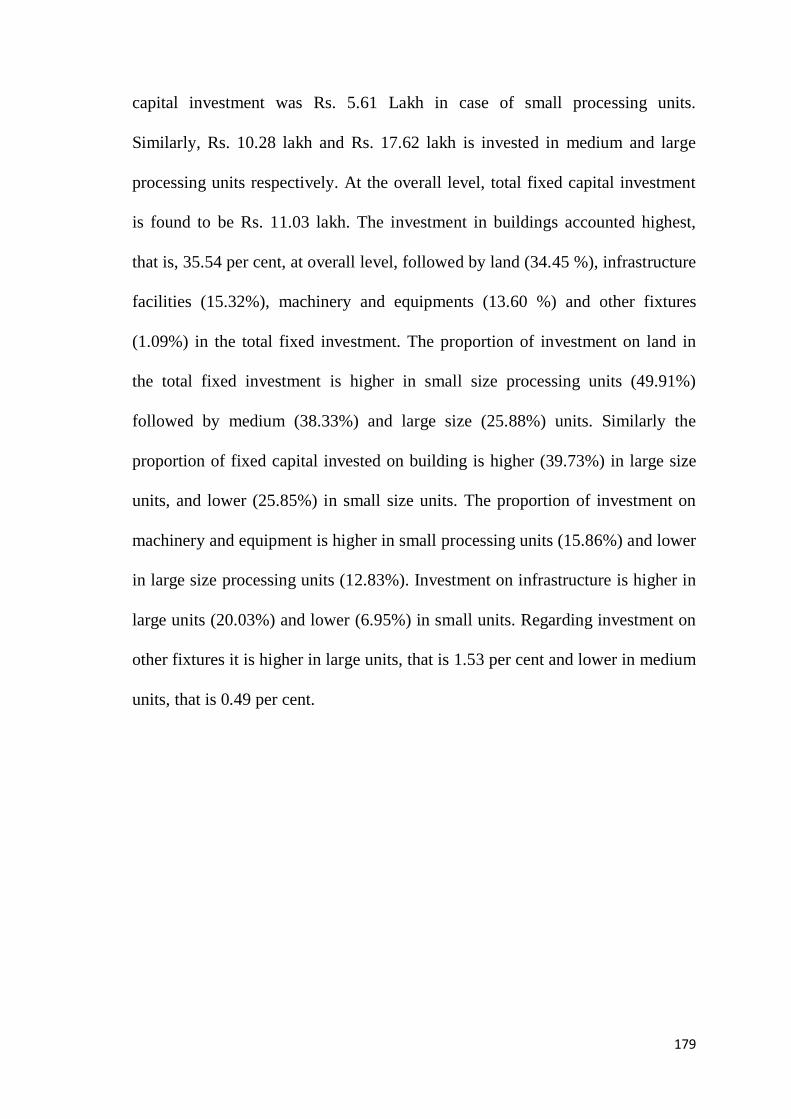
179
capital investment was Rs. 5.61 Lakh in case of small processing units.
Similarly, Rs. 10.28 lakh and Rs. 17.62 lakh is invested in medium and large
processing units respectively. At the overall level, total fixed capital investment
is found to be Rs. 11.03 lakh. The investment in buildings accounted highest,
that is, 35.54 per cent, at overall level, followed by land (34.45 %), infrastructure
facilities (15.32%), machinery and equipments (13.60 %) and other fixtures
(1.09%) in the total fixed investment. The proportion of investment on land in
the total fixed investment is higher in small size processing units (49.91%)
followed by medium (38.33%) and large size (25.88%) units. Similarly the
proportion of fixed capital invested on building is higher (39.73%) in large size
units, and lower (25.85%) in small size units. The proportion of investment on
machinery and equipment is higher in small processing units (15.86%) and lower
in large size processing units (12.83%). Investment on infrastructure is higher in
large units (20.03%) and lower (6.95%) in small units. Regarding investment on
other fixtures it is higher in large units, that is 1.53 per cent and lower in medium
units, that is 0.49 per cent.
180
Table no. 4.18
Fixed capital investment in cashew processing units.
(Rs. in lakh)
Sr.
No.
Size of the
processing
unit
Particulars of Investment
Total Land Building
Machinery
and
equipment
Infrastructure
facilities
Other
fixtures
1. Small 2.80
(49.91)
1.45
(25.85)
0.89
(15.86)
0.39
(6.95)
0.08
(1.43)
5.61
(100.00)
2. Medium 3.94
(38.33)
3.53
(34.33)
1.41
(13.72)
1.35
(13.13)
0.05
(0.49)
10.28
(100.00)
3. Large 4.56
(25.88)
7.00
(39.73)
2.26
(12.83)
3.53
(20.03)
0.27
(1.50)
17.62
(100.00)
4. Overall 3.80
(34.45)
3.92
(35.54)
1.50
(13.60)
1.69
(15.32)
0.12
(1.09)
11.03
(100.00)
Source : Result of data analysis
The comparison between the small, medium and large size processing
units revealed that, the total fixed capital investment increased with the increase
in size of the cashew processing units. In all the three size groups the fixed
capital investment on building and land accounted for a major share followed by
machinery and equipment, infrastructure and other fixtures.
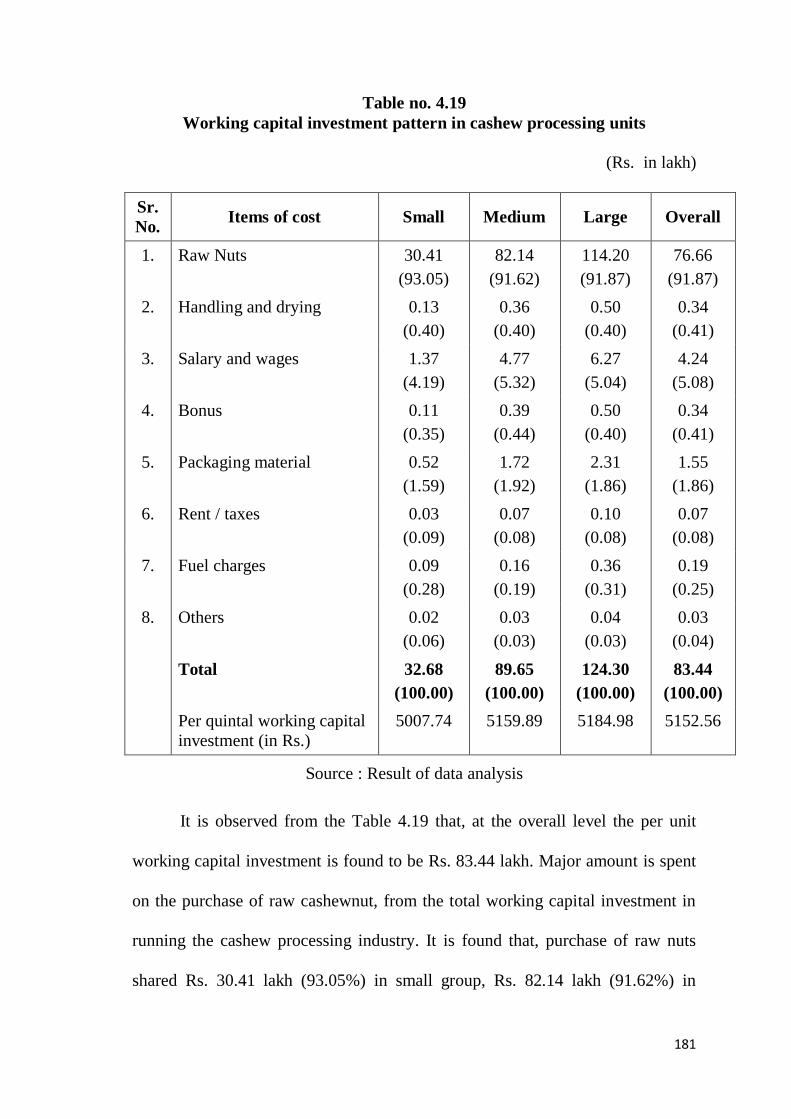
4.07.5 Working capital investment :
Actual expenditure incurred on purchase of raw nut, salary, wages,
packing material, taxes, rent, fuel etc. have been included in working capital
The working capital investment in different categories of cashew
processing unit is presented in Table 4.19.
181
Table no. 4.19
Working capital investment pattern in cashew processing units
(Rs. in lakh)
Sr.
No. Items of cost Small Medium Large Overall
1. Raw Nuts 30.41
(93.05)
82.14
(91.62)
114.20
(91.87)
76.66
(91.87)
2. Handling and drying 0.13
(0.40)
0.36
(0.40)
0.50
(0.40)
0.34
(0.41)
3. Salary and wages 1.37
(4.19)
4.77
(5.32)
6.27
(5.04)
4.24
(5.08)
4. Bonus 0.11
(0.35)
0.39
(0.44)
0.50
(0.40)
0.34
(0.41)
5. Packaging material 0.52
(1.59)
1.72
(1.92)
2.31
(1.86)
1.55
(1.86)
6. Rent / taxes 0.03
(0.09)
0.07
(0.08)
0.10
(0.08)
0.07
(0.08)
7. Fuel charges 0.09
(0.28)
0.16
(0.19)
0.36
(0.31)
0.19
(0.25)
8. Others 0.02
(0.06)
0.03
(0.03)
0.04
(0.03)
0.03
(0.04)
Total 32.68
(100.00)
89.65
(100.00)
124.30
(100.00)
83.44
(100.00)
Per quintal working capital
investment (in Rs.)
5007.74 5159.89 5184.98 5152.56
Source : Result of data analysis
It is observed from the Table 4.19 that, at the overall level the per unit
working capital investment is found to be Rs. 83.44 lakh. Major amount is spent
on the purchase of raw cashewnut, from the total working capital investment in
running the cashew processing industry. It is found that, purchase of raw nuts
shared Rs. 30.41 lakh (93.05%) in small group, Rs. 82.14 lakh (91.62%) in
182
medium group and Rs. 114.20 lakh (91.87%) in large group. At the overall
level, after purchase of raw nut, expenditure on other items of working capital
investment have been salary and wages Rs. 4.24 lakh (5.08%), packaging
material Rs. 1.55 lakh (1.86%), handling and drying as well as bonus to
employees Rs. 0.34 lakh (0.41%) each, fuel charges Rs. 0.21 lakh (0.25%) etc.
Same trend of working capital investment is observed in all the groups. It
also indicated that as the working season expanded, the requirement of working
capital is observed to increase. The per quintal working capital investment is Rs.
5007.74 in small group, Rs. 5159.89 in medium group and Rs. 5184.98 in large
group with the overall per quintal average investment of Rs. 5152.56.
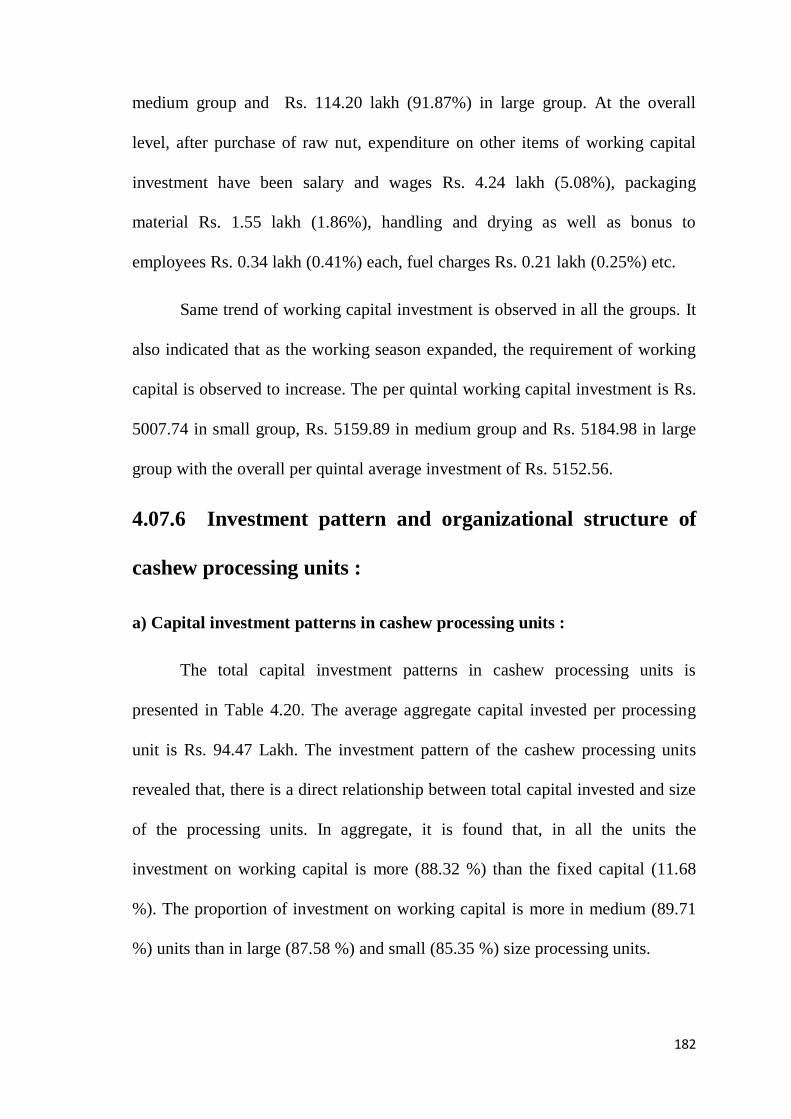
4.07.6 Investment pattern and organizational structure of
cashew processing units :
a) Capital investment patterns in cashew processing units :
The total capital investment patterns in cashew processing units is
presented in Table 4.20. The average aggregate capital invested per processing
unit is Rs. 94.47 Lakh. The investment pattern of the cashew processing units
revealed that, there is a direct relationship between total capital invested and size
of the processing units. In aggregate, it is found that, in all the units the
investment on working capital is more (88.32 %) than the fixed capital (11.68
%). The proportion of investment on working capital is more in medium (89.71
%) units than in large (87.58 %) and small (85.35 %) size processing units.
183
The capital investment increased with the size of units, because of the
increased requirement of fixed and working capital. The major part of the
working capital invested was for procurement of cashewnut (raw material) which
was seasonal in nature.
Table no. 4.20
Capital investment pattern in cashew processing units.
Rs. in lakh)
Sr.
No.
Size of the
processing unit
Fixed
capital Working capital Total
1. Small 5.61
(14.65)
32.68
(85.35)
38.29
(100.00)
2. Medium 10.28
(10.29)
89.65
(89.71)
99.93
(100.00)
3. Large 17.62
(12.42)
124.30
(87.58)
141.92
(100.00)
4. Overall 11.03
(11.68)
83.44
(88.32)
94.47
(100.00)
Source : Result of data analysis
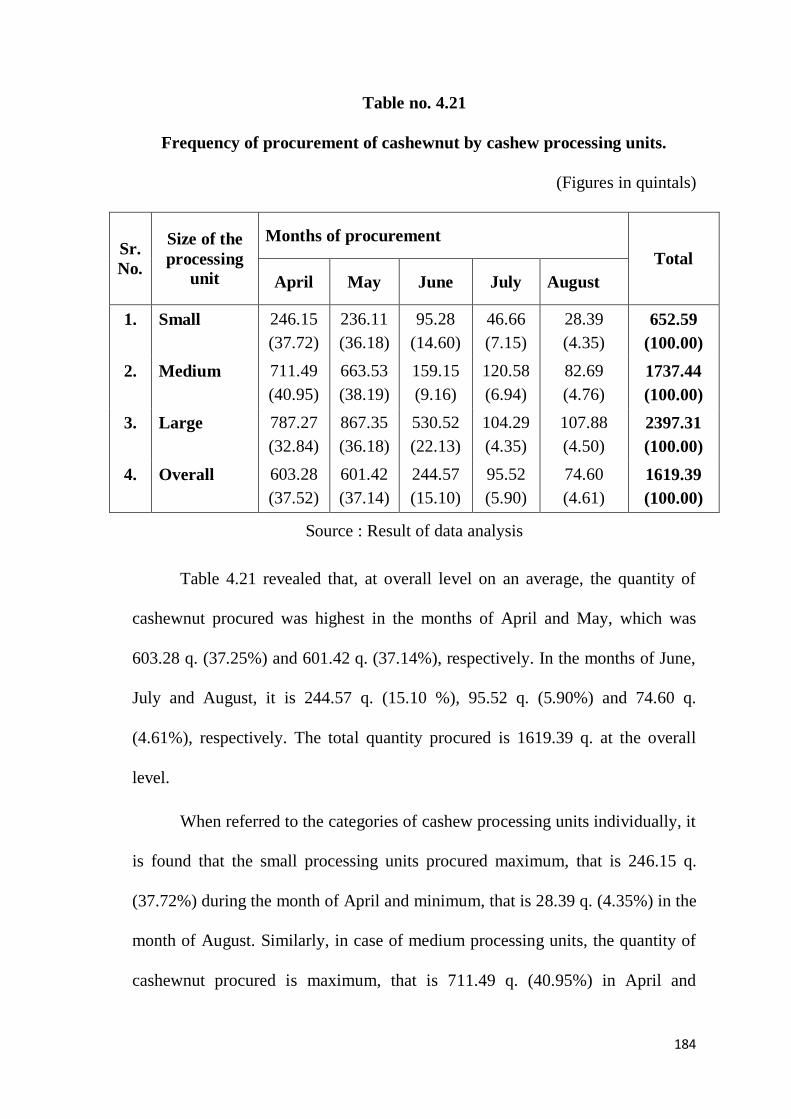
b) Procurement of raw material :
As the production of raw nuts is seasonal in nature the processors have to
purchase the nuts in that season and store them for processing. The monthwise
quantity of raw nuts procured by the units is given in Table 4.21.
184
Table no. 4.21
Frequency of procurement of cashewnut by cashew processing units.
(Figures in quintals)
Sr.
No.
Size of the
processing
unit
Months of procurement
Total
April May June July August
1. Small 246.15
(37.72)
236.11
(36.18)
95.28
(14.60)
46.66
(7.15)
28.39
(4.35)
652.59
(100.00)
2. Medium 711.49
(40.95)
663.53
(38.19)
159.15
(9.16)
120.58
(6.94)
82.69
(4.76)
1737.44
(100.00)
3. Large 787.27
(32.84)
867.35
(36.18)
530.52
(22.13)
104.29
(4.35)
107.88
(4.50)
2397.31
(100.00)
4. Overall 603.28
(37.52)
601.42
(37.14)
244.57
(15.10)
95.52
(5.90)
74.60
(4.61)
1619.39
(100.00)
Source : Result of data analysis
Table 4.21 revealed that, at overall level on an average, the quantity of
cashewnut procured was highest in the months of April and May, which was
603.28 q. (37.25%) and 601.42 q. (37.14%), respectively. In the months of June,
July and August, it is 244.57 q. (15.10 %), 95.52 q. (5.90%) and 74.60 q.
(4.61%), respectively. The total quantity procured is 1619.39 q. at the overall
level.
When referred to the categories of cashew processing units individually, it
is found that the small processing units procured maximum, that is 246.15 q.
(37.72%) during the month of April and minimum, that is 28.39 q. (4.35%) in the
month of August. Similarly, in case of medium processing units, the quantity of
cashewnut procured is maximum, that is 711.49 q. (40.95%) in April and
185
minimum, that is 82.69 q. (4.76%) during August. In the large processing units,
maximum quantity of 867.35 is procured during the month of May and minimum
quantity of 104.29 q. during the month of July. This indicated that all the
processing units procured maximum quantity of raw cashewnut during April and
May month for processing unit. This is because heavy arrivals of cashewnut
during the month of April and May and the arrivals of cashewnut decreased in
the month of June, July and August. The same trend in frequency of procurement
has been found in almost all the size groups of processing units.
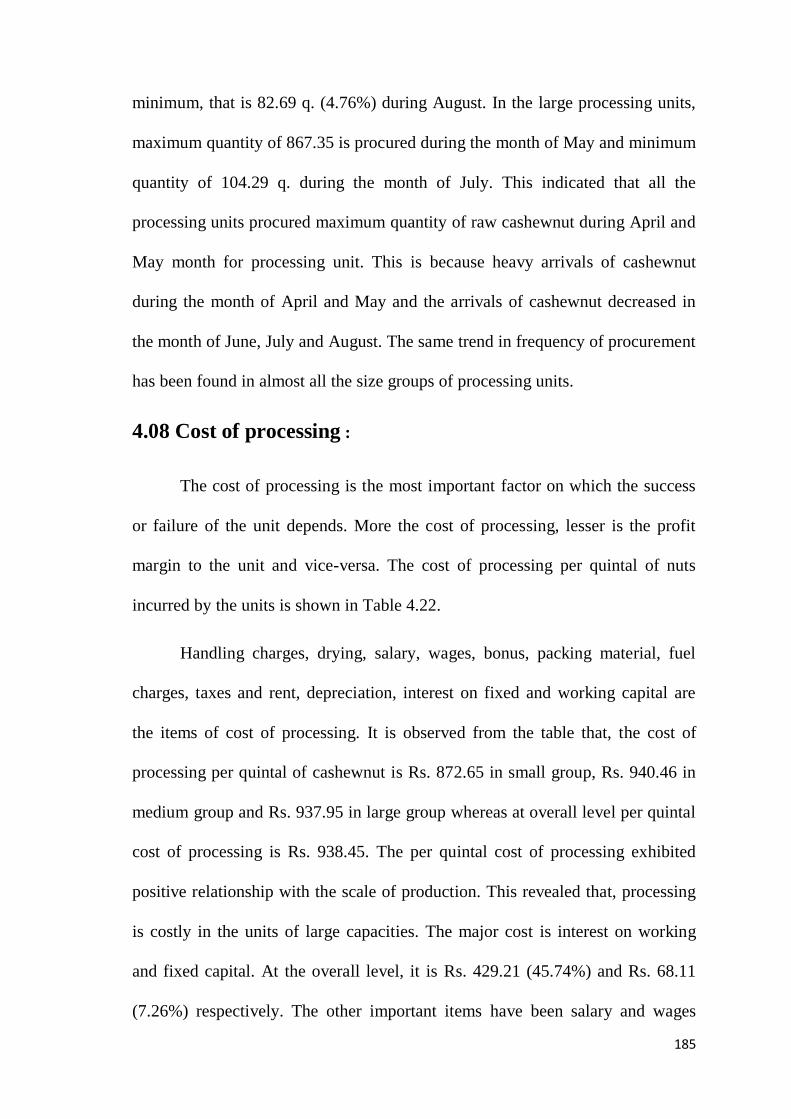
4.08 Cost of processing :
The cost of processing is the most important factor on which the success
or failure of the unit depends. More the cost of processing, lesser is the profit
margin to the unit and vice-versa. The cost of processing per quintal of nuts
incurred by the units is shown in Table 4.22.
Handling charges, drying, salary, wages, bonus, packing material, fuel
charges, taxes and rent, depreciation, interest on fixed and working capital are
the items of cost of processing. It is observed from the table that, the cost of
processing per quintal of cashewnut is Rs. 872.65 in small group, Rs. 940.46 in
medium group and Rs. 937.95 in large group whereas at overall level per quintal
cost of processing is Rs. 938.45. The per quintal cost of processing exhibited
positive relationship with the scale of production. This revealed that, processing
is costly in the units of large capacities. The major cost is interest on working
and fixed capital. At the overall level, it is Rs. 429.21 (45.74%) and Rs. 68.11
(7.26%) respectively. The other important items have been salary and wages
186
(27.90%), depreciation (2.39%), packing material (10.20%), bonus, handling and
drying (2.24% each) and fuel charges (1.28%).
Table no. 4.22
Per quintal cost of cashew processing
(Figures in Rs.)
Sr. No. Item of cost Small Medium Large Overall
1. Handling and drying 19.92
(2.28)
20.72
(2.20)
20.86
(2.22)
21.00
(2.24)
2. Salary and wages 209.93
(24.06)
274.54
(29.19)
261.54
(27.88)
261.83
(27.90)
3. Bonus 16.86
(1.93)
22.45
(2.39)
20.86
(2.22)
21.00
(2.24)
4. Packing material 79.68
(9.13)
99.00
(10.53)
96.36
(10.27)
95.72
(10.20)
5. Fuel charges 13.79
(1.58)
9.78
(1.04)
15.85
(1.69)
12.97
(1.28)
6. Taxes and rent 4.60
(0.53)
4.03
(0.43)
4.17
(0.44)
4.32
(0.46)
7. Depreciation 21.70
(2.49)
19.22
(2.04)
28.34
(3.02)
22.44
(2.39)
8. Interest on
a) Fixed capital 85.97
(9.85)
59.17
(6.29)
73.50
(7.84)
68.11
(7.26)
b) Working capital 417.14
(47.80)
429.82
(45.70)
414.80
(44.22)
429.21
(45.74)
9. Other charges 3.06
(0.35)
1.73
(0.18)
1.67
(0.18)
1.85
(0.20)
Total 872.65
(100.00)
940.46
(100.00)
937.95
(100.00)
938.45
(100.00)
Source : Result of data analysis
187
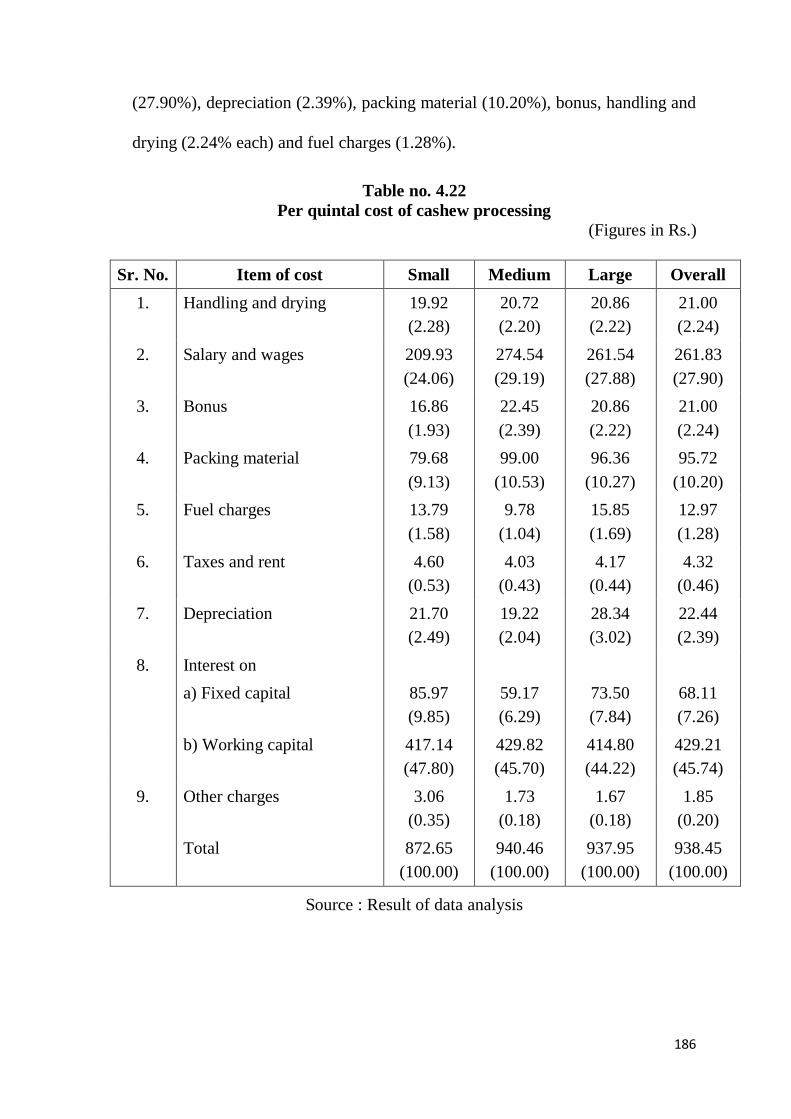
4.08.1 Quantity of main product and by-product :
The quantity of main product and by-product per quintal of cashewnut
processed is presented in Table 4.23. Kernel is the main product while shell, testa
(husk) and rejection are the by-products received from cashewnut processing.
At the overall level, one quintal of cashewnut when processed resulted in
24.70 kilograms of kernels (24.70%). 70.00 kilograms of shells (70.00%) and
3.00 kilograms of testa (3.00%) and 2.30 kilograms of rejection (2.30%).
Table no. 4.23
Quantity of main product and by-product per quintal of cashewnut
processed
(Figures in kgs.)
Sr.
No.
Items of
cost
Size of the processing unit Overall
Small Medium Large
1. Kernels 24.33 24.92 24.22 24.70
2. Shells 70.00 70.00 70.00 70.00
3. Testa
(Husk)
3.00 3.00 3.00 3.00
4. Rejection 2.67 2.08 2.78 2.30
Source : Result of data analysis
Outturn of main product, is less in small processing units, that is 24.33
kgs. and more in medium processing units, that is 24.92 kgs. Outturn of by-
products, that is, shells and testa (husk) is 70 kgs. (70.00 %) and 3 kgs. (3.00 %),
respectively in all the sizes of processing units. However the rejections have
been high in large units, that is 2.78 kgs. and low in medium processing units,
that is 2.08 kgs.
188
It is noticed that a negative relationship existed between the outturn of
kernels and rejection. While outturn of other two products, that is, shell and testa
(husk) remained same, in terms of quantity in all the groups.
4.08.2 Quality parameters of cashew kernels :
The quality parameters considered by the cashew processors in grading of
cashew kernel are listed below,
a) Shape and size : Cashew kernel should be bigger in size and
bean shaped
b) Colour : Cashew kernel should have white, pale ivory
or light ash colour
c) Moisture percentage : It should not be more than 4 to 5 per cent
d) Wholeness : Cashew kernel should not be broken or
damaged either manually or by insects. It
should be compact and free from testa.
e) Counts : It represents the number of cashew kernels
present per pound. Count of 180, is
considered as superior quality. Lower the
count superior is the quality.
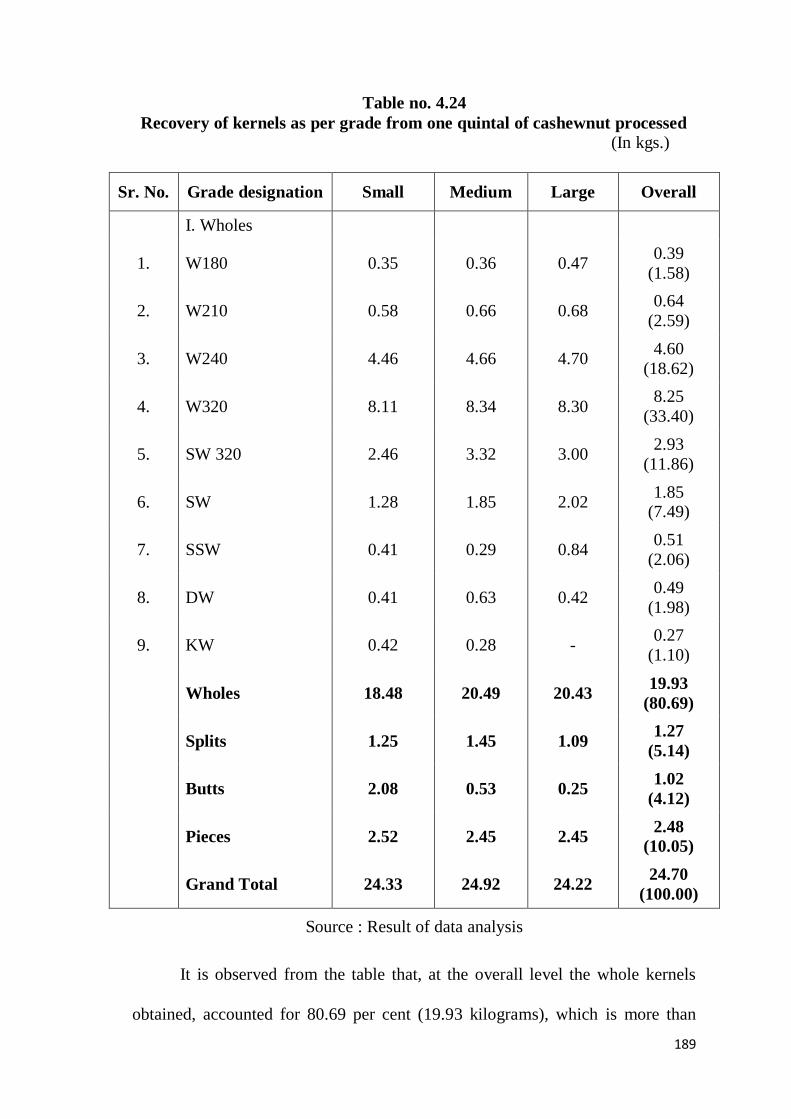
4.08.3 Recovery of kernels as per grade
Table 4.24 indicates the recovery of kernels as per grade from one quintal
of cashewnut. The kernels obtained from processing of cashewnut are sorted into
different grades as per the specifications as mentioned in export text.
189
Table no. 4.24
Recovery of kernels as per grade from one quintal of cashewnut processed
(In kgs.)
Sr. No. Grade designation Small Medium Large Overall
I. Wholes
1. W180 0.35 0.36 0.47 0.39
(1.58)
2. W210 0.58 0.66 0.68 0.64
(2.59)
3. W240 4.46 4.66 4.70 4.60
(18.62)
4. W320 8.11 8.34 8.30 8.25
(33.40)
5. SW 320 2.46 3.32 3.00 2.93
(11.86)
6. SW 1.28 1.85 2.02 1.85
(7.49)
7. SSW 0.41 0.29 0.84 0.51
(2.06)
8. DW 0.41 0.63 0.42 0.49
(1.98)
9. KW 0.42 0.28 - 0.27
(1.10)
Wholes 18.48 20.49 20.43 19.93
(80.69)
Splits 1.25 1.45 1.09 1.27
(5.14)
Butts 2.08 0.53 0.25 1.02
(4.12)
Pieces 2.52 2.45 2.45 2.48
(10.05)
Grand Total 24.33 24.92 24.22 24.70
(100.00)
Source : Result of data analysis
It is observed from the table that, at the overall level the whole kernels
obtained, accounted for 80.69 per cent (19.93 kilograms), which is more than
190
pieces (10.05 per cent), splits (5.14 per cent) and butts (4.12 per cent). Of the
cashew kernel grades recovered from one quintal of cashewnut, W320 accounted
to 8.25 kilogram (33.40% per cent), followed by W240 accounting to 4.60
kilogram (18.62 per cent), SW 320 according to 2.93 kilogram (11.86 per cent)
and SW accounting to 1.85 kilogram (7.49 per cent). Although there have been
several other grades, their percentage of recovery is very meager. Totally there
have been 26 grades of cashew kernels but only 12 grades have been found to be
used for the kernels sorting in the district.
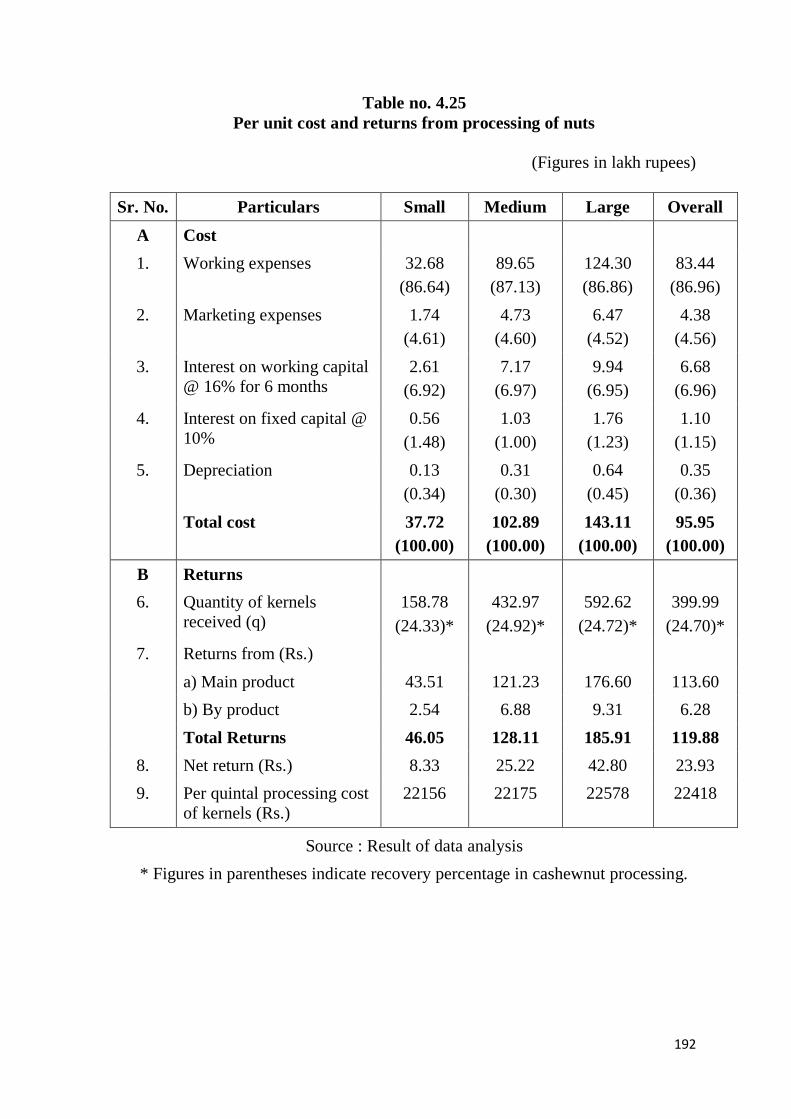
4.08.4 Per unit cost and returns from processing of nuts :
The items of cost included have been working expenses, marketing
charges, interest on capital and depreciation charges. It is seen from the Table
4.25 that at the overall level per unit cost of processing is worked out to Rs.
95.95 lakh. Out of the total cost, Rs. 83.44 lakh (86.96%) is incurred as working
expenses. The next important item of cost is interest on working capital as well
as fixed capital accounted for 6.96 per cent and 1.15 per cent, respectively.
Marketing charges accounted for Rs. 4.38 lakh (4.56%) and share of depreciation
is very negligible (0.36 per cent).
Regarding group wise per unit total cost incurred on cashew processing in
small group, medium group and large group it is Rs. 37.72 lakh, Rs. 102.89 lakh
and Rs. 143.11 lakh respectively. The share of different items of cost is more
or less similar as that of the overall level. The quantity of kernels received is
158.78 q., 432.97 q., 592.62 q. in small, medium and large processing units,
respectively, with the overall average quantity of 399.99 q.
191
The per unit cost and returns from processing of nuts is given in Table
4.25.
The value received for kernels and value of by products is considered as
total returns. The per unit total returns worked out to Rs. 46.05 lakh in small
group, Rs. 128.11 lakh in medium group and Rs. 185.91 in large group with the
overall average returns of Rs. 119.88 lakh. The net returns worked out to Rs.
8.33 lakh in small group, Rs. 25.22 lakh in medium group and Rs. 42.80 lakh in
large group. At the overall level, the net returns worked out to Rs. 23.93 lakh.
Considering the total cost of processing and quantity of kernels received, the per
quintal cost of production of kernel is worked out. It is Rs. 22418 at the overall
level, whereas it is observed that per quintal cost of production of kernel is found
to be increase with increase in size of factory, which is Rs. 22156 in small group.
Rs. 22175 in medium group and Rs. 22578 in large group.
192
Table no. 4.25
Per unit cost and returns from processing of nuts
(Figures in lakh rupees)
Sr. No. Particulars Small Medium Large Overall
A Cost
1. Working expenses 32.68
(86.64)
89.65
(87.13)
124.30
(86.86)
83.44
(86.96)
2. Marketing expenses 1.74
(4.61)
4.73
(4.60)
6.47
(4.52)
4.38
(4.56)
3. Interest on working capital
@ 16% for 6 months
2.61
(6.92)
7.17
(6.97)
9.94
(6.95)
6.68
(6.96)
4. Interest on fixed capital @
10%
0.56
(1.48)
1.03
(1.00)
1.76
(1.23)
1.10
(1.15)
5. Depreciation 0.13
(0.34)
0.31
(0.30)
0.64
(0.45)
0.35
(0.36)
Total cost 37.72
(100.00)
102.89
(100.00)
143.11
(100.00)
95.95
(100.00)
B Returns
6. Quantity of kernels
received (q)
158.78
(24.33)*
432.97
(24.92)*
592.62
(24.72)*
399.99
(24.70)*
7. Returns from (Rs.)
a) Main product 43.51 121.23 176.60 113.60
b) By product 2.54 6.88 9.31 6.28
Total Returns 46.05 128.11 185.91 119.88
8. Net return (Rs.) 8.33 25.22 42.80 23.93
9. Per quintal processing cost
of kernels (Rs.)
22156 22175 22578 22418
Source : Result of data analysis
* Figures in parentheses indicate recovery percentage in cashewnut processing.
193
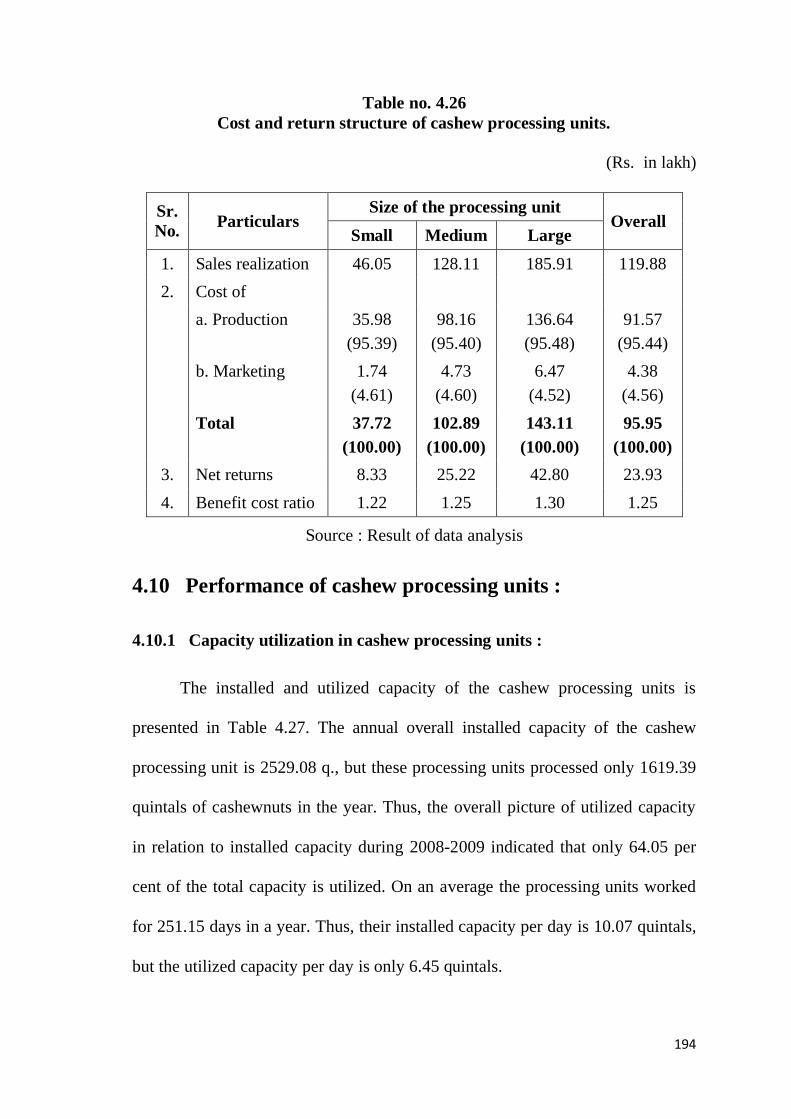
4.09 Cost and return structure involved in cashew processing :
Cost and return from processing of cashewnut is presented in Table 4.26.
The total cost incurred by the processing units is Rs. 95.95 lakh at the overall
level. It is more in large units (Rs. 143.11 lakh) than in medium (Rs. 102.89
lakh) and small processing units (Rs. 37.72 lakh).
Net returns at the overall level worked out to Rs. 23.93 lakh for cashewnut
processed. It is more in large units (Rs. 42.80 lakh) than in medium (25.22 lakh)
and small processing units (Rs. 8.33 lakh). It is observed that cashew processing
units at the overall level gained profits to the tune of Rs. 23.93 lakh that is, Rs.
1.25 on every rupee of investment. Large processing units gained higher profits,
(Rs. 1.30) as compared to medium (Rs. 1.25) and small processing units (Rs.
1.22). This indicated profitability for higher scale of production.
194
Table no. 4.26
Cost and return structure of cashew processing units.
(Rs. in lakh)
Sr.
No. Particulars
Size of the processing unit Overall
Small Medium Large
1. Sales realization 46.05 128.11 185.91 119.88
2. Cost of
a. Production 35.98
(95.39)
98.16
(95.40)
136.64
(95.48)
91.57
(95.44)
b. Marketing 1.74
(4.61)
4.73
(4.60)
6.47
(4.52)
4.38
(4.56)
Total 37.72
(100.00)
102.89
(100.00)
143.11
(100.00)
95.95
(100.00)
3. Net returns 8.33 25.22 42.80 23.93
4. Benefit cost ratio 1.22 1.25 1.30 1.25
Source : Result of data analysis
4.10 Performance of cashew processing units :
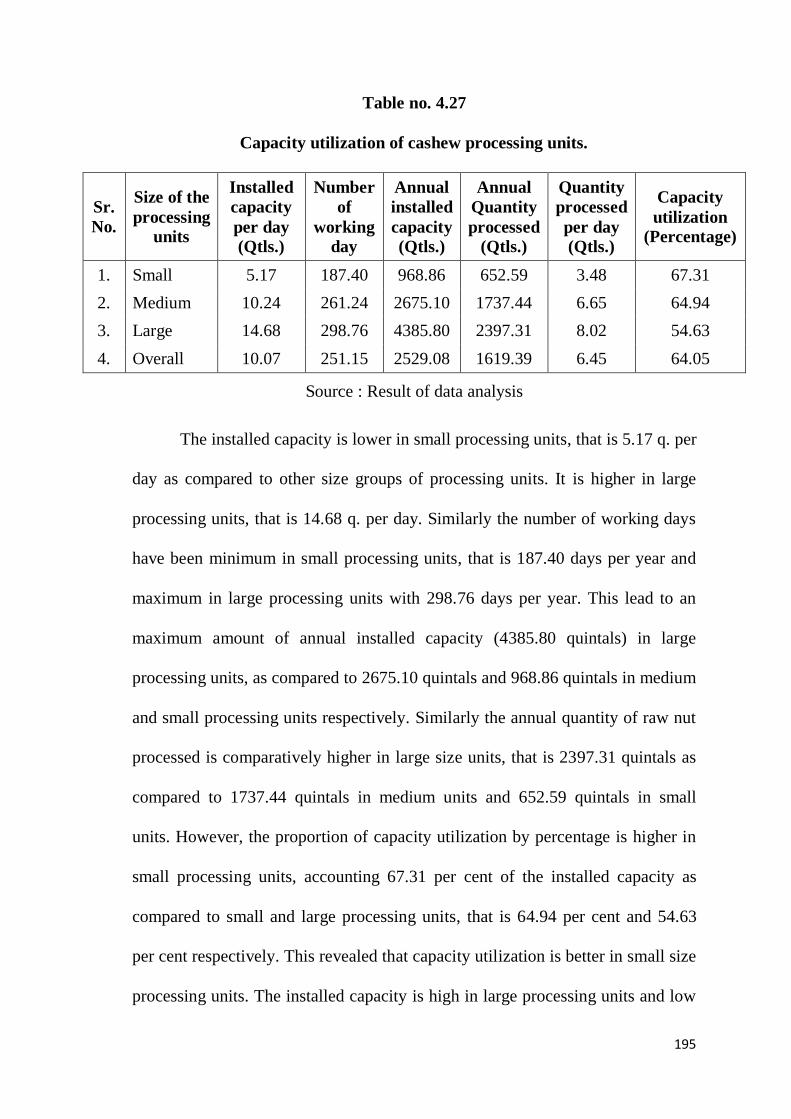
4.10.1 Capacity utilization in cashew processing units :
The installed and utilized capacity of the cashew processing units is
presented in Table 4.27. The annual overall installed capacity of the cashew
processing unit is 2529.08 q., but these processing units processed only 1619.39
quintals of cashewnuts in the year. Thus, the overall picture of utilized capacity
in relation to installed capacity during 2008-2009 indicated that only 64.05 per
cent of the total capacity is utilized. On an average the processing units worked
for 251.15 days in a year. Thus, their installed capacity per day is 10.07 quintals,
but the utilized capacity per day is only 6.45 quintals.
195
Table no. 4.27
Capacity utilization of cashew processing units.
Sr.
No.
Size of the
processing
units
Installed
capacity
per day
(Qtls.)
Number
of
working
day
Annual
installed
capacity
(Qtls.)
Annual
Quantity
processed
(Qtls.)
Quantity
processed
per day
(Qtls.)
Capacity
utilization
(Percentage)
1. Small 5.17 187.40 968.86 652.59 3.48 67.31
2. Medium 10.24 261.24 2675.10 1737.44 6.65 64.94
3. Large 14.68 298.76 4385.80 2397.31 8.02 54.63
4. Overall 10.07 251.15 2529.08 1619.39 6.45 64.05
Source : Result of data analysis
The installed capacity is lower in small processing units, that is 5.17 q. per
day as compared to other size groups of processing units. It is higher in large
processing units, that is 14.68 q. per day. Similarly the number of working days
have been minimum in small processing units, that is 187.40 days per year and
maximum in large processing units with 298.76 days per year. This lead to an
maximum amount of annual installed capacity (4385.80 quintals) in large
processing units, as compared to 2675.10 quintals and 968.86 quintals in medium
and small processing units respectively. Similarly the annual quantity of raw nut
processed is comparatively higher in large size units, that is 2397.31 quintals as
compared to 1737.44 quintals in medium units and 652.59 quintals in small
units. However, the proportion of capacity utilization by percentage is higher in
small processing units, accounting 67.31 per cent of the installed capacity as
compared to small and large processing units, that is 64.94 per cent and 54.63
per cent respectively. This revealed that capacity utilization is better in small size
processing units. The installed capacity is high in large processing units and low
196
in small processing units which is directly related to the amount of fixed capital
invested.
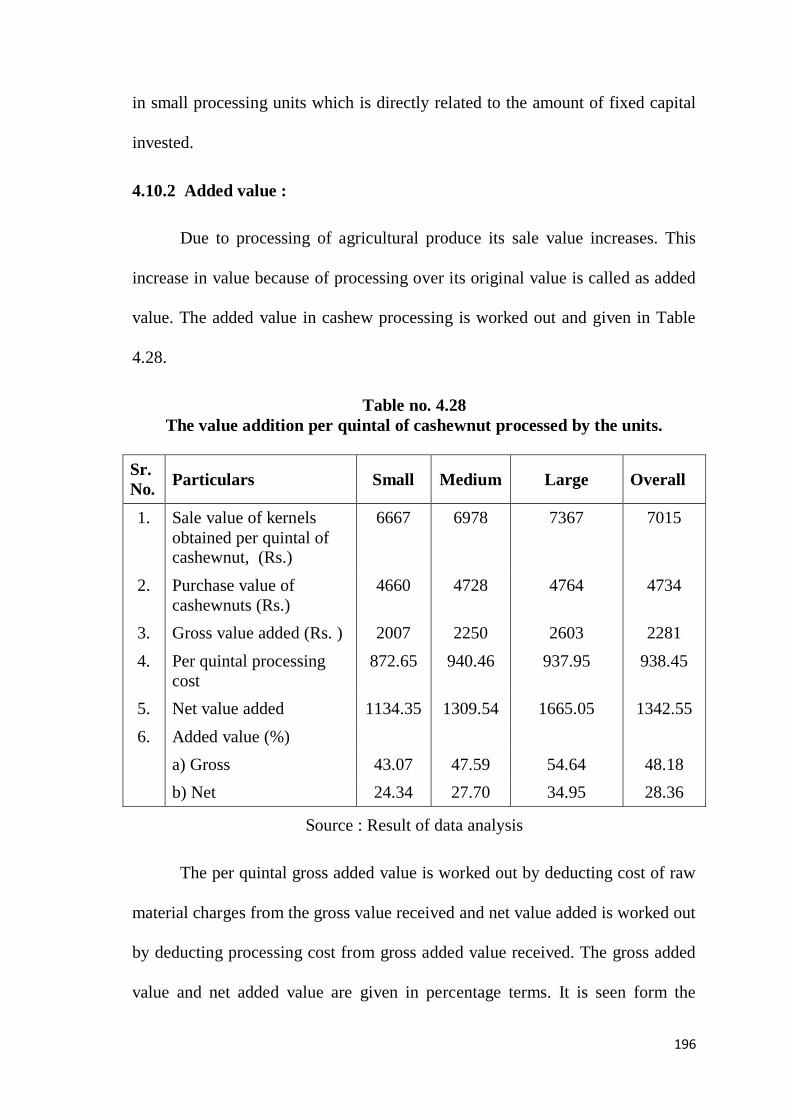
4.10.2 Added value :
Due to processing of agricultural produce its sale value increases. This
increase in value because of processing over its original value is called as added
value. The added value in cashew processing is worked out and given in Table
4.28.
Table no. 4.28
The value addition per quintal of cashewnut processed by the units.
Sr.
No. Particulars Small Medium Large Overall
1. Sale value of kernels
obtained per quintal of cashewnut, (Rs.)
6667 6978 7367 7015
2. Purchase value of
cashewnuts (Rs.)
4660 4728 4764 4734
3. Gross value added (Rs. ) 2007 2250 2603 2281
4. Per quintal processing
cost
872.65 940.46 937.95 938.45
5. Net value added 1134.35 1309.54 1665.05 1342.55
6. Added value (%)
a) Gross 43.07 47.59 54.64 48.18
b) Net 24.34 27.70 34.95 28.36
Source : Result of data analysis
The per quintal gross added value is worked out by deducting cost of raw
material charges from the gross value received and net value added is worked out
by deducting processing cost from gross added value received. The gross added
value and net added value are given in percentage terms. It is seen form the
197
Table 4.28, the gross added value in cashew processing is 43.07 per cent, 47.59
per cent and 54.64 per cent in small, medium and large group respectively.
Whereas net added value in cashew processing is 24.34 per cent 27.70 per cent
and 34.95 per cent respectively. At the overall level the gross added value came
to 48.18 per cent and net added value came to 28.36 per cent. It is observed from
the table that, as the working season increased the gross added value is found to
increase. The overall gross value added by processing unit is Rs. 2281 per
quintal of cashewnut processed, which accounted for 48.18 per cent. When the
percentage of value addition by processing activity in different sizes of
processing unit is considered it is found to be higher in large units (54.64%) than
in small units (43.07%). This may be because of higher sale value of cashew
kernel obtained by large unit than other units.
4.11 Résumé:
This chapter contains two parts, first part deals with the production of
cashewnut and second part with processing of cashewnut. In the present age of
competition, the success of any enterprise in the business of agriculture can be
judged on the basis of economic benefits accured to entrepreneur from a
particular crop or livestock enterprise. It has become necessary for the farmers to
look towards agriculture as a commercial proposition, particularly fruit crops like
cashew which has long economic life of almost 40 years. Returns from cashew
are spread over longer period, on the other hand during development stage of
orchard, large investment is made in establishment of orchard.
198
The chapter contains the production performance of raw cashewnut,
investment pattern in cashew processing unit, cost and return structure in cashew
processing unit, performance of cashew processing unit and the problems faced
by the unit and measures for effective functioning of the unit.
The average age of the cashew grower is 48.70 years. This indicated that,
cashew growers have been in adult age group. It is observed that, overall
educational score is 10.64. This indicates that by and large the cashew growers in
the study area have been educated from 10th
to 11th
standard. Size of the family is
the important factor influencing the supply of farm labour. It also affects income
generating capacity of farmer‟s family.
The cashew orchard starts bearing generally after five years from the year
of plantation. The establishment cost includes the variable, material and fixed
costs. The cashew growers have to invest considerable amount in the form of
inputs for establishment of the cashew orchard up to its bearing stage.
Considering above changes, the approximate cost of establishment of local
varieties of cashew orchard is estimated to Rs. 87430.56.
As regards the per hectare quantities of physical inputs utilized for HYV
cashew orchard more than the local variety of cashew orchard. Per hectare net
returns obtained from local varieties have been Rs. 24219.20 and the benefit cost
ratio is 1.80. In case of HYV, per hectare net returns obtained have been as Rs.
46897.38 and benefit cost ratio is 2.00.
The selected units have been classified as small having working season up
to 225 days, medium working season between 225 to 275 days and large,
199
working season above 275 days. The average establishment period is 26.8 years.
The units have been also classified on the basis of type of ownership as
partnership and individual. There have been 13 units (72.22%) owned and
managed by individual, while remaining 5 units (27.78%) in partnership.
The working of the units is seasonal in nature. There is a great variation in
the working season from unit to unit. It is seen that average working season of
unit in small, medium and large group is 187.40 days, 261.24 days and 298.76
days, respectively. The per unit male employment is 2.4 days, 4.6 days and 3.2
days in small, medium and large group respectively, while per day female
employment is 19.2 days, 40.3 days and 52.4 days in small, medium and large
group, respectively.
The comparison between the small, medium and large size processing
units revealed that, the total fixed capital investment increased with the increase
in size of the cashew processing units. In all the three size groups the fixed
capital investment on building and land accounted for a major share followed by
machinery and equipment, infrastructure and other fixtures. Actual expenditure
incurred on purchase of raw nut, salary, wages, packing material, taxes, rent, fuel
etc. have been included in working capital
At the overall level the per unit working capital investment is found to be
Rs. 83.44 lakh. Major amount is spent on the purchase of raw cashewnut, from
the total working capital investment in running the cashew processing industry. It
is found that, purchase of raw nuts shared Rs. 30.41 lakh (93.05%) in small
200
group, Rs. 82.14 lakh (91.62%) in medium group and Rs. 114.20 lakh (91.87%)
in large group.
The average aggregate capital invested per processing unit is Rs. 94.47
Lakh. The investment pattern of the cashew processing units revealed that, there
is a direct relationship between total capital invested and size of the processing
units. The capital investment increased with the size of units, because of the
increased requirement of fixed and working capital.
At overall level on an average, the quantity of cashewnut procured is
highest in the months of April and May, which is 603.28 q. (37.25%) and 601.42
q. (37.14%), respectively. In the months of June, July and August, it is 244.57 q.
(15.10 %), 95.52 q. (5.90%) and 74.60 q. (4.61%), respectively. The total
quantity procured is 1619.39 q. at the overall level.
The cost of processing is the most important factor on which the success
or failure of the unit depends. More the cost of processing, lesser is the profit
margin to the unit and vice-versa. Handling charges, drying, salary, wages,
bonus, packing material, fuel charges, taxes and rent, depreciation, interest on
fixed and working capital are the items of cost of processing. The cost of
processing per quintal of cashewnut is Rs. 872.65 in small group, Rs. 940.46 in
medium group and Rs. 937.95 in large group whereas at overall level per quintal
cost of processing is Rs. 938.45. The per quintal cost of processing exhibited
positive relationship with the scale of production. This revealed that, processing
is costly in the units of large capacities. The major cost is interest on working
201
and fixed capital. At the overall level, it is Rs. 429.21 (45.74%) and Rs. 68.11
(7.26%) respectively.
At the overall level, one quintal of cashewnut when processed resulted in
24.70 kilograms of kernels (24.70%). 70.00 kilograms of shells (70.00%) and
3.00 kilograms of testa (3.00%) and 2.30 kilograms of rejection (2.30%).
At the overall level, the net returns worked out to Rs. 23.93 lakh.
Considering the total cost of processing and quantity of kernels received, the per
quintal cost of production of kernel is worked out. It is Rs. 22418 at the overall
level, whereas it is observed that per quintal cost of production of kernel is found
to be increase with increase in size of factory, which is Rs. 22156 in small group.
Rs. 22175 in medium group and Rs. 22578 in large group.
Due to processing of agricultural produce its sale value increases. This
increase in value because of processing over its original value is called as added
value. The per quintal gross added value is worked out by deducting cost of raw
material charges from the gross value received and net value added is worked out
by deducting processing cost from gross added value received. The gross added
value in cashew processing is 43.07 per cent, 47.59 per cent and 54.64 per cent
in small, medium and large group respectively. Whereas net added value in
cashew processing is 24.34 per cent 27.70 per cent and 34.95 per cent
respectively. At the overall level the gross added value came to 48.18 per cent
and net added value came to 28.36 per cent. It is observed from the table that, as
the working season increased the gross added value is found to increase. The
next chapter contains problems and prospects of cashewnut processing industry.