Embed Size (px)
Citation preview
71
CHAPTER - IV
Co-operative Movement in India, Karnataka and
Mysore District
4.1 Introduction
A vast majority of women in Karnataka State and Indian Republic constitute the
marginalized sections of society. The women need multi-faceted developmental support
from banks, cooperatives, SHGs and other sources in order to achieve progress on par
with men in all spheres of human life. Women are constitutionally protected and
politically represented in India but they are socially oppressed and economically exploited
section of the society. Karnataka State is in the forefront of cooperative movement in
India. The State has also promptly implemented the rules, regulations and guidelines of
Government of India with respect to the management of cooperatives in general and
empowerment of women and weaker sections in particular. There are a sizeable number of
women cooperatives and women constitute more than 50% of the membership of the
cooperatives in the state of Karnataka. There is a need to make the women economically
self-reliant and professionally competent in modern society through cooperatives and
other agencies as a matter of social responsibility. This chapter contains the development
of cooperatives in India, Karnataka State and Mysore District. Along with this, in this part
of the chapter, it is tried to provide status of cooperative societies in terms of growth of no.
of societies, membership, share capital, and working capital for general cooperatives and
women cooperatives. It is examined at all India level, state level (Karnataka) and the
district level (Mysore District).
4.2 Cooperatives in India
The cooperative movement in India has passed through several stages. Scholars
have noted that cooperatives in India have begun with the passing of the Cooperative
Societies Act of 1904. In India the cooperative movement has completed 108 years since
its inception Frederick Nicholson has documented that the idea starting cooperative
societies in India was motivated by the factor of combating rural poverty and
indebtedness. The Madras Government gave a serious thought to the possibilities of
starting a system of land banks in that state. The Famine Commission (1898) strongly
advocated the idea of cooperation for Indian agriculturist. Lord Curzon examined this
72
report and constituted a committee in 1901 under the chairmanship of Edward Law. The
committee explored the possibilities of launching an organized cooperative movement in
India and submitted meaningful recommendations. Hence, the first Cooperative Credit
Societies Act, 1904 was enacted in India for the first time. The salient features of the Act
are as follows:
Any association of ten persons who were competent to enter into a contract could
apply for registration and themselves into a cooperative society for the purpose of
providing credit.
Credit societies were distinguished as rural and urban according as at least 4/5ths
of the members were agriculturists or non-agriculturists.
In case of rural societies unlimited liability was the rural, while option was given
in case of urban societies.
In a rural society all profits were to be carried to a reserve fund and in case of
urban only 1/4th
of the profits were to be carried to it.
No member could hold more than 1/5th
of the shares and to a maximum limit of Rs.
100 only.
Registrars were to be appointed in all the Provinces to exercise supervision over
the organization and also to exercise overall control over the movement.
Every society was to be compulsory audited.
The government offered certain reasonable concessions such as exemption from
income tax, stamp duty and registration fee in order to promote the cooperatives. Besides
this, the government also granted loans to cooperative societies free of interest for a
certain period. During this phase, cooperatives were established all over the country as a
means of economic support to agriculture and rural development.
The second phase of cooperative movement (1912-1929) witnessed rapid growth
in the number of cooperatives in the country. The Act was not broad based enough to
cover all dimensions of cooperative management in the country. It did not facilitate legal
sanction and capital mobilization in a systematic way. The second Cooperative Societies
Act was passed in 1912 in order to provide legal recognition to producers and distributive
societies such as cooperative unions, central banks and provincial banks. The government
also abolished the distinction between rural and urban cooperative societies and in its
place added unlimited and limited liability classification. The societies having majority of
73
members as cultivators were to be of unlimited liability while the central societies were
required to adopt limited liability.
The new act provided an impetus to the cooperative movement in the country and
new types of societies came into existence in different sectors of economic mainstream.
The government also appointed Maclagan Committee in 1914 in order to promote the
cooperative movement in the right direction. The committee made for reaching proposals
for the development of the cooperative movement including systematic audit, setting up of
provincial banks, emphasis on teaching and steady progress of the cooperative movement.
Under the Reform Act of 1919, cooperation became a provincial subject and various states
passed independent cooperative acts in order to suit their environment and convenience.
The Cooperative Societies Act of Bombay (1925), Madras (1932) and Orissa (1935) were
passed with suitable changes and modification. These new initiatives paved the way for
healthy and competitive cooperatives all over the country.
The third phase of the cooperative movement in India occurred during 1929-1933.
The Great Depression caused a setback to cooperative movement in the country. There
was unexpected slump in agricultural prices and farmers experienced decline in the
agricultural income. Consequently, the number of credit societies considerably decreased
from 89 thousands in 1930 to 84 thousands in 1935, writes Madan (2007).
The fourth phase of the cooperative movement occurred during 1934-1946 in the
country after the Great Depression. Several provincial governments appointed committess
before independence in order to look into the re-construction of cooperative movement in
the country. During this period, the policy makers and officials concentrated on
consolidation, rectification and rejuvenation of the cooperative movement in the country.
There was rise in the prices of agricultural commodities and farmers were enabled to repay
their loans regularly. The deposits also increased and there was considerable demand for
financial assistance. The introduction of economic controls and rationing of food grains
and other necessities gave impetus to the growth of non-credit forms of societies
particularly consumer stores, marketing and industrial societies. The government also
constituted Cooperative Reconstruction Committee in 1945 in order to strengthen the roots
of cooperative movement in the country. The committee made the following
recommendations:
The State should end laissez-faire policy and should enlarge its functions in
spheres like education, agriculture, industries etc.
74
The distribution of improved agricultural implements, seeds, rationed goods etc.,
should be made through the cooperative societies.
The credit cover only one aspect of the agriculturists life and all village credit
societies should be converted into multipurpose ones to cover all aspects and they
should be properly coordinated with marketing societies.
50% of the villages and 30% of the rural population should be brought into the
cooperative fold within a period of ten years and there should be at least 50
members in a society to have adequate business.
All important types non-credit societies, such as fruit growing, consolidation of
holdings, cooperative farming, industrial labour etc., with proper central
organizations where ever necessary should be encouraged and 50% of the cost of
management should be borne by Government during first five years.
The partition of the country caused serious setback to the cooperative movement
especially in three provinces such as West Bengal, East Punjab and Assam where many
members left the societies without paying their dues. The total number of cooperative
societies also fell since some of the territories became part of Pakistan.
The 5th
phase of cooperative movement took place during 1947-1954. Mahatma
Gandhi was a champion of cooperative movement. He called upon the national leaders to
facilitate the development of cooperatives in the country as effective instrument of
decentralized and localized economic development. His works inspired the policy makers
to strengthen the foundation of cooperative movement in the country on the basis of sound
principles and practices. The independent Indian government gave a serious thought to the
advancement of cooperative movement in the country several types of cooperative
societies and non-credit societies were encouraged by the government in the post-
independence era.
The 6th
phase of cooperative movement in the country took place during 1954-1961.
The Reserve Bank of India appointed a Committee of Direction in 1951 in order to carry
out All India Rural Credit Survey. The committee submitted the report in 1954 and
identified certain drawbacks to cooperative movement in India. Prominent among them
were absence of no organic connection between credit, marketing and processing,
prevalence of urban derived competition against cooperatives and week rural based
structure of the cooperatives. The committee also made certain recommendations to
improve the state of affairs including state partnership, cooperative training, allocation of
75
funds and so on. These recommendations were implemented by the central government
during the second five year plan.
The government also constituted a committee on Cooperative law in 1956 under the
chairmanship of T.S. Raja. The committee framed the model Cooperative Societies Bill,
Rules and Bylaws for various types of societies and strongly advocated that all the state
governments should adopt the model act in letter and spirit. The Planning Commission of
India sent a delegation to China to study the cooperative movement including agrarian
cooperatives. The committee submitted its reports in 1957 and laid emphasis on the
formation of joint cooperative farming societies on a voluntary basis. The National
Develpoment Council reviewed the role of cooperative movement in 1958 and explored
the possibilities of rebuilding rural economy on the basis of intensification of agricultural
production, mobilization of financial resources and development of human resources. The
Working Grouph on Cooperative Policy (1958) also recommended that village community
should be the primary unit of development and fixed a target of 20 million members for
service cooperatives at the end of second five year plan. The government also appointed a
Committee on Cooperative Credit under the Chairmanship of V.L. Mehta which
recommended increased credit for farmers and artisans across the country. The committee
also suggested that liberalized credit facilities should be utilized for increasing agricultural
production. The Government of India also set up a Study Team on Cooperative Training
under the chairmanship of S.D. Misra which recommended that National Cooperative
Union of India should be entrusted with the task of providing cooperative education and
training in the country.
The 7th
phase of cooperative movement in India took place after 1961. The
Government of India constituted a separate Ministry of Agriculture and a new department
of cooperation was created under this Ministry. The National Cooperative Development
Corporation came into existence in 1962 with a view to facilitate organized growth and
development of cooperative movement in the country. The Agricultural Refinance
Corporation was established in 1963 and it was renamed as Agricultural Refinance and
Development Corporation in 1975. Special provisions were created for the expansion of
primary cooperative societies, marketing societies, construction of godowns, creation of
processing factories, organization of cooperative farming societies and establishment of
non-credit societies in the country. The government also constituted several committees
on cooperation subsequently namely Committee on Taccavi Loans and Cooperative Credit
76
(1962), Committee on Cooperative Administration (1963), Committee on Cooperation
(1964), Committee on Cooperative Marketing (1964), All Rural Credit Review Committee
(1964) and so on. These committees extensively examined the systematic advancement of
cooperative movement in the country. The Farmer’s Service Cooperatives were
established on the basis of the recommendation of National Commission on Agriculture
(1970). The government also constituted another committee under the chairmanship of
T.A. Pai to suggest appropriate institutional structure for expansion of cooperatives in the
rural areas. The Fifth Five Year Plan contained several progressive measures for the
advancement of cooperative sector in the country.
The 20 point economic programme emphasized the liquidation of rural indebtedness
and created provision for institutional credit to farmers and artisans in the rural areas. The
regional rural banks were established to cater to the credit needs of the people in the rural
areas including marginal farmers, agricultural laborers, artisans and other weaker sections
of the society. The institutional credit for agriculture and rural development was examined
by the Sivaraman Commission (1979) which recommended the expansion of cooperative
institutions, commercial banks, regional banks and other organizations.
The Sixth Five Year Plan (1980-85) pointed out that cooperatives have embraced a
larg gamut of activities to serve the interest of the producers and consumers. There were
1.16 lakh Primary Agricultural Societies in the country with a membership of 5.18 crores.
The cooperatives covered almost all the villages in the country and their working capital
exceeded Rs.3000 crores. The decade of 1980s witnessed commendable expansion of
cooperative sector in the country. A four tier system comprising the National Federation,
State Federation, cental society at the district and the primary societies at the base levels
operated in the country. The government launched programme of reorganization of
cooperative societies in the country.
The Seventh Five Year Plan (1985-90) witnessed all round progress in the field of
credit by cooperatives. The emphasis in the Seventh Plan was laid on the development of
primary agricultural credit society as multiple viable units. The Agricultural Credit
Review Committee (1986) was constituted under the Chairmanship of A.M. Khusro which
reviewed the rural financial system thoroughly and recommended that cooperative
structure should be changed structurally and operationally.
The Eighth Five Year Plan (1992-97) has noted that cooperatives are expected to play
a major role in the distribution of inputs and services to the farmers on the one hand and in
77
assisting marketing and processing of agricultural produce on the other. The development
of cooperatives has been envisaged as a significant strategy to empower the women and
weaker section in the country. The government has resolved to enhance the capabilities of
cooperatives and build cooperative movement on the basis of sound priniciples and
practices. The central government also constituted another Committee on Organization of
Cooperatives for Rural Poor (1990) under the Chairmanship of S.R. Sankam which noted
that a bulk of the rural poor still depended on private money lenders for meeting their
needs. It suggested that cooperatives should evolved a simple system of providing credit
to the poor people basing on the repaying capacity.
The Kisan Credit Card was introduced in 1998-1999. The National Agricultural Policy
(2000) primarly dealt with the role of cooperatives in the Ninth Five Year Plan (1997-
2002). The Ninth Five Year Plan envisaged a growth of 4.5 percent per annum in the
agricultural sector. The Tenth Five Year Plan (2002-2007) targeted healthy and
competitive growth of agricultural sector. The cooperatives have grown up to the
emerging challenges of the market oriented economy in the age of globalization. Greater
emphasis has been laid on agro-processing units and increased value of agricultural
commodities in the country. The National Policy on Cooperatives has underlined the all
round development of cooperatives in the country.
The Multi State Cooperative Societies Act (2002) was enacted with a view to
facilitate the organized development of cooperatives in general and empower the
women and weaker sections in particular. The cooperatives have assumed an
important role in the new millennium despite certain policy oriented and operations
oriented constraints. However, the benefits of cooperative development programmes and
projects have not percolated to large sections of the rural population including the women
and weaker sections. There is a need for self-sustaining growth of cooperative
management since cooperatives have assumed an important role in the socio-
economic development of the rural areas. Scholars and specialists have suggested that
meaningful initiatives are required to stream line the functioning of the cooperatives in
the country. "The strategy of cooperative development in the country in the 21st
century
will have to aim at reaching out to those sections of society which have been by passed in
the process of development" suggests Madan (2007).
78
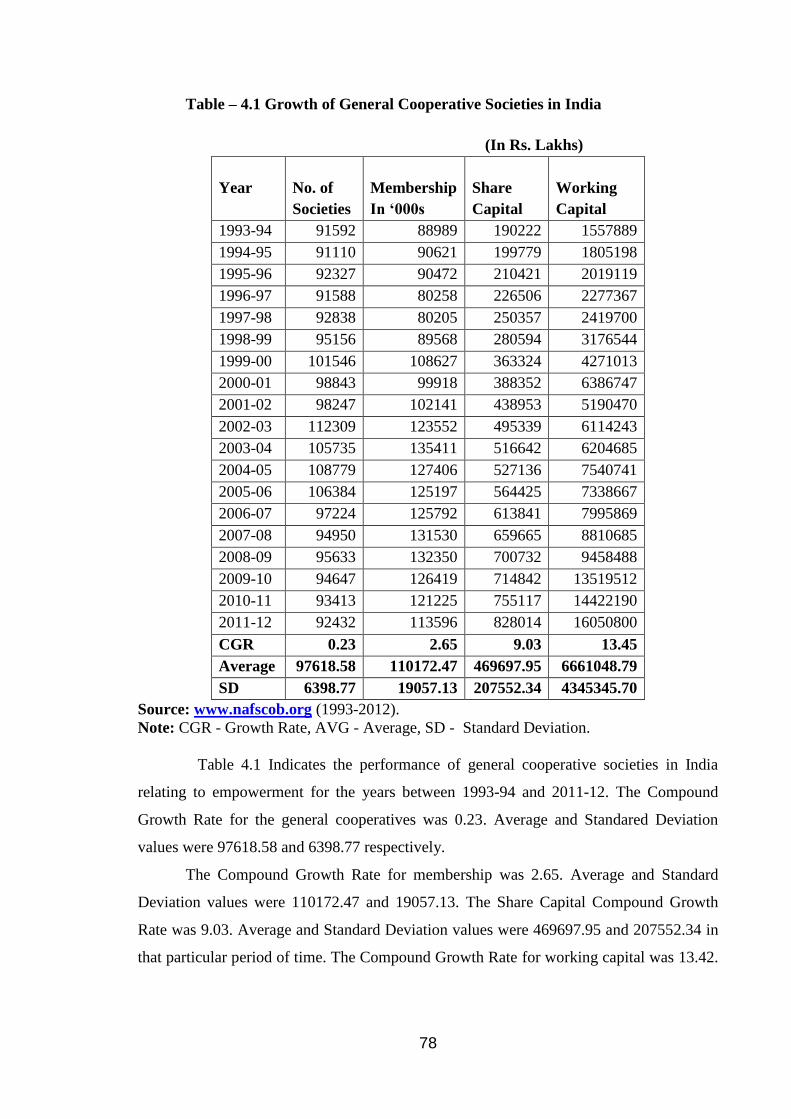
Table – 4.1 Growth of General Cooperative Societies in India
(In Rs. Lakhs)
Year
No. of
Societies
Membership
In ‘000s
Share
Capital
Working
Capital
1993-94 91592 88989 190222 1557889
1994-95 91110 90621 199779 1805198
1995-96 92327 90472 210421 2019119
1996-97 91588 80258 226506 2277367
1997-98 92838 80205 250357 2419700
1998-99 95156 89568 280594 3176544
1999-00 101546 108627 363324 4271013
2000-01 98843 99918 388352 6386747
2001-02 98247 102141 438953 5190470
2002-03 112309 123552 495339 6114243
2003-04 105735 135411 516642 6204685
2004-05 108779 127406 527136 7540741
2005-06 106384 125197 564425 7338667
2006-07 97224 125792 613841 7995869
2007-08 94950 131530 659665 8810685
2008-09 95633 132350 700732 9458488
2009-10 94647 126419 714842 13519512
2010-11 93413 121225 755117 14422190
2011-12 92432 113596 828014 16050800
CGR 0.23 2.65 9.03 13.45
Average 97618.58 110172.47 469697.95 6661048.79
SD 6398.77 19057.13 207552.34 4345345.70
Source: www.nafscob.org (1993-2012).
Note: CGR - Growth Rate, AVG - Average, SD - Standard Deviation.
Table 4.1 Indicates the performance of general cooperative societies in India
relating to empowerment for the years between 1993-94 and 2011-12. The Compound
Growth Rate for the general cooperatives was 0.23. Average and Standared Deviation
values were 97618.58 and 6398.77 respectively.
The Compound Growth Rate for membership was 2.65. Average and Standard
Deviation values were 110172.47 and 19057.13. The Share Capital Compound Growth
Rate was 9.03. Average and Standard Deviation values were 469697.95 and 207552.34 in
that particular period of time. The Compound Growth Rate for working capital was 13.42.
79
Average and Standard deviation values were 6661048.79 and 4345345.70 respectively
over a study period.
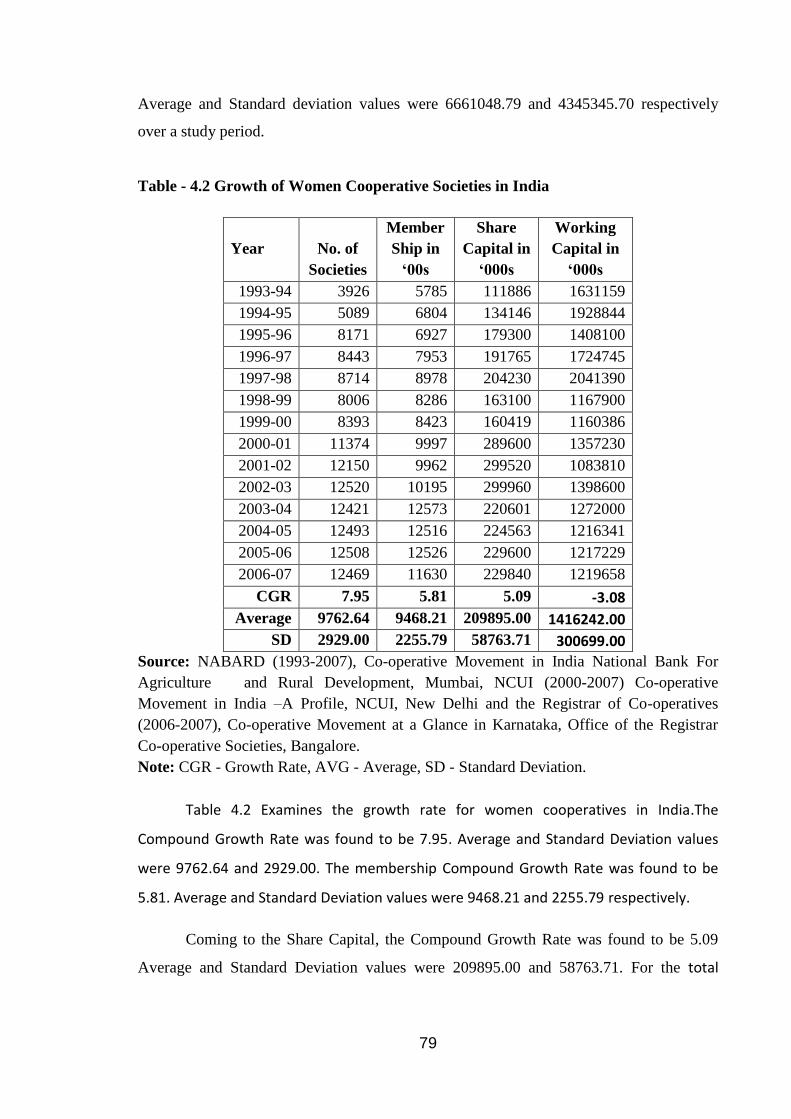
Table - 4.2 Growth of Women Cooperative Societies in India
Year
No. of
Societies
Member
Ship in
‘00s
Share
Capital in
‘000s
Working
Capital in
‘000s
1993-94 3926 5785 111886 1631159
1994-95 5089 6804 134146 1928844
1995-96 8171 6927 179300 1408100
1996-97 8443 7953 191765 1724745
1997-98 8714 8978 204230 2041390
1998-99 8006 8286 163100 1167900
1999-00 8393 8423 160419 1160386
2000-01 11374 9997 289600 1357230
2001-02 12150 9962 299520 1083810
2002-03 12520 10195 299960 1398600
2003-04 12421 12573 220601 1272000
2004-05 12493 12516 224563 1216341
2005-06 12508 12526 229600 1217229
2006-07 12469 11630 229840 1219658
CGR 7.95 5.81 5.09 -3.08
Average 9762.64 9468.21 209895.00 1416242.00
SD 2929.00 2255.79 58763.71 300699.00
Source: NABARD (1993-2007), Co-operative Movement in India National Bank For
Agriculture and Rural Development, Mumbai, NCUI (2000-2007) Co-operative
Movement in India –A Profile, NCUI, New Delhi and the Registrar of Co-operatives
(2006-2007), Co-operative Movement at a Glance in Karnataka, Office of the Registrar
Co-operative Societies, Bangalore.
Note: CGR - Growth Rate, AVG - Average, SD - Standard Deviation.
Table 4.2 Examines the growth rate for women cooperatives in India.The
Compound Growth Rate was found to be 7.95. Average and Standard Deviation values
were 9762.64 and 2929.00. The membership Compound Growth Rate was found to be
5.81. Average and Standard Deviation values were 9468.21 and 2255.79 respectively.
Coming to the Share Capital, the Compound Growth Rate was found to be 5.09
Average and Standard Deviation values were 209895.00 and 58763.71. For the total
80
working capital the Compound Growth Rate was -3.08. Average and Standard Deviation
values were 1416242.00 and 300699.00 respectively.
On the basis of the results obtained, the percent of women cooperative societies to
gereral cooperative societies were calculated for No. of societies, membership, share
capital, and working capital are respectively, 10.00, 8.59, 44.69, 21.26 percent. The
result indicates that there is better representation for women in share capital and working
capital in India. The No. of societies and membership of women have also grown over a
period of time in India.
4.3. Profile of Karnataka State
4.3.1. General
The State of Karnataka is the 8th
largest state in the Indian Republic in terms of
geographical area 1.90 lakh sq. kms. The state is situated in South West India and
accounts for 6.3 percent of geographical area and 5.1 percent of the population in the
country. The state is bounded by Maharashtra and Goa states in the north and
northwest; by the Arabian sea in the west; Kerala and Tamilnadu in the south and
Andhra Pradesh in east. The State is confined roughly within 11°.5' and 18°.5' North
latitudes and 74° and 78°.5 East longitudes, situated on a table land, where the
Western and Eastern Ghat ranges converge in the Nilgiri hill complex.
Karnataka State has various types of variations in topography - high
mountains, plateaus, residual hills and coastal plains. It is enclosed by chain of
mountains to its west and north. It consist mainly the plateau which has higher
elevation of 600 to 900 meters above mean sea level. The entire landscape is
undulating, broken up by mountains and deep ravines. Plain land of elevation less than
300 meters above mean sea level is found only in the narrow coastal belt facing the
Arabian Sea.
Karnataka State extends to about 750 km. from north to south and about 400 km.
from east to west. It covers an area of about 1, 90, 498 sq. km. Karnataka is one of the 28
states in India, emerging as an industrial super power of the country. The state has 29
districts and 176 taluks. There are 20 sea ports including Mangalore Port and Karwar
Ports. Karnataka has four revenue divisions namely Gulbarga, Dharwad, Bangalore and
Mysore. Karnataka also has four functional airports at Bangalore, Mangalore, Belgaum
and Hubli. The International Airports was commissioned in 2008 at Bangalore. The
81
railway network in the state covers a total length of 3172 kms. The major cities like
Bangalore, Mysore, Hubli-Dharwad, Belgaum, Gulbarga and Mangalore are well linked
by rail to other parts of the country.
4.3.2. Physical Features
The State has wide variation in climate, soil and topography. The soils vary from
vast stretches of deep black soils to shallow red soils. Forests cover about 20% of the
geographical area. There are Coastal Region, Northern Plateau Region, Central plateau
and Southern Plateau Region. The State of Karnataka enjoys 3 main types of climate and
the tropical climate covers the entire coastal belt and the adjoining areas. The coastal
region receives excessive rainfall during June to September every year. The winter
season exists during December to February while the summer season exists during
March to May. The state also receives about 70% of normal annual rainfall during the
south-west monsoon and north-east monsoon.
4.3.3.Demographic Features
The State has the population of 5.28 crore according to Census, 2001. The rural
population constitutes 66% and urban population constitutes 34%. The male population
constitutes 50.90% while the female population constitutes 49.10%. The decade of 1991-
2001 witnessed a low growth of population (17.20%) as compared to the all India level
(21.34%). The density of population in the state was at 275 persons per sq km. The state
has about 25% of people who live below poverty line. The urban poor constitute about
25.25% while the rural poor constitute about 17.38%. The agriculturists and agricultural
labourers together accounted for 67.7% of the main workers in the state about 55% of
the work force is associated with the agriculture sector while the remaining the work
force is associated with industry, business and other unorganized sector.
4.3.4.Development Indicators
The infrastructure development index of the state was 106.12 as against 100 at all
India level as per the estimates of CMIE, 2000. The state has registered an impressive
economic growth during 2001-10. The annual growth rate of GSDP for the state was at
8% as compared to 9% at all India level during the present decade. The sector wise
shares in the income of the state stood at 20.9% for primary, 23% for secondary and
82
56.1% for tertiary sectors. The developmental expenditure stood at 63% while the non
development to the expenditure stood at 37% in the present decade. However,
expenditure on agriculture and allied services formed 11% of the total development
expenditure.
The State has a total road length of 2,09,014 km, which works out to 108.98 km
of road length per 100 sq. km. About 70 percent of villages are connected with all
weather roads and the rest are connected by fair weather, kutcha and non-motorable
roads. The agriculture sector consists of about 55% of net shown area followed by 16%
forest, and 29% of the land consisted of non agricultural, uncultivated and barren land.
The small and marginal holdings accounted for 72.9% in the state and a large
proportion of fanners in the state were small scale cultivators. The state also
witnessed decline in the size of land holding mainly due to division of families,
fragmentation of holdings and migration of cultivators to urban areas. The state has
about 43.95% of irrigation resources. The major sources of irrigation were canals
(33.7%), wells (15.1%), borewells (31.3%), tanks (6.3%) and other sources (13.6%).
Food grain production in the State was estimated to be 97.90 lakhs while
production of oil seeds was estimated to be 13.49 lakh tones during 2006-07. Animal
husbandry played an important complementary role in the rural economy. The state also
achieved commendable progress in the field of dairying due to implementation of cross
breading programme, disease diagnosis and control, adoption of new technology,
improvement of infrastructural facilities and other developments. Small farmers and
landless laborers accounted for about 53% of the animal husbandry and 51% of milk
production in the country. The extent of awareness of modern aspects of forming, crop
insurance, membership of registered fanners organization, membership of Self Help
Groups consistently grew in the state during the present decade.
The state as maintained about 18% of share of industrial sector and the
average annual growth of industrial production stood at 6.39% during 2004-05. The
growth of IT sector has been phenomenal. The state leads the IT revolution with
software exports of over US$ 1.6 billion. About 110 new IT companies were
established in the state with an investment of Rs.2000 crores during 2004-05. About 131
biotech companies have also invested about Rs.1000 crores in the state during this
period. About 12,780 small scale industries were also established in the state with
Rs.433.47crores of investment.
83
The State has also registered satisfactory progress with respect to the
indicators of health and quality of life as compared to all India levels. The worth rate
(20.6%) and death rate (7.1%) were also lower as compared to the all India level. The
infant mortality rate was also lower at 50per 1000 while life expectancy at birth was 62.8
years for males and 66.2 years for females. The literacy rate is (66.6%) in 2001 and the
state occupied 8* rank in the country in this regard. Gross enrolment rate at the primary
school level was (98.06%) for boys and (97.98%) for girls. The State has also
implemented Vidya Vikasa, free uniforms and textbooks and mid-day meal
programme in order to enhance the educational status of children.
4.4. Development of Co-operatives in Karnataka State
The cooperatives have existed for more than 100 years in the country. There has
been vertical and horizontal expansion of cooperatives in the country since then. The
British Government enacted the Cooperative Credit Societies Act, 1904 in the country
with a view to safeguard the interest of peasants and artisans from the exploitative
tendencies of the traders who took things for granted. This Act facilitated the
establishment and development of cooperatives in the country. According to the latest
statistics, there are 175 million members, 3,53,000 cooperatives of various types, share
capital of Rs.7000 crore and working capital of Rs. 19000 crore in India. The cooperative
movement has covered almost all villages in the country by 95,200 primary agricultural
cooperatives with about 67% of active involvement of rural households.
Karnataka State is in the forefront of cooperative movement in India.
Krishnaraja Wodeyar-IV was highly instrumental in heralding a cooperative
movement in the State. The State of Mysore formulated Mysore Cooperative Control Act
in 1905 which was more progressive than the national act. This Act facilitated the
establishment of cooperatives in urban and rural areas. The cooperative movement in
Mysore State began with the patronage of the government and gained strength over a
period of time through active participation of people.
In North Karnataka, Siddanagowda Sannaramanagowda Patil established the first
cooperative credit society in Kanaginahal, near Dharwad which was registered by the then
Registrar of Bombay Province Robert Mack Nail. In Mysore region, the first cooperative
society was established in Bangalore in the year 1905. The first urban cooperative bank
was also established in 1907 in Bangalore under the banner of Bangalore Central
Cooperative Bank. The Mysore State Cooperative Bank was established in 1908 in
84
Bangalore. In 1915, the first marketing cooperative society was established in Hubli.
Subsequently, the first primary land development bank was established in Dharwad in the
year 1929.
The early cooperative laws were made by the rulers to facilitate the growth and
development of people-friendly and value-friendly cooperatives in the country.
Prominent among them include-Cooperative Societies Act (1904), Cooperative
Registration Act (1912), Constitutional Amendment (1919) and Cooperative Act
(1959). These acts were also amended from time to time in order to improve the
working conditions, operations management, credit services and allied nation building
activities. The registration of cooperatives was mandatory and that cooperatives had to
function in accordance with the well defined norms and guidelines of the
government.
During 1920-30 the cooperative movement was strengthened in the Bombay-
Karnataka province. Several conferences were held to take stock of the situation and
improve the working conditions of cooperatives in the region. The decade of 1920s
witnessed the establishment of several housing cooperative societies and urban
cooperative banks. The World War - I brought about series of economic constraints such
as shortage of food grains, black marketing of essential commodities, trade monopoly
and so on. The people in general suffered seriously due to non-availability of food and
civil supplies in the State. The State of Mysore established regulated markets, fair price
depots and other agencies with a view to facilitate smooth distribution of food and
civil supplies to the people.
In 1930s the Primary Land Development Banks (PLDBs) were established in the
state of Mysore with a view to facilitate the growth and development of agriculture
and cottage industrial sectors. There were about 3000 cooperative banks in the State of
Mysore with a capital of Rs.3.60 crores. Several multi-purpose cooperatives were
also established in the State during 1949-51 to facilitate the promotion of the economy
of the State. The rulers of Mysore State and Dewans Sir.M.Vishweshwariah and
Sir.Mirza Ismail were mainly responsible for the evolution of cooperative movement
in Karnataka State. After independence, the government took active part in the
cooperative movement by providing financial support, marketing assistance, benefit of
auditing and allied supportive services.
85
The Primary Land Development Banks also played a major role in providing credit
services, fertilizers, seeds, agricultural implements and allied facilities for the progress of
the farmers in the State. Two cooperative commissions were established under the
Chairmanship of Samal Das (1920) and Chandrasekhar Iyer (1935) to examine the
issues concerning the growth and development of cooperative movement in the State. The
Apex Bank, District Central Cooperative Banks and Block Level Primary Land
Development Banks were also established on the basis of the recommendations of these
commissions with a view to liberate the farmers and rural artisans from the draconian
clutches of the money lenders. Since then, the Apex Bank is playing a major role in
providing credit support through district level and block level cooperatives to the
farmers, artisans and other weaker sections of the society to construct houses, develop
agriculture, activate cottage industry and promote rural development.
The State Government has implemented the progressive directions and
measures of the Government of India even though cooperation is the state subject from
the point of view of governance. The Five Year Plans also provided adequate budgetary
provisions for the development of cooperative sector in Karnataka and elsewhere. The
recommendations of Gorwala committee were also implemented by the State
Government. Reorganization of cooperatives, implementation of development
programmes, promotion of agriculture and cottage industries, marketing of agricultural
products, investment in infrastructure development and other progressive measures
were implemented in the State of Mysore.
The Conference of Ministers of Cooperatives (1955) resolved to adopt certain
progressive measures and promote cooperatives as effective instruments of social
justice, economic equity, collective welfare and decentralized development in the
country. The Mysore States wholeheartedly implemented the progressive measures and
prepared grounds for sound and stable cooperative movement in the state. About 400
credit societies, 300 agricultural marketing agencies and 81 marketing cooperative
societies were reorganized and reconstructed by the state government. Expansion of
cooperatives in rural areas and implementation of socio-economic programmes at the
grassroots level were undertaken on a priority basis in the state.
The National Development Council (1958) adopted a new policy on
cooperatives and facilitated the creation of umpteen number of cooperatives all over the
country. It was decided to establish a cooperative in every village with a population
86
of 1000 and provide financial assistance to the farmers and artisans to undertake self-
employment and income generating activities. The Mysore State also adopted these
recommendations and enriched the process of cooperative management. The State
Government provided share capital, subsidy and other facilities to the cooperatives in
order to improve their financial status and working conditions. In 1961, the number of
primary land development banks and cooperatives increased to 118. The
recommendations of Nateshan Committee (1961) and Dantewala Committee (1964)
provided new dimension to the management of cooperatives in the country. The Five Year
Plan - HI also paved the way for greater development of cooperatives all over the
country. The subsequent Five Year Plans also earmarked sizeable funds for the
development of cooperative sector in the country. The cooperatives contributed
significantly toward achieving the goal of green revolution in the country. Expansion of
irrigation, electrification, infrastructural facilities, adoption of agricultural technologies,
availability of loan and subsidy and other progressive measures were supported by the
cooperatives. About 8474 primary land development banks were established in Karnataka
by the year 1972. About 46 crores of rupees were invested on cooperative credit
management activities. Small farmers and artisans were the major beneficiaries of the
cooperative movement in Mysore State. The nationalized banks also played a
supportive role in the processes of agriculture development and promotion of small scale
and cottage industries.
The decade of 1970s is known as the period of organized development of
cooperatives in the State. By 1972, there were 650 milk producers cooperatives, 848 food
grains cooperatives, 59 lift irrigation cooperatives, 125 fishermen's cooperatives, 144
labour contract cooperatives, 38 forest workers contract cooperatives, 29 transport
cooperatives, 25 women's cooperatives in the state. The government also provided
necessary infrastructural facilities, manpower, funds and provisions for the improvement
of cooperative education and training in the state in accordance with the guidelines of
Fiver Year Plan - V. A confederation of cooperatives was established in the state. The
office-bearers, members, officials and other activists of cooperative movement were also
given training facilities about the art and crafts of cooperative management.
The Government of India enacted a Mutli-State Cooperative Act, 1992 which is
applicable to whole of India with a view to ensure meaningful governmental
interaction, effective management of cooperatives and empower the women and
87
weaker sections of the society. Kurien, Dharia and L.CJain are regarded in the
country as the trio of cooperative movement in the post-independence era. A separate
Cooperative Initiative Panel was constituted by the government in order to facilitate the
progress of cooperative movement in the age of economic liberalization. The Central
Government also brought about several amendments to the existing Mutli-State
Cooperative Act, 1992 with a view to enlist active participation of various stakeholders
in the process of cooperative movement in the country. The amalgamation of
cooperatives was brought about by the Government of the Karnataka and the number of
cooperatives in the allied sector rose to 7703 in the year 1998.
The Government of Karnataka established a separate department to manage the
affairs of cooperatives. The Registrar of Cooperatives is the bureaucratic head of the
department who controls and guides the activities through out the state. Each revenue
division has a Joint Registrar who supervises the cooperative activities in the revenue
division concerned. There are Deputy Registrars, Assistant Registrars, Cooperative
Development Officers and Cooperative Extension Officers who work on day to day basis
in accordance with the norms and guidelines of the Cooperation Department. There were
three tier cooperative systems in Karnataka State namely, Primary Land Development
Banks at the grassroots level, District Central Cooperative Banks at the district level
and State Cooperative Bank at the state level. By 1998, about 4362 primary cooperatives,
19 district cooperatives and one central cooperative bank functioned actively in the
state. Each cooperative society served about 6 villages in the rural areas and catered to
the financial needs of the farmers, artisans and other weaker sections of the society. The
Karnataka State Cooperative Agriculture and Rural Development Bank controlled and
supervised the activities of about 177 cooperative societies at the grassroots level.
The share capital of cooperatives rose to 12.331 lakh in the state which
comprised share capital, statutory reception and other reception. The own share
capital of primary cooperatives rose to 34965 lakhs during 1997-98. The DCCBs were
able to mobilize Rs.28763 lakh as the own share capital. The deposit mobilization also
displayed considerable progress in respect of KSCB (100581 lakh), DCCBs (220212
lakh) and PACs (24568 lakh) in the state. The disbursement of loan also displayed
considerable progress in respect of KSCB (50653 lakh), DCCBs (63054 lakh) and
PACs (63341 lakh) in the state. The saving position also displayed satisfactory
88
progress in respect of KSCB (71759 lakh), DCCBs (84558 lakh) and PACs (12281
lakh) in the state.
There has been a spectacular expansion of cooperatives in the state during 1905-
2005 in terms of number of societies, membership, share capital and working capital.
The quantitative expansion of cooperative movement was brought about mainly due to
the state patronage. According to Khusro Committee (1989), "The state has gained
considerable financial stake in the higher level organizations through participation in the
equity and in many other ways, hi turn, this has been made use of as an alibi for gaining
control over the cooperatives. Irrespective of the political persuasions of the party
in power, in the last two decades it has been a story of collective super sessions of
co-operatives at all levels and in place of democratically, elected management,
government officials, or non-officials nominated by the government are manning
them".
The cooperatives have diversified their activities over the years in the state. At
present, there are various types of cooperatives which function both in urban and rural
areas. However, credit societies still dominate the cooperative scenario. During 1994-95,
there were 4,350 Primary Agricultural Credit Societies, 7,081 Milk Consumers Societies
and Unions, 1,768 Consumers Cooperatives, 1,734 Employees Credit Societies, 1,643
Housing Cooperatives, 1,401 Industrial Cooperatives in the State of Karnataka. Besides,
there are cooperatives belonging to the areas of marketing (184), sugar factories (26),
processing (41), farming (256), irrigation (628), live stock (74), forest labour (50),
transport (29), women (660), students (310) and electricity (11). There are other types of
cooperatives also like, industrial estates, spinning mills, non-credit, special commodity
marketing etc. Which are functioning in the state.
There is consistent growth in terms of cooperative societies, membership, share
capital and working capital in Karnataka State since inception. The cooperatives have
grown enormously in the State and provided constructive credit support to various
developmental endeavours. The beneficiaries of these credit services primarily
included the marginalized sections of the society in rural and urban areas.
There are considerable number of cooperatives in Karnataka State which have
given credit services to large number of marginalized sections of the society. More than
2 crore people have enrolled themselves as the members of various cooperative societies.
The working capital exceeds 27,000 crores which indicate the stable and sound financial
89
status of the cooperatives. The deposit mobilization and profit accrued by the societies are
also commendable statistically and otherwise. There are few societies which are running
under loss conditions mainly due to lack of enlightened leadership and committed
members.
The women cooperatives have also grown over a period of time in Karnataka
State. These cooperatives have facilitated the empowerment of women by providing
credit services, self-employment opportunities, income generating opportunities and so
on. These societies have also enabled the women office bearers and members to gain
leadership qualities and achieve better social status.
The women cooperatives have come into existence in large number in
Karnataka State. There are a considerable number of women cooperative leaders, office
bearers and functionaries who are playing a major role in the process of empowerment
of women in Karnataka State. The members are also receiving credit support, skill
development, professional training and leadership opportunities which have enhanced the
status of women in the state socially, economically and politically.
There are Karnataka State Cooperative Apex Bank (KSCAB), 21 District
Central Cooperative Banks (DCCBs) and 4400 Primary Agricultural Cooperative
Societies (PCAS) in Karnataka State which are actively involved in extending credit
support to various beneficiaries in the fields of agriculture, cottage industries and small
business enterprises. These banks are providing short term and mid term credit facilities
to the people who are not served by major commercial banks for obvious reasons. Even
now, cooperatives are the main source of financial support to the farmers, artisans,
women and weaker sections in the rural and urban areas. This sector as also offered
employment opportunities and self-employment opportunities to lakhs of people. There is
scope for diversification of loan portfolio under non-farm sector activities, increasing
financial support to SHGs, mobilizing low cost deposits from government departments
and increasing borrowing membership by adding new and non-defaulting members.
The Central and State Governments have constituted several task forces namely-
G.N.L.Srivatsava Committee (1996), Jagadish Kapoor Task Force (2000), Y.K.Patil
Committee (2001) and Vaidyanathan Committee (2005) to examine the merits and de-
merits of cooperative movement and suggest appropriate measures for the rejuvenation of
cooperatives in the country. Karnataka State has also implemented the progressive
measures suggested by various committees from time to time in order to promote
90
cooperative sector. The State has also enacted Cooperative Harmony Act, 2000 in order
to facilitate the development of cooperative sector without any governmental pressures.
The Department of Cooperation is a vital department of the Government of
Karnataka. The department functions in close cooperation and coordination with
various other departments which are responsible for the implementation of social and
economic development schemes. The department of cooperation is headed by a
Minister of cabinet rank. The Secretary to government, department of cooperation
supervises the works of cooperation department, cooperative audit, agricultural
marketing and warehousing corporation. The department is responsible for policy
making, planning, budgeting and implementation of programmes. There are several
functionaries who work at state head quarters, regional offices, district offices, sub-
divisional offices and other places.
The primary credit cooperative societies cater to the needs of fanners, artisans and
other sections of society. The various cooperative institutions are categorized into five
sectors namely - cooperative credit sector, cooperative marketing sector, cooperative
processing sector, milk procuring processing and marketing institutions and cooperative
service sector. The Integrated Cooperative Development Project is launched by the
department of cooperation which is sponsored by the government of India. The
government has implemented the scheme of providing agricultural loans to the farmers at
the rate of 6% through 177 Primary Cooperative Agricultural and Rural Development
Banks in the state.
Karnataka State has completed a fruitful century of cooperative movement in the
year 2005. Statistics reveal that cooperative movement has achieved steady progress in
Karnataka state. The growth rate of number of societies and membership is satisfactory.
There is a positive growth rate for membership, share capital, government share capital
and also the total working capital of cooperatives. Experts have also noted that the
performance of cooperative movement in Karnataka is far better than the growth rate of
all India level.
The Self-Help Groups of Kamataka are also marching towards progress on the well
established principles and practices of cooperatives. The number of cooperatives is
increasing everyday because of its power to sustain the progress of women and weaker
sections of the societies. In reality, the cooperatives are actively involved in almost all
areas of socio-economic activities which are contributing a lot to community development
91
at grassroots level. The strategic advantages which cooperatives enjoy as compared to
other commercial organizations in understanding the dynamism and vibrancy of the
movement can be fully utilized only if the cooperatives have strong management
strategies and people-friendly delivery system which reflect the uniqueness of their
culture.
The importance of the concept of empowerment of women and weaker sections in
the case of membership-based organizations like cooperatives is immense in a developing
State like Kamataka. Cooperatives are now considered strong vehicles for empowerment
which is a big paradigm shift. The cooperatives have been undoubtedly empowering the
people by eliminating poverty, generating self-employment opportunities, creating income
generating opportunities and enrichment of social standards. The cooperatives are actively
involved in the empowerment of marginalized sections of society by improving
effectiveness of their intervention in the market economy. Creating an empowering
community culture is the greatest contribution of the cooperatives of today as compared to
other organizations.
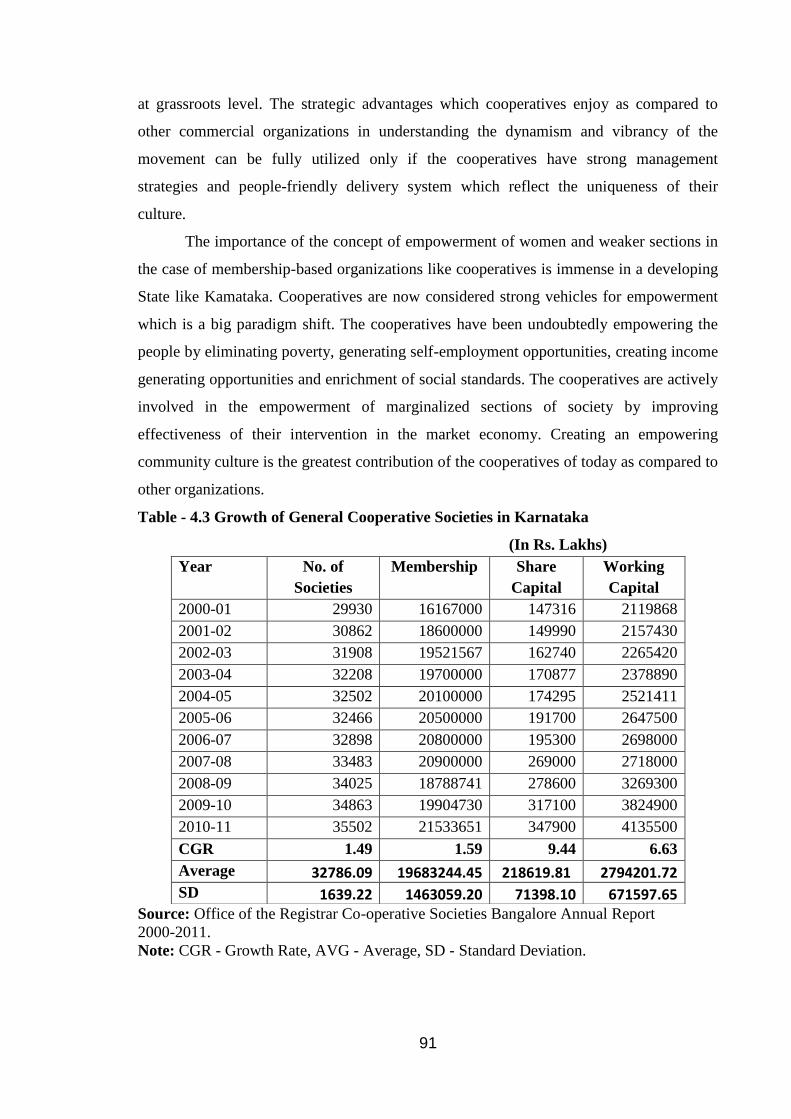
Table - 4.3 Growth of General Cooperative Societies in Karnataka
(In Rs. Lakhs)
Source: Office of the Registrar Co-operative Societies Bangalore Annual Report
2000-2011.
Note: CGR - Growth Rate, AVG - Average, SD - Standard Deviation.
Year No. of
Societies
Membership Share
Capital
Working
Capital
2000-01 29930 16167000 147316 2119868
2001-02 30862 18600000 149990 2157430
2002-03 31908 19521567 162740 2265420
2003-04 32208 19700000 170877 2378890
2004-05 32502 20100000 174295 2521411
2005-06 32466 20500000 191700 2647500
2006-07 32898 20800000 195300 2698000
2007-08 33483 20900000 269000 2718000
2008-09 34025 18788741 278600 3269300
2009-10 34863 19904730 317100 3824900
2010-11 35502 21533651 347900 4135500
CGR 1.49 1.59 9.44 6.63
Average 32786.09 19683244.45 218619.81 2794201.72 SD 1639.22 1463059.20 71398.10 671597.65
92
Table 4.3 Shows performance of General cooperative societies in Karnataka. The
data from 1993-94 till 1999-2000 was not available continuously. Therefore the
continuous data which was available was from 2000-01 till 2011-12 were utilized. The
Compound Growth Rate for No. of Societies was found to be 1.49. Average and Standard
Deviation values were 32786.09 and 1639.22 respectively. The membership Compound
Growth Rate was found to be 1.59. Average and Standard Deviation values were
19683244.45 and 1463059.20 respectively.
For the share capital Compound Growth Rate was found to be 9.44. Average and
Standard Deviation values were 218619.81 and 71398.10. The Compound Growth Rate
for the working capital was found to be 6.63. Average and Standard Deviation values
were 2794201.72 and 671597.65 respectively.
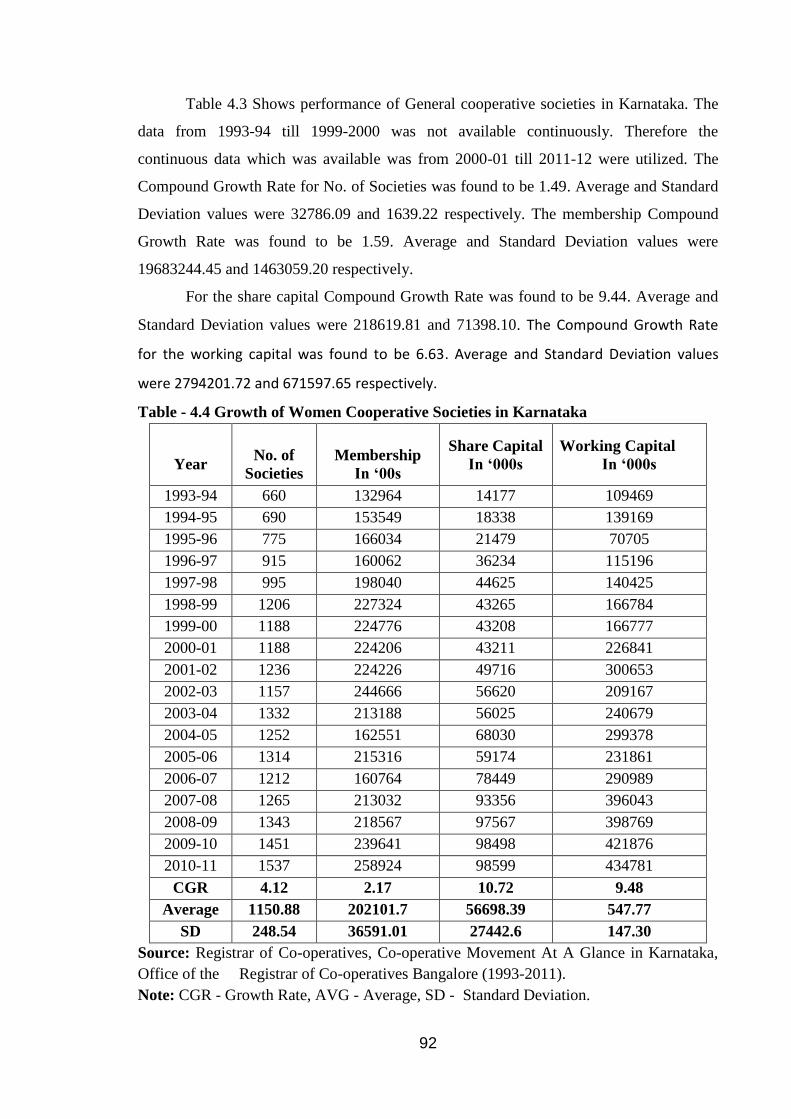
Table - 4.4 Growth of Women Cooperative Societies in Karnataka
Year
No. of
Societies
Membership
In ‘00s
Share Capital
In ‘000s
Working Capital
In ‘000s
1993-94 660 132964 14177 109469
1994-95 690 153549 18338 139169
1995-96 775 166034 21479 70705
1996-97 915 160062 36234 115196
1997-98 995 198040 44625 140425
1998-99 1206 227324 43265 166784
1999-00 1188 224776 43208 166777
2000-01 1188 224206 43211 226841
2001-02 1236 224226 49716 300653
2002-03 1157 244666 56620 209167
2003-04 1332 213188 56025 240679
2004-05 1252 162551 68030 299378
2005-06 1314 215316 59174 231861
2006-07 1212 160764 78449 290989
2007-08 1265 213032 93356 396043
2008-09 1343 218567 97567 398769
2009-10 1451 239641 98498 421876
2010-11 1537 258924 98599 434781
CGR 4.12 2.17 10.72 9.48
Average 1150.88 202101.7 56698.39 547.77
SD 248.54 36591.01 27442.6 147.30
Source: Registrar of Co-operatives, Co-operative Movement At A Glance in Karnataka,
Office of the Registrar of Co-operatives Bangalore (1993-2011).
Note: CGR - Growth Rate, AVG - Average, SD - Standard Deviation.
93
Table 4.4 analyses the Growth of Women Cooperative Societies in Karnataka.
Relating to No. of Societies Compound Growth Rate was found to be 4.12. Average and
Standard Deviation values were 1150.88 and 248.54 respectively. The Compound Growth
Rate for membership was found to be 2.17. Average and Standard Deviation values were
202101.7 and 36591.01 respectively.
For the Share Capital, Compound Growth Rate was found to be 10.72 Average
and Standard Deviation values were 56698.39 and 27442.6. The working capital
Compound Growth Rate was found to be 9.48. Average and Standard Deviation values
were 547.77and 147.30 respectively.
On the basis of the results obtained,the percent of women cooperative societies to
gereral cooperative societies were calculated for No. of societies, membership, share
capital and working capital are respectively they are 2.10, 0.99, 28.26 and 0.02 percent.
The result indicates that this is better representation for women in terms of No. of societies
and share capital in Karnataka.
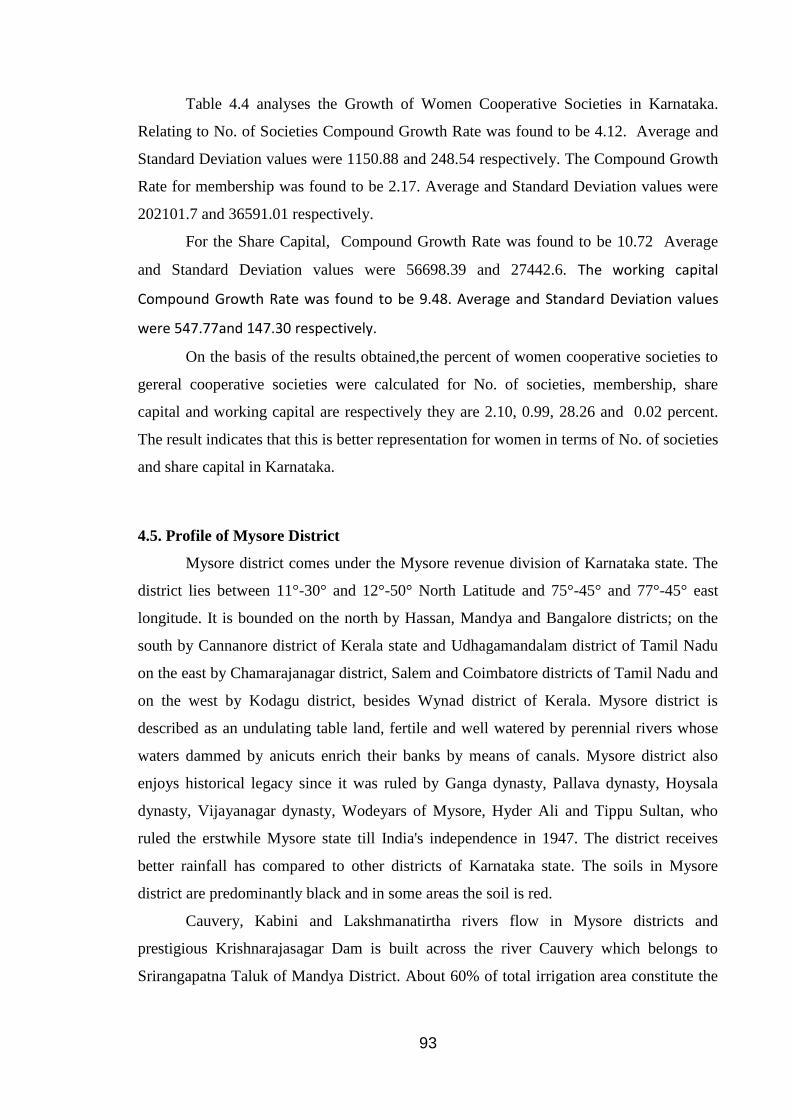
4.5. Profile of Mysore District
Mysore district comes under the Mysore revenue division of Karnataka state. The
district lies between 11°-30° and 12°-50° North Latitude and 75°-45° and 77°-45° east
longitude. It is bounded on the north by Hassan, Mandya and Bangalore districts; on the
south by Cannanore district of Kerala state and Udhagamandalam district of Tamil Nadu
on the east by Chamarajanagar district, Salem and Coimbatore districts of Tamil Nadu and
on the west by Kodagu district, besides Wynad district of Kerala. Mysore district is
described as an undulating table land, fertile and well watered by perennial rivers whose
waters dammed by anicuts enrich their banks by means of canals. Mysore district also
enjoys historical legacy since it was ruled by Ganga dynasty, Pallava dynasty, Hoysala
dynasty, Vijayanagar dynasty, Wodeyars of Mysore, Hyder Ali and Tippu Sultan, who
ruled the erstwhile Mysore state till India's independence in 1947. The district receives
better rainfall has compared to other districts of Karnataka state. The soils in Mysore
district are predominantly black and in some areas the soil is red.
Cauvery, Kabini and Lakshmanatirtha rivers flow in Mysore districts and
prestigious Krishnarajasagar Dam is built across the river Cauvery which belongs to
Srirangapatna Taluk of Mandya District. About 60% of total irrigation area constitute the
94
canal irrigation, 21% of the irrigated land constitutes the well irrigation and the remaining
land is cultivated through other sources. The water table is very high in the district and
borewells get sufficient water for drinking and irrigation purposes. The district also enjoys
better mineral resources, forest resources. The principal sources of income generation
include agriculture, sericulture, floriculture, dairying, poultry and so on. The economy of
Mysore district is predominantly agriculture based.
Mysore district has better road and railway networks. These roads consist of state
highways, major district roads, village roads, forest roads, panchayat roads etc. The road
length in the district is 10,032 kms. The railway line is consisting of about 120 kms in the
district. The district is also endowed with good communication network which has
facilitated economic development of the district. There are industrial estates, banking
institutions, educational institutions, health institutions and so on in the district. The
district also has 3 prestigious universities namely -University of Mysore, Karnataka State
Open University and Gangubai Hanagal University of Music and Dance. There are about
12 major hospitals, 175 primary health centres, 60 primary health units and 15
dispensaries which provide basic health facilities to the people of the district.
4.6. Cooperatives in Mysore District
Mysore district is also well known in Karnataka state for cooperative movement.
The Princely State of Mysore had the privilege of starting economically viable
cooperatives under the dynamic leadership of Wodeyars. In the decade of 1950s and 60s
cooperatives were promoted by the rulers as important sources of credit service to the
rural people in the post-independence era. Consumer cooperatives, diary
cooperatives, urban cooperatives, multipurpose women cooperatives were established in
the district owing to the initiative taken by the founders of cooperative movement in the
district In the decades of 1980 and 1990 women cooperatives, multipurpose women
cooperatives, women cooperative banks and other cooperatives were established in order
to provide financial support for the economic empowerment of women in the district.
The cooperative movement in Mysore district has practically embraced all spheres
of human life and entire district. The cooperatives have become very active and useful
sources of credit service in urban and rural areas of the district. The Women Multi
Purpose Cooperative Societies (WMPCS) were developed in Mysore district on a priority
basis by the administrators.
95
The above table presents the performance of cooperative society in Mysore
district. The data reveal that a majority of cooperatives in Mysore district are managed
under profit condition during 1991 - 2010. A majority of the cooperatives (71.26%) have
gained profit while a minority of the cooperatives (22.86%) has experienced loss
financially. However a meager minority of cooperatives (5.88%) have experienced neither
profit nor loss financially and otherwise in Mysore district. This factor motivated the
researcher to select Mysore district for an intensive empirical study.
The women cooperatives have grown over a period of time in India, Karnataka
state and Mysore district. There are 576310 general cooperatives in the country. The share
of Karnataka state is 32562 and Mysore district is 1518 cooperatives respectively. The
share of Karnataka state is around 5.65% in the national level while the share of Mysore
district is around 4.66% at the regional level respectively. There are 9670 women
cooperatives in the country. The share of Kamataka state is 986 and Mysore district is 72
respectively. The share of Karnataka state regarding the women cooperatives is around
10.19% at the national level while the share of Mysore district is 7.30% at the regional
level respectively. Collectively speaking, the share of Karnataka state in general
cooperatives and women cooperatives is 8.06% at the national level while the share of
Mysore district is around 3.37% respectively in this regard. The data revealed that Mysore
district has made its presence felt in the state of Karnataka from the points of view of
development of general cooperatives and women cooperatives over a period of time.
The above table presents the growth rate of Multi Purpose Women Cooperative
Societies in Mysore District over period of time. The data reveals that the growth rate of
number of societies, membership, share capital, government share capital and also the
total working capital have been growing consistently in Mysore district. There is notable
progress achieved by the women cooperatives which serve different purposes of progress
of women in Mysore district.
The data revealed that Hunsur taluk is marching towards progress regarding
cooperative movement. The number of cooperatives has increased in the block over a
period of time. A good number of cooperatives are managed under profit and no loss
conditions. The membership position in the cooperatives is also increasing steadily. The
number of loss-oriented cooperatives need to be checked by the officials and organizers of
cooperatives in the Hunsur taluk.
96
The data revealed that H.D.Kote taluk is marching towards progress regarding
cooperative movement. The number of cooperatives has increased in the block over a
period of time like Hunsur taluk. A good number of cooperatives are managed under profit
and no loss conditions. The membership position in the cooperatives is also increasing
steadily in the block concerned. The number of loss-oriented cooperatives need to be
checked by the officials and organizers of cooperatives in the H.D.Kote taluk.The growth
of general cooperative societies in India as follows.
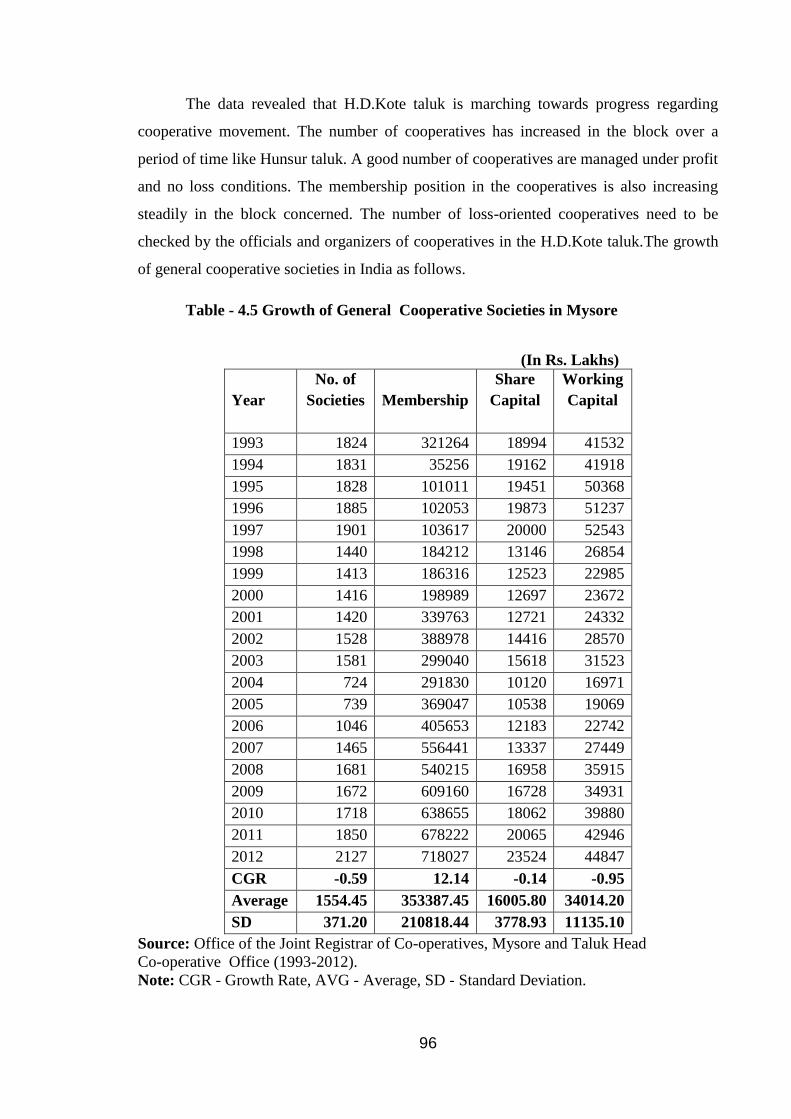
Table - 4.5 Growth of General Cooperative Societies in Mysore
(In Rs. Lakhs)
Year
No. of
Societies
Membership
Share
Capital
Working
Capital
1993 1824 321264 18994 41532
1994 1831 35256 19162 41918
1995 1828 101011 19451 50368
1996 1885 102053 19873 51237
1997 1901 103617 20000 52543
1998 1440 184212 13146 26854
1999 1413 186316 12523 22985
2000 1416 198989 12697 23672
2001 1420 339763 12721 24332
2002 1528 388978 14416 28570
2003 1581 299040 15618 31523
2004 724 291830 10120 16971
2005 739 369047 10538 19069
2006 1046 405653 12183 22742
2007 1465 556441 13337 27449
2008 1681 540215 16958 35915
2009 1672 609160 16728 34931
2010 1718 638655 18062 39880
2011 1850 678222 20065 42946
2012 2127 718027 23524 44847
CGR -0.59 12.14 -0.14 -0.95
Average 1554.45 353387.45 16005.80 34014.20
SD 371.20 210818.44 3778.93 11135.10
Source: Office of the Joint Registrar of Co-operatives, Mysore and Taluk Head
Co-operative Office (1993-2012).
Note: CGR - Growth Rate, AVG - Average, SD - Standard Deviation.
97
Table 4.5 Shows the performance of General cooperative societies in Mysore.
Relating to the No. of societies, Compound Growth Rate was found to be -0.59. Average
and Standard Deviation values were 1554.45 and 371.20 respectively. For the
membership, Compound Growth Rate was found to be 12.14. Average and Standard
Deviation values were 353387.45 and 210818.44 respectively.
The Share Capital has the Compound Growth Rate -0.14. Average and Standard
Deviation values were 16005.80 and 3778.93 respectively. For the Working Capital,
Compound Growth Rate was found to be -0.95. Average and Standard Deviation values
were 34014.20 and 11135.10 respectively.
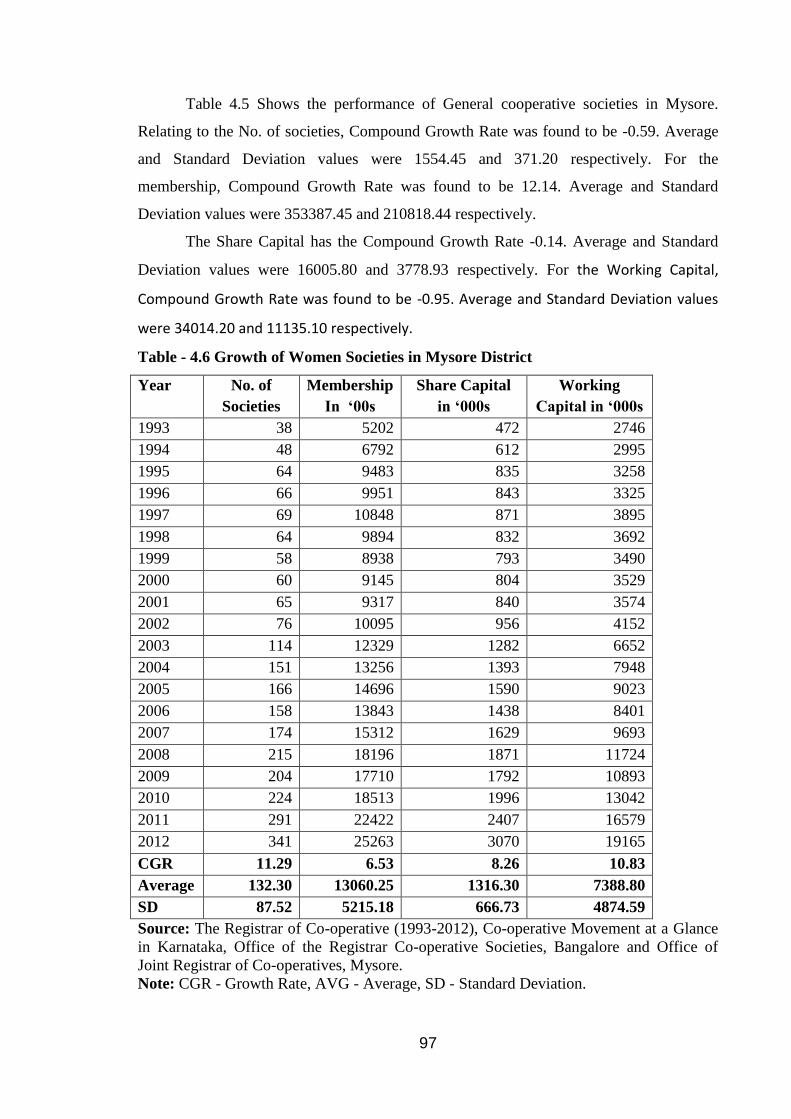
Table - 4.6 Growth of Women Societies in Mysore District
Year No. of
Societies
Membership
In ‘00s
Share Capital
in ‘000s
Working
Capital in ‘000s
1993 38 5202 472 2746
1994 48 6792 612 2995
1995 64 9483 835 3258
1996 66 9951 843 3325
1997 69 10848 871 3895
1998 64 9894 832 3692
1999 58 8938 793 3490
2000 60 9145 804 3529
2001 65 9317 840 3574
2002 76 10095 956 4152
2003 114 12329 1282 6652
2004 151 13256 1393 7948
2005 166 14696 1590 9023
2006 158 13843 1438 8401
2007 174 15312 1629 9693
2008 215 18196 1871 11724
2009 204 17710 1792 10893
2010 224 18513 1996 13042
2011 291 22422 2407 16579
2012 341 25263 3070 19165
CGR 11.29 6.53 8.26 10.83
Average 132.30 13060.25 1316.30 7388.80
SD 87.52 5215.18 666.73 4874.59
Source: The Registrar of Co-operative (1993-2012), Co-operative Movement at a Glance
in Karnataka, Office of the Registrar Co-operative Societies, Bangalore and Office of
Joint Registrar of Co-operatives, Mysore.
Note: CGR - Growth Rate, AVG - Average, SD - Standard Deviation.
98
The table 4.6 provides the Growth of Women Cooperative Societies in Mysore
District. The Compound Growth Rate for the No. of Societies was found to be 11.29.
Average and Standard Deviation values were 132.30 and 87.52 respectively. For the
membership, Compound Growth Rate was found to be 6.53. The average and Standard
Deviation values were 13060.25 and 5215.18 respectively.
The Share Capital has the Compound Growth Rate of 8.26. Average and Standard
Deviation values were 1316.30 and 666.73 respectively. The Compound Growth Rate for
the working capital was found to be 10.83. Average and Standard Deviation values were
7388.80 and 4874.59 respectively.
On the basis of the results obtained, the percent of women cooperative societies to
gereral cooperative societies were calculated for No. of societies, membership, share
capital and working capital are respectively 8.51, 3.69, 8.22 and 21.72 percent. The result
indicates that there is better representation for women in terms of No. of societies and
working capital in Mysore district.
Taluk Wise General Cooperative Societies
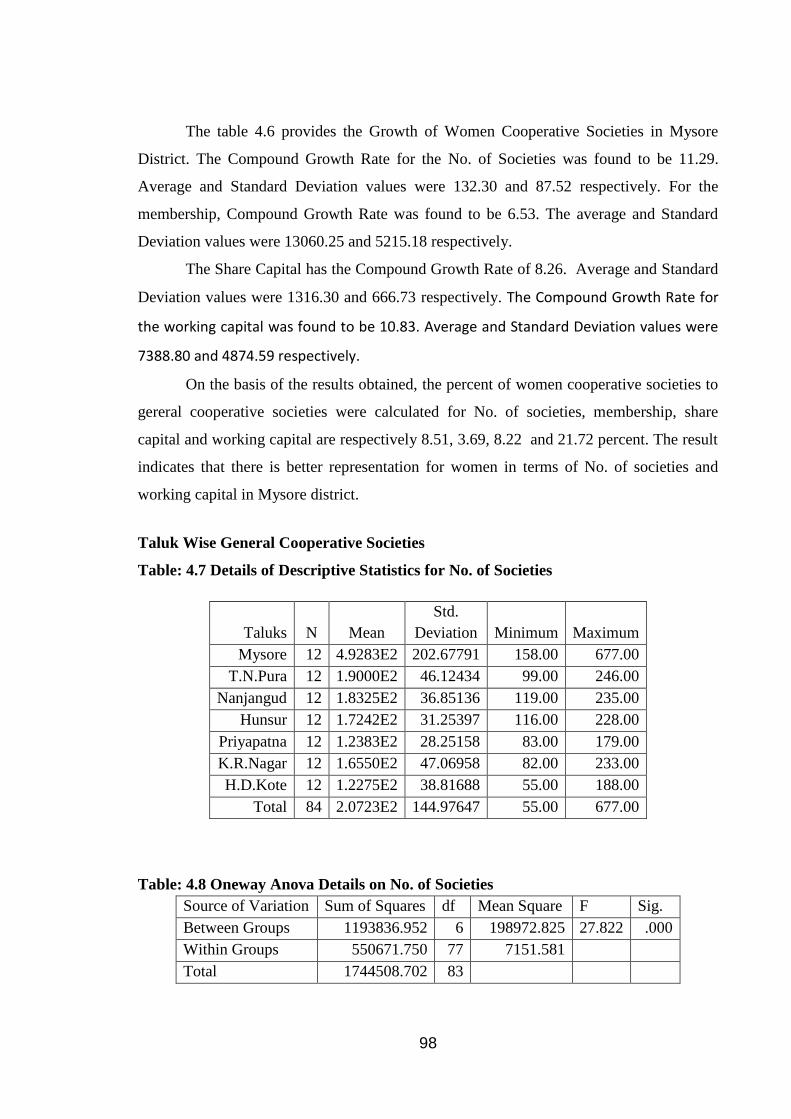
Table: 4.7 Details of Descriptive Statistics for No. of Societies
Taluks
N
Mean
Std.
Deviation
Minimum
Maximum
Mysore 12 4.9283E2 202.67791 158.00 677.00
T.N.Pura 12 1.9000E2 46.12434 99.00 246.00
Nanjangud 12 1.8325E2 36.85136 119.00 235.00
Hunsur 12 1.7242E2 31.25397 116.00 228.00
Priyapatna 12 1.2383E2 28.25158 83.00 179.00
K.R.Nagar 12 1.6550E2 47.06958 82.00 233.00
H.D.Kote 12 1.2275E2 38.81688 55.00 188.00
Total 84 2.0723E2 144.97647 55.00 677.00
Table: 4.8 Oneway Anova Details on No. of Societies
Source of Variation Sum of Squares df Mean Square F Sig.
Between Groups 1193836.952 6 198972.825 27.822 .000
Within Groups 550671.750 77 7151.581
Total 1744508.702 83
99
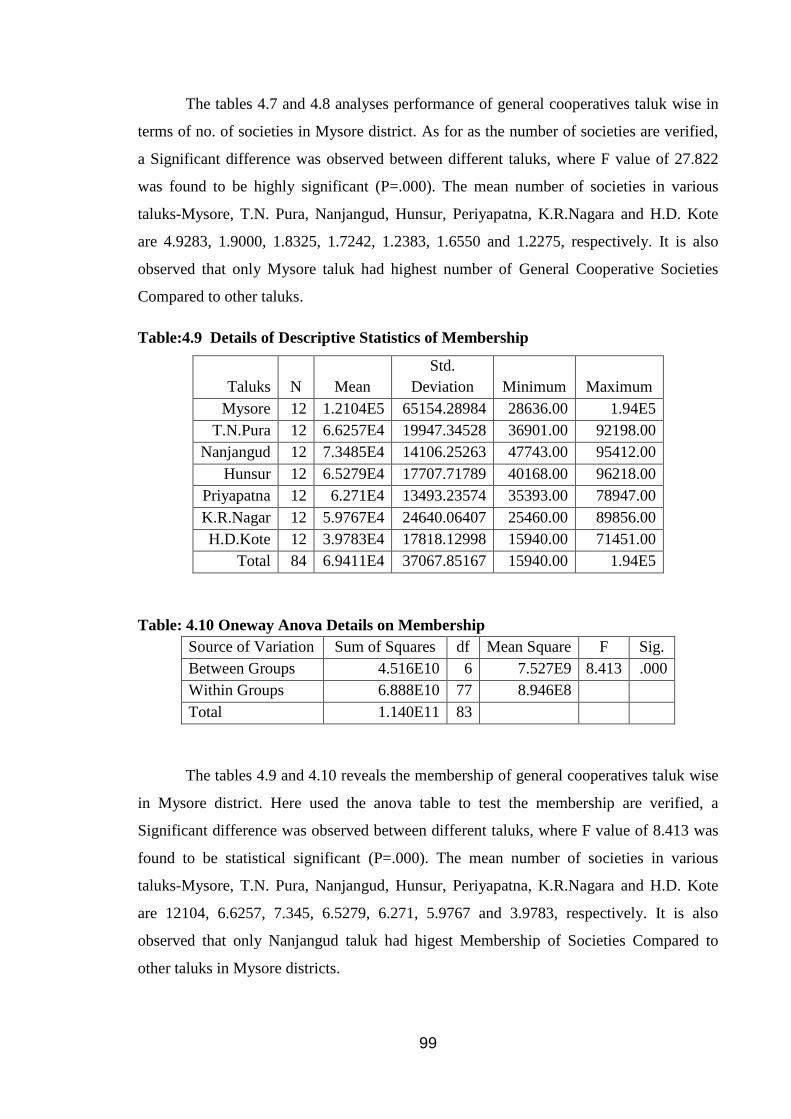
The tables 4.7 and 4.8 analyses performance of general cooperatives taluk wise in
terms of no. of societies in Mysore district. As for as the number of societies are verified,
a Significant difference was observed between different taluks, where F value of 27.822
was found to be highly significant (P=.000). The mean number of societies in various
taluks-Mysore, T.N. Pura, Nanjangud, Hunsur, Periyapatna, K.R.Nagara and H.D. Kote
are 4.9283, 1.9000, 1.8325, 1.7242, 1.2383, 1.6550 and 1.2275, respectively. It is also
observed that only Mysore taluk had highest number of General Cooperative Societies
Compared to other taluks.
Table:4.9 Details of Descriptive Statistics of Membership
Taluks
N
Mean
Std.
Deviation
Minimum
Maximum
Mysore 12 1.2104E5 65154.28984 28636.00 1.94E5
T.N.Pura 12 6.6257E4 19947.34528 36901.00 92198.00
Nanjangud 12 7.3485E4 14106.25263 47743.00 95412.00
Hunsur 12 6.5279E4 17707.71789 40168.00 96218.00
Priyapatna 12 6.271E4 13493.23574 35393.00 78947.00
K.R.Nagar 12 5.9767E4 24640.06407 25460.00 89856.00
H.D.Kote 12 3.9783E4 17818.12998 15940.00 71451.00
Total 84 6.9411E4 37067.85167 15940.00 1.94E5
Table: 4.10 Oneway Anova Details on Membership
Source of Variation Sum of Squares df Mean Square F Sig.
Between Groups 4.516E10 6 7.527E9 8.413 .000
Within Groups 6.888E10 77 8.946E8
Total 1.140E11 83
The tables 4.9 and 4.10 reveals the membership of general cooperatives taluk wise
in Mysore district. Here used the anova table to test the membership are verified, a
Significant difference was observed between different taluks, where F value of 8.413 was
found to be statistical significant (P=.000). The mean number of societies in various
taluks-Mysore, T.N. Pura, Nanjangud, Hunsur, Periyapatna, K.R.Nagara and H.D. Kote
are 12104, 6.6257, 7.345, 6.5279, 6.271, 5.9767 and 3.9783, respectively. It is also
observed that only Nanjangud taluk had higest Membership of Societies Compared to
other taluks in Mysore districts.
100
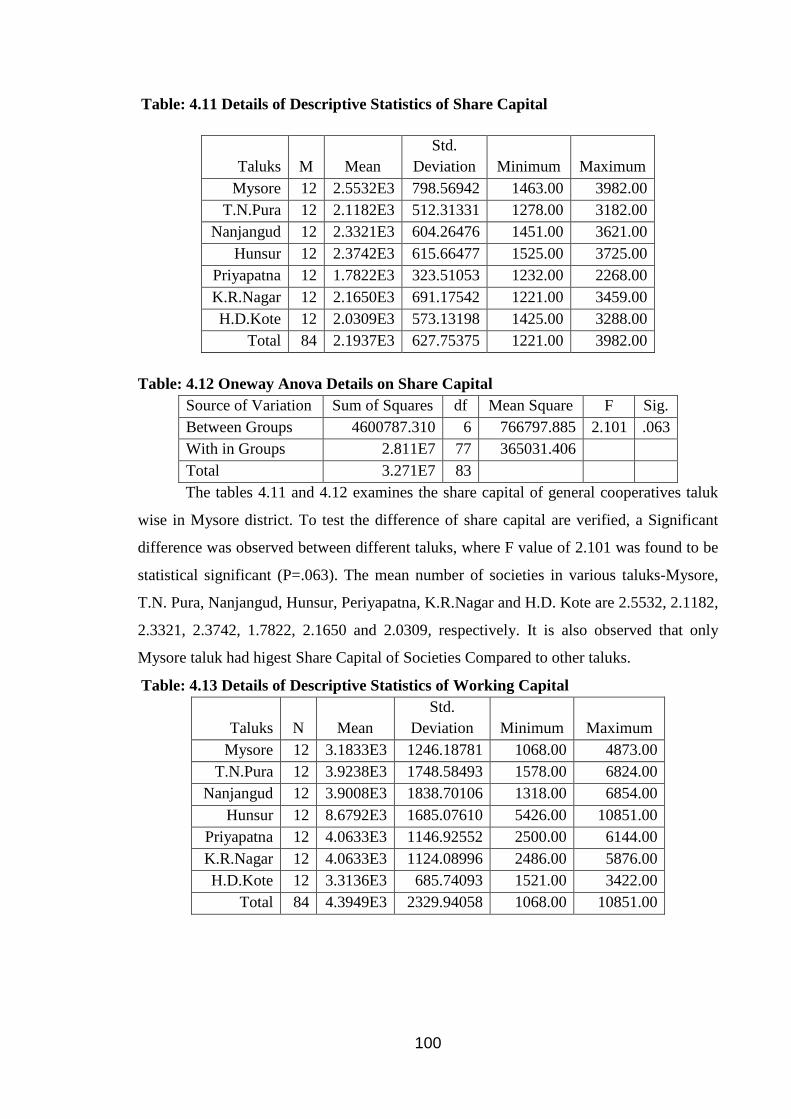
Table: 4.11 Details of Descriptive Statistics of Share Capital
Taluks
M
Mean
Std.
Deviation
Minimum
Maximum
Mysore 12 2.5532E3 798.56942 1463.00 3982.00
T.N.Pura 12 2.1182E3 512.31331 1278.00 3182.00
Nanjangud 12 2.3321E3 604.26476 1451.00 3621.00
Hunsur 12 2.3742E3 615.66477 1525.00 3725.00
Priyapatna 12 1.7822E3 323.51053 1232.00 2268.00
K.R.Nagar 12 2.1650E3 691.17542 1221.00 3459.00
H.D.Kote 12 2.0309E3 573.13198 1425.00 3288.00
Total 84 2.1937E3 627.75375 1221.00 3982.00
Table: 4.12 Oneway Anova Details on Share Capital
Source of Variation Sum of Squares df Mean Square F Sig.
Between Groups 4600787.310 6 766797.885 2.101 .063
With in Groups 2.811E7 77 365031.406
Total 3.271E7 83
The tables 4.11 and 4.12 examines the share capital of general cooperatives taluk
wise in Mysore district. To test the difference of share capital are verified, a Significant
difference was observed between different taluks, where F value of 2.101 was found to be
statistical significant (P=.063). The mean number of societies in various taluks-Mysore,
T.N. Pura, Nanjangud, Hunsur, Periyapatna, K.R.Nagar and H.D. Kote are 2.5532, 2.1182,
2.3321, 2.3742, 1.7822, 2.1650 and 2.0309, respectively. It is also observed that only
Mysore taluk had higest Share Capital of Societies Compared to other taluks.
Table: 4.13 Details of Descriptive Statistics of Working Capital
Taluks
N
Mean
Std.
Deviation
Minimum
Maximum
Mysore 12 3.1833E3 1246.18781 1068.00 4873.00
T.N.Pura 12 3.9238E3 1748.58493 1578.00 6824.00
Nanjangud 12 3.9008E3 1838.70106 1318.00 6854.00
Hunsur 12 8.6792E3 1685.07610 5426.00 10851.00
Priyapatna 12 4.0633E3 1146.92552 2500.00 6144.00
K.R.Nagar 12 4.0633E3 1124.08996 2486.00 5876.00
H.D.Kote 12 3.3136E3 685.74093 1521.00 3422.00
Total 84 4.3949E3 2329.94058 1068.00 10851.00
101
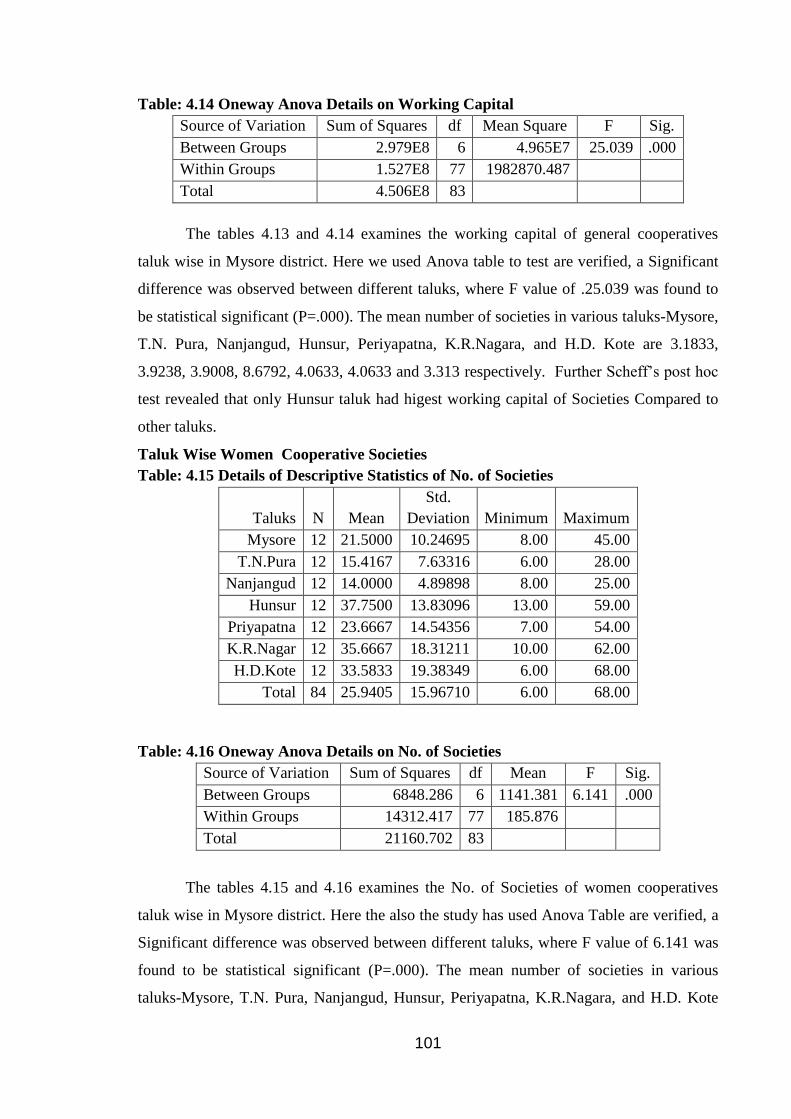
Table: 4.14 Oneway Anova Details on Working Capital
Source of Variation Sum of Squares df Mean Square F Sig.
Between Groups 2.979E8 6 4.965E7 25.039 .000
Within Groups 1.527E8 77 1982870.487
Total 4.506E8 83
The tables 4.13 and 4.14 examines the working capital of general cooperatives
taluk wise in Mysore district. Here we used Anova table to test are verified, a Significant
difference was observed between different taluks, where F value of .25.039 was found to
be statistical significant (P=.000). The mean number of societies in various taluks-Mysore,
T.N. Pura, Nanjangud, Hunsur, Periyapatna, K.R.Nagara, and H.D. Kote are 3.1833,
3.9238, 3.9008, 8.6792, 4.0633, 4.0633 and 3.313 respectively. Further Scheff’s post hoc
test revealed that only Hunsur taluk had higest working capital of Societies Compared to
other taluks.
Taluk Wise Women Cooperative Societies
Table: 4.15 Details of Descriptive Statistics of No. of Societies
Taluks
N
Mean
Std.
Deviation
Minimum
Maximum
Mysore 12 21.5000 10.24695 8.00 45.00
T.N.Pura 12 15.4167 7.63316 6.00 28.00
Nanjangud 12 14.0000 4.89898 8.00 25.00
Hunsur 12 37.7500 13.83096 13.00 59.00
Priyapatna 12 23.6667 14.54356 7.00 54.00
K.R.Nagar 12 35.6667 18.31211 10.00 62.00
H.D.Kote 12 33.5833 19.38349 6.00 68.00
Total 84 25.9405 15.96710 6.00 68.00
Table: 4.16 Oneway Anova Details on No. of Societies
Source of Variation Sum of Squares df Mean F Sig.
Between Groups 6848.286 6 1141.381 6.141 .000
Within Groups 14312.417 77 185.876
Total 21160.702 83
The tables 4.15 and 4.16 examines the No. of Societies of women cooperatives
taluk wise in Mysore district. Here the also the study has used Anova Table are verified, a
Significant difference was observed between different taluks, where F value of 6.141 was
found to be statistical significant (P=.000). The mean number of societies in various
taluks-Mysore, T.N. Pura, Nanjangud, Hunsur, Periyapatna, K.R.Nagara, and H.D. Kote
102
are 21.5000, 15.4167, 14.0000, 37.7500, 23.6667, 35.6667 and 33.5833 respectively.
Further Scheff’s post hoc test revealed that only Hunsur taluk had highest number of
Women Cooperative Societies Compared to other taluk.
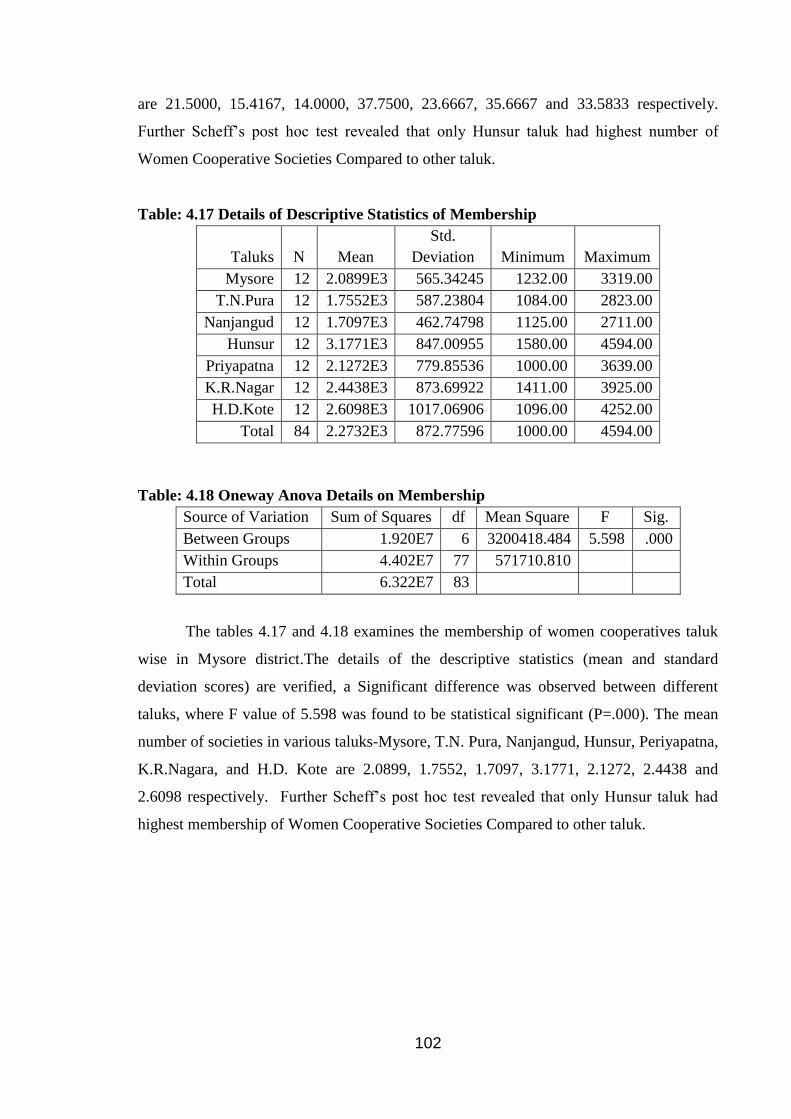
Table: 4.17 Details of Descriptive Statistics of Membership
Taluks
N
Mean
Std.
Deviation
Minimum
Maximum
Mysore 12 2.0899E3 565.34245 1232.00 3319.00
T.N.Pura 12 1.7552E3 587.23804 1084.00 2823.00
Nanjangud 12 1.7097E3 462.74798 1125.00 2711.00
Hunsur 12 3.1771E3 847.00955 1580.00 4594.00
Priyapatna 12 2.1272E3 779.85536 1000.00 3639.00
K.R.Nagar 12 2.4438E3 873.69922 1411.00 3925.00
H.D.Kote 12 2.6098E3 1017.06906 1096.00 4252.00
Total 84 2.2732E3 872.77596 1000.00 4594.00
Table: 4.18 Oneway Anova Details on Membership
Source of Variation Sum of Squares df Mean Square F Sig.
Between Groups 1.920E7 6 3200418.484 5.598 .000
Within Groups 4.402E7 77 571710.810
Total 6.322E7 83
The tables 4.17 and 4.18 examines the membership of women cooperatives taluk
wise in Mysore district.The details of the descriptive statistics (mean and standard
deviation scores) are verified, a Significant difference was observed between different
taluks, where F value of 5.598 was found to be statistical significant (P=.000). The mean
number of societies in various taluks-Mysore, T.N. Pura, Nanjangud, Hunsur, Periyapatna,
K.R.Nagara, and H.D. Kote are 2.0899, 1.7552, 1.7097, 3.1771, 2.1272, 2.4438 and
2.6098 respectively. Further Scheff’s post hoc test revealed that only Hunsur taluk had
highest membership of Women Cooperative Societies Compared to other taluk.
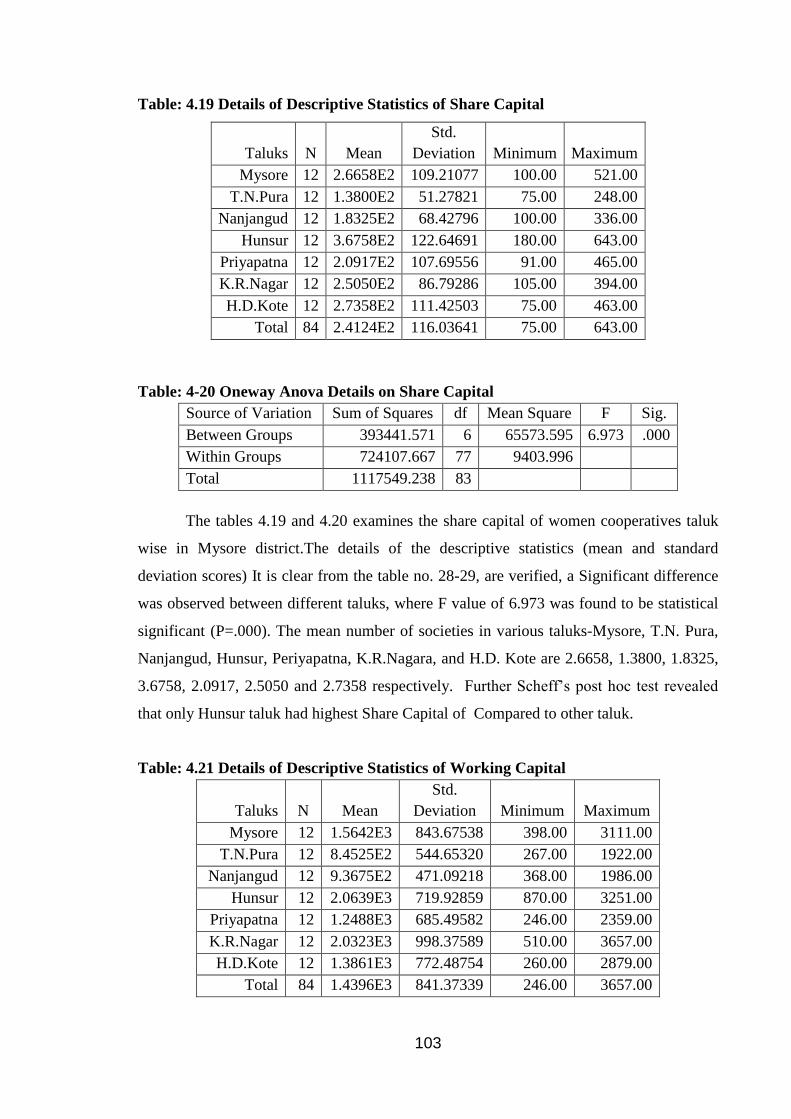
103
Table: 4.19 Details of Descriptive Statistics of Share Capital
Taluks
N
Mean
Std.
Deviation
Minimum
Maximum
Mysore 12 2.6658E2 109.21077 100.00 521.00
T.N.Pura 12 1.3800E2 51.27821 75.00 248.00
Nanjangud 12 1.8325E2 68.42796 100.00 336.00
Hunsur 12 3.6758E2 122.64691 180.00 643.00
Priyapatna 12 2.0917E2 107.69556 91.00 465.00
K.R.Nagar 12 2.5050E2 86.79286 105.00 394.00
H.D.Kote 12 2.7358E2 111.42503 75.00 463.00
Total 84 2.4124E2 116.03641 75.00 643.00
Table: 4-20 Oneway Anova Details on Share Capital
Source of Variation Sum of Squares df Mean Square F Sig.
Between Groups 393441.571 6 65573.595 6.973 .000
Within Groups 724107.667 77 9403.996
Total 1117549.238 83
The tables 4.19 and 4.20 examines the share capital of women cooperatives taluk
wise in Mysore district.The details of the descriptive statistics (mean and standard
deviation scores) It is clear from the table no. 28-29, are verified, a Significant difference
was observed between different taluks, where F value of 6.973 was found to be statistical
significant (P=.000). The mean number of societies in various taluks-Mysore, T.N. Pura,
Nanjangud, Hunsur, Periyapatna, K.R.Nagara, and H.D. Kote are 2.6658, 1.3800, 1.8325,
3.6758, 2.0917, 2.5050 and 2.7358 respectively. Further Scheff’s post hoc test revealed
that only Hunsur taluk had highest Share Capital of Compared to other taluk.
Table: 4.21 Details of Descriptive Statistics of Working Capital
Taluks
N
Mean
Std.
Deviation
Minimum
Maximum
Mysore 12 1.5642E3 843.67538 398.00 3111.00
T.N.Pura 12 8.4525E2 544.65320 267.00 1922.00
Nanjangud 12 9.3675E2 471.09218 368.00 1986.00
Hunsur 12 2.0639E3 719.92859 870.00 3251.00
Priyapatna 12 1.2488E3 685.49582 246.00 2359.00
K.R.Nagar 12 2.0323E3 998.37589 510.00 3657.00
H.D.Kote 12 1.3861E3 772.48754 260.00 2879.00
Total 84 1.4396E3 841.37339 246.00 3657.00
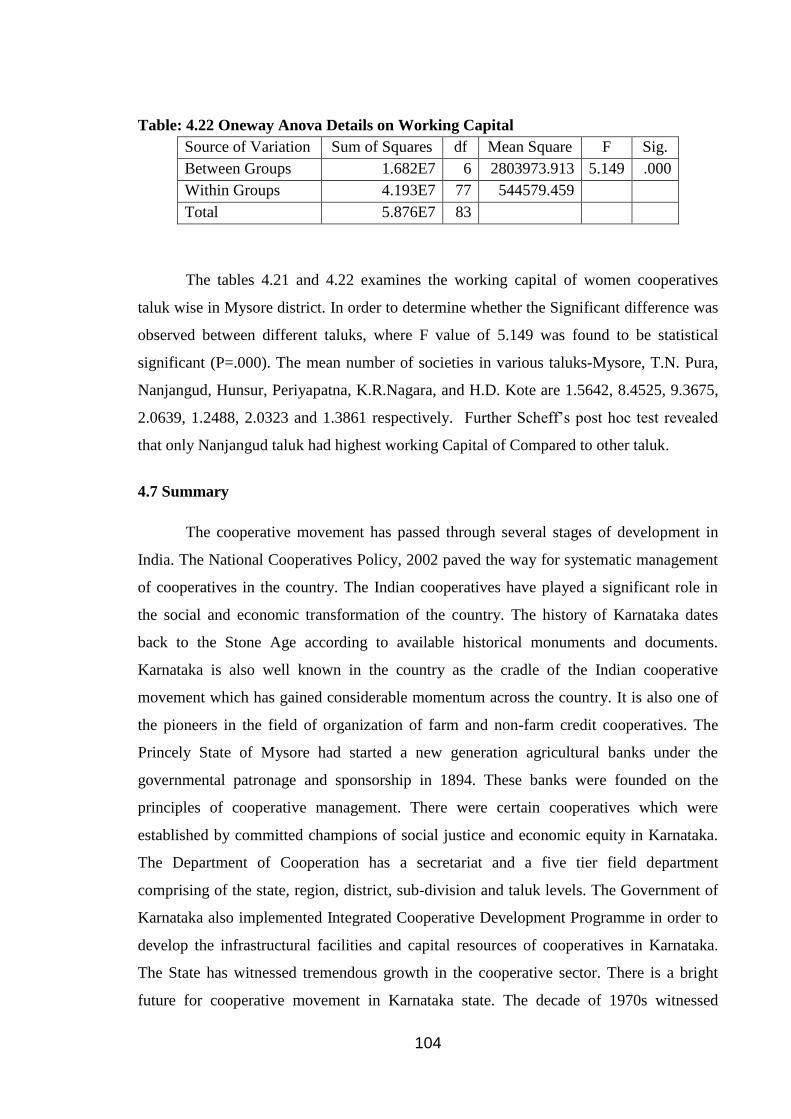
104
Table: 4.22 Oneway Anova Details on Working Capital
Source of Variation Sum of Squares df Mean Square F Sig.
Between Groups 1.682E7 6 2803973.913 5.149 .000
Within Groups 4.193E7 77 544579.459
Total 5.876E7 83
The tables 4.21 and 4.22 examines the working capital of women cooperatives
taluk wise in Mysore district. In order to determine whether the Significant difference was
observed between different taluks, where F value of 5.149 was found to be statistical
significant (P=.000). The mean number of societies in various taluks-Mysore, T.N. Pura,
Nanjangud, Hunsur, Periyapatna, K.R.Nagara, and H.D. Kote are 1.5642, 8.4525, 9.3675,
2.0639, 1.2488, 2.0323 and 1.3861 respectively. Further Scheff’s post hoc test revealed
that only Nanjangud taluk had highest working Capital of Compared to other taluk.
4.7 Summary
The cooperative movement has passed through several stages of development in
India. The National Cooperatives Policy, 2002 paved the way for systematic management
of cooperatives in the country. The Indian cooperatives have played a significant role in
the social and economic transformation of the country. The history of Karnataka dates
back to the Stone Age according to available historical monuments and documents.
Karnataka is also well known in the country as the cradle of the Indian cooperative
movement which has gained considerable momentum across the country. It is also one of
the pioneers in the field of organization of farm and non-farm credit cooperatives. The
Princely State of Mysore had started a new generation agricultural banks under the
governmental patronage and sponsorship in 1894. These banks were founded on the
principles of cooperative management. There were certain cooperatives which were
established by committed champions of social justice and economic equity in Karnataka.
The Department of Cooperation has a secretariat and a five tier field department
comprising of the state, region, district, sub-division and taluk levels. The Government of
Karnataka also implemented Integrated Cooperative Development Programme in order to
develop the infrastructural facilities and capital resources of cooperatives in Karnataka.
The State has witnessed tremendous growth in the cooperative sector. There is a bright
future for cooperative movement in Karnataka state. The decade of 1970s witnessed
105
organized development of cooperatives in the country. But, the cooperative sector has
been adversely affected by the policy of economic liberalization in the country especially
in the age of globalization. There is consistent growth in terms of cooperative societies,
membership, share capital and working capital in Karnataka State since inception. The
state has also completed a fruitful century of cooperative movement in the year 2005. The
women cooperatives have also played a notable role in the empowerment of women by
providing credit services, self employment opportunities, income generating opportunities
and so on. The women cooperatives have to go a longway in achieving the goal of
empowerment of women in the state. The cooperative movement has come a long way in
Mysore district. The cooperative enterprises are covering almost all the towns and villages
in Mysore district. They have know spread into almost all economic activities. The
statistics reveal that the ratio of societies and share capital is quite high in the post –
economic liberalization period in Mysore district.
Reference:
Karanth (1995), “Formal Cooperatives and Informal Cooperation in Karnataka, in
B.S.Basivkar and Donald W Attawood (eds), Finding the Middle Path: The Political
Economy of Cooperation in Rural India”, Sage Publications, New Delhi, India.
Madan, G.R. (2007), “Co-operative Movement in India”, Mittal Publications, New
Delhi, India.
Rangaswamy (1994), “Career and Prospects of Co-operative Movement in Karnataka,
in M.Mahadeva and Abdul Aziz, Cooperation at Cross Roads”, Chethana Book House
& Publishers, Mysore, India.
Verma, Sanjay Kumar (2007), “Cooperatives and Community Culture – The Role of
Media”, Paper presented in the regional seminar on 100 years cooperative movement –
media role, organized by Karnataka State Cooperative Apex Bank Ltd,
Manasagangotri, Mysore, India. July 21, 2007.

![The Karnataka Co-Operative Socities Act - … Act.pdf1959: KAR. ACT 11] Co-operative Societies 1 THE KARNATAKA CO-OPERATIVE SOCIETIES ACT, 1959. ARRANGEMENT OF SECTIONS …](https://img.pdfslide.us/doc/110x75/5aa079647f8b9a8e178e0616/pdfthe-karnataka-co-operative-socities-act-actpdf1959-kar-act-11-co-operative.jpg)


![· 1959:KAR.ACT 11] Co-operative Societies 1 THE KARNATAKA CO-OPERATIVE SOCIETIES ACT, 1959. ARRANGEMENT OF SECTIONS Statement Of Objects And Reasons: Sections : CHAPTER I PRELIMINAR](https://img.pdfslide.us/doc/110x75/5f61771b8e8d3b17a41d0a1e/1959karact-11-co-operative-societies-1-the-karnataka-co-operative-societies-act.jpg)


![1959: KAR. ACT 11] Co-operative Societies THE KARNATAKA CO](https://img.pdfslide.us/doc/110x75/584b10501a28ab85738c67fa/1959-kar-act-11-co-operative-societies-the-karnataka-co-.jpg)