Embed Size (px)
Citation preview
Research Methodology 100
CHAPTER III
RESEARCH METHODOLOGY
The research problem when formulated in clear cut terms, the researcher has to
be required to prepare its research design to state the conceptual structure within its
limits of research to be conducted. The preparation of such a design facilitates
research to be as resourceful as possible yielding maximal information. In other
words, the function of research design is to give for the collection of relevant and
applicable evidence with minimum effort, time and money. But how all these can be
achieved depends mainly on the research purpose. Research purposes may be grouped
into four categories-(I) Examination, (II) Description, (III) Diagnosis, and (IV)
Experimentation. The preparation of research design, appropriate for a particular
research problem involves the consideration of the following:
1. Methods of Data Collection to be adopted in work
2. Source of information
3. Tools and techniques for Data collection.
4. Data Analysis i.e. qualitative and quantitative.
III.1 RESEARCH DESIGN
A flexible research design which provides chances for considering many
different aspects of a problem is to be considered appropriate and suitable if the
purpose of the research study is that of investigation. But when the purpose happens
to be an accurate description of a situation or of an association between variables, the
suitable design will be one that reduces bias and maximizes the reliability of the data
collected and analyzed. There are many research designs like experimental and non-
experimental hypothesis testing. Research design considers the following:
• The mode of obtaining the information from sources
• The availability and skills of the researcher himself
• Explanation of way to obtain information will be organized
• The reasoning of the problem selection

Research Methodology 101
• The time available for research
• The cost factor relating to research, i.e., the finance available for the purpose.
On keeping the above facts in the mind a descriptive research design has been
employed as the study aimed to investigate the problems of students of professional
courses in context to personality characteristics, sex and institutional environment in
Jaipur district. Actual work begins with the selection of method and techniques and
proper tools to carry out the research.
III.2 METHOD USED
Survey method has been used for this research study. Approach most suited for
gathering descriptive information. This method provides three types of information:-
� Of what exists.
� What we want.
� How to get information.
The information of what exists is gathered by studying and analyzing important
aspect of present situation. The information of what we want is obtained by clarifying
goals and objectives. The information of how to get these is collected through
discovering the possible means of achieving the goals on the basis of the experiences
of others or of opinions of experts.
Advantage of survey method-
• As compared to other methods survey yield a broader range of information.
Questioning is usually faster and cheaper that Observation.
• Questions are simple and suitable to administer and analyzing.
• Data is reliable and authentic.
• The variability of results is reduced to some extent.
• It is relatively simple and interesting to analyze, quote and interrelate the data
gathered by survey method.
III.3 POPULATION
Population is the larger group from which individuals are selected to
participate in a study. The population for the study comprised of undergraduate and
Research Methodology 102
postgraduate students studying in professional courses of Rajasthan state. Population
comprises for the present survey are the students of Rajasthan who had been admitted
through pre-entrance examination (Govt. or private) conducted by examination bodies
of Rajasthan state as per required norms.
III.4 SAMPLE
Sample is the representatives selected for a research purpose whose
distinctiveness demonstrates the larger group from which they were selected.
Researchers generally draw conclusions and results about large groups by taking a
sample. A Sample is a section of the population selected to represent the population as
a whole in a research study. Ideally, the sample should be representative and allow the
investigator to make precise estimation of the thoughts and behaviour of the larger
population. For designing the sample three things should be decided -
� Who will be surveyed, they are the sample
� How many people will be surveyed, that is sample size
� Large samples give more reliable and accurate results than small samples.
� How should the sample be chosen is called Sampling
� Sample members may be chosen at random from the entire population
III.5 SAMPLING
Sampling - The process to select a number of individuals for any research
study in such a way that the individuals represent themselves as a part of larger group
from which they were selected. Purpose of sampling is to gather data about the
population in order to make an conclusion that can be generalized to the population.
There are two types of sampling techniques one is Probability Sampling and
second is Non-Probability Sampling. Probability sampling is one in which each
member of the population has an equal chance of being selected but in a non-
probability sample, a particular member of the population can have chosen.
Types of probability sampling –
� Probability sampling-
Simple random sampling, systematic sampling, stratified sampling, cluster
sampling, Multi stage sampling
Research Methodology 103
� Non-probability sampling
Purposive Sampling, Convenience Sampling, Quota sampling, Snow ball
sampling
III.6 SAMPLING PROCEDURE
It is a process of selecting a sample from the population. After taking into
consideration the nature of the investigation and examination and other related factors
for the present research investigation researcher used two types of methods for the
sampling-
(1) Purposive sampling– In this sampling method, the researcher selects a typical
group of professional courses who represent a section from all professional
courses and then collects data from this group. As this sampling method
involves purposive or deliberate selection of particular units of the universe
for constituting a sample which represents the universe thus it was used for the
selection of four courses i.e. education, engineering, medical science and
business management from available professional courses in Rajasthan for the
study.
(2) Random sampling- Simple random sampling is also known as chance sampling
or probability sampling where each and every item in the population has an
equal probability to select in the sample In simple random sampling every
member of the population has probability of coming into the sample and it is
least biased of all sampling techniques. It can be easily used with large sample
size. Therefore in this study, institution running professional courses of ED*,
EN* MD*, MN* and their respective students has been selected randomly.
*-{Education-ED, Engineering-EN, Medical science-MD, Business
management-MN}
III.7 SAMPLE SELECTION
On the basis of above sampling procedures, the distribution of the proposed
sample is given in the following table –

Research Methodology 104
Table - 3.1 Proposed Samples
No. of Students S.
No.
Professional institutions of Jaipur
district running the courses
Number of
institutes Male Female Total
1. Education (ED) 5 100 100 200
2. Engineering (EN) 5 100 100 200
3. Medical science (MD) 3 100 100 200
4. Business management (MN) 5 100 100 200
Total 18 400 400 800
# Note- original sample consists of all potential participants that researcher approach
to participate; the final sample consists of those who actually do participate.
Tools has been administered on above proposed sample but actual respondents
after rejection of unfilled and incomplete forms as well as received forms, actual
sample was as follows
Table - 3.2 Actual sample
No. of Students S.
No.
Professional institutions of Jaipur
district running the courses
Number of
institutes Male Female Total
1. Education (ED) 5 60 60 120
2. Engineering (EN) 5 60 60 120
3. Medical science (MD) 3 60 60 120
4. Business management (MN) 5 60 60 120
Total 18 240 240 480
III.8 VARIABLES OF THE PRESENT STUDY
An important step in designing research study is defining or identifying the
variables that can be manipulated, measured, examined and described, or controlled.
The variable can be a number, a name, or anything where the value can
change. There are two types of variable:
� Independent Variable (IV): A variable that is selected or controlled by the
researcher, to find out its relationship to the coming outcomes of the research.
Research Methodology 105
Independent variable that can be manipulated, measured, or selected to
examine the relationship to some other observed variable. The nature of what
is varied should be carefully explained.
� Dependent Variable (DV): The variable being measured as an outcome—also
called outcome, response, criterion, or explained variable. Dependent variable
that is observed and measured in response to an independent variable
In the present research study following are the variables -
Independent variables: (IV)
1) Personality
2) Sex
3) Institutional environment
Dependent variable: (DV)
1) Problems of the students of professional courses
III .9 JUSTIFICATION OF THE SELECTION OF VARIABLES IN THE
STUDY
Following variables took for the study because:
• Professional courses: A first professional degree is an academic degree that
prepares the holder for a particular profession by emphasizing competency
skills along with theory and analysis. In current scenario the most popularity is
gained by those professional courses which bring future safety and security in
vocation/profession as well as an independent financial status in the society.
These selected professional courses i.e. education, Engineering, Medical, and
business Management courses are the most suitable and demanding courses
now a days.
� Problems of the students: there is thinking in various people that getting an
admission in a professional course after the school education for a career is
enough so they give emphasis and most of their efforts till their admission
only but the reality shows the other side of the coin. It has been observed
everywhere that in students’ life after even after choosing their professional
fields all of them face various types of problems. Out of them problems related
to educational, personal and vocational fields are most important and should
Research Methodology 106
be taken care of seriously as they can affect their settlement and success in
future.
� Personality characteristics: The many problems of students are affecting by
their own personality characteristics. A single dimension of the personality is
able to change the situation and circumstances in the life.
� Sex: The problems of students of males and females on the basis of their sex
difference may be different or common inspite of having same institution or
personality. Some of the traits are inborn naturally in males and females which
makes the difference.
� Institutional environment: Physical and academic environment of any
institution place an important role for the problems of students of the
professional courses. Building infrastructures and human resource are the
constituting criteria of any institutional environment.
III.10 SOURCES OF DATA
� Students
� Faculties
� Management and other staff of institutions
� Different records of institutions
III.11 NATURE OF DATA
Both types of Qualitative and Quantitative data were used in the study.
Qualitative data was generated from the interviews of selected teachers and students
of institutions regarding their institutional environment, different types of problems
and their solution. It was also obtained by observation schedule prepared for
qualitative study of environment of institutions. Quantitative data was generated and
gathered by administrating the two different self made checklists, Multidimensional
Personality Inventory prepared by Dr. Manju Agrawal and structured interview.
III.12 TOOLS FOR COLLECTION OF DATA
In every research work, it is essential to collect information in terms of some
data. They can be obtained from many sources, direct or indirect. It is necessary to
adopt a systematic method to collect required data. Relevant and adequate data in
Research Methodology 107
sufficient quantity and quality should be collected. They should be satisfactory,
reliable and valid. The instruments thus employed as means for collecting data are
called tools. The selection of suitable instruments or tools is of vital importance for
successful research. Different tools are suitable for collecting various kinds of
information for various purposes in a single investigation. The researcher may
possibly use one or more of the tools in combination or individually for this purpose.
Researchers construct and use them effectively with systematic way and procedure.
Researcher kept all the aspects of study in mind to select the most appropriate
tool for her study.
III.12A. CONSTRUCTION OF RESEARCH INSTRUMENTS OR TOOLS
The construction of a research instrument or tool for data collection is the
most important step of a research project because findings or conclusions is based
upon the type of information collected, and the data collected is entirely dependent
upon the questions asked of respondents. The famous saying about computers-
“garbage in garbage out”- is also applicable for data collection. The research tool
provides the input into a study and therefore the quality and validity of the output (the
findings), are solely dependent on it. The underlying principle behind the construction
of tool is to ensure the validity of instrument by making sure that questions must
relate to the objectives of a research study.
On the basis upon the consideration such as variables, objectives, availability
of suitable tests, personal competence of the investigator, methods of scoring and
interpretation of data a review of tools needed for the study was made, however none
of them was found to be appropriate for problems of students for this study due to
unavailability of content. Therefore on the basis of requirement of information
needed for the present study researcher decided to took both types of standardize and
self-made tools. They are presented as follows in next table 3.3 on page- 107

Re
sea
rch
Me
tho
do
log
y
10
8
Ta
ble
- 3
.3:
To
ols
Asp
ect
of
the
tool
Nam
e of
the
tool
cod
e T
yp
e of
tool
Dim
ensi
on
s on
th
e to
ol
Nu
mb
er o
f
item
s
Ad
min
iste
red
on
Sch
eme
of
an
aly
sis
Per
sonal
In
form
atio
n
Per
sonal
dat
a bla
nk P
erfo
rma
T1
Sel
f--m
ade
Per
sonal
, hea
lth,
fam
ily,
educa
tion,
sex,
etc.
stu
den
ts
Quan
tita
tive
& q
ual
itat
ive
Per
sonal
ity
Mult
idim
ensi
onal
Per
sonal
ity
Inven
tory
pre
par
ed b
y D
r. M
anju
A
gar
wal
T2
Sta
ndar
diz
e In
trover
sion,
extr
over
sion,
self
-conce
pt,
in
dep
enden
t-dep
enden
t, T
emp
eram
ent,
A
dju
stm
ent
and A
nxie
ty.
12
0
stu
den
ts
Quan
tita
tive
Pro
ble
ms
of
studen
ts
Pro
ble
m c
hec
kli
st
T3
Sel
f-m
ade
Educa
tional
, per
sonal
and v
oca
tional
pro
ble
m o
f st
uden
ts
15
0
Stu
den
ts
Quan
tita
tive
Inst
ituti
onal
en
vir
onm
ent
Chec
kli
st f
or
inst
ituti
on
al
envir
onm
ent
T4
Sel
f-m
ade
Inst
ituti
on
al e
nvir
on
men
t, b
uil
din
g,
hum
an r
esourc
es,
labs,
tea
chin
g,
acad
emic
s et
c.
26
Stu
den
ts
Quan
tita
tive
Inst
ituti
onal
en
vir
onm
ent
An
d p
roble
ms
of
studen
ts
Obse
rvat
ion s
ched
ule
T
5
Sel
f-m
ade
Fac
ilit
ies
rela
ted t
o b
uil
din
g
infr
astr
uct
ure
an
d h
um
an r
esourc
e 26
Sel
f-ob
serv
ed
Qual
itat
ive
Inst
ituti
onal
en
vir
onm
ent
Inte
rvie
w
(Str
uct
ure
d)
T6
Sel
f-
con
stru
cted
Vie
ws
on p
roble
ms
and s
olu
tions
faci
liti
es,
acad
emic
en
vir
onm
ent
10
Stu
den
ts
Quan
tita
tive
& q
ual
itat
ive
Inst
ituti
onal
en
vir
onm
ent
inte
rvie
w
(Focu
s gro
up d
iscu
ssio
n)
T7
Sel
f-co
nst
ruct
ed
10
Exper
ience
d a
nd
you
ng T
each
ers
gro
up
s Q
ual
itat
ive
Research Methodology 109
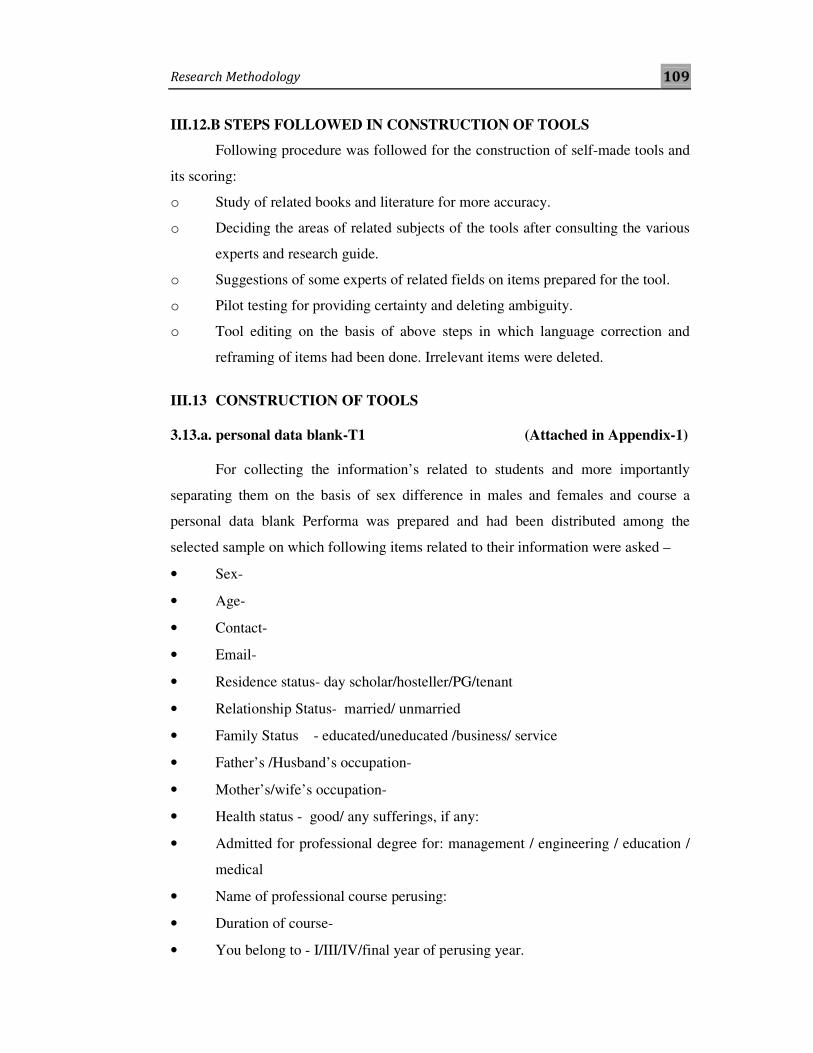
III.12.B STEPS FOLLOWED IN CONSTRUCTION OF TOOLS
Following procedure was followed for the construction of self-made tools and
its scoring:
o Study of related books and literature for more accuracy.
o Deciding the areas of related subjects of the tools after consulting the various
experts and research guide.
o Suggestions of some experts of related fields on items prepared for the tool.
o Pilot testing for providing certainty and deleting ambiguity.
o Tool editing on the basis of above steps in which language correction and
reframing of items had been done. Irrelevant items were deleted.
III.13 CONSTRUCTION OF TOOLS
3.13.a. personal data blank-T1 (Attached in Appendix-1)
For collecting the information’s related to students and more importantly
separating them on the basis of sex difference in males and females and course a
personal data blank Performa was prepared and had been distributed among the
selected sample on which following items related to their information were asked –
• Sex-
• Age-
• Contact-
• Email-
• Residence status- day scholar/hosteller/PG/tenant
• Relationship Status- married/ unmarried
• Family Status - educated/uneducated /business/ service
• Father’s /Husband’s occupation-
• Mother’s/wife’s occupation-
• Health status - good/ any sufferings, if any:
• Admitted for professional degree for: management / engineering / education /
medical
• Name of professional course perusing:
• Duration of course-
• You belong to - I/III/IV/final year of perusing year.

Research Methodology 110
• Prior board /degree obtained-
• Medium of study at school level - English/Hindi/Any other.
3.13. b Multidimensional Personality Inventory prepared by Dr.Manju Agarwal
- (T2) (Attached in Appendix-2)
Personality researches confirm that it is a complex concept & its definition as
well as measurement is not the easy task. Personality cannot be measured through one
factor or dimensions of personality. It has multidimensional factors. In this tool
dimensions were – Extroversion – Introversion, High Self Concept – Low Self
Concept, Independence – Independence, Balance – Imbalance Temperament, High
Adjustment – Low adjustment & High – Low Anxiety.
Although several tests are available in the area of personality measurement but
none of the test measures all six above mentioned dimension of personality. The
construction & standardization of the present inventory fill this gap, because with the
administration of present inventory one can get the scores of six personality areas.
Therefore, researcher has decided to choose this standardized tool for her study.
The first area of this inventory is Extroversion – Introversion (A) - which has
been considered as one of the important potential personality variable, by which one
can estimate whether one person – orientation is based on objective condition or facts
(Extrovert), or person – orientation is based on own self (Introvert). Extroverted
behavior primarily directed by external environment objectives or facts, whereas
introverted behavior is directed by himself. His (Introvert) consciousness thinking &
way of behavior are subjective. The inner life of extrovert & introvert are determined
& controlled by external & internal conditions respectively. The extrovert person has
a close touch with the environment & his interest, belief, values & the behavior
depend upon the objective condition of the environment. The extrovert person is
normally adjusted in moral conduct & other sphere of behavior. The immediate
environment condition does not influence the person who is introverted. He acts
according to his own expectation & thinking. The introvert & extrovert differ in
thinking, feeling, sensation &involution.
The second factor of personality has been included in this inventory is Self –
Concept (B). The “Self” has also been considered as a central construct of the
Research Methodology 111
personality, the core of one being or ego, the end result of one’s experience, the
potential or the nucleus of personality. This thinking conscious entity is a complex of
various vital psychological processes. It possesses a cognitive structure of adjustment
&interactions. Despite its genesis in social interactions, self has a continuity of
striving that makes self-identifications with a cluster of values or traits & strives for
consistency of functional existence & of its own identity. Thus, the self can be
explained as the organized consistent conceptual gestalt of perceptions of relationship
of the “I” or “Me” to others & to various aspects of life together with value attached
to this perception, in terms of self-personification, self-esteem, self-image self-
sentiment, perpetuates to actualize itself.
The third factor of this inventory is temperament (C) which refers to reaction
of the person toward emotional situation. By knowing temperament of the person one
can estimate personality of the person, because this is related to the consistency or
mental imbalance & considered as one of the important factor of personality.
Like temperament, dependency v/s independency (D) its fourth dimension is
also associated with the personality which has close relation to intelligence or
uniqueness of the personality.
Adjustment (Y) - fifth dimension is an index of integration between needs &
press, which has a close relation to personality; it has been considered as a trait of
personality. By the process of adjustment an individual experiences several facts &
events, by which he tries to shape & reshape his personality.
The concept of anxiety (R) the sixth dimension occupies a very important
place in the study human personality & multitude activities of the mind. According to
Freud “Anxiety is a something felt, unpleasant effect of state or condition.” This state
was characterized by all that is covered by the word “nervousness”, ‘apprehension” or
anxious expectation’ & different discharge phenomena.
Now, in present research investigation the above tool was utilized to select the
different six groups of students so from each selected group (ED, EN, MD and MN)
their students have been analyzed for three dimensions according to following table-

Research Methodology 112
Table - 3.4
S. No. Group Dimension examined
1 ED-EN Extroversion – Introversion (A)
2 ED-MD Self – Concept (B).
3 ED-MN Dependency / Independency (D)
4 EN-MD Temperament (C)
5 EN-MN Adjustment (Y)
6 MD-MN anxiety (R)
Note-Out of above six personality dimensions those aspects of each criteria in which
maximum number of students lie during the scoring is used to make the groups and
has been analyzed in the study.
Scoring procedure: the procedure for this Multidimensional Personality Inventory is
very simple. Scores has been given as follows
1. Yes - 3
2. Indefinite - 2
3. No - 1
III.13c Problem checklist – T3 (Attached in Appendix-3)
Checklist is a selected list of words, phrases, sentences and paragraphs
following which an observer records a check mark to denote a presence or absence of
whatever is being observed. It calls for a simple yes / no judgments. The main
purpose is to call attention to various aspects of an object or situation, to see that
nothing of importance is overlooked.
For its preparation investigator tapped many sources and also discussed with
various experts of i.e. education, engineering, medical sciences, management,
university and school counsellors, psychologists, students and teachers. After a detail
and fruitful discussion researcher was able to prepare a checklist for the students of
professional courses. In the checklist total 180 items were framed related to the
problems of their educational, personal and vocational field. Items on educational
problems were related to study, books and text books, course material, attendance in
their theory and practical, teacher and their teaching style, academic achievements,
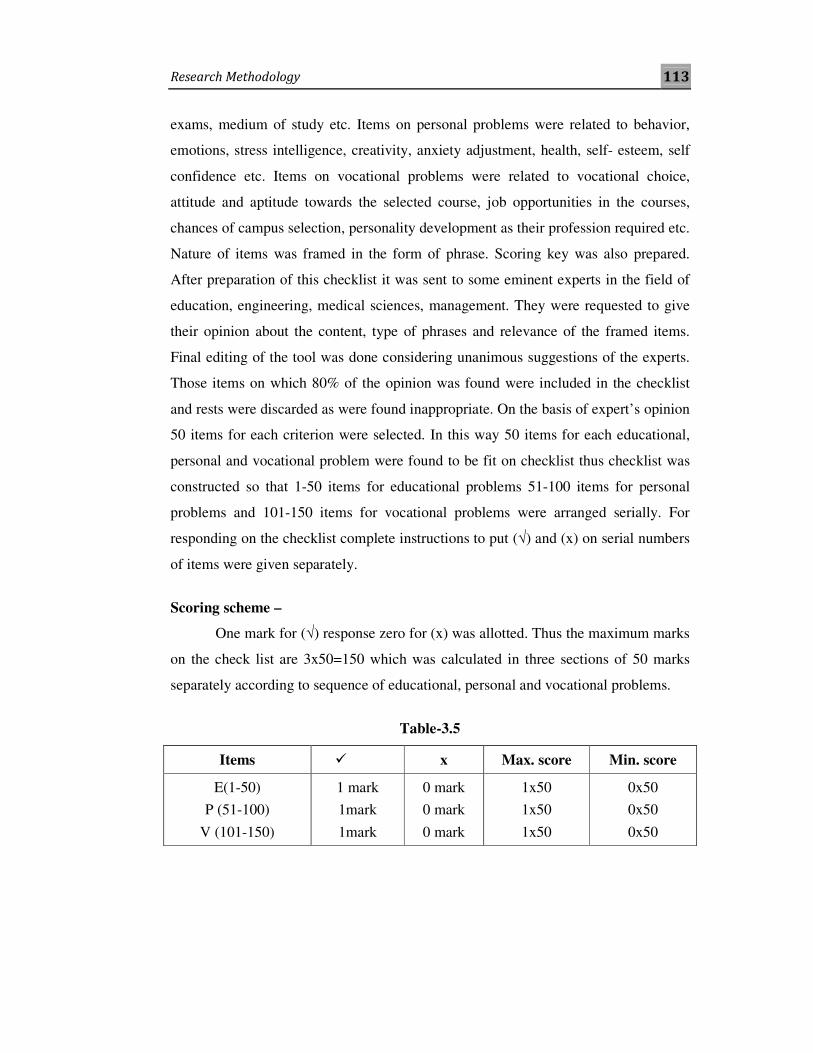
Research Methodology 113
exams, medium of study etc. Items on personal problems were related to behavior,
emotions, stress intelligence, creativity, anxiety adjustment, health, self- esteem, self
confidence etc. Items on vocational problems were related to vocational choice,
attitude and aptitude towards the selected course, job opportunities in the courses,
chances of campus selection, personality development as their profession required etc.
Nature of items was framed in the form of phrase. Scoring key was also prepared.
After preparation of this checklist it was sent to some eminent experts in the field of
education, engineering, medical sciences, management. They were requested to give
their opinion about the content, type of phrases and relevance of the framed items.
Final editing of the tool was done considering unanimous suggestions of the experts.
Those items on which 80% of the opinion was found were included in the checklist
and rests were discarded as were found inappropriate. On the basis of expert’s opinion
50 items for each criterion were selected. In this way 50 items for each educational,
personal and vocational problem were found to be fit on checklist thus checklist was
constructed so that 1-50 items for educational problems 51-100 items for personal
problems and 101-150 items for vocational problems were arranged serially. For
responding on the checklist complete instructions to put (√) and (x) on serial numbers
of items were given separately.
Scoring scheme –
One mark for (√) response zero for (x) was allotted. Thus the maximum marks
on the check list are 3x50=150 which was calculated in three sections of 50 marks
separately according to sequence of educational, personal and vocational problems.
Table-3.5
Items � x Max. score Min. score
E(1-50)
P (51-100)
V (101-150)
1 mark
1mark
1mark
0 mark
0 mark
0 mark
1x50
1x50
1x50
0x50
0x50
0x50
Research Methodology 114
III.13d. Checklist for institutional environment –T4 (for students)
(Attached in Appendix-4)
In the checklist initially total 35 items were framed related to the institutional
environment in the form of words. Scoring key was also prepared. Items related to
educational environment includes the various aspects of building infrastructure and its
human recourses i.e. infrastructure facilities, management, administration, academic
staff, office staff, peons etc. After preparation of this checklist it was sent to some
eminent experts in the field of education, engineering, medical sciences, management.
They were requested to give their opinion about the content, type of phrases and
relevance of the framed items. Final editing of the tool was done considering
unanimous suggestions of the experts. Those items on which 80% of the opinion was
found were included in the checklist and rests were discarded due to ambiguity and
repetitiveness. On the basis of expert’s opinion 26 items were found to be fit on
prepared checklist. For responding on the checklist, complete instructions to put (√)
for Yes and (x) for No, has been given.
Scoring scheme –
One mark for (√) response and zero for (x) was allotted. Thus the maximum
marks on the check list were 1x26=26.
In present research after filling the checklists by all the respondents of selected
professional courses, two groups (average and above average level of institutional
environment) were prepared on the basis of obtained scores. Nowadays institutional
environment for the students of different courses has been maintained almost at same
level as most of the students in selected sample are studying in those institutions in
which a variety of courses running in same institutions having almost same
infrastructure, HR as well as other facilities. Also, sample has been drawn from Jaipur
district thus, trends to make institutional environment up to the mark by the
management people follows almost same standards due to competition among them.
Formation of groups is as follows-
• Average level of institutional environment - Scores obtained below 80% of
facilities on observation schedule

Research Methodology 115
• Above average level of institutional environment - Scores obtained 80% and
above 80%. of facilities on observation schedule
III.13.e. Observation schedule for institutional environment.T5
(Attached in Appendix-5)
Observation method is a method in which the research subjects is observed
and recorded without any direct contact. It can deal in controlled or uncontrolled
situations. Observation offers the researcher a distinct way of collecting data. It does
not rely on what people say or they perform, or what they say or what they think. It is
more direct than that. Instead, it relies only on the direct evidence and proofs of the
eye witness events. It is a more usual way of gathering data. Whenever direct
observation is possible it is the perfect method. It involves the systematic recording of
observable happening or behaviour in a natural setting for the selected situation. The
idea behind observation techniques is to collect data in considerable amount in short
time span directly and also to get eye witness first hand data in real life situation. It is
necessary to make a distinction between observation as a scientific tool and the casual
observation of the man in the street. Observation is very systematic and interesting
technique. Therefore for a systematic collection of data the various procedure of
recording should be used. They are like checklists, rating scales and score card etc.
In the present research investigation it was necessary to observe the different
aspects like proper use of facilities and human resources available in institutions,
proper conduction of academics and quality teaching etc., systematically without any
direct contact. They all are responsible to make institutional environment positive.
Thus investigator prepared an observation schedule in the form of rating scale for
rating three items 1.building infrastructure 2.Human resource 3.academic environment.
The rating grades on the tool is given as- A-Excellent, B- Good, C- Average.
Observations of five institutions of ED, EN, MN and three colleges of MD have been
observed by the researcher.
Scoring procedure has following structure for calculating the response on
various grades in observation schedule.
1. 0% - 33% - below average
2. 34% - 67% - average
Research Methodology 116
3. 68% - 100%- above average
A. Grade-A is provided to those institutions in which 80% and above items found
in functional conditions on all the aspects in prepared schedule.
B. Grade-B is provided to those institutions in which 65% - 79% items found in
functional conditions on all the aspects in prepared schedule.
C. Grade-C is provided to those institutions in which below 65% items found in
functional conditions on all the aspects of prepared schedule.
III.13.f. (i) Structured Interview T6 (for students) (Attached in Appendix-6)
Interviews are an attractive plan for the investigators and researchers.
Interviews are something more than the simple conversation. They involve a set of
guess and understandings about the situation which are not normally associated with a
informal conversion. In interviews data is collected directly from others in face to face
contact in a particular situation. The interviewer can able to obtain certain types of
confidential information which might be hesitant to put in writing in front of
everybody. Interview is particularly appropriate when the researcher wishes to collect
data based on their personal emotions, experiences and feelings.
Therefore researcher decided to take structured interview for further analyzing
the institutional environment as well as other probable reasons to investigate the
problems of students of professional courses. 8% of actual sample of students who
had participated in the study were interviewed. The consent of the subject was taken
for the purpose of interview. It was used for purpose of the research study only. The
researcher framed a predetermined list of 10 questions of mixed type of nature viz.8
items on yes and no, one item is of choose the order, and 1 item was to assign grades
to institution according to their personal view. Each respondent has faced with
identical questions. This type of interview was rigidly standardized and formal.
Interpretation has been done on the basis of calculated % of positive responses of
students on items. Scoring procedure had following structure for calculating the
response on various items in interview schedule.
1. 0% - 33% - below average
2. 34% - 67% - average
3. 68% - 100%- above average

Research Methodology 117
III.13. f. (ii) focus group interview T7 (for teachers) (Attached in Appendix-7)
It is rapidly becoming one of the major research tools to understand people’s
thoughts and feelings and their views regarding a particular aspect. It is generally
conducted by inviting six to ten people in a group to gather for a few hours with a
trained moderator to talk and discuss about a product, thought, service or
organization. The conference is held in a pleasant place with refreshments and drinks
to create a relaxed environment for the participants. The moderator needs
independence, vast knowledge of the subject and some understanding of group and
their behaviour. The moderator starts with a broad question before moving to more
specific subject, encouraging them to open- up and easy discussion to bring out true
feelings and thoughts. At the same time, the interviewer focuses their discussion;
hence the name is given focus group interviewing. Focus groups are structured around
a set of carefully prearranged questions usually not more than 10 but the discussion is
free-flowing to discuss. Ideally, participant comments will stimulate and influence the
thinking and sharing of others. Some people even find themselves changing their
thoughts and opinions during the group. A homogeneous group of unfamiliar person
comprises the focus group. Homogeneity reduces self-consciousness among people
who will probably never see each other again.
Characteristics of Focus Group Interviews -
• Participants of the group
� Should be carefully recruited
� Set 5 to 10 people per group but 6-8 preferred
� Gather similar types of people
� Set of repeated groups
• Environment for the FGI (focus group interview)
� Make it comfortable
� Arrangement in circle seating
� Tape recorded/Note making
• Moderators of group
� Must be skillful in group discussions
� Uses pre-determined questions

Research Methodology 118
� Establishes liberal environment
• Analysis and Reporting of discussion
� Systematic analysis of results
� demonstrable procedures
� Appropriate reporting of outcomes
Advantages of the process
• Research procedure in a social context
• Format allows the moderator to probe- flexibility to investigate unexpected
issues.
• High face validity in the process
• Relatively completed in low-cost.
• Relatively give fast results.
In the present study researcher had decided to use this new method of
conducting interview of 12 faculty members of each course. She was in need to
insight into a new area of research is to investigate topics where opinions or attitudes
were conditional. Researcher also needs additional information to analyze the data
correctly about their working atmosphere and her observation schedule. For this
purpose eight focus groups were conducted for each of 90 minutes by a team
consisting of a moderator and assistant moderator. The moderator facilitated the
discussion; the assistant took the notes. Members of groups were selected randomly.
Two groups were of education lecturers (n - 6), two groups of engineering lectures (n-
6), two groups of medical science (n-6) and two group of business management (n-6).
All the instructions to conduct the interview were followed. Data was planned to
collect using both video- audio recorder and notes making and studied later to
analyze. The rationale being that if one strategy failed, data would still be recorded by
the other method. But Participants had refused to speak in the presence of a camera
and recorder, so notes preparation was done by assistant moderator. During the
interviews 1-2 participant in all types of groups was unhappy about the discussion
leading in a negative direction, and expressed this, but continued to participate.
Research Methodology 119
Preparation of focus group questions-
Total 15 items were framed related to the teachers, teaching and their
institutional environment in the form of questions. After preparation of this list it was
sent to some eminent experts in the field of education, engineering, medical sciences,
management. They were requested to give their opinion about the content, type of
phrases and relevance of the framed items. Final editing of the tool was done
considering unanimous suggestions of the experts. Those items on which 80% of the
opinion was found were included in the list and rests were discarded due to ambiguity
and repetitiveness. On the basis of expert’s opinion 10 items out of which 2 were
engagement questions, 6 exploratory and 2 were exit types of questions found to be fit
on prepared list. For responding on the list, complete instructions to discuss on it were
given separately. Scoring procedure had following structure for calculating the
response on various items in) focus group interview.
1. 0% - 33% - below average
2. 34% - 67% - average
3. 68% - 100%- above average
III.14 RELIABILITY AND VALIDITY OF TOOLS
Reliability
Reliability is the degree to which actions are free from error to yield consistent
results. If a measurement device or procedure again and again assigns the same score
to individuals or objects with equal values, the instrument or tool can be considered
reliable. Reliability involves the consistency or reproducibility of test scores across
testing situations on the same, or parallel, testing instruments. This property is not a
stagnant function of the test. Repeatability, or stability-over-time reliability, may be
measured with the test-retest method
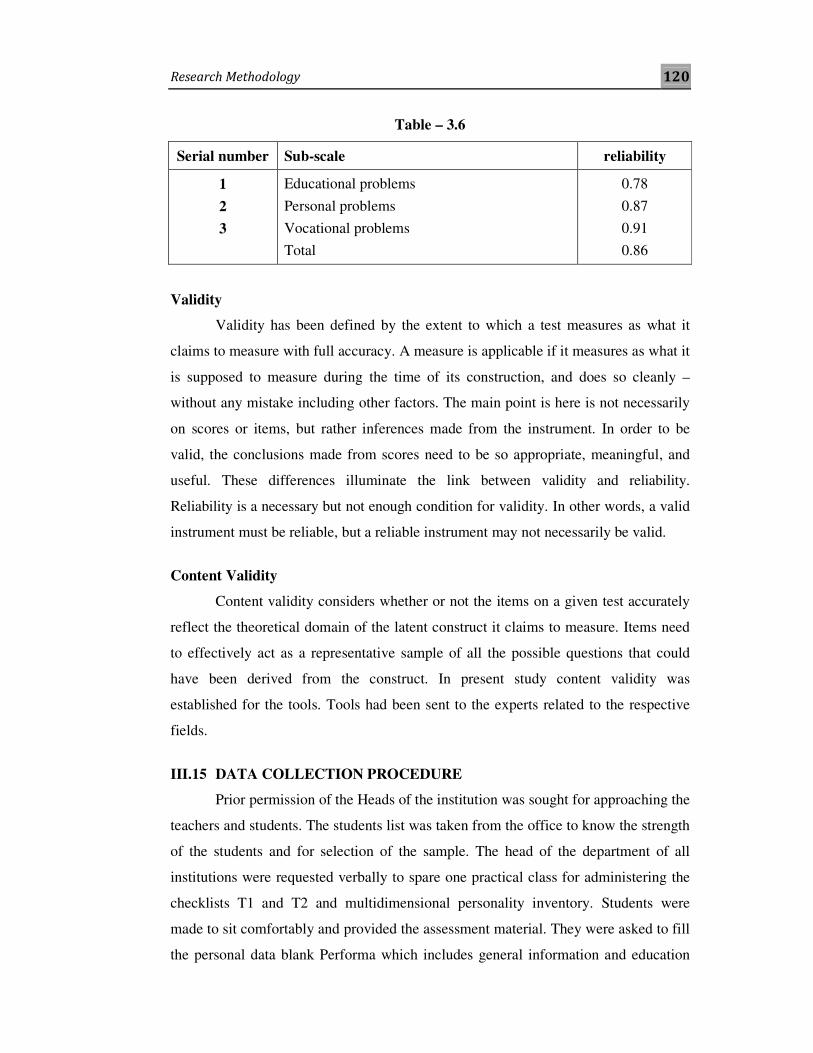
For the present study reliability of problem-checklist of students was
established by split-half method. For getting the reliability coefficient of the checklist
it was administered to a sample of 200 students of different professional courses. In
the sample, students of different professional courses have been randomly selected.
Split-half reliability was computed for the three selected subscale of the problems for
the checklist as well as total.
Research Methodology 120
Table – 3.6
Serial number Sub-scale reliability
1
2
3
Educational problems
Personal problems
Vocational problems
Total
0.78
0.87
0.91
0.86
Validity
Validity has been defined by the extent to which a test measures as what it
claims to measure with full accuracy. A measure is applicable if it measures as what it
is supposed to measure during the time of its construction, and does so cleanly –
without any mistake including other factors. The main point is here is not necessarily
on scores or items, but rather inferences made from the instrument. In order to be
valid, the conclusions made from scores need to be so appropriate, meaningful, and
useful. These differences illuminate the link between validity and reliability.
Reliability is a necessary but not enough condition for validity. In other words, a valid
instrument must be reliable, but a reliable instrument may not necessarily be valid.
Content Validity
Content validity considers whether or not the items on a given test accurately
reflect the theoretical domain of the latent construct it claims to measure. Items need
to effectively act as a representative sample of all the possible questions that could
have been derived from the construct. In present study content validity was
established for the tools. Tools had been sent to the experts related to the respective
fields.
III.15 DATA COLLECTION PROCEDURE
Prior permission of the Heads of the institution was sought for approaching the
teachers and students. The students list was taken from the office to know the strength
of the students and for selection of the sample. The head of the department of all
institutions were requested verbally to spare one practical class for administering the
checklists T1 and T2 and multidimensional personality inventory. Students were
made to sit comfortably and provided the assessment material. They were asked to fill
the personal data blank Performa which includes general information and education

Research Methodology 121
background of the students. The checklists were self administered to the students who
were selected randomly. The necessary instructions were given to the respondents
before filling the tools. Before starting the test all doubts of students were clarified
and all instructions on the tool were explained. The checklists were administered on
the same day with a gap of 10-15 min to avoid mental fatigue, as the test was lengthy.
The tests were administered on the same day to avoid chances of absenteeism. Since,
it has been likely to occur if the other part of the questionnaire was given on another
day. Researcher took totally 16 visits to collect the information. Few students were
omitted because they did not completely attend all the tests. They appeared for only
one or two tests. Final sample of the students was taken on the basis of complete
information’s filled by students.
III.16 ANALYSIS AND PRESENTATION OF DATA
Statistical analysis has been done on the basis of one-way ANOVA. ‘t’ test,
and Percentage,
Analysis of variance (ANOVA)-one-way
ANOVA is a statistical method that stands for analysis of variance. It is used
to test the significant of the differences among the sample means when the number of
samples was more than two
Use of ANOVA
These days, researchers are using ANOVA in many ways. The use of ANOVA
depends on the research design. The process of computing ANOVA was as follows:-
Formula:-
1. Sum of all the observation of various samples
= EX1 + EX2 + EX3..... EXn = G.T.
Where EX1, EX2, EX3....... EXn are the summation of the different samples.
2. Correction Factor (c.f.) = (G.T) 2 / N
Where G.T. =EX1 + EX2 + EX3.... EXn
N= Total number of observations.
3. The total sum of squares (T.S.S.):

Research Methodology 122
= EX12 + EX2
2 + EX32...... Exn
2 - T2/N
4. Sum of squares between the samples (SSB):
= 32 2 2
31 2
1 2 3
( )( ) ( ) ( )EXEX EX T
N N N N+ + +
Where, N1 and N2 are the total number of observation of respective groups.
5. Sum of squares within the sample (SSW)
SSW = TSS – SSB
ANOVA Table
Source of
variation d.f.
Sum of
squares S.S.
Mean sum of
squares M.S.S. F - Ratio
Between sample
C - 1 SSB MSSB = 1
SSB
C −
MSSB
MSSW
Within the Samples
N - C SSW MSSW = SSB
N C−
Total N - 1 TSS
To calculate the test of significant as F = MSSB/MSSW this was with d.f. as
(C-1, N-C). The level of significant was taken as .05 and .01 level of
significance.
In present research investigation Part-A deals with the entire group’s
differences which were examined by applying one way Analysis of Variance
(ANOVA) on the educational, personal and vocational problems of the
students of ED, EN, MD and MN courses.
t-test
‘t’ is the difference between two sample means measured in terms of the
standard error of those means, or ‘t’ is a comparison between two groups means
which takes into account the differences in group variation and group size of the two
groups. The test statistic that a t-test produces is a t-value.
Research Methodology 123
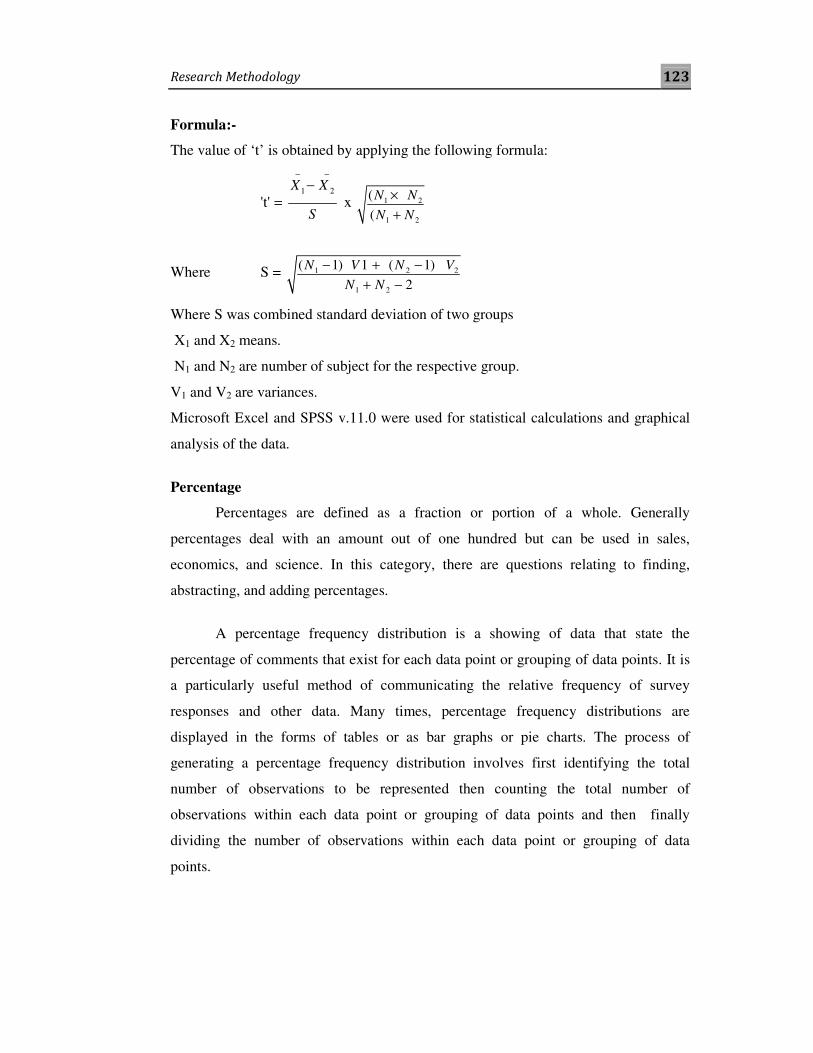
Formula:-
The value of ‘t’ is obtained by applying the following formula:
't' = 1 2X X
S
− −
−
x 1 2
1 2
(
(
N N
N N
×
+
Where S = 1 2 2
1 2
( 1) 1 ( 1)
2
N V N V
N N
− + −
+ −
Where S was combined standard deviation of two groups
X1 and X2 means.
N1 and N2 are number of subject for the respective group.
V1 and V2 are variances.
Microsoft Excel and SPSS v.11.0 were used for statistical calculations and graphical
analysis of the data.
Percentage
Percentages are defined as a fraction or portion of a whole. Generally
percentages deal with an amount out of one hundred but can be used in sales,
economics, and science. In this category, there are questions relating to finding,
abstracting, and adding percentages.
A percentage frequency distribution is a showing of data that state the
percentage of comments that exist for each data point or grouping of data points. It is
a particularly useful method of communicating the relative frequency of survey
responses and other data. Many times, percentage frequency distributions are
displayed in the forms of tables or as bar graphs or pie charts. The process of
generating a percentage frequency distribution involves first identifying the total
number of observations to be represented then counting the total number of
observations within each data point or grouping of data points and then finally
dividing the number of observations within each data point or grouping of data
points.
Research Methodology 124
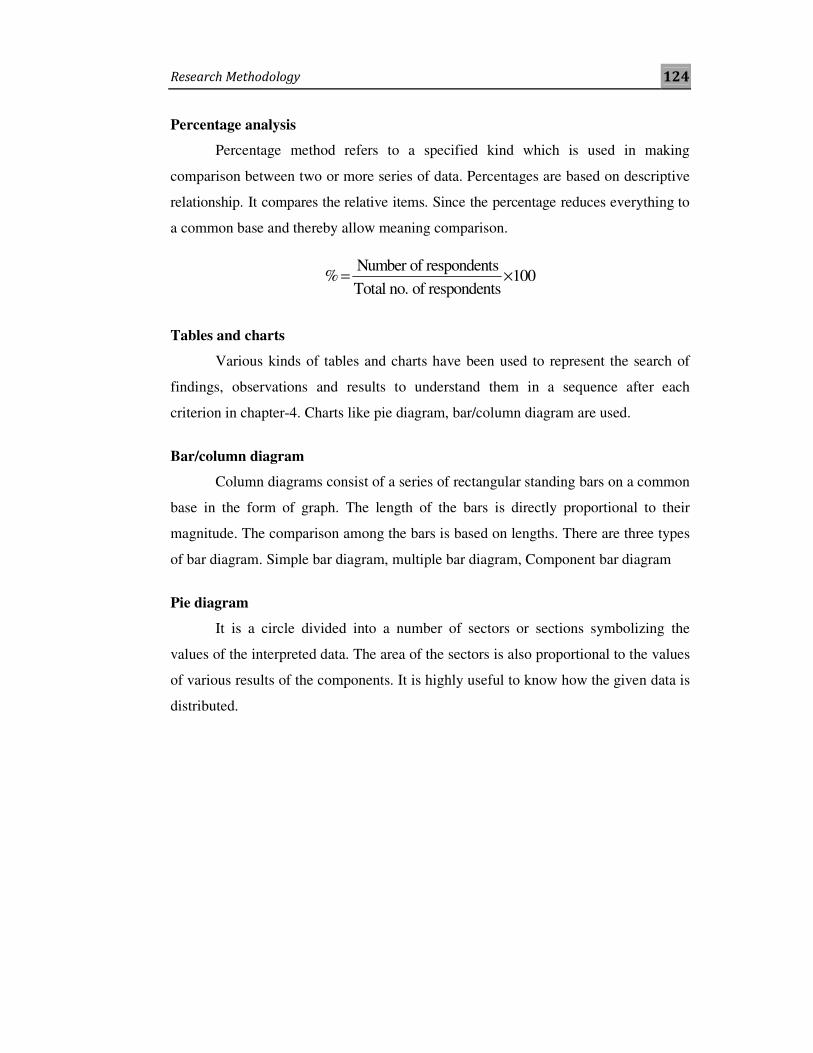
Percentage analysis
Percentage method refers to a specified kind which is used in making
comparison between two or more series of data. Percentages are based on descriptive
relationship. It compares the relative items. Since the percentage reduces everything to
a common base and thereby allow meaning comparison.
Number of respondents% 100
Total no. of respondents= ×
Tables and charts
Various kinds of tables and charts have been used to represent the search of
findings, observations and results to understand them in a sequence after each
criterion in chapter-4. Charts like pie diagram, bar/column diagram are used.
Bar/column diagram
Column diagrams consist of a series of rectangular standing bars on a common
base in the form of graph. The length of the bars is directly proportional to their
magnitude. The comparison among the bars is based on lengths. There are three types
of bar diagram. Simple bar diagram, multiple bar diagram, Component bar diagram
Pie diagram
It is a circle divided into a number of sectors or sections symbolizing the
values of the interpreted data. The area of the sectors is also proportional to the values
of various results of the components. It is highly useful to know how the given data is
distributed.