Embed Size (px)
Citation preview

digilib.uinsby.ac.id digilib.uinsby.ac.id digilib.uinsby.ac.id digilib.uinsby.ac.id digilib.uinsby.ac.id digilib.uinsby.ac.id digilib.uinsby.ac.id
42
CHAPTER III
RESEARCH METHOD
Research Method is a set of knowledge about sistematic and logic steps of
searching data related to certained problems to process, to analyze and to
summarize and to search fission measure.1 Research methodology consist of:
A. Research Design
Basically, a study is held to find out the answer from remanded question
to observed object. Therefore, it is important for researcher to determine a
proper strategy to answer and reach purpose worked out before. The most
popular approaches are qualitative approach and quantitative approach.
According to James Dean Brown and Theodore S.Rodgers, both states that
qualitative research approach is typically the label for non-numerical research
and quantitative research approach is a numerical research or there is
conversion data in the research. In other side, based on Grotjahn’s analysis that
experimental or non-experimental is data collection method, qualitative or
quantitative is type of data that resulted, statistical or interpretive is type of
analysis conducted on the data2 This study analyzed the effectiveness of GIST
strategy in increasing student reading comprehension in exploring descriptive
1Bahtiar Wahdi, Metode Penelitian Ilmu Dakwah (Jakarta: Logos, 2001), 16. 2James Dean Brown -Theodore.S Rodgers, Doing Second Language Research (New York: Oxford University Press, 2003), 15.
42

digilib.uinsby.ac.id digilib.uinsby.ac.id digilib.uinsby.ac.id digilib.uinsby.ac.id digilib.uinsby.ac.id digilib.uinsby.ac.id digilib.uinsby.ac.id
43
text. In this case, the researcher used quantitative method that concern on
experimental approach. The research design used in this study is quasi-
experimental design.
The reasons are firstly researcher wants to dig implementation GIST
stategy in reading skill has or has not effect for increasing student reading
comprehension inexploring descriptive text. Secondly, searching there is any
changes or not to the experimental group after implementation of GIST
strategy is a kind of experimental research. This matches with Jasa Ungguh
Muliawan who states that experimental research intents to prove the truth of
hyphothesis or argument in concrete plain.3 Beside, Quasi-experimental is all
populations or subject taken in this study to be chosen as a contol group and an
experimental group. The clear explanation of quasi-experimental design stated
by Donald Ary and friends, Donald regards quasi-experimental design 4 is
similar to randomized experimental designs. He explains in quasi-
experimental design, it involve manipulation of an independent variable but the
difference is the subjects are not randomly assigned to treatment groups,
because quasi-experimental design does not provide full control. He also adds
that quasi-experimental designs are considered worthwhile because it permits
3Jasa Ungguh Muliawan, PTK (Classroom Action Research) (Yoryakarta: Gavamedia, 2010), 72. 4Donald Ary, et.al., Introduction to Research in Education, Part Five: Research Method: Eighth Edition. (Canada: Wadsworth, Cengage Learning, 2010), 316.

digilib.uinsby.ac.id digilib.uinsby.ac.id digilib.uinsby.ac.id digilib.uinsby.ac.id digilib.uinsby.ac.id digilib.uinsby.ac.id digilib.uinsby.ac.id
44
researchers to reach reasonable conclusions even though full control is not
possible.
Researcher chose two classes which equal in reading skill abilty through
equal test, then researcher gave treatment to experimental group in periodic
measurement. In exact words, the researcher held test for two groups (control
group and experimental group) to examine the treatment effects. Because this
study collect data of student reading skill scores, the data of the test is numeric.
The researcher analyzed the data of test with SPSS statistics, this statistic
started with finding and comparing the mean of each scores, proving the true
hypothesis, and drawing conclusions to answer the research questions.
Tabel 3.1 Research Design
Group Pre-test Independent Variable
Post-test
E Y1 X Y2
C Y1 - Y2
Note:
E : experimental group
C : control group
Y1 : pre-test
Y2 : post-test
X : exploring descriptive text through GIST Strategy implementation
digilib.uinsby.ac.id digilib.uinsby.ac.id digilib.uinsby.ac.id digilib.uinsby.ac.id digilib.uinsby.ac.id digilib.uinsby.ac.id digilib.uinsby.ac.id
45
B. Variable of Research
1. Independent variable of this study is “ the implementation of GIST
Strategy” in exploring descriptive text in second grade of SMPN 4
Surabaya.
2. Dependent variable of this study is “ student reading comprehension" in
exploring descriptive text in second grade of SMPN 4 Surabaya.
C. Setting of Research
The setting of this study is in second grade 2015/2016 of SMPN 4
Surabaya in round semester on April and May. In second grade of SMPN 4,
there are seven classes; 8A, 8B, 8C, 8D, 8E, 8F, 8G. Researcher took four
classes 8D, 8E, 8F, 8G as the sample, three classes that not taken are 8A, 8B,
8C because in these classes contains some of inclusy students. Among 8D, 8E,
8F, 8G, researcher held a test to take two classes that equal in reading skill
ability. The two equal classes became a control group and an experimental
group. A control group is the group that does not receive the experimental
treatment. It receives a different treatment or no treatment at all.5 Whereas, an
experimental group is the group that is given the independent variable
treatment.6
5Ibid., 302. 6Ibid.

digilib.uinsby.ac.id digilib.uinsby.ac.id digilib.uinsby.ac.id digilib.uinsby.ac.id digilib.uinsby.ac.id digilib.uinsby.ac.id digilib.uinsby.ac.id
46
The location of SMPN 4 Surabaya is on street TanjungAnom 12
Surabaya. Phone number that can be called is (031) 5341431 and the website is
on www.smpn4sby.sch.id. In addition, the time setting consists of allocation
time for pretest, treatment that given to examine the treatment effect and post
test. This research is held fourteen times meeting; one meeting for equal test in
each four classes (class D, E, F, G), one meeting for pre-test in two groups,
experimental group (E class) and control group (G class), three meetings for
experiment implementation in experimental group, and three meetings for
conventional learning in control group, then one meeting in both group to
conduct post-test. Each meeting has duration 2x40 minutes. Day and time were
available with the schedule of English lesson in each class.
D. Population and Sample
Population in this research is second grade students in SMPN 4
Surabaya. The overall population of second grade students in SMPN 4 amounts
287 students (seven classes), but in taking the sample researcher eliminated 3
classes included inclusy students amounts 123 students in class A, B, and C.
Two of four classes other were chosen also through equal test. Equal-test is
conducted to 164 students (four classes) class D, E, F, and G. Those four
classes were eliminated two classes to get other two classes that have equal
ability in reading skill, based on equal-test score result. Then the sample of this
study amounts 82 students (each class amounts 41 students). One class is an

digilib.uinsby.ac.id digilib.uinsby.ac.id digilib.uinsby.ac.id digilib.uinsby.ac.id digilib.uinsby.ac.id digilib.uinsby.ac.id digilib.uinsby.ac.id
47
experimental group and the other is as control group. Researcher hopes the
chosen sample can be representative sample for all second grade students in
SMPN 4 Surabaya in observing student reading comprehension in exploring
descriptive text
E. Research Procedure
1. Measurement before experiment
Conducting this study started from test to determine two classes which
have equal ability in reading skill from four classes. After knowing those
two classes, researcher divided into two groups; one class as experimental
group -which got treatment in form of implementing GIST Strategy in
improving student reading comprehension- and one class as control group -
which accepting no treatment in reading skill learning-. The measurement
held before experiment was pre-test. This test was conducted to control
group and experimental group. The purpose of this test was to know student
reading comprehension in exploring descriptive text before treatment and
make the same of the beginning condition between control group and
experimental group. The result of pre-test between control group and
experimental group was tested with statistical pattern to know the
differences of both group comprehension.

digilib.uinsby.ac.id digilib.uinsby.ac.id digilib.uinsby.ac.id digilib.uinsby.ac.id digilib.uinsby.ac.id digilib.uinsby.ac.id digilib.uinsby.ac.id
48
2. Experiment implementation
After ensuring that control group and experimental group have same
comprehension, experiment implementation was held by giving treatment
through GIST strategy. GIST strategy only was held to experimental group,
control group accept no treatment at all. During experimental group get the
treatment in GIST Strategy form, control group had a conventional learning.
a. Experimental group
The experimental group got the treatment in learning process of
exploring descriptive text through GIST Strategy implementation. The
steps of GIST strategy implementation in planning of descriptive text
learning are:
1) Before beginning the classroomwork;
a) first, teacher discussed with students what a GIST Strategy is and
why it is a useful strategy.
b) then modelling the GIST process using a descriptive text. Teacher
might use an overhead projector to allow the whole class to read and
discuss sample text together.
c) having students read the article along with teacher, using the
overhead projector, together fill in the "5Ws and H"-who, what, where,
when, why, and how-on the GIST Template.
d) then asking students to try writing their own GISTs.

digilib.uinsby.ac.id digilib.uinsby.ac.id digilib.uinsby.ac.id digilib.uinsby.ac.id digilib.uinsby.ac.id digilib.uinsby.ac.id digilib.uinsby.ac.id
49
e) next, sharing teacher’s GIST with the class and asking students to
share theirs.
If students need additional time to master the concept, researcher
repeated GIST session discussing with a new descriptive text before
moving on to classroom work session.
2) Beginning the classroom work, teacher reviewed how GIST works
and the explanation more about it.
3) Students identified and explored the descriptive text of the first
paragraph and get the important information in the first paragraph
4) Students wrote with their own words the important information as the
main point of first paragraph
5) Henceforth, students read the next paragraph, identifying the
important information in that paragraph and writing it in their own words
6) This continued till the end of paragraph.
7) Teacher and students discussed the content of text. In this session,
teacher could point some of students to share their own GIST, teacher
controleds and provided to right and check the answer,
8) Students wrote the learning experience today
9) Teacher evaluate the learning process

digilib.uinsby.ac.id digilib.uinsby.ac.id digilib.uinsby.ac.id digilib.uinsby.ac.id digilib.uinsby.ac.id digilib.uinsby.ac.id digilib.uinsby.ac.id
50
b. Control group
This control group did not get any treatment and the learning process was
held in a conventional learning without GIST strategy implementation. The
planned learning of control group are:
1) Teacher explained the lesson in form of conventional learning style
2) Teacher gave the descriptive text to students
3) Students did the task of exploring descriptive text
4) Students collected the work
Researcher in this control group, was as a teacher and controller. The
documentations were expropriated by co-observer.
3. Measurement after experiment
After that, researcher continued to hold post-test to control group and
experimental group. This test held to know the achievement of both group after
getting the treatment. Then, from the test result became ascertainable the
difference score before treatment (pre-test) and after treatment (post-test).
From those scores, it became ascertainable wether there was a raising, constant,
or even lowering. The result was as consideration to prove the effectiveness of
GIST strategy.

digilib.uinsby.ac.id digilib.uinsby.ac.id digilib.uinsby.ac.id digilib.uinsby.ac.id digilib.uinsby.ac.id digilib.uinsby.ac.id digilib.uinsby.ac.id
51
F. Data and Source of Data
The term of data collection task began after defining a research problem
and ensuring research design. The researcher should decide from two types of
data collection method used in this study, either primary or secondary. C. R.
Kothari a Former Principal, a College of Commerce in University of Rajasthan,
Jaipur (India) defines that primary data are data collected individually and for
the first time, and it happens to be original in character whereas, he defines that
secondary data, are data which have already been collected by someone else
and have already been passed through the statistical process. He adds that the
researcher should decide which sort of data that used for the study and select
one or the other method of data collection.7 Data in this study are:
1. Primary Data
The primary data of this study is the data forms of student reading
comprehension either the class used GIST Strategy in reading learning or
not in second grade of SMPN 4 Surabaya.
2. Secondary Data
The secondary data is the forms of supporting data gotten from some
sources, they were attendance lists of students from two classes at second
7 C. R. Kothari, Research Methodology: Methods & Techniques (New Dhelhi: New Age International,2004), 95. http://www.suza.ac.tzsarisdownload132376585119680689-Research-MethodologyMethods-and-Techniques-by-CR-Kothari.pdf%202.pdf retrieved on January, 06th 2016 07:50.
digilib.uinsby.ac.id digilib.uinsby.ac.id digilib.uinsby.ac.id digilib.uinsby.ac.id digilib.uinsby.ac.id digilib.uinsby.ac.id digilib.uinsby.ac.id
52
grade of SMPN 4, sylabus and schedule. Furthermore, the researcher took
pictures as proof of student documentation occurred in classroom. Some
theories were also taken by the researcher to support the data obtained. The
sources of both primary and secondary data are from teachers, students, and
the research presence at SMPN 4 Surabaya. The primary data were obtained
by implementing GIST strategy in teaching reading also conducting
classroom documentation in two classes which the first group were taught
by using GIST strategy and the other group without GIST strategy. The
secondary data were obtained by asking the copies of attendance list to the
teachers in two classes and academic office in SMPN 4 Surabaya.
Furthermore, the researcher was assisted by co observer to take pictures in
classroom for documentation.
G. Data Collection Technique and Instrument
1. Research Instrument Development
According to experts, Suharsimi, instrument is a tool which chosen
and used by researcher in agenda to collect it systematically and easily. 8
Moreover, Ibnu Hadjar states instrument is a measurer to get quantitative
information about variant of variable characteristics objectively.9 In essentials,
instrument is a tool in collecting data in a research. Collected data described
8Arikunto, Suharsimi. Manajemen Penelitian. (Jakarta: Rineka Cipta, 2000), 134. 9Hadjar, Ibnu. Dasar-dasar Metodologi Penelitian Kwantitatif dalam Pendidikan (Jakarta:Raja Grafindo Persada,1996),60.

digilib.uinsby.ac.id digilib.uinsby.ac.id digilib.uinsby.ac.id digilib.uinsby.ac.id digilib.uinsby.ac.id digilib.uinsby.ac.id digilib.uinsby.ac.id
53
and used to test a hypothesis in a research. Because of validity and reliability of
acquired data, instrument becomes very important in determining research
quality. Instrument also has a purpose to utter facts to data. When instrument
has a good quality means valid and reliable, acquired data was proper with the
fact and conversely. To understand the instrument development, there are some
matters about instrument development: types of instrument, steps of
instrument’s arrangement and development included instrument items, and
validation process. Types of reseach instrument:
a. Test b. Questionaire c. Interview
a. Observation e. Rating scale f. Documentation
Generally the instrument’s development are:
a. Based on the inspected theory of variable and defining it.
b. Identifying and developing dimension and indicator variable.
c. Arranging instrument lattice work in specification tabel contains
dimension, indicator, item number, item amount.
d. Determining the intensity level.
e. Writing process to instrument items in a question or statement form.
f. The items have to pass the validation process.
g. Revision or improvement according to expert judgements.10
10Muljono, Pudji, Penyusunan dan Pengembangan Instrument. Retrieved on April, 25th 2016 07.45
http://staff.ui.ac.id/system/files/users/dewi_g/material/instrumenpenelitian.pdf

digilib.uinsby.ac.id digilib.uinsby.ac.id digilib.uinsby.ac.id digilib.uinsby.ac.id digilib.uinsby.ac.id digilib.uinsby.ac.id digilib.uinsby.ac.id
54
The test used in pre-test and post-test was multiple choice which
arranged based on Barret Taxonomy. There were five steps conducted in Barret
Taxonomy:
1) Literal Comprehension ; A recall skill about written fact pieces in the text.
2) Reorganization; A skill in analyzing, synthesizing, get and arrange the
ideas which explored explicitly in the text.
3) Inferential Comprehension; A skill to share ideas in intuition and personal
experiences for the basic to solve the problems.
4) Evluation; A skill to ensure and evaluate the quality, carefulness, or
advantages in the text.
5) Appreciation; Reward to some elements of writer’s purpose emotionally,
sensitively in aesthetics, and giving reactions to the text moral value.
Whereas, for the treatment score with GIST Strategy implementation
was scored with a “Rubric for Assessing Summary Writing”. This because
GIST Strategy is not only a strategy used in reading skill but this stategy also
demands students to elect and eliminate various facts and keywords in one
summary sentence, therefore the “Rubric for Assessing Summary Writing”
used in this study to score.11
11 Nancy Frey, et.al., “ What’s the Gist?” Summary Writing for Struggling Adolescent Writers,” Voices from the Middle, Vol.11 No.2, Desember 2003, 48.
digilib.uinsby.ac.id digilib.uinsby.ac.id digilib.uinsby.ac.id digilib.uinsby.ac.id digilib.uinsby.ac.id digilib.uinsby.ac.id digilib.uinsby.ac.id
55
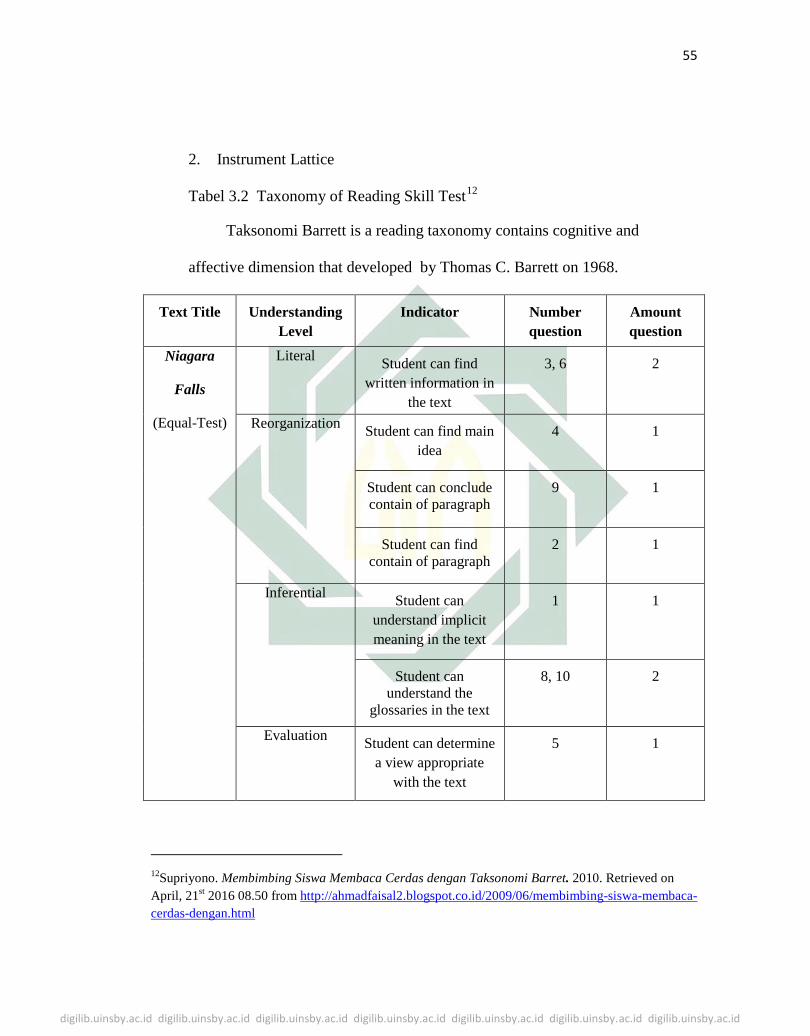
2. Instrument Lattice
Tabel 3.2 Taxonomy of Reading Skill Test12
Taksonomi Barrett is a reading taxonomy contains cognitive and
affective dimension that developed by Thomas C. Barrett on 1968.
Text Title Understanding Level
Indicator Number question
Amount question
Niagara
Falls
(Equal-Test)
Literal Student can find written information in
the text
3, 6 2
Reorganization Student can find main idea
4 1
Student can conclude contain of paragraph
9 1
Student can find contain of paragraph
2 1
Inferential Student can understand implicit meaning in the text
1 1
Student can understand the
glossaries in the text
8, 10 2
Evaluation Student can determine a view appropriate
with the text
5 1
12Supriyono. Membimbing Siswa Membaca Cerdas dengan Taksonomi Barret. 2010. Retrieved on April, 21st 2016 08.50 from http://ahmadfaisal2.blogspot.co.id/2009/06/membimbing-siswa-membaca-cerdas-dengan.html

digilib.uinsby.ac.id digilib.uinsby.ac.id digilib.uinsby.ac.id digilib.uinsby.ac.id digilib.uinsby.ac.id digilib.uinsby.ac.id digilib.uinsby.ac.id
56
Appreciation Sharing the ideas 7 1
Text Title Understanding Level
Indicator Number question
Amount question
Bees
(Equal-Test)
Literal Student can find written information in
the text
13, 15, 18 3
Reorganization Student can find main idea
12 1
Student can conclude contain of paragraph
19 1
Student can find contain of paragraph
14 1
Inferential Student can understand implicit meaning in the text
11 1
Student can understand the
glossaries in the text
17 1
Evaluation Student can determine a view appropriate
with the text
16 1
Appreciation Sharing the ideas 20 1

digilib.uinsby.ac.id digilib.uinsby.ac.id digilib.uinsby.ac.id digilib.uinsby.ac.id digilib.uinsby.ac.id digilib.uinsby.ac.id digilib.uinsby.ac.id
57
Text Title Understanding Level
Indicator Number question
Amount question
Festival of
Water
(Pre-Test)
Literal Student can find written information in
the text
4, 10 2
Reorganization Student can find main idea
2 1
Student can conclude contain of paragraph
7 1
Student can find contain of paragraph
8 1
Inferential Student can understand implicit meaning in the text
1 1
Student can understand the
glossaries in the text
5 1
Evaluation Student can determine a view appropriate
with the text
3 1
Appreciation Sharing the ideas 6, 9 2
Text Title Understanding Level
Indicator Number question
Amount question
Jellyfish
(Pre-Test)
Literal Student can find written information in
the text
16 1

digilib.uinsby.ac.id digilib.uinsby.ac.id digilib.uinsby.ac.id digilib.uinsby.ac.id digilib.uinsby.ac.id digilib.uinsby.ac.id digilib.uinsby.ac.id
58
Reorganization Student can find main idea
12 1
Student can conclude contain of paragraph
18 1
Student can find contain of paragraph
15 1
Inferential Student can understand implicit meaning in the text
11, 20 2
Student can understand the
glossaries in the text
19 1
Evaluation Student can determine a view appropriate
with the text
13, 14 2
Appreciation Sharing the ideas 17 1
Text Title Understanding Level
Indicator Number question
Amount question
Kiwi
(Post-Test)
Literal Student can find written information in
the text
5, 7 2
Reorganization Student can find main idea
4 1
Student can conclude contain of paragraph
9 1

digilib.uinsby.ac.id digilib.uinsby.ac.id digilib.uinsby.ac.id digilib.uinsby.ac.id digilib.uinsby.ac.id digilib.uinsby.ac.id digilib.uinsby.ac.id
59
Student can find contain of paragraph
8 1
Inferential Student can understand implicit meaning in the text
1 1
Student can understand the
glossaries in the text
3, 6 2
Evaluation Student can determine a view appropriate
with the text
2 1
Appreciation Sharing the ideas 10 1
Text Title Understanding Level
Indicator Number question
Amount question
The Houses
of the
Toraja
(Post-Test)
Literal Student can find written information in
the text
13, 14, 17 3
Reorganization Student can find main idea
19 1
Student can conclude contain of paragraph
15 1
Student can find contain of paragraph
12 1
Inferential Student can understand implicit meaning in the text
11 1

digilib.uinsby.ac.id digilib.uinsby.ac.id digilib.uinsby.ac.id digilib.uinsby.ac.id digilib.uinsby.ac.id digilib.uinsby.ac.id digilib.uinsby.ac.id
60
Student can understand the
glossaries in the text
20 1
Evaluation Student can determine a view appropriate
with the text
16 1
Appreciation Sharing the ideas 18 1
Tabel 3.3 Assessing Summary Writing For GIST Strategy
4 3 2 1
Length 8-10 sentences 11 sentences 12 sentences 12+sentences
Accuracy All statements
accurate and
verified by
story
Most statements
accurate and
verified by story
Some statements
cite outside
information or
opinion
Most statements
cite outside
information or
opinions
Paraphrasing No more than
4 words in a
row taken
directly from
story
One sentence
contains more
than 4 words in a
row taken directly
from story
Two sentences
contains more
than 4 words in a
row taken directly
from the story
3+ sentences
contain more than
4 words in a row
taken directly
from story
Focus Summary
consists of
main idea and
important
details only
Summary
contains main
idea and some
minor details
Summary
contains main
idea and only
minor details
Main idea of story
is not discussed

digilib.uinsby.ac.id digilib.uinsby.ac.id digilib.uinsby.ac.id digilib.uinsby.ac.id digilib.uinsby.ac.id digilib.uinsby.ac.id digilib.uinsby.ac.id
61
Conventions No more than
one
punctuation,
grammar, or
spelling eror
2-3 punctuation,
grammar, or
spelling eror
4-5 punctuation,
grammar, or
spelling eror
6+ punctuation,
grammar, or
spelling eror
3. Question Item Writing and Validation
The research instrument used in this study is multiple choice test.
The process of item question writing was based on the taxonomy barret. The
usage of Barraet Taxonomy was tought capable of measuring student reading
comprehension in exploring descriptive text. the amount of item question in
this study is 40 items which validated to choose 20 item for pre-test and 20
items for post-test with A, B, C, D as answer option. The test assessment
system was 2 score for the true answer based on the answer key and zero for
the false one. Before, the test question was validated first by the expert
judgement in reading skill. The test tested by asking the compatibility among
research instrument and learning objective, material, also applied curriculum.
H. Data Analysis Technique
Data analysis is activity dividing and tabulating data based on its variable
and type of responden, providing data of each variable, do consideration and
calculation to examine presented hypothesis. Data in this study is obtained
from research subject score to show how far the student reading
comprehension improvement. The purpose of this study is to provide certain

digilib.uinsby.ac.id digilib.uinsby.ac.id digilib.uinsby.ac.id digilib.uinsby.ac.id digilib.uinsby.ac.id digilib.uinsby.ac.id digilib.uinsby.ac.id
62
data about the effectiveness of GIST Strategy implementation to student
reading comprehension. In this study, the score was counted in two steps:
counting equal-test result to determine two groups have same ability that as
experimental and control group, then counting pre-test of both groups and post-
test of both groups.
In counting equal-test result, the first step was collecting data from equal-test
result of each classes, next step was tabulating the result score in a tabel. Then
researcher showed average score (mean) from each classes.
The pattern used is13 : �𝑀 = Ʃ𝑥𝑁�
Note :
M = mean (average score)
∑X = score result of all respondens
N = responden amount
This pattern has a purpose to get average score in each class which are
calculated or accounted one by one in term of mean ,by adding up all scores
and divided by the number of items above. The next track was through One
Way ANOVA. One Way ANOVA or one way analysis variance was used to
test the difference of average score between two or more independent data
groups.14 In this case, equal-test score result was not qualified, those were
13Aqib Zainal,et.al., Penelitian Tindakan Kelas. (Bandung: YRAMA WIDYA, 2011), 204. 14Priyatno, Duwi. 5 Jam Belajar Olah Data Dengan SPSS 17. (Yogyakarta: ANDI Offset, 2009), 82.

digilib.uinsby.ac.id digilib.uinsby.ac.id digilib.uinsby.ac.id digilib.uinsby.ac.id digilib.uinsby.ac.id digilib.uinsby.ac.id digilib.uinsby.ac.id
63
normality and homogeneity. Because those assumptions were not qualified, the
test of statistics was replaced by Kruskall Wallis15 and continued with test
Mann whitney U16 to know which class was same or different.
Whereas in counting pre-test or post-test score result, the beginning step
was same as track above but the next track was through Independent Sample T
Test which to test two mean of two independent data groups.17 In this case,
once again the assumptions about normality and homogeneity were not
qualified, the test of statistics was replaced by test Mann Whitney U to know
whether there was the difference of pre-test and post-test average score or not
between experimental and control group and in this sense researcher chose to
count the score through SPSS. In additional, the result of test Mann Whitney U
in post-test brought to check hypothesis for drawing conclusion.
If a significance value in post-test result < 0,05 means that the hyphothesis
alternative is accepted (There is a difference average score between
experimental and control group by annotation that average score of
15Laerd Statistics. https://statistics.laerd.com/spss-tutorials/kruskal-wallis-h-test-using-spss-statistics.php retrieved on June, 09th 2016 13:24 For further information: Kruskal-Wallis test is a rank-based nonparametric test that used to determine whether there is difference between two or more independent data. Besides it is to test ordinal scale data and without presupposing the data is normal distribution 16 https://explorable.com/mann-whitney-u-test retrieved on June, 09th 2016 13:35, for further explanation: Mann-Whitney U-test is also known as the Mann-Whitney-Wilcoxon (MWW) or Wilcoxon Rank-Sum Test. It is to test whether there is difference between two independent data. It is also for ordinal scale data and without presupposing the data is normal distribution. 17Ibid, 188.

digilib.uinsby.ac.id digilib.uinsby.ac.id digilib.uinsby.ac.id digilib.uinsby.ac.id digilib.uinsby.ac.id digilib.uinsby.ac.id digilib.uinsby.ac.id
64
experimental group is higher than control group), in other word,
implementation of GIST Strategy is effective to increase student reading
comprehension in exploring descriptive text.
On the contrary, If a significance value in post-test result > 0,05 means
that the hyphothesis null is accepted It can be concluded that if after getting
the result that GIST Strategy implementation affects to increase students
reading comprehension in exploring descriptive text.
Tabel 3.4 Teaching Journal Of SMPN 4 Surabaya
Numb. DATE CLASS DAY DESCRIPTION
1 27 April 2016 VIII F Wednesday Equal-Test
2 28 April 2016 VIII G Thursday Equal-Test
3 28 April 2016 VIII D Thursday Equal-Test
4 02 May 2016 VIII E Monday Equal-Test
5 03 May 2016 VIII E Tuesday Pre-Test (X)
6 05 May 2016 VIII G Thursday Pre-Test (C)
7 09 May 2016 VIII E Monday Experiment 1
8 09 May 2016 VIII G Monday Task 1
9 10 May 2016 VIII E Tuesday Experiment 2
10 12 May 2016 VIII G Thursday Task 2

digilib.uinsby.ac.id digilib.uinsby.ac.id digilib.uinsby.ac.id digilib.uinsby.ac.id digilib.uinsby.ac.id digilib.uinsby.ac.id digilib.uinsby.ac.id
65
11 16 May 2016 VIII E Monday Experiement 3
12 16 May 2016 VIII G Monday Task 3
13 17 May 2016 VIII E Tuesday Post-Test
14 19 May 2016 VIII G Thursday Post-Test