Embed Size (px)
Citation preview

23
CHAPTER III
RESEARCH METHOD
This study focuses on the effectiveness of comic strips as a media in teaching
writing in helping students in generating idea to start writing. This chapter presents
the methodology of the research. It consists of the research design, the variable of the
research, the research subject, the data collection technique and the research
instrument, the scoring technique, the research procedure, and the data analysis
technique.
A. Research Design
This study was a quantitative research. As this research aims at the
effectiveness of comic strips as a media in teaching English writing text, the
quantitative method appropriate to the purpose of this research. This study is
educational research so the researcher used a quasi experimental research
design.1
Experimental research is the way to find a causal relationship between
two factors that are deliberately caused by the researcher by reducing or setting
aside other factors that interfere. Experiments are always done to examine a
treatment seriously.2 A quasi experimental design is similar with an experimental
design but the key ingredient-random assignment is definite. In this design, the
1 Donald Ary. Introduction to Research in Education 8th Edition. (USA: Wadsworth.2010). 316 2 Suharsimi Arikunto, Prosedur Penelitian Suatu Pendekatan Praktek (Jakarta: Bima Aksara, 1987). 3
Edited with the trial version of Foxit Advanced PDF Editor
To remove this notice, visit:www.foxitsoftware.com/shopping

24
subject cannot be decided randomly to either the experimental or the control
group.3
With this quasi experimental design, there were two groups, the control
group and the experimental group. The two classes of the eighth grade in MTs.
At-Taqwa Kalangayar Lamongan were selected as the control group and
experimental group. Before the treatment, both of them were given a test. The
purpose of the test was to know if both groups had similar ability in writing
before the implementation of comic strips as a media. On the next meeting, the
treatment was given to the experimental group for two times. It is based on the
head master permission. The treatment was administered to the experimental
group, while the control group was taught as usual without manipulation. The
control group was taught by traditional media (LKS) and the experimental group
was taught by comic strips as a media. On the last meeting, a final test was
conducted on two classes of control and experimental groups. The purpose of this
test was to know whether teaching writing using comic strips as a media is more
effective than teaching writing using traditional media.
B. Variable of the Research
There were two variables in this study. They were independent variable
and dependent variable. Independent variable is a variable that who’s variable
3 William M. K. Trochim, The Research Methods Knowledge Base, 2nd Edition (Ithaca, N.Y: Cornell
Custom Publishing, 1999).215
Edited with the trial version of Foxit Advanced PDF Editor
To remove this notice, visit:www.foxitsoftware.com/shopping

25
that is selected, manipulated, and measured for investigation.4 In this study, the
application of comic strips is the independent variable. While, the dependent
variable is a variable that is observed and measured in order to determine the
effect of the independent variable. The students’ writing ability is the dependent
variable.5
C. Population and Sample
The population is the students in junior high school in Indonesia. As Ary
states that the first step in sampling is the identification of the target population,
the large group to which the researcher want generalize the results of the
research.6 The target population of this study was the students of Junior High
School in medium quality in Indonesia. This medium level is approved by the
accreditation “B” from BAN (National Accreditation). The population of junior
high school students in Indonesia is so large that cannot be listed all to determine
a sample. We make a distinction between the target population and the accessible
population, which is the population of subjects accessible to the researcher for
determine a sample.7 In this case, the accessible population that has medium
quality is MTs. At-Taqwa, Lamongan.
4 Susanto, Developing a Research Proposal a Practical Guideline. (Surabaya: UNESA University
Press.2002).10 5 Ibid.10 6 Donald Ary. Introduction to ....................149 7 Ibid.149
Edited with the trial version of Foxit Advanced PDF Editor
To remove this notice, visit:www.foxitsoftware.com/shopping

26
Then, the sample was the eighth grade at MTs. At-Taqwa, Lamongan. It
was selected because the students have some problem in writing class. Based on
the pre-observation, the teacher said that the students’ writing achievement was
poor. In addition the worst one was the eighth grade, so the research focused on
the eighth graders. Besides, the researcher was an alumnus from this school.
Therefore the researcher wants to give a kind of contribution to increase the
quality there.
D. Data Collection Technique and Research Instrument
1. Data Collection Technique
In this study, the data were collected from the test. First, before the
treatment, the test was administered to both groups to measure the students’
English writing ability. The data was collected through the test in both
classes in order to know whether the experimental group and control group
had similar ability before the implementation of comic strips as a media in
teaching writing.
Then, a final test was given to the experimental group and control
group. It was used to give information about students’ ability to write texts
after getting the treatment. The use of the final test also determines whether
the treatment was effective by comparing the achievement of final test scores
in both classes those experimental and control. The treatment was done for
two times which was based on head master permission.
Edited with the trial version of Foxit Advanced PDF Editor
To remove this notice, visit:www.foxitsoftware.com/shopping
27
2. Instrument
Instrument is needed to collect the data. The appropriate instrument
for this research is test. The test was by conducted by asking the students
both in experimental and control classes .to write a recount text. Then, the
scoring criteria were established before assessing writing.
a. Validity
This study used content validity to construct the test. Content validity
demands that the test should be constructed as to contain a representative
of the course, the relationship between the test items and the course of
objective always being clear.8 To fulfill the content validity, the content
of the test was matched with the curriculum provided i.e. text books
material that was used this school and based on the teacher. In this case,
the instrument was validated by the teacher.
E. Scoring Technique
In this study, it used methods of scoring which each number of aspects is
analyzed and needs separate the score.9 The scoring technique can be modified
based on the specific assessment rubric.10 In this study, the scoring technique is
according to Jacob et.al.11 by a little modification.
8 Sugiyono, Statistika untuk Penelitian, (Bandung: Alfabeta.2010). 353 9 Arthur Huges, Testing for Language Teachers. (Cambridge: Cambridge University Press).100 10 Ristyana Primadani. The Effectiveness of Using Short Note in Teaching Writing at SMP Negeri 1
Bangsal Mojokerto. (Unpublished S1 Thesis English Education Department IAIN Sunan Ampel Surabaya, 2011).31
11 Arthur Huges, Testing For ......................................104
Edited with the trial version of Foxit Advanced PDF Editor
To remove this notice, visit:www.foxitsoftware.com/shopping

28
Table 3.1 Writing Proficiency Score Categories
ESL Composition Profile12
Component Score Criteria
Content
Excelent 30-27
Knowledgeable; the content of the paragraph
relevant to the assigned topic. Thorough
development details
Good 26-22 Most of content support the topic but lack
details.
Fair 21-17
Limited knowledge; the content of the
paragraph has to be more develop,
inadequate development of the topic.
Poor 16-13 The content of the paragraph is not develop,
Organization
Excelent 20-18
Well organize and complete generic
structure of recount (orientation, events,
conclusion), ideas are clearly stated, logical
sequencing of events.
Good 17-14
Logical sequence of generic structure
(orientation, events, conclusion), loosely
organized but main ideas stand out, limited
supported
Fair 13-10
Lack logical sequencing of generic structure
(orientation, events, conclusion), Ideas
confused or disconnected,
Poor 9-7 No generic structure (orientation, events,
conclusion), does not communicate
Vocabulary Excelent 20-18 Appropriate language feature of recount text,
12 Ibid.104
Edited with the trial version of Foxit Advanced PDF Editor
To remove this notice, visit:www.foxitsoftware.com/shopping

29
effective word choice and usage, the
meaning is understandable.
Good 17-14
Appropriate language feature of recount text,
occasional errors of word choice but
meaning not obscured
Fair 13-10
Inappropriate language feature of recount
text, frequent errors of word choice but
meaning obscured
Poor 9-7
Inappropriate language feature of recount
text, many errors of word choice, not enough
to evaluate
Language
use
Excelent 25-22
Words showing the order events, the use of
simple past tense, action verb, articles,
proper noun and pronouns.
Good 21-18
Limited showing the order events, the use of
simple past tense, action verb, articles,
proper noun and pronouns but meaning
seldom obscured.
Fair 17-11
Mention the order of event rarely, major
problem in the use of simple past tense,
action verb, articles, proper noun and
pronouns but meaning obscured.
Poor 10-5
Did not mention the order of event,
dominated by errors the use of simple past
tense, action verb, articles, proper noun and
pronouns, did not communicate
Mechanics Excelent 5 Readable, few errors of spelling
Good 4 Readable but occasional errors of spelling
Edited with the trial version of Foxit Advanced PDF Editor
To remove this notice, visit:www.foxitsoftware.com/shopping

30
but meaning not obscured
Fair 3 Readable but frequent errors of spelling but
meaning obscured
Poor 2
Unreadable, dominated by errors of spelling,
did not
Communicate
Score:
Content+ organization+ Vocabulary+ Language use+ Mechanics = ____ (total)
(appendix 8)
F. Research Procedure
The procedure of this study covered the following steps, namely: pre
treatment, treatment of experimental, treatment of control group and final test.
Table 3.2 Research Schedule
NO Task Description Output Target
completion date
1. Pre observation
Observe the eighth class while the teacher teaches writing
To know they way of the English teacher to teach writing class
11 May 2013
2. Pre-treatment test
All of the students at MTs At-Taqwa is given the pre test to know the score which is to determine the sample
To decide two classes that have same level in writing to determine the sample
18 May 2013
3. Treatment 1 for
Taught using Comic strips
Students can write recount easily to
23 May 2013
Edited with the trial version of Foxit Advanced PDF Editor
To remove this notice, visit:www.foxitsoftware.com/shopping
31
experimental class
As media to write recount
generate their idea by using comic strips
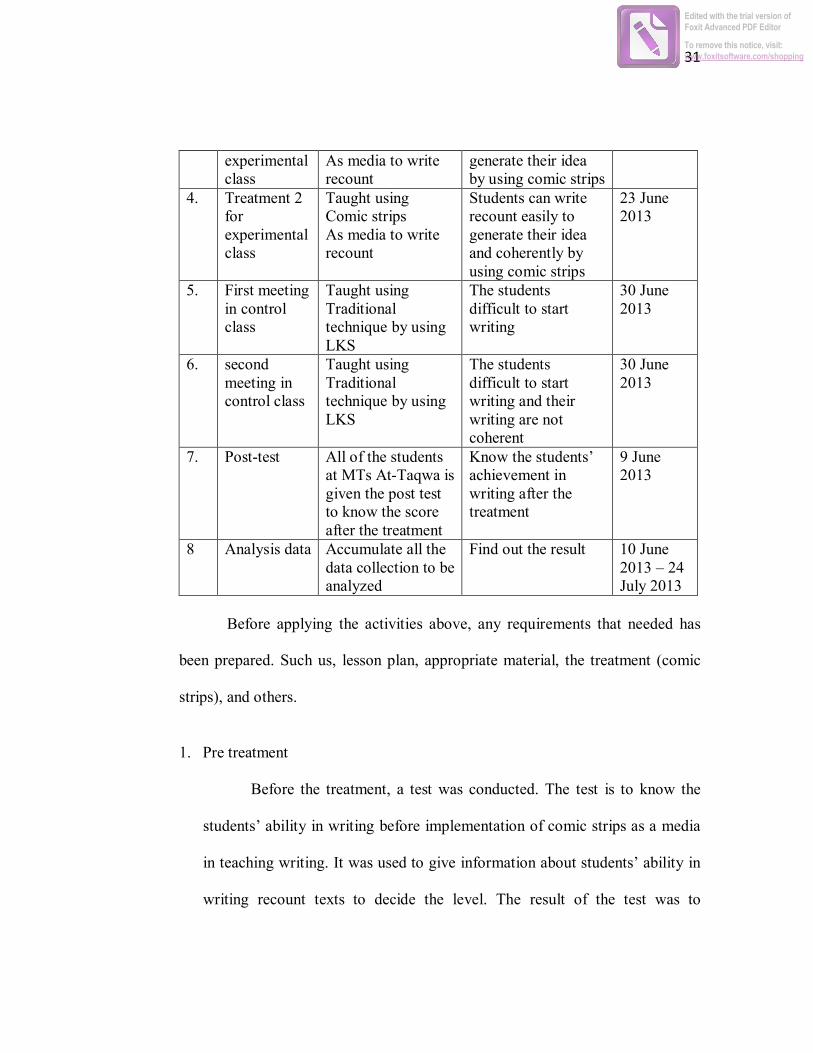
4. Treatment 2 for experimental class
Taught using Comic strips As media to write recount
Students can write recount easily to generate their idea and coherently by using comic strips
23 June 2013
5. First meeting in control class
Taught using Traditional technique by using LKS
The students difficult to start writing
30 June 2013
6. second meeting in control class
Taught using Traditional technique by using LKS
The students difficult to start writing and their writing are not coherent
30 June 2013
7. Post-test All of the students at MTs At-Taqwa is given the post test to know the score after the treatment
Know the students’ achievement in writing after the treatment
9 June 2013
8 Analysis data Accumulate all the data collection to be analyzed
Find out the result 10 June 2013 – 24 July 2013
Before applying the activities above, any requirements that needed has
been prepared. Such us, lesson plan, appropriate material, the treatment (comic
strips), and others.
1. Pre treatment
Before the treatment, a test was conducted. The test is to know the
students’ ability in writing before implementation of comic strips as a media
in teaching writing. It was used to give information about students’ ability in
writing recount texts to decide the level. The result of the test was to
Edited with the trial version of Foxit Advanced PDF Editor
To remove this notice, visit:www.foxitsoftware.com/shopping

32
determine the control group and experimental group. The test was conducted
by asking the students to write a recount text but without any help (media).
The result of this test is presented in the following table.
Table 3.3 The Result of Control Group
Component The Result of Control Group
C O V L M
Total 601 541 509 510 140
Mean 19 17 16 16 4
Table 3.4 The Result of Experimental Group
Component The Result of Experimental Group
C O V L M
Total 609 533 506 500 141
Mean 19 17 16 16 4
The result above shows that the students’ ability in writing was
similar. The mean of the content component was 19. It means that the
students had limited knowledge in the content of the paragraph, the content
had to be developed more, and it also showed inadequate development of the
topic.
Edited with the trial version of Foxit Advanced PDF Editor
To remove this notice, visit:www.foxitsoftware.com/shopping
33
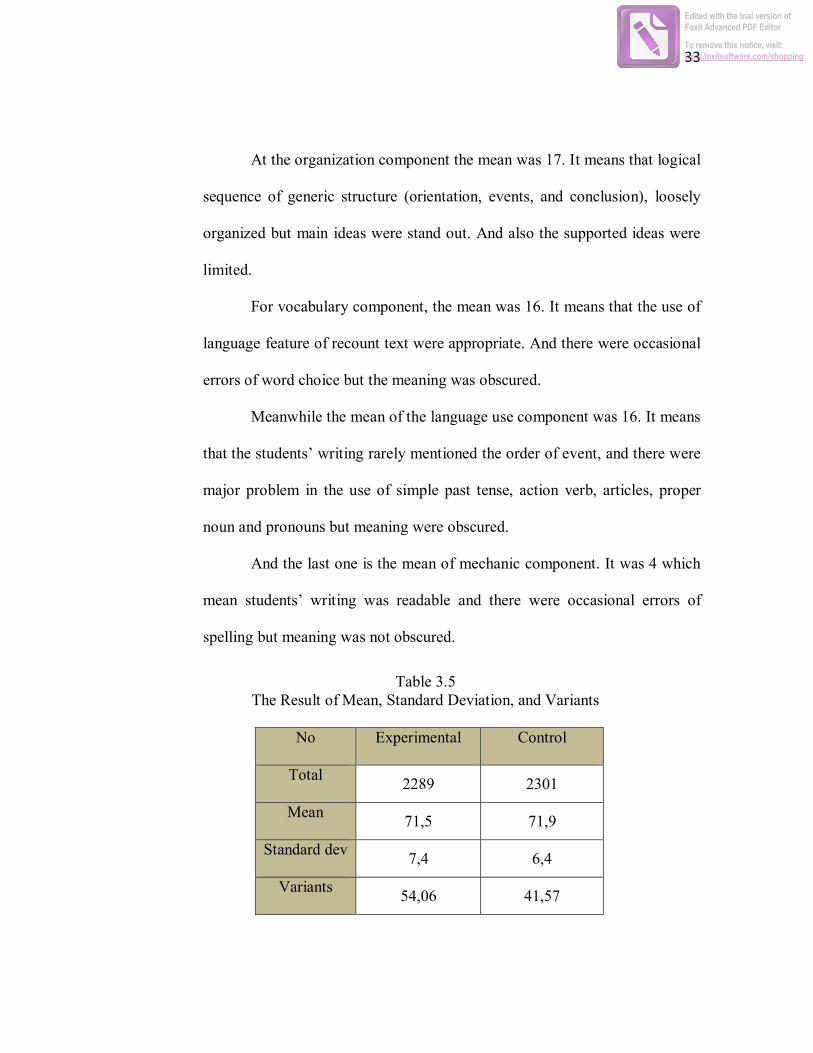
At the organization component the mean was 17. It means that logical
sequence of generic structure (orientation, events, and conclusion), loosely
organized but main ideas were stand out. And also the supported ideas were
limited.
For vocabulary component, the mean was 16. It means that the use of
language feature of recount text were appropriate. And there were occasional
errors of word choice but the meaning was obscured.
Meanwhile the mean of the language use component was 16. It means
that the students’ writing rarely mentioned the order of event, and there were
major problem in the use of simple past tense, action verb, articles, proper
noun and pronouns but meaning were obscured.
And the last one is the mean of mechanic component. It was 4 which
mean students’ writing was readable and there were occasional errors of
spelling but meaning was not obscured.
Table 3.5 The Result of Mean, Standard Deviation, and Variants
No Experimental Control
Total 2289 2301
Mean 71,5 71,9
Standard dev 7,4 6,4
Variants 54,06 41,57
Edited with the trial version of Foxit Advanced PDF Editor
To remove this notice, visit:www.foxitsoftware.com/shopping

34
From the calculation using form at Microsoft excel (=average) and
drag all the score of experimental group, it was found that the mean of the
experimental group was 71.5. Then using the same form, it is found that the
mean of the control group was 71.9. The mean of the both class were almost
same. And using form of the Microsoft excel (=STDEV) it was found that the
standard deviation of the experimental group was 7.4 and the control group
was 6.4. And the variants at each group were 54.06 and 41.57. It means that
the dispersion was stabile. Even, their score in each skill in five components
was also similar. The result is described through the following figure:
Figure 3.1 Chart of the Total Score and Mean in the Both of Group
Then, to know whether it was significant that those groups were not
different or it was just by chance, it was tested using t-test. The terms of use
0
500
1000
1500
2000
2500
TOTAL SCORE MEAN
EXPERIMENTAL CONTROL
Edited with the trial version of Foxit Advanced PDF Editor
To remove this notice, visit:www.foxitsoftware.com/shopping

35
the t-test are normal distribution and homogeneous variants. Therefore, the
normality data and the homogeneity data were analyzed.
From the calculation of the normality test (appendix 1), it was found
that X2hit was 8.89 and X2
table was 11.070 with df= 5 and α=0.05. Compared
X2hit and X2
table, X2
hit was smaller than X2table, It could be concluded that the
data distribution is normal.
Then from the calculation of the homogeneity test (appendix 1), it
was found that Fhit 1.30 and Ftabel was 1.66. So, Fhit was smaller than the Ftabel.
It meant that the score of the test of the both group was homogenous.
Therefore, the comparative test could go on using t-test.
After it was found that the data is normal and homogeneous, the t-test
formula was used to find out whether there was not a significant difference
score between the students of the experimental group and control group
before the treatment or only by chance.13
Table 3.6 The result of the test (pre-treatment)
No Exp contr X x2 Y y2
Total 2289 2301 0 1676 0 1289
13 Anas Sudijono. Pengantar Statistik Pendidikan. (Jakarta: Raja Grafindo Persada. 2006). 277
Edited with the trial version of Foxit Advanced PDF Editor
To remove this notice, visit:www.foxitsoftware.com/shopping

36
To answer the question above, it should have an alternative
hypothesis (Ha) and null Hypothesis (Ho).14
Ha : there is a sigificant difference score between the students of the
experimental group and control group before the treatment.
Ho : there is no significant difference score between the students of the
experimental group and control group before the treatment
Using the t-test form, it was found that the result of t was 0.2169.
(appendix 1) Then, the score of df=62 was assessed on a table by significance
level 5%. T-table score was 2.000. The criteria was if tscore ≤ ttabel means = H0
is accepted and Ha rejected. Or if tscore ≥ ttabel means H0 is rejected and Ha is
accepted.15 It is seen that t score is smaller than t table.
Look at the result above, it means that the null hypothesis (H0) that
say there is no significant difference score between the students of the
experimental group and control group before the treatment was accepted. It
concluded that the students of the two groups had similarity skill before the
treatment was given. Therefore, the research was done to the two classes as
control group and experimental. Next, to determine which one is
experimental group and which one is control group was based on the
recommendation from the English teacher.
14 Ibid. 319 15 Sugiyono, Statistika untuk ...........................97
Edited with the trial version of Foxit Advanced PDF Editor
To remove this notice, visit:www.foxitsoftware.com/shopping

37
2. Treatment
The next step was applying the experimental treatment of independent
variable to the experimental group for two times. To avoid differences in
factors of teachers, the researcher was responsible for these two groups. In
this study, the researcher acted as the practitioner who taught both classes.
Therefore, the researcher did an observation to the English teacher at MTs
At-Taqwa before the treatment conducted. This observation was to know the
way the original teacher teaches. Then, the researcher taught the control class
while act as the original teacher who only used the LKS as a media in
teaching writing.
a. Control Group
The control group was taught as usual without a media as in
experimental group. The teacher taught the control class while acting as
the original teacher which was only use LKS as a media in teaching
writing. When teaching writing, the teacher did not use any media other
than LKS.
The teacher prepared the teaching process first before
administering the activities. The researcher prepared an appropriate
material for teaching writing process. In this control group, researcher
discussed with English teachers to create lesson plans as they were used
by the teacher.
Edited with the trial version of Foxit Advanced PDF Editor
To remove this notice, visit:www.foxitsoftware.com/shopping

38
a) First Treatment
The first treatment was held on 23rd May, 2013. In this time
the students were taught using traditional media, it is LKS. The
material was recount.
The first treatment was started with the greeting and shared
the purpose of the study. Then the teacher ordered the students to
open the book and gave some explanation based on the subject. The
teacher asked the students to do the exercise in the book. After that,
the teacher asked the students to submit the work. The teacher gave
the students a home work to write about “your last experience”.
b) Second Treatment
The second treatment was held on 1st June, 2013. In this
time the students were taught using LKS. The material was recount.
The second treatment was started with the greeting and
sharing the purpose of the study. Then the teacher ordered the
students to open the book and gave some explanation based on the
subject. Teacher asked the students to make a recount text and
exercises contained in LKS. After that, the teacher asked the
students to submit the work. In the end, the teacher gave some
questions to check the students’ understanding about the material.
Edited with the trial version of Foxit Advanced PDF Editor
To remove this notice, visit:www.foxitsoftware.com/shopping

39
b. Experimental Group
The experimental group was taught in different way as control
group. The teacher gave a treatment to the experimental group. The
treatment of this study was the use of comic strips as a media for the
experimental group in teaching writing. Comic strips as a media would be
a help for the students to ease students in order to choose, find and create
the ideas of writing and then developing students’ ideas into paragraph.
The use of comic strips as a media is very useful to help the students to
generate and organize ideas into a good composition of writing. So, the
product of writing can be understood more easily by the reader.
Therefore, in this study, the teacher taught the experimental group using
comic strips as a media in teaching writing.
a) First Treatment
The first treatment was held on 23rd May, 2013. In this time
the students were taught using comic strips as a media. The material
was recount.
The first treatment was started with the greeting. And
teacher shared the purpose of the study. The teacher explain about
the material. Before giving treatment by comic strips as a media, the
teacher introduced students the way comic strips are constructed to
be an outline to write. The teacher showed the comic strips. She
Edited with the trial version of Foxit Advanced PDF Editor
To remove this notice, visit:www.foxitsoftware.com/shopping

40
gave some question about the picture of the comic strips and the
students answered orally. The following question were:
a. Do you like reading comic?
Then the teacher showed some pictures of comic strips. Next,
she asked the following questions;
b. What do you think about this picture?
c. What is on the picture?
d. What do you think is going on the picture in the first box?
e. What do you think is going on the picture in the second box?
f. What do you think is going on the picture in the next box?
Then the teacher divided the students into groups each 4
students. After asking some questions, the teacher sticked the comic
strips up on the class board. The students choose one of the the
comic strips on the board.
Then, the teacher asked the students to write their own
writing using comic strips as an outline. By looking at the event of
the comic strips, the students wrote down the words that related to
the topic of the comic strips for each box. The words above might
help the students in writing. Then, the teacher asked to students to
applyed all the the sentences to be paragraph based on the box of
comic strips. After that, the teacher asked the students to submit the
work.
Edited with the trial version of Foxit Advanced PDF Editor
To remove this notice, visit:www.foxitsoftware.com/shopping

41
Then, the teacher gave a home work for the students to
make a recount text using another comic strips on the newspaper.
b) Second Treatment
The second treatment was held on 1st June, 2013. In this
time the students was taught using comic strips as a media. The
students taught recount with different comic strips as the first
meeting but the activities was similar.
The second meeting was not so different with the first
meeting. The treatment was started with the greeting and shared the
purpose of the study. Then the teacher asked the students to submit
their home work. The teacher asked to the students if they still
remember what they have done in the last meeting. And the teacher
showed some pictures of comic strips. She gave some question
about the picture of the comic strips and the students answered
orally. The following questions were:
a. What do you think about this picture?
b. What is on the picture?
c. What is going on the picture in the first box?
d. What is going on the picture in the second box?
e. What is going on the picture in the next box?
Edited with the trial version of Foxit Advanced PDF Editor
To remove this notice, visit:www.foxitsoftware.com/shopping

42
After asking some question, the teacher sticked the comic
strips up on the class board. The students choose one of the the
comic strips on the board.
Then, the teacher asked the students to write their own
writing using comic strips as an outline. By looking at the event of
the comic strips, the students wrote down the words that related to
the topic of the comic strips for each box. The words above might
help the students in writing. Then, the teacher asked to students to
applyed all the the sentences to be paragraph based on the box of
comic strips. After that, the teacher asked the students to submit the
work.
In the end, the teacher gave some questions to check the
students’ understanding about the material.
c. Final test
At the last meeting, the teacher made a final test to both control
group and experimental group. The test was to know the students’ ability
in writing after the treatment. The result of the test was to determine
whether there is a significant difference between students who were
taught using comic strips as a media and those who were taught using
LKS as a media.
Edited with the trial version of Foxit Advanced PDF Editor
To remove this notice, visit:www.foxitsoftware.com/shopping

43
The test was asking the students to write a recount text but with
different way. The students in experimental group were asked to write a
recount text using comic strips as a media. and the students in control
group were asked to write a recount text without any media.
The next step, finding the result used t-test. It was to know
whether there was a significant differences result of the students’ writing
skill between students who were taught through comic strips as a media
and those who were taught only using LKS as a media.
G. Data Analysis Technique
The data concern with result of the students’ category in writing recount
texts. Then the data were analyzed by using statistical calculation of t-test to find
out the difference score of final test between the experimental and control group
the treatment was significant or not.
The data obtained in this study is quantitative data from the test score. To
be able to analyze this study, it used t-test formula. The terms of using t-test are
the data should have normal distribution and homogeneous variants.16 So that,
before analyzed using t-test, the subject must be necessary to test the normality
16 Muh. Ali Rumansyah. & Lamijan Hadi Susarno. Penerapan Model Pembelajaran Kooperatif Tipe Group Investigation untuk Meningkatkan Hasil Belajar Produktif Multimedia Siswa Kelas SMKN 1 Cerme Gresik. (http://blog.tp.ac.id/penerapan-model-pembelajaran-kooperatif-tipe-group-investigation-untuk-meningkatkan-hasil-belajar-mata-pelajaran-produktif-multimedia-siswa-kelas-x-smkn-1-cerme-gresik, accessed on May 24, 2013)
Edited with the trial version of Foxit Advanced PDF Editor
To remove this notice, visit:www.foxitsoftware.com/shopping

44
of the data. While the homogeneity of variance test required to determine the
subjects taken are homogeneous or not.
1. Normality test
The normality test was used to check whether the test score of
experimental group and control group were normally distribution, the
following steps are:17
a. Determine the number of intervals class. For normality using Chi Square
test, the number of interval is 6. This appropriate with 6 fields in Standard
Normal Curve.
b. Determine the limitation of interval class, the formula is:
The long interval class = ������� ���� –�������� ����
6 (�ℎ� ������ �� ��������)
c. Arrange the data into a frequency distribution table
Interval �0 �
ℎ �
0− �
ℎ (�
0− �
ℎ)2
(�0
− �ℎ)2
�ℎ
Total
�0 = frequency / the number of data from the result of pretest
�ℎ= the number / frequency of the expected (percentage area of each
field multiplied by n)
17 Sugiyono, Statistika untuk ......................................... 75
Edited with the trial version of Foxit Advanced PDF Editor
To remove this notice, visit:www.foxitsoftware.com/shopping

45
�0
− �ℎ= the differences between �
0 and �
ℎ
d. Determine �
ℎ
It based on the percentage area of each field in normal curve, than
multiplied by the number of data (the number of individuals in the
sample). Number of individuals in the sample = n.
1. The first line : 2,7 % x n
2. The second line : 13,53 % x n
3. The third line : 34,13 % x n
4. The fourth line : 34,13 % x n
5. The fifth line: 13,53 % x n
6. The sixth line: 2,7 % x n
e. put the each �ℎ score to the table columns �
ℎ, and than calculate the
(�0
− �ℎ)2 score and
(�0−�ℎ)2
�ℎ. The value of
(�0−�ℎ)2
�ℎ is the chi square count
(X2).
f. Compare X2hit with X2
table. If X2
hit is smaller than X2table, so the data
distribution is normal.
2. Homogeneity test
The homogeneity test was used to check whether the final test score
of experimental group and control group have same variants. The following
steps of homogeneity test as followed:
Edited with the trial version of Foxit Advanced PDF Editor
To remove this notice, visit:www.foxitsoftware.com/shopping

46
Edited with the trial version of Foxit Advanced PDF Editor
To remove this notice, visit:www.foxitsoftware.com/shopping
47
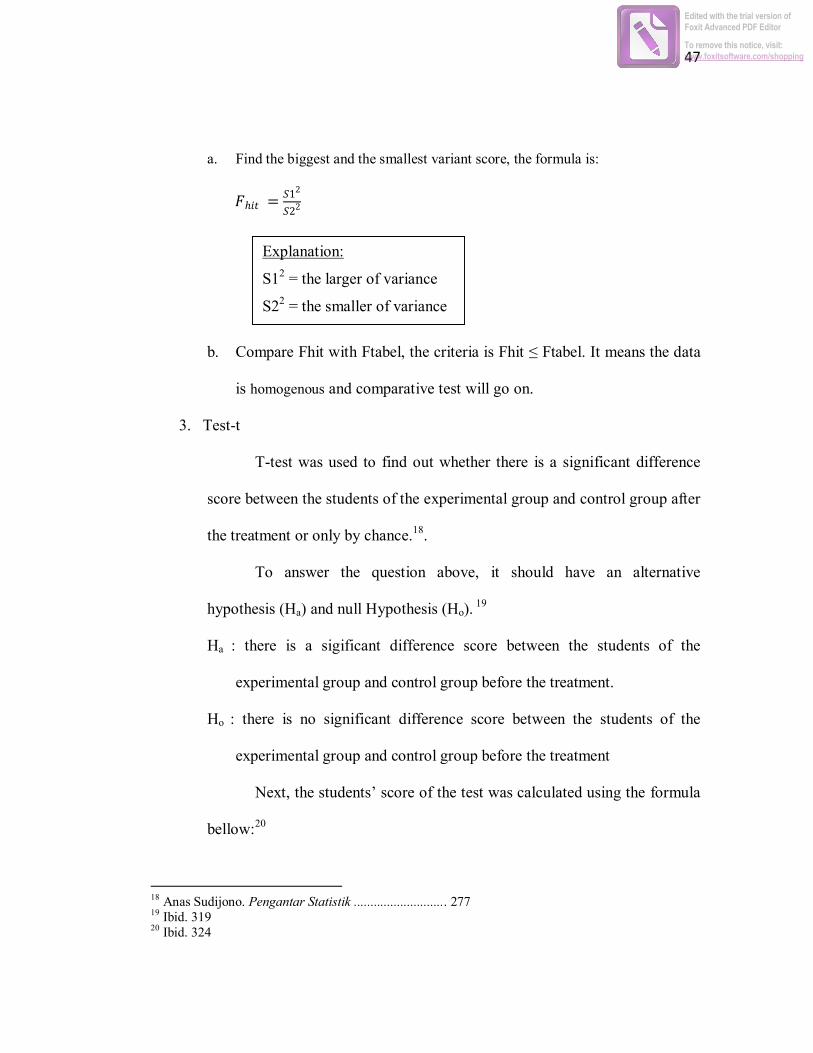
a. Find the biggest and the smallest variant score, the formula is:
�ℎ�� =�12
�22
b. Compare Fhit with Ftabel, the criteria is Fhit ≤ Ftabel. It means the data
is homogenous and comparative test will go on.
3. Test-t
T-test was used to find out whether there is a significant difference
score between the students of the experimental group and control group after
the treatment or only by chance.18.
To answer the question above, it should have an alternative
hypothesis (Ha) and null Hypothesis (Ho). 19
Ha : there is a sigificant difference score between the students of the
experimental group and control group before the treatment.
Ho : there is no significant difference score between the students of the
experimental group and control group before the treatment
Next, the students’ score of the test was calculated using the formula
bellow:20
18 Anas Sudijono. Pengantar Statistik ............................ 277 19 Ibid. 319 20 Ibid. 324
Explanation:
S12 = the larger of variance
S22 = the smaller of variance
Edited with the trial version of Foxit Advanced PDF Editor
To remove this notice, visit:www.foxitsoftware.com/shopping

48
df = (N1+N2)-2
After all data were calculated, the number of degree of freedom was
calculated. The formula was:
df = Degree of freedom
N1= Number of Individual in experimental group
N2 = Number of individual in control group
Then, the next step the tscore with ttabel were compared. The criteria is
if tscore≤ ttabel means = H0 is accepted and Ha rejected. Or if tscore ≥ ttabel means
H0 is rejected and Ha is accepted.21
21 Sugiyono, Statistika untuk ....................................97
2 21 1
2
Mx Myt
X Y
Nx Ny Nx Ny
t = the t-test Mx = Mean of experimental group
My = Mean of control group 2X = The sum of mean of experimental group
2Y = The sum of mean of control group
Nx = The sum of students in experimental group
N y = The sum of students in control group
Edited with the trial version of Foxit Advanced PDF Editor
To remove this notice, visit:www.foxitsoftware.com/shopping