Embed Size (px)
Citation preview
27
CHAPTER - II
REVIEW OF LITERATURE
For any research, a review of the past studies related to the subject is useful in
several ways. This chapter is devoted to a review of the literature related to the present
study. For better exposition, the review has been organized under the following heads:
(i) Studies relating to Cost of Production of paddy
(ii) Studies relating to Yield Gap and Yield Constraints
(iii) Studies relating to Profit Function Approach
2.1 STUDIES RELATING TO COST OF PRODUCTION OF PADDY
In agriculture, cost of production refers to the expenditure incurred by the
farmers on the various inputs (operational and fixed) to obtain final produce. The
relationship between cost and income is of vital importance. In agriculture, costs of
farming may be classified under two major heads, namely, fixed cost and variable or
operational costs. Fixed costs include depreciation, taxes, rent, interest, insurance and
premium. It results from past commitments of cost already sunk. It exists even in the
absence of cultivation. Variable cost includes input like seeds, labour cost, manures
and pesticides, tractor fuel and livestock fuel. It varies with the changes in the level of
output. It does not exist in the absence of cultivation. It is an important factor which
determines how much and what is to be produced. Fixed cost is important in making
decisions on the amount to be produced and different practices to be adopted. In the
long run, all costs become variable costs.
28
In the short run, it is profitable for a farmer to produce a gross income greater
than or equal to the variable cost. But in the long run, the return must cover the total
cost, comprising both variable cost and fixed cost.
In agricultural operations, the farm cost of production refers to the expenses
incurred on the various inputs (both operational and fixed) to obtain the final produce.
The cost of production consists of two parts, namely fixed cost and variable or
operational cost.
Edwin Faris (1964)1 states that improvement of plant and animal varieties,
introduction of new type of insecticides and fertilizers, mechanization in agriculture
and effective use of many of the factors of production have been esteemed as
technological change.
In farm management studies, Shukla (1966)2 has categorized cost into Cost A1,
Cost A2, Cost B and Cost C. Cost A1 includes the cost of seeds, manures and
fertilizers, plant protection, livestock expenses, hired human labour, irrigation charges,
land revenue, interest on working capital, depreciation of fixed assets and
miscellaneous expenses. Cost A2 covers Cost A1 plus rent paid for leased in land.
Cost B includes Cost A2 plus rental value of owned land plus interest on fixed capital
minus land revenue on owned land. Cost C includes Cost B plus imputed value of
family labour.
1 Edwin Faris, (1964), “Structural change and competitive relationship among buying and selling Firms”,
Journal of Farm Economics, 46(5), pp. 1238-1245. Website.
2 Shukla, B.D. (1996), “Input-Output Relationship in Agriculture” Indian Journal of Agricultural
Economics, Vol. 21, No.3, p.309. Print.
29
Acharya (1976)3 divides farms into small farmers (below 5 acres), medium (5-
10 acres), and large farmers (above 10 acres). Besides he breaks the farms into three
mechanization levels.
a) Bullock-operated farms. All operations are performed with bullocks and
human labour. In other words they can be called as non-mechanized farms.
b) Pump-oriented farms. Irrigation is done by electric or diesel pump sets and
all other operations are carried out by bullock and human labour.
c) Tractor operated farms. Pump sets are used for irrigation and other
operations are carried by tractors and bullocks.
Hayami and Herdt (1977)4 state that technological progress for a commodity
implies a downward shift in the cost function and hence a right shift in supply function
which with a downward sloping demand curve resulted in a larger quantity at a lower
cost.
Rajagopalan et.al, (1978)5, makes a study on the cost of production of crops in
Tamil Nadu during the year 1978.
Cost A
i) Value of human labour including family labour
ii) Value of bullock labour
3 Acharaya, S.S. (1976), “Prospects for Agricultural labour in the context of New Agricultural
technology in Rajasthan Rural Labour in India”, S.M. Pandey ed., Sri. Ram Centre for Industrial
Relations and human Resources, New Delhi, Print.
4 Yujiro Hayami and Robert W. Herdt, (1977), “Market price Effects of Technological change on Income
Distribution in semi subsistence Agriculture” American Journal of Agricultural Economics, 59(2),
pp.245-246. Website
5 Rajagopalan, V. et.al. (1978), Studies on Cost of Production of major crops in Tamil Nadu, Department
of Agricultural Economics, Tamil Nadu Agriculture University, Coimbatore, pp.2-3. Print.
30
iii) Value of machinery charges
iv) Value of seed
v) Value of insecticides
vi) Value of manures and fertilizers
vii) Cost of irrigation and
viii) Interest on working capital
Cost C
Cost A plus rent (including actual rent paid by the tenant or rental value of
owned land) interest on fixed capital, land revenue, cesses, taxes and depreciation of
implements and machinery.
The cost individually includes.
i) Cost A1
1. Value of hired labour (permanent and casual)
2. Value of owned bullock labour
3. Value of hired bullock labour
4. Value of owned machinery
5. Hired machinery charges
6. Value of fertilizers
7. Value of manure (owned and purchased)
8. Value of seed (with farm produced and purchased)
9. Value of insecticides and pesticides
10. Irrigation charges (both owned and hired machineries)
11. Canal water charges
12. Land revenue, cesses and other taxes
31
13. Depreciation on farm implements (both bullock drawn and used by human
labour)
14. Depreciation on farm building, farm machinery and irrigation structure.
15. Interest on working capital and
16. Miscellaneous expenses (artisans, so far and repairs to small farm
implements)
ii) Cost A2
It includes Cost A1 and
17. Rent paid for leased in land
iii) Cost B
It includes Cost A2 and
18. Imputed rental value of owned land (less land revenue paid there upon), and
19. Imputed interest on fixed capital (excluding land).
iv) Cost C
It includes Cost B and
20. Imputed value of family labour.
When a farmer is the owner and has contributed land and other resources, he
incurs Cost A1. In case all the land is leased in and rent has to be paid, Cost A2 is
incurred. It is also known as tenant cost. In addition to it if the imputed interest is paid
on owned fixed capital, Cost B is incurred. Cost C is incurred if the imputed cost of
family labour is also considered. Cost C is a very comprehensive cost.
32
P.M Thomas, (2002)6 “Problems and Prospects of Paddy Cultivation in
Kuttanad Region”, Even though the food habits of the people of Kerala had remarkably
changed over the last few decades, rice still continues to be their staple food. The
diverse topographic, climatic and soil conditions of the state enable its people to
cultivate a wide variety of seasonal and perennial crops. The various crops raised
within the state are broadly classified into food crops, garden crops and plantation
crops1. An analysis of the changes in the cropping pattern in Kerala during its post
formation period clearly shows that there has been a persistent shift in favour of garden
crops and plantation crops at the expense of food crops.
This study is focused on the contemporary issues related to paddy cultivation in
Ramakari village. Along with the conventional research methods we have adopted
various Participatory Rural Appraisal (PRA) methods, which calls for the active
involvement of local people in the research process.
This study suggested that in order to facilitate the rapid and integrated
development of Kuttanad region so many studies had been conducted by expert
committees, research institutions and individual researchers during the past three
decades. As the overall development of the region is closely connected with the
development of its paddy farm sector most of these studies suggested several measures
for the development of paddy cultivation in this area. In 1971, the Kuttanad Enquiry
Commission after comparing the various aspects of paddy farming in Palakkad and
Thrissur with Kuttanad, had recommended the construction of permanent ring bunds
and engine floors, mechanization of certain farming operations, aerial spraying of
insecticides, setting up of the mobile soil testing laboratories, registration of
6 Thomas, P.M. (2002), “Problems and Prospects of Paddy Cultivation in Kuttanad Region”,
Dissertation, Kerala Research Programme on Local Level Development (KRPLLD),
Thiruvananthapuram. Website.
33
agricultural labourers and the formation of Kuttanad Development Authority for the
betterment of paddy cultivation in this region.
David Groenfeldt (2004)7 in his study stated that paddy cultivation forms the
basis of traditional Southeast Asian societies and the livelihoods of the people who
comprise those societies. Historically speaking, paddy cultivation has always (at least
for several millennia) been multi-functional – providing not only the raw material for
subsistence and trade, but also serving as the central focus for family and community
life as well as spiritual and religious expression. While times have certainly changed,
this paper suggests that the multi-functional nature of paddy cultivation continues to be
important, and that our concept of rural “livelihood” should incorporate these cultural
dimensions.
Pierre Van Der Eng (2004)8 School of Business and Information Management,
The Australian National University has examined the study entitled “Productivity and
Comparative Advantage in Rice Agriculture in South-East Asia Since 1870”. The study
reveals that Rice long dominated the agricultural economies of South-East Asia. Given
the economic predominance of agriculture, the development of rice production had a
significant bearing on the economies in the region. This article explains why the
countries of mainland South-East Asia long dominated the international rice market. It
quantifies labor productivity in rice production and argues that simple, low-cost and
labor-extensive, but low-yielding production technology allowed farmers in mainland
South-East Asia to achieve significantly higher levels of labor productivity than in the
more densely populated rice-producing areas in South-East Asia and Japan. High levels
7 David Groenfeldt, (2004), “Appreciating the Hidden Values of Paddy Cultivation Towards a New
Policy Framework for Agriculture”, INWEPF/SY/ (03). Website.
8 Pierre Van Der Eng, (2004), “Productivity and Comparative Advantage in Rice Agriculture in South-
East Asia Since 1870”, Asian Economic Journal, Vol.18, No.4, pp. 345-370. Website.
34
of labor productivity were a major source of comparative advantage in rice production
for Burma, Thailand and Southern Vietnam.
Kumar et.al, (2005)9 in their study on “Technical Efficiency of Rice Farms
under Irrigated Conditions of North West Himalayan (NWH) Region – A Non-
Parametric Approach” stated that hill agriculture is practiced under tough conditions
because of its unique character. The hill and mountain ecosystem is unique because of
topographical features and climatic variations along the gradient. In general, hills
receive 750 to 1250 mm precipitation; however, only about 10 per cent of the area is
under irrigation in Uttaranchal hills that too confined to the lower valleys. Sub-optimal
hydro-thermal regimes and shallow soil depths thwart further extension of cultivated
land. Small and scattered land holdings and limited land use is also the main feature of
hill agriculture. Therefore, the food produced is not sufficient to sustain for the whole
year. These biophysical and socio-economic constraints result in low technical
efficiency as well as discourage farmers from taking the risk. In this context increasing
technical efficiency assumes significance. Improving efficiency levels under these
conditions is a big challenge for farmers in the NWH region. Rice being the most
important staple food in NWH region, improvement in efficiency level is one of the
major means of sustaining their staple food production and thereby ensuring food
security
This study was taken up to determine the efficiency of rice cultivation under
irrigated conditions in NWH region. Moreover, the study also explores the possibility,
if any, of the difference in technical efficiency level between the local and improved
9 Kumar, L.R., Srinivas, K. and Singh, S.R.K. (2005), “Technical Efficiency of Rice Farms under
Irrigated Conditions of North West Himalayan Region – A Non-Parametric Approach”, Indian Journal
of Agricultural Economics, Vol. 60, No. 3, July-September, pp.483-491. Print.
35
technology (i.e., variety) in rice growing farms. The factors associated with inefficiency
are also analyzed.
The overall technical efficiency in the case of improved rice growing farms is
higher than that of rice farms growing local varieties. The results also indicate that in
the case of local rice growing farms, the scale inefficiency contributes more to the
overall technical inefficiency. From the policy point of view, increasing the share of
rice cultivation under irrigated situation in the total farm area can bring about
improvement in the overall technical efficiency. With regard to farms growing
improved rice varieties, pure technical inefficiency makes the greatest contribution to
the overall inefficiency. By emulating the best practices of relevant efficient farms,
less efficient farms growing improved rice varieties can eliminate pure technical
inefficiency under irrigated conditions.
Joshi, P.K. et.al, (2005)10
has edited the book of “Impact of Agricultural
Research-Post-Green Revolution Evidence from India”. In this book, P Kumar and D
Jha, has presented the paper entitled “Measurement of Total Factor Productivity
Growth of Rice in India: Implications for Food Security and Trade” This paper, which
seeks to build on an earlier study on rice presents a more disaggregated perspective on
changes in TFP (Total Factor Productivity) across states in India. This perspective is
valuable since the states are the units of development and policy action in India. The
study also examines how changes in TFP will affect the possibility of generating an
exportable surplus of rice. The results of this study reiterate the need for greater
investment in rice research. However, several complex conceptual issues have not been
adequately captured by the kind of econometric analysis used in the study. For
10
Joshi, P.K., Suresh Pal, Birthal, P.S., and Bantilan, M.C.S eds. (2005), “Impact of Agricultural
Research Post-Green Revolution Evidence from India”, Dr. Ramesh Chand Director, NCAP, Delhi.
Website.
36
example, agricultural research has contributed to breaking the seasonal barrier in rice
production and to a great extent the shift in rice area (in northwestern India) has been
driven by research. Secondly, a great deal of stability has been achieved in rice
production by providing varieties tolerant to biotic and abiotic stresses. Finally, quality
improvement has added to the value of production. All these contributions are
subsumed under a residual TFP measure. It would be worthwhile to capture these
impacts explicitly, which would lead to a more realistic assessment of research on
productivity of rice. A more detailed analysis of rice production in different
environments using disaggregated data may be a useful starting point.
A. Suresh and T.R. Keshava Reddy (2006)11
in their study on “Resource-use
efficiency of Paddy Cultivation in Peechi Command Area of Thrissur District of
Kerala: An Economic Analysis” undertaken in the Peechi Command Area of Thrissur
district in the Kerala state, have examined the resource productivity and allocated as
well as the technical efficiency of paddy production. The study has used the primary
data collected from 71 rice farmers of the command area using the stratified random
sampling. The cost of cultivation of paddy in the command area has been found as
Rs.21603/ha, resulting in a BC ratio of 1.34. The elasticity coefficients for chemical
fertilizers, farmyard manure and human labour have been observed significant and
positive. The allocated efficiency has indicated that marginal return per one rupee
increase under these heads would be Rs.2.83, Rs.1.57 and Rs.1.17, respectively. The
average technical efficiency of the paddy farmers in the command area has been found
as 66.8 per cent. Education of the farmer and supplementary irrigation provided during
the water-stress days have been identified as the factors which could enhance the
11
Suresh, A. and Keshava Reddy, T.R. (2006), “Resource-use efficiency of Paddy Cultivation in Peechi
Command Area of Thrissur District of Kerala: An Economic Analysis”, Agricultural Economics
Research Review, Vol. 19, pp.159-171.Website.
37
technical efficiency. The study has called for an equitable distribution of canal water
and enhanced extension services for resource management in the area.
Gyanendra Singh (2006)12
Mahatma Gandhi Chitrakoot Gramodaya
University, Chitrakoot, District Satna, Madhya Pradesh, India, has presented the paper,
“Estimation of a Mechanization Index and Its Impact on Production and Economic
Factors - a Case Study in India”. In this paper, the major factors that require higher
capital investment, viz. fertilizer, irrigation and farm power were selected to assess
their impact on yield through multiple linear regressions. The standardized regression
coefficient has revealed that irrigation (42 percent) and farm power (32 percent)
significantly contributed in increasing the yield. Both these inputs use mechanical and
electrical energy extensively as a part of mechanization. An index has been suggested
based on the ratio of the cost of use of machinery to the total animate and machinery
cost for the estimation of the mechanization. State-level crop-wise secondary data have
been adopted from the cost of cultivation of principal crops in India for the assessment
of the mechanization index, and to study its impact on the yield, cost of cultivation and
deployment of human and animal power. The analysis has revealed that the human
labour cost is still the largest component in the cost of cultivation in the wheat crop,
which is the most highly mechanized crop in India. The analysis has further revealed
that, although 78.5 percent farm power was contributed by the mechanical sources, the
mechanization index based on cost of use of machinery was 14.5 percent. In other
words, the share of cost of the human and animal energy in the total operational cost
was 85.5 percent. The crop-wise mechanization index varied from a lowest value of
8.22 percent in sorghum and paddy to a highest value of 30 percent in wheat. The
analysis also revealed that the states having higher mechanization indices incurred a
12
Gyanendra Singh, (2006) “Estimation of a Mechanisation Index and Its Impact on Production and
Economic Factors - a Case Study in India”, Bio systems Engineering, 93 (1), pp.99–106. Website.
38
lower cost of cultivation of the wheat crop on quintal basis due to increased yield. As
the level of mechanization increased, the draught animal use significantly reduced
annually by 6.2 percent, but use of human labour reduced by 0.18 percent only, from
1971–72 to 1996–97.
This paper concluded that Farm power intensity (kW/ha) alone is not adequate
to assess the quality of mechanization, as it does not have a time dimension. The index,
however, facilitates future farm power planning. A mechanization index based on the
share of machine work to the sum of manual, animal and machine work is generally
used for model forecasting. However, due to the quality of output and the associated
cost factor of farm power sources, the mechanization index may lead to erroneous
conclusions of economic advantage.
A mechanization index based on the ratio of cost of use of machinery to the
total cost of use of human labour, draught animals and machinery has been suggested
for estimation. For the assessment of the mechanization index, and to study its impact
on yield, cost of cultivation and deployment of human and animal power, crop-wise
secondary data have been adopted from the cost of cultivation of principal crops in
India. The level of mechanization index in the country is very low in other crops viz.
paddy, sugarcane, groundnut etc. and therefore, plenty of scope exists to introduce
mechanically operated equipment. Inputs for mechanization require long-term
investment for creating support services infrastructure for manufacture, marketing,
after-sale service network, training, demonstration, and credit support. The Government
of India is conscious of these facts and has taken adequate measures to promote
mechanization by providing financial incentives to the farmers and to the farm
machinery industries to manufacture quality farm machinery.
39
M. Anjugam et.al, (2008)13
his research was mainly on SRI Technique in
paddy cultivation. The main objective of the study is to identify the constraints to
adopting of SRI technique and to suggest suitable policy measures to enhance rice
productivity in Tamil Nadu.
The sample farmers of the technique adopters and non-adopters of each 30 were
selected from Western Zone of Tamil Nadu was selected. The reasons for adoption of
SRI technique and constraints encountered by farmers were measured by the Garrettt
Ranking Technique; Average and Percentage analysis was adopted.
The results indicated that farmers who are in an active age group and more
highly educated are more likely to adopt the technique. Small and medium sized
farmers are showing willingness to adopt new techniques and allocate more area for
new technique if it suits the local condition. The study concluded that power-operated
cono-weeder using either battery or diesel may be supplied to farmers for more
efficient weeding so as to increase the productivity of labourers. The skill oriented
training should be given to agricultural labourers regarding SRI practices. This study
will definitely help farmers to adopt the new techniques in a larger way to increase the
productivity and net income at farm level. Also, this technique will be a better solution
to meet food demand.
Ansari and Ismail (2008)14
in their investigations that were conducted at the
farms of Uttar Pradesh Bhumi Sudhar Nigam at Shivri, Lucknow during the Kharif
season in 1998-99 assessed the impact of organic amendment vermicompost in
comparison to chemical fertilizers on paddy (variety-Sarju-52) in sodic soil and in
13
Anjugam, M. Varadha Raj, S. and Padmarani, S. (2008), “Cost-Benefit Analysis of SRI Technique in
Paddy Cultivation”, Dissertation, Department of Agricultural Economics, TNAU, Coimbatore. Print. 14
Ansari, A.A. and Ismail, S.A. (2008), “Paddy Cultivation in Sodic Soil through Vermitech”,
International Journal of Sustainable Crop Production, Vol. 3(5), pp.123-139. Print.
40
relation to soil fertility, yield parameters and economics. Results indicated an increase
in soil organic matter from 0.38 to 0.96 per cent, organic carbon from 0.22 to 0.56 per
cent, available nitrogen (N) from 499.52 to 1245.44 kg /ha, carbonate irons from 0.20
to 0.23 meq/100 g of soil, calcium irons from 0.89 to 1.09 meq/100 g of soil and
decrease in pH from 8.74 to 8.25, Electric Conductivity (EC) from 0.86 to 0.69 dSm-1,
sodium ions from 11.85 to 1.47 meq/100 g of soil and Exchangeable Sodium
Percentage (ESP) from 67.51 to 57.42, suggesting qualitative improvement of soil, in
the plots amended with vermicomposting. Paddy yield of 4975 kg/ha was recorded
from plots amended with vermicomposting while 4900 kg/ha, from plots amended with
chemical fertilizers, as control. Cost benefit ratio was found to be 1:1.5 for cultivation
of paddy using vermitech where as in case of chemical fertilizers, it was 1:1.06
suggesting that by the application of vermicomposting in paddy, the cost of production
could be reduced without compromising on harvest.
Basvaraja et.al, (2008)15
in their research notes stated that the quantitative
analysis of agricultural production systems has become an important step in the
formulation of agricultural policy. A number of empirical studies have attempted to
investigate producer responsiveness to product and input price changes, to estimate
economies of scale, to assess the relative efficiency, and to measure the impact of
technological change. In particular, there has been a considerable amount of theoretical
and applied econometric research on the measurement of the impact of technological
change. As knowledge of new and more efficient methods of production (cultivation in
agriculture) become available, technology changes. The adoption of new or improved
method of production / cultivation can shift the production function. In other words,
15
Basvaraja, H. Mahajanashetti, S.B. and Sivanagaraju, P. (2008) “Technological Change in Paddy
Production : A Comparative Analysis of Traditional and SRI Methods of Cultivation”, Indian
Journal of Agricultural Economics, Research Notes, Vol.63, No.4, pp.629-640. Print.
41
production can be increased with new technology by using the same quantities of
resource that were used in old technology or alternatively, the production level in old
technology can be attained with new technology by using fewer quantities of inputs.
The recent breakthrough in rice cultivation known as System of Rice Intensification
(SRI) method is one such case which may be considered as disembodied technology.
The study was based on the input-output data obtained from sample paddy
growing farmers in Andhra Pradesh selected through multi-stage sampling design.
At the first stage, four major paddy growing districts, namely Prakasam, East Godavari,
West Godavari and Guntur districts following both traditional and SRI methods of rice
cultivation were purposively selected. From each district, three major paddy growing
mandals following both the methods of rice cultivation were selected purposively at the
second stage. Then at the third stage, four major paddy growing villages following
both methods were purposively chosen from each mandal. In the final stage, ten
farmers were randomly selected from each village such that they included five farmers
in SRI method and five farmers in the traditional method of rice cultivation. Thus, 480
farmers (240 farmers growing paddy by traditional method and 240 farmers growing it
by SRI method) spread over four districts of Andhra Pradesh were interviewed during
kharif season of 2005-06. Data on various inputs used in paddy cultivation like
chemical fertilizers, plant protection chemicals, seed materials and human labour, and
cultivation practices such as land preparation, transplanting, irrigation, inter-cultivation
and harvesting along with labour required for these operations were collected from the
sample farmers.
42
The findings of this study demonstrate the superiority of SRI in terms of yield
and returns advantage. However, it is worth mentioning here that the actual adoption
rate of SRI among paddy growers is very low, which appears to be a puzzle given the
encouraging performance of the new technology. There are several reasons for this
kind of poor response of farmers to SRI method. First, the farmers, particularly in the
head reaches of command areas, where paddy is grown extensively, have not fully
realized the importance of water in view of market and policy failure in pricing the
resource appropriately; second, intensive care particularly during transplanting of
seedlings and higher weed infestation demands more labour and hence farmers in
labour scarce areas are hesitant to adopt SRI; third, only soils with good drainage
facility and low clay content are suitable for SRI cultivation and finally, there is not
enough awareness among farmers about its superiority.
M. Shivamurthy et.al, (2008)16
in their study stated that rice growing situations
prevailing in different regions of India largely determine the system of rice cultivation.
The two principle systems of cultivation in Karnataka are dry and wet. The dry system
of cultivation is mainly confined to tracks which depend on rains only. Upland rice,
which is predominantly cultivated in the arid and semi- arid zones, has noticed a
gradual decline in its area and quantum of production in the recent years. The factors
attributing to this decline are lack of suitable high yielding varieties and drought
resistant varieties, decline in relative profitability of rice cultivation and shifting from
food crops to cash crops etc. The present study was conducted to identify the
constraints faced by farmers cultivating rain fed paddy in Eastern Dry Zone of
Karnataka.
16
Shivamurthy, M., Ramakrishna Rao, L., Shailaja Hittalamani and Lakshminarayan, M.T. (2008),
“Constraints of Farmers Cultivating Rain fed Paddy in Eastern Dry Zone of Karnataka”, Mysore
Journal of Agricultural Science, Vol. 42(1), pp.163-165. Website.
43
The study was conducted in Bangalore Rural, Tumkur and Kolar districts under
Eastern Dry Zone of Karnataka State during 2005. Out of 24 taluks belonging to these
three districts, six taluks (Kanakapura, Channapatna, Tumkur, Gubbi, Kolar and
Bangarpet) were selected based on the highest area under paddy cultivation. From
among these six taluks, 25 villages were selected randomly. In each of the 25 so
selected villages, a list of farmers growing rain fed paddy during 2003- 04 kharif
season was prepared. From each village four rainfed paddy growers were selected by
adopting simple random sampling technique. Thus, 100 rainfed paddy growing farmers
spread over 25 villages were selected for the study. The data were collected from 100
rainfed paddy growing farmers with the help of a pre-structured interview schedule.
Anwar Hussain (2010)17
in his study aims to make economic analysis of staple
food grain crops i.e. rice, wheat and maize in district Swat. Out of the total seven
tehsils, three tehsils namely Kabal, Matta and Barikot were selected on the basis of
purposive sampling technique. The selected tehsils were situated on the bank of river
Swat where food grain crops were mainly grown. From each tehsil three villages each
were randomly selected. The study is based on primary data which were collected
through structured questionnaire using a sample of 200 farmers allocated
proportionally. The respondents (farmers) were selected randomly from each village.
Sample size for the selected villages was adequate because the villages were quite
homogeneous in terms of land condition, cropping pattern, population and farming
activities.
17
Anwar Hussain, (2010), “Economic analysis of staple food-grain crops: varieties’ input-output
comparison, Economic practices and significance in the economy of district SWAT”, Dissertation,
Department of Economics, University of Peshawar, NWFP Pakistan. Website.
44
For the analysis benefit-cost ratios, log-linear Cobb- Douglas production
functions, stepwise regression and Wald test were used. Fakhr-e-Malakand
(rice variety with benefit-cost ratio 3.41) was the most profitable variety as compared to
all other rice varieties. Fakhr-e-Sarhad (wheat variety with benefit-cost ratio 2.36) was
the most profitable variety as compared to all other wheat varieties. Azam (maize
variety with benefit-cost ratio 2.24) was the most profitable variety as compared to all
other maize varieties. For rice crop, the output elasticities of area, tractor hours,
fertilizer, seed, labour and pesticides were 0.24578, 0.6712, 0.0789123, 0.871245,
0.12487 and 0.004871 respectively. Proportional increase in the output of rice, wheat
and maize was faster than the increase in the inputs of rice, wheat and maize
respectively.
It is recommended that the government should launch policies for increasing
cultivated area under food crops. Awareness should be given to the farmers to grow
profitable varieties rather than traditional varieties. The farmers should only use
recommended seed. Proper storage facilities should be provided to the food grain
growers. Efforts should be made to increase farmers’ income through improvements in
food grain quality, plus better utilization of its by-products. As proportional increase in
the output of food grain crops was higher than their inputs, therefore, the inputs should
be properly and efficiently managed so as to ensure higher productivity
Flordeliza Hidalgo Bordey (2010)18
in his comprehensive study the impacts
of research and development in Philippine rice production. The study examined the
sources of rice production growth in the Philippines from 1996 to 2007 by estimating a
transom production function using a generalized instrumental variable estimator. Using
18
Flordeliza Hidalgo Bordey, (2010), “The impacts of research on Philippine rice production”,
Dissertation, Doctor of Philosophy in Agricultural and Consumer Economics , Graduate College of the
University of Illinois, Urbana-Champaign, Website.
45
a production framework, the study has analyzed the contributions of conventional and
non-conventional inputs, and residual total factor productivity to the production growth.
Higher output growth was observed during wet and dry seasons of 2001-2006 and
2002-2007 compared to that of 1996-2001 and 1997-2002. Results indicate that
non-conventional inputs such as irrigation, adoption of hybrid and third generation
modern inbred varieties, attendance at rice production training sessions, use of high
quality seed, and machine ownership were the main sources of production growth in
these periods.
Using a cost framework, the study has measured the contributions of public
investments in R&D, extension, production subsidy, and irrigation in reducing the cost
of rice production in the Philippines. The researcher used the shadow share as a
measure of marginal return to public investments in determining the need for further
investments. The study also decomposed the growth in total factor productivity of rice
into scale economy, improvement in capacity utilization due to public investments, and
rate of technical change. Results indicate that R&D has generated cost-savings and has
improved productivity of rice. This implies that further investment in rice R&D is
essential. The study also found that investment in production subsidy is
counterproductive which supports its phase-out. The study also found inefficiencies in
extension and irrigation. This suggests that reforms in the current extension system and
a reorientation of the irrigation development strategies should be implemented in order
to reap the potential benefits from these investments.
Finally, the researcher used the CERES-Rice simulation model of the Decision
Support System for Agro technology Transfer in investigating the nature of shift in
individual rice supply when a hybrid rice variety was adopted. Using the DSSAT
46
model, determined the yield responses of hybrid and inbred rice varieties to different
levels of nitrogen, potassium, and water applications. The study estimated hybrid and
inbred yield response functions using the DSSAT-generated yield data. Using the
estimated coefficients, the study recovered the profit-maximizing demands for nitrogen,
potassium and water. Then, the study derived the supply functions of hybrid and inbred
rice by substituting these profit-maximizing demands back to the yield response
functions. Results show that adopting the hybrid rice variety would lead to a pivotal
and divergent shift in the individual supply. While far from being used in an aggregate
scale, the method presented is a step toward a better measurement of benefits from
adopting a specific technology and returns to R&D in general.
B.A. Tijani et.al, (2010)19
Department of Agricultural Science and Technology,
Department of Agricultural Engineering, Department of Agricultural Technology,
Nigeria has presented the paper. The study was carried-out on resource use efficiency
in rice production in Jere Local Government Area of Borno State, Nigeria. Data were
obtained using structured questionnaire. Five (5) wards were purposely selected out of
the twelve (12) wards to reflect areas where rice is mainly grown. A total of 100
respondents were proportionately selected from the five (5) wards for the analysis.
Descriptive statistics and production function were used as analytical tools. The result
indicates that majority (87 percent) were male, most (54 percent) had farm size less
than 2 hectares. Also, majority (60 percent) indicated their major occupation as
farming, most (51 percent) had no formal education while, (37 percent) had between
11–30 years of farming experience. The results of resource use efficiency in rice
production showed that resources such as fertilizer, hired labour and rented land were
19
Tijani, B.A., Abubakar, M., Benisheik, K. M. and Mustapha, A. B. (2010) “Resource Use Efficiency in
Rice Production in Jere Local Government Area of Borno State, Nigeria” Nigerian Journal of Basic
and Applied Science, 18(1): pp. 27-34. Website.
47
under-utilized. The sum of elasticities of production indicates that there is increasing
return to scale. It was recommended that farmers should be advised to increase use of
rented land, improved rice seed, of fertilizer, hired and mechanized labours and
chemicals. Farmers should also be encouraged to actively participate in adult education
extension programme to acquire knowledge on how to use their farm resources
efficiently in rice production.
The study also reveals that rice farmers were technically inefficient in the use of
farm resources. The inefficiency of the farmers may be directly or indirectly linked to
the high cost of fertilizer, rented land, seed, hired and mechanized labour. Improvement
in the efficiency amongst the farmers is the responsibility of the individual farmers,
government and research institutions. The provision of improved rural infrastructures
and enabling policies such as making available all agricultural inputs required at the
right time and at affordable prices among others are also required in order to enhance
efficiency. Based on the findings of the study, the following recommendations were
made:
i) Extension agents in the state should be properly trained and provided with
all the necessary technological packages required to teach and guide
farmers on improved agricultural technologies to reduce cost of production.
ii) Non-governmental organizations and research institutes in collaboration
with the farmers’ cooperative groups should provide improved agricultural
technologies such as improved seeds, fertilizer etc. at affordable rate to the
farmers.
48
Fazlollah Eskandari Cherati et.al, (2011)20
Shahid Chamran University of
Ahvaz, Iran has published the full length research paper entitled “Energy survey of
mechanized and traditional rice production system in Mazandaran Province of Iran. The
aim of this study is to consider the energy consuming process and factors influencing
rice production in semi-mechanized and traditional systems in Mazandaran Province of
Iran. Data used in this study were obtained from farmers using a face to face
questionnaire method. The study was conducted on 500 rice farms in the Mazandaran
Province of Iran.
Results showed that the total energy used for semi-mechanized and traditional
rice production system was 67217.95 and 67356.28 MJ/ha, respectively. Based on the
results, irrigation and fertilizer in both systems with 50232 and 7610.32 MJ/ha was the
most input energy. Total energy output of the traditional method was 127.5 GJ/ha and
that of the semi-mechanized was 132.26 GJ/ha. Parallel to the mechanization level of
operations that increased, consumption of fuel and machinery energy increased
similarly, but the labor and seed energy consumption dropped. The renewable energy in
the traditional and semi-mechanized systems was 3168.3 (4.70% total energy) and
2312.1 MJ/ha (3.44%), respectively. Energy ratio and energy productivity in traditional
and semi-mechanized systems was 3 and 3.08, and 0.111 and 0.116 kg/MJ 116.0,
respectively. Nonetheless, net energy gain and specific energy showed that energy
efficiency of semi-mechanized systems was more than the traditional system.
20
Fazlollah Eskandari Cherati, Hoshang Bahrami and Abbas Asakereh, (2011), “Energy survey of
mechanized and traditional rice production system in Mazandaran Province of Iran”, African Journal
of Agricultural Research Vol. 6(11), pp. 2565-2570. Website.
49
Lijun Xu et.al, (2011)21
College of Engineering, China Agricultural University,
Beijing, China has analyzed that the Double-cropped paddy rice production in south
China plays an important role in China’s food security. This production system
represents 42.5 percent of the total available paddy rice area resulting in 40 percent of
China’s total rice production. The field operation system in double-cropped paddy rice
production area is complicated, and various technologies must be used in each field
operation. For soil preparation, no-till approaches as well as plows or discs are used.
For plant establishment, direct sowing and transplanting are used. Rice harvest can be
accomplished using combine harvesting; mechanical reaping followed by manual
collection and threshing. The choice of the most suitable technology in each field
operation and the overall system of field operations affects the development of paddy
rice production mechanization. With the pressing need to mechanize paddy rice
production, it is necessary to analyze various systems of field operations that could be
used in this production system. A survey of farmers, including both those who do and
do not own machinery, and managers of custom agricultural machinery cooperatives
was completed using questionnaires and telephone surveys in six provinces and regions
in China. The survey included questions about basic participant demographics;
development environment and status of paddy rice production mechanization; different
mechanization technologies, cost of labour and machinery utilization; and factors
affecting machinery utilization cost. Subsequently, the mechanization options for each
field operation were analyzed based on machinery availability, operation scale and
organizational pattern. In addition, the economic benefit of different systems of field
operations was compared. In total, there were 14 possible machinery systems. Among
these systems, those that have the high economical benefit use plowing as the tillage
21
Lijun Xu, Minli Yang, Brian L. Steward, (2011), “System of Field Operations for Double-Cropped
Paddy Rice Production Mechanization in South China”, Conference Proceedings and Presentations,
Agricultural and Biosystems Engineering, Paper Number: 1111647, pp.1-16. Website.
50
operation, blanket-type seedling or seedling cultivation in the field, followed by
transplanting, chemical application, and combine harvesting.
A. Alipour et.al, (2012)22
the aim of this study was to determine the energy
efficiency indices in the agro-ecosystems of the Guilan province in 2010. One hundred
and twenty-seven farmers were interviewed using a particularly designed questionnaire.
The inputs in the calculation of energy use in agro-ecosystems embraced labour,
machinery, electricity, diesel oil, fertilizers, seeds, while rice and straw yield were
included in the output. The results depicted that total input and output energy into these
agro-ecosystems were about 47,604 and 90,680.04 MJ/ha, respectively. The highest
energy input was related to water (38.84 per cent), electricity (27.87 per cent) and
nitrogen fertilizer (17.5 per cent). Energy efficiency and energy productivity in these
agro-ecosystems was 2.19 and 0.064 kg/MJ, respectively, and water productivity was
0.11 kg/m3. The results also showed that due to application of flood irrigation in these
agro-ecosystems and also water elicited from subterranean sources by electrical pump,
the inputs had the largest portion among the energy inputs to agro-ecosystems that this
matter increased energy use in the unit area and also reduced energy efficiency and
productivity.
M. Murugasamy et.al, (2012)23
this paper surveys and critically reviews the
major research works on resource use efficiency in agriculture. These papers analyse
resource use efficiency, total economic efficiency and technical efficiency in various
crops and various agricultural regions. The studies cover major farm inputs such as
human labour, bullock labour, fixed capital, land, seeds, fertilizers and manure and
22
Alipour, A., Veisi, H., Darijani, F., Mirbagheri, B. and Behbahani, A.G. (2012), “Study and
determination of energy consumption to produce conventional rice of the Guilan province”, Research
Agriculture Engineering, 58: pp.99–106. Website. 23
Murugasamy, M. and Veerachamy, P. (2012), “Resource Use Efficiency in Agriculture - A Critical
Survey of the Literature”, Language in India, Vol. 12, pp.327-358. Website.
51
irrigation. The studies fail to incorporate the ideologies of resource use efficiency in the
context of head, mid and tail reaches of the channel irrigation. This research gap opens
the new avenue of research for the study on economics of resource use efficiency in
head, mid and tail reaches in cannel irrigation based agriculture.
PO Erhabor and J Ahmadu (2013)24
, Faculty of Agriculture, Department of
Agricultural Economics and Extension Services, University of Benin, Benin City,
Nigeria his study examined the technical efficiency of small-scale rice farmers in
Nigeria. It focused specifically on the socio-economic characteristics of the rice
farmers, production function for rice, level of technical efficiency of the farmers and
their inefficiency parameters. Data used for the study were obtained using a well
structured questionnaire. Out of the 300 rice farmers interviewed, a total of 263
respondents (130 and 133 for Niger and Taraba States respectively) provided useful
data for analysis. Data analysis was done using descriptive statistics, stochastic frontier
production function and inefficiency model. The results of the study showed that rice
production in the study area was dominated by married (79 per cent) males (92 per
cent) with average age of 45 years, family size of 10 persons and farming experience of
about 17 years. Majority (62 per cent) of the farmers had formal education and 65 per
cent of them had farming as their major occupation. The farmers had average farm size
of 2.93 hectares and average yield of 2,424kg/ha. Furthermore, the results showed the
significant presence of inefficiency parameters in the stochastic frontier production
function evidenced by the log-likelihood ratio test (91.24) that was significant at 1 per
cent. Technical inefficiency accounted for 61 per cent of the variation in output of the
rice farmers. Average technical efficiency of the farmers was 0.61. Age of the farmers
24
Erhabor, PO and Ahmadu, J. (2013), “Technical Efficiency of Small-Scale Rice Farmers in Nigeria”,
Journal of Agriculture and Allied Sciences, Vol. 2, Issue 3, pp. 14-22. Website.
52
was positively and significantly related to their technical inefficiency; while household
size, educational level, farming experience, rice variety and number of improved
technologies adopted were negative and significant determinants of the farmers’
inefficiency. It was stressed that the costs of major inputs for rice production should be
subsidized and adequate provision made for the farmers to have easy access to them,
including agricultural credit.
D. Narasimha Reddy et.al, (2013)25
the present paper examines the changing
nature of labour use in rice cultivation in Andhra Pradesh. Rice production in India is,
however, concentrated in a few pockets. A few states in India produce around two
thirds of rice production. Andhra Pradesh is the third largest state in India with respect
to rice production. In Andhra Pradesh too, rice is the single largest crops occupying
around 30% of area cultivated. The state was one of frontrunners leading the Green
Revolution, particularly in rice cultivation.
The study observed that there is a fast decline in labour use in respect of rice
cultivation in Andhra Pradesh. All three forms of labour (family, casual and attached)
have followed the same trend. But the share of casual labour in the total labour used in
rice cultivation is increasing with a corresponding decline in the share of family labour.
By gender, although both male and female labour use in rice cultivation has been
declining, it is faster for female labour. Also, a noticeable decline in the share of
harvesting and threshing/winnowing which are increasingly mechanized, in total labour
used per hectare of rice cultivation. Between wage rate and labour inputs it is observed
that there are higher relatively female labour inputs per hectare in areas (Zones) where
male wages are lower and vice versa.
25
Narasimha Reddy, D. and Venkatanarayana, M. (2013), “Declining Labour Use in Agriculture: A
Case of Rice Cultivation in Andhra Pradesh”, National Institute of Rural Development (NIRD),
Hyderabad, pp. 1-38. Website.
53
Soumitra Chatterjee et.al, (2013)26
his study examined that Rice is a principal
food crop which occupies nearly a one-fourth of the gross irrigated area in India.
However, the present study attempts to judge the essence of the Green Revolution in
rice cultivation and its actual reflection regarding the factor contribution over four
decades in West Bengal, India. The study measures the extent of technological change
in rice cultivation. The spatial change in the TFP as well as a comparative study on
productivity, input use, break-up of cost components and economic return in the paddy
cultivation over different size classes across all agro-climatic zones of West Bengal has
been made in order to identify the most promising zone regarding technological
advancement in rice cultivation.
Farm mechanization enters after the 90s indicating a major reform in the context
of the technology adoption by the rice growers in the state. The region wise scenario of
rice cultivation in the state has proved that the Gangetic Alluvial tract has been the
better technology adopter with higher TFP indices as compared to the problematic
regions like the Red Lateratic zone and the Coastal Saline belt, the reason of which
might be the improved fertility status of soil with a large number of progressive paddy
growers operating in terms of a better knowledge gaining, a better education and
extension.
26
Soumitra Chatterjee and Saurav Gupta, (2013), “Extent of technological change in rice cultivation over
four decades in West Bengal, India”, Agricultural Economics, CZWCH, 59, Vol. (6), pp. 281-291.
Website.
54
2.2 STUDIES RELATING TO YIELD GAP AND YIELD CONSTRAINTS
2.2.1 Yield Gap
There are two common ways of defining the concept of yield gap. Firstly,
directly comparing the experiment station yield to the yield at farm. Secondly,
comparing yield of the best farm with that of the average on the poorest farm.27
Thus,
yield gap may be classified into two kinds - Yield gap I and Yield gap II. The Yield
Gap I represents the difference between the experiment station yield and potential farm
yield. Yield Gap II corresponds to the potential farm yield and actual farm yield. The
maximum yield obtainable from a variety under particular situation is called ‘potential
yield’, while, the average yield attained under farm condition is known as ‘actual
yield’.
The Yield gap analysis becomes instrumental in measuring the magnitude of the
gap in the yields and in identification of constraints responsible for it. It is not proper
to consider Yield Gap I in a study, as an experiment station rarely encounters the
constraints experienced by the farmers. Such estimates would be biased and larger than
what it is actually under the farmers’ condition.28
Hence, Yield Gap II has been
examined in the study. It was defined as the difference between the highest yield
obtained by the most efficient farmer in the sample and the average level of yield
achieved under farmers’ condition.
27
Poduval, loc.cit. 28
Rajagopalan, V. et.al, (1978), “Studies on Cost of Production in Tamil Nadu”, Department of
Agricultural Economics, Tamil Nadu Agricultural University, Coimbatore. Print.
55
Shetty (1963)29
discusses the implication of technological advance in plantation
crops in India and concludes that despite some gains in yield per acre of coffee, tea and
rubber, cost per unit of output increases due to the adoption of new technology.
Davidson and Martin (1965)30
in their study, “The Relationship between
Yields on Farm and in Experiments Station” observed that the varieties were according
to the cultivation season. During good years, the yield at experimental station was
found to increase more rapidly than the yield on farm within the same district. This
was mainly because the farmers were more interested in measuring their profit by
limiting their input investments, while the experimenters only aimed at measuring yield
and had no cost restraints.
Mokheyi (1977)31
in his study estimated the yield gap ratios in rice production
during kharif season in the year 1975-76. The deserved farmers’ technical competence
was high when the gap ratio was low and vice versa. High yield gap was reported in
states like Bihar and Orissa. This was attributed to the fact that while the demonstration
plots were situated in irrigated areas, rice at the farm was generally produced under
rainfed conditions.
Tripathy (1977)32
in his study, “A Study of Technological Crop in Adoption of
New Rice Technology in Coastal Orissa and Constraints Responsible in the same”,
concluded that, about 17 per cent of the gap in the yield was caused by technology gap.
29
Shetty, K.T. (1963), “Implication of Technological change in Commercial crops – A case study of
plantation crops in India”, Indian Journal of Agricultural Economics 28(3), p. 56-63. Print.
30 Davidson, B.R. and Martin, B.R. (1965), “The Relationship between Yields on Farms and in
Experiments”, Australian Journal of Agricultural Economies, Vol.9, No.2, pp. 129-149. Website. 31
Mokheyi, K.K. (1977), Gap Analysis-An Effective Production Increase Concept in Rice, Summary of
a Lecture Delivered at the State Leaven Training Meeting on Rice, Purila Department of Agriculture
West Bengal, India. Print.
32 Tripathy, A. (1977), “A Study of Technological Gap in Adoption of New Rice Technology in Coastal
Orissa and Constraints Responsible for the Same”, (Unpublished Ph.D. Thesis, Indian Agricultural
Research Institute, New Delhi. Website.
56
The different package of practices individually accounts for the technological gaps.
There are 20.34 per cent, 17.92 per cent and 12.37 per cent of the gaps which were
caused by water management, disease and pest control, and nitrogen application
respectively. Nearly 20 per cent of the gap was due to the ecological factors like
temperature, soil, rainfall and sunshine intensity.
Wanchai et.al, (1977)33
defined the factors responsible for yield gap
constraints. Yield Gap I was hypothesized to be caused by other environmental
differences between experiment station and farmer’s field or by non-transfer of
technology. Yield Gap II was caused by biological and socio-economic constraints.
Biological constraints referred to the uncontrollable natural factors and socio-economic
constraints to the social and economic factors that prevented the farmers from using the
recommended technology. The author developed the conceptual model of yield gap.
The farmer corresponded to the difference between experiment station yield and
potential farm yield and the latter corresponded to the difference between the potential
farm yield and actual farm yield.
The Government Report (1977)34
on HYV in India shows that high yielding
varieties fail to approach their potential yields under field conditions and frequently
achieve yields below or barely matching those of the existing local or local improved
varieties.
33
Wanchai, K. and Gomaz, A. (1977), “Basic Concepts, Objects and Approach Constraints to High
Yields on Siren Rice Farms”, An Interim Report, (Manila: International Rice Research Institute, p.1.
Website. 34
Government of India, “The HYVP in India 1970-75 part II” Controller of Publications, Delhi 1977.
Website.
57
David Rajasekar (1984)35
studied the relationship between yield gap and the
associated input gaps by fitting linear yield gap functions for paddy, irrigated cholam
and irrigated cumbu separately and log linear yield gap function for irrigated
groundnut. In the case of paddy, the co-efficient of nitrogen gap, human labour gap
and technology index were significant which indicated that the yield gap between
demonstration plots and farm holdings would be bridged physically by increasing the
inputs such as labour, nitrogen and technology level in the sample farm. In the case of
groundnut, the coefficient of phosphorous gap, potash gap and pesticides gap was
significant. So, the economic optima derived revealed that there existed potentialities
for increasing the groundnut yield by bridging the gaps in phosphorous, potash and
pesticides.
Suryawanshri and Gaikward (1984)36
in their study found that there was a
wide gap in yield when new technology was adopted. The yield was 2.12 quintals/ha.
under traditional method of cultivation but it was 3.42 quintals/ha. when there was a
partial adoption of technology. It was 7.02 quintals/ha. when it was fully adopted as in
demonstration plot. Multiple regression analysis showed that not only sowing had
increased yield of jowar but also contributed to increase productivity of the resource.
Recommended varieties, fertilizers and timely sowing were found to be important ways
to reduce the yield gap.
35
David Rajasekar, D. (1984), “Yield Gap Analysis: A Study of Selected Crops in Madurai District
(Paddy, Cholam, Cumbu, Groundnut)” (Unpublished M.Sc. (Agri) Thesis Submitted to Tamil Nadu
Agricultural University, Coimbatore), pp.148-149. Print. 36
Suryawanshri, S.D. and Gaikward, N.S. (1984), “An Analysis of Yield Gap in Rabi Jowar in Drought
Prone Area of Ahmednagar District”, Agricultural Situation in India, Vol. 39, No.3, pp. 147-153.
Print.
58
Chandrasekaran (1985)37
in his study examined the relationship between yield
gap and the associated input gap by fitting a linear function. The co-efficient of gap in
nitrogen, phosphorous and potash was significant which included that the yield gap
between demonstration plots and the farm holdings could be bridged by increasing the
input such as nitrogen, phosphorous and potash in the sample farm. He found that the
marginal value product of nitrogen, phosphorus and potash was higher than the
marginal cost of the respective items and concluded that even at the existing product
and factor prices, the yield gap could be reduced.
Fale et.al, (1985)38
, in their study “An Economic Analysis of Yield Gap in Rice
in Ratnagiri District” argued that yield obtained at the experimental station could not be
advanced on farm because of differences in environment, input usage and management.
Therefore, they defined yield gap on the difference between the potential yield, that is,
yield obtained in demonstration plots and the actual farm yields. They defined potential
yield that could be obtained in farmer’s field by adopting improved technology. They
observed that the gap between yields, in experimental station and those obtained in
national demonstration plots (Gap 1) was quite misnomer (2 q/ha. or 3.82 per cent).
However, the gap between potential yield and the actual yield on farmers fields was
very wide (that is, 27 q/ha. or 52 per cent). There existed differences in the utilization
of improved inputs such as fertilizer and labour. Higher level of input was used on
national demonstration plots as compared to farmer level.
37
Chandrasekaran, C.M. (1985), “Yield Gap Analysis in Sugarcane Crop in Awanashi Taluk,
Coimbatore District” Unpublished M.Sc., (Agri) Thesis Submitted to Department of Agricultural
Economics, Tamil Nadu Agricultural University, Coimbature, pp.96-97. Print.
38 Fale, J.B., Jahakare, G.G. and Borude, S.G. (1985), “An Economic Analysis of Yield Gap in Rice in
Retnagiri District”, Agricultural Situation in India, Vol.39, No.2, pp. 925-930. Print.
59
Flinn and Ali (1986)39
studied the yield gap in two villages of Gujranwala
district, Pakistan, using data collected from a random sample of 115 farmers. The
mean yield of Basmala variety was found to be 1.8 tonnes per hectare over the sampled
farm during 198.2 rice crop. The yield of rice in the study ranged from 0.6 to 3.0
tonnes per hectare. Thus, a yield gap of over one tonne per hectare was identified
between the average and the highest farm yield. This suggested that given current
technology, there were opportunities for increasing rice yields in the study area.
Yadav and Gangwar (1986)40
in their study, “Rice Production and Constraints
in Bihar State” stated that, high yielding variety rice yield was 35.56 quintals per
hectare which was about 160 per cent higher than that of local varieties. The yield gap
between potential farm yield and the actual realized yield was quite high, indicating
factor potential for increase in production of rice in the state. The reason for this yield
gap was only the partial adoption of new technologies. The author remarked that there
was a need to strengthen the extension and input supply services in Bihar immediately.
Subramaniyan and Nirmala (1988)41
in their study “Yield Gap Analysis in
Rice Cultivation” analyzed the yield gap among IR 20 and CO 37 rice cultivation in
Gokilapuram village of Madurai district for khariff 1986. The yield gap under the
former variety (3.54 qtls per acre) worked out to be greater than that under the latter
(2.81 qtls per acre). Further, Garrett’s ranking technique was used to identify the
important constraints to potential yield in the study area. The main constraints
observed were shortage, insects, credit, tradition, weeds and non-availability of seeds.
39
Flinn, J.C. and Mubarak Ali, (1986), “Technical Efficiency in Basmati Rice Production”, Pakistan
Journal of Applied Economics, Vol.5, No.1, pp. 1-22. Website.
40 Yadav, P.N. and Gangwar, A.C. (1986), “Rice Production and Constraints in Bihar State”,
Agricultural Situation in India, Vol.12, No.1, pp.9-13. Print. 41
Subramaniyan, G. and Nirmala, V. (1988), “Yield Gap Analysis in Rice Cultivation”, Southern
Economist, Vol. 27, No.15, pp.15-16. Print.
60
Lakshmanan (1986)42
in his study revealed that the extent of yield gap in
groundnut varied from 20.84 per cent in wet zone area to 29.05 per cent in dry zone.
The gap was 26.41 per cent and 22.79 per cent in the case of small and big farmers
respectively. The reason for the variation was due to low fertilizer dose, irrigation and
low perception of attributes.
A. O. Ajao et.al, (2005)43
Agricultural Economics and Extension Department,
Lsdoke, Akintola University of Technology, Ogbomoso, 210001 Oyo State, Nigeria his
study entitled “Comparative Efficiency of Mechanized and Non-Mechanized Farms in
Oyo State of Nigeria: A Stochastic Frontier Approach” examined the technical
efficiency of mechanized and non-mechanized maize farmers in Oyo State using
stochastic frontier model to access the potentials in maize farms in Nigeria. The mean
technical efficiency is 0.72 and 0.62 for mechanized and non-mechanized respectively.
It was observed that the income of respondent could be improved if resources were
efficiently used at the existing technology. Thus, in the short-run, there lies a potential
of about 28 percent to increase the output of maize by adoption the technology and
techniques of best practice rice farms in mechanized farms while the potential therein
in non-mechanized farms is about 38 percent. Also, the entire variable specified in the
efficiency model have positive coefficient with fertilizer being the only significant
variable for both mechanized and non-mechanized. This implies that fertilizer
application is an important variable regardless of the form of the farm. Other cost and
labour is another variable that is significantly different from zero for mechanized farm.
42
Lakshmanan, R. (1986), “Constraints in Irrigated Groundnut: An Analytical Study of Yield and
Technological Gap”, (Unpublished Ph.D. Thesis, Tamil Nadu Agricultural University, Coimbatore).
Print.
43 Ajao, A.O., Ajetomobi, J.O. and Olarinde, L.O. (2005), “Comparative Efficiency of Mechanized and
Non-Mechanized Farms in Oyo State of Nigeria: A Stochastic Frontier Approach” Journal of
Human Ecology, 18 (1): pp. 27-30. Website.
61
M. Marrit Van den Berg et.al, (2007)44
explains Economic growth in China’s
agricultural sector lags behind growth in industry and services, creating an ever
widening rural–urban income gap. Development of the non-agricultural sectors offers
new opportunities for farmers in China’s more advanced provinces such as Zhejiang.
Increased income in the urban sector creates markets for new products, and migrating
farmers rent their land to those staying. Until now, the prevailing rice-based systems
have been managed mainly using manual labour and animal traction, but the larger
farms resulting from migration may facilitate, or even require mechanization. In this
study, we use a simulation model of the farm household to analyze the effects of
increasing farm size and the transition from rice to vegetable production, while also
studying the effects of mechanization. Our results show that at the present scale of
farming, the dual government objectives of increasing rural incomes and increasing rice
production are clearly conflicting. Farmers can generate incomes comparable to non-
farm wages, but only when they switch completely to production of more remunerative
crops, such as vegetables. At larger farm sizes, however, labour constraints inhibit
farmers from specialization in non-rice crops, and rising per capita incomes and
increasing rice production go hand in hand. Mechanization is necessary to allow
substantial increases in farm size.
This article results show that at the present scale of farming, the dual
government objectives of increasing rural incomes and increasing rice production are
clearly conflicting. Even when accounting for the recent increase in rice prices, our data
and simulations show that at the present land/labour ratio, per capita income from rice
production is less than a quarter of the non-farm wage. On the other hand, income from
44
Marrit Van den Berg, M. et. al, (2007), “The impact of increasing farm size and mechanization on
rural income and rice production in Zhejiang province, China”, Agricultural Systems,
(www.sciencedirect.com)
62
vegetable production is five times that from rice and this sector is thus highly
competitive with the non-farm sector. Whereas these results are based on a small
sample of farmers, they generally coincide with what we have observed in the region.
The relatively high capital requirements of vegetable production are not likely to form
an impediment for the transition to vegetable production, as farmers can start on a small
plot and slowly increase the vegetable area over the years when availability of working
capital increases. This does not mean that all farmers can easily make the shift out of
rice production. Some farmers may need specialized training, and market outlets need
to be sufficient. This will imply a regionally diversified production of different types of
vegetables and possibly other non-rice crops and a good market infrastructure to cater
to urban demands. If farm size increases in the near future, as expected, rising rural
incomes and rice production may go hand in hand. Even with mechanization, farmers
can only manage relatively small plots of vegetables. Our simulations indicate that
current household labour and the limited amount of available labour for hire is just
enough to specialize in vegetable production at the current land/labour ratio. When
farm size increases, labour constraints at the vegetable harvests force households to
grow rice on the additional land. Mechanization helps farmers to cultivate larger land
areas and thus generate more income, but does not greatly increase the area under
vegetables, as the vegetable harvest, the main labour peak, cannot be mechanized.
Ernest L. Molua (2010)45
Department of Economics and Management,
University of Buea, Cameroon, has explained rice is now a commodity of strategic
significance in Cameroon, driven by changing food preferences in the urban and rural
areas and compounded by increased urbanization. This study estimates supply response
45
Molua L. Ernest, (2010) “Price and Non-price determinants and acreage response of rice in
Cameroon”, ARPN Journal of Agricultural and Biological Science, Vol. 5, No. 3, pp. 20-25.
Website.
63
coefficients for rice in Cameroon. It is observed that the rice area grown may increase
1.35 per cent for a ten percent increase in relative world price to producer price. A ten
percent increase in relative price of substitute maize crop accounts for 1.17 per cent
decline in rice area exploited. Stepwise examination of the effects of price, weather and
governmental expenditure reveal that in the short-run a ten percent increase in current
governmental expenditure for agriculture will increase area grown by 1.35 per cent and
1.15 per cent, respectively. Irrigation could enhance area by 0.74 per cent for ten
percent increase in irrigation effort. The area supply response coefficients provide
important implications for both expansions of local market and land resource
availability. Increased competition could provide additional incentive for enhancing
supply pursuant to changes in policies and institutions.
According to him, the study concluded that, Rice is now playing an important
role in economic, politic and social aspects in production and consumption decisions in
Cameroon. As the economy grows, there is a shift to a diversified market-oriented
production system. The process of diversification out of staple food production could
be assisted through efforts that promote technological change in agricultural
production, improved rural infrastructure, and diversification in food demand patterns.
The need to provision the rapidly growing population could act as a trigger for the
transformation of rice production systems. Increased competition will provide
additional incentive for enhancing supply pursuant to changes in policies and
institutions. More important, expanding cultivated area is a viable option for increasing
rice production. However, given constraints in arable land availability, current supply
could be doubled by using the best varieties available together with appropriate crop
management techniques.
64
Rana Inayat Ali et.al, (2012)46
Rice Research Institute, Kala Shah Kaku,
Punjab, Pakistan examined the study Among different production factors, planting
methods produce significant effects not only on paddy yield and grain quality of rice
but also on soil health and productivity. In present experiment, six planting methods
including farmer conventional transplanting, mechanized transplanting, dry direct
seeding in lines and broadcasting, dry direct seeding on raised beds by machine and wet
direct seeding (broadcasting of pre-germinated seed in puddle soil) were tested to
evaluate their response for yield and quality traits as well as cost-benefit ratio. The
experiment was planned according to randomized complete block design (RCBD) with
four replications and a plot size of 18 m x 27 m. Data were collected on number of
plants m-2, plant height, productive panicles m-2, grains panicle-1, 1000-grain weight,
paddy yield and quality parameters.
The data collected were statistically analyzed using computer statistical package
MSTAT-C. Fishir’s Analysis of Variance Technique was applied to test the
significance of the treatments. Least Significance Difference Test at P≤ 0.05 was used
to compare the treatment means.
Economics and cost-benefit ratio of each planting method was also calculated.
The results indicated that paddy yield was maximum (5.17 t ha-1) in mechanized
transplanting but it was statistically at par with Drill-Dry-DSR (4.60 t ha-1),
broadcasting of soaked seed (4.47 t ha-1) in ‘wattar’ (optimal soil moisture), and Bed-
Dry-DSR (4.36 t ha-1). Minimum paddy yield was obtained in farmer conventional
transplanting (3.68 t ha-1). It was further revealed that although transplanting methods
produced greater plant height, filled grains panicle-1, 1000-grain weight but it was
46
Rana Inayat Ali, Nadeem Iqbal, Muhammad Usman Saleem and Muhammad Akhtar, (2012), “Effect
of different Planting methods on Economic yield and Grain quality of rice”, International Journal
Agriculture Applied Science, Vol. 4, No.1, pp. 28-34. Website.
65
statistically similar to DSR methods except Wet-DSR. Both drilling and broadcasting
of DSR were considered to be superior and economical than conventional transplanting.
S. N. Yadav, et. al, (2013)47
presented their paper entitled as “Energy input–
output analysis and mechanization status for cultivation of rice and maize crop in
Sikkim” According to them, Rice and maize are main cereal crops cultivated in Sikkim.
In this paper energy input–output and the level of agricultural mechanization for
cultivation of rice and maize in Sikkim state of India has been presented. The data were
collected on area under rice and maize crops, sources of power and agricultural
tools/implements used total production through village survey. It has been observed
that the traditional practices of cultivation of rice and maize crops consumed an average
energy input of 3,338.984 MJ ha-1 and 4,386.435 MJ ha-1 respectively. Data analysis
showed that about 60 percent of the total input energy in the present cultivation
practices comes from human and animal power sources. The output–to–input energy
ratio was observed to be 7.66 and 5.86 for rice and maize, respectively. The
observational estimate showed that average productivity of rice and maize crop in the
region is only 924.0 kg ha-1 and 431.0 kg ha-1, respectively, which is very low.
Mechanization and machine energy indices were found to stand at a value of 0.3618
and 0.3244, respectively for rice crop cultivation, and 0.2612 and 0.2111, respectively
for maize crop cultivation. The average farm power availability in the state has been
estimated as 0.70 kW ha-1.s in Sikkim”.
47
Yadav, S. N., Chandra, R., Khura, T. K. and Chauhan, N.S. (2013), “Energy input–output analysis and
Mechanization status for cultivation of rice and maize crops in Sikkim”. Agricultural Engineering
International: CIGR Journal, 15(3): pp.108-116. Website.
66
2.2.2 Yield Constraints
The factors that prevent farmers from achieving the potential yield under farmer
condition are known as ‘yield constraints’.
There are 3 kinds of constraints48
, which cause yield gap. They are (1)
environmental constraints, (2) biological constraints and (3) socio-economic
constraints. Environmental constraints are caused by (i) environmental difference and
(ii) non-transferable technology. Experiment stations are usually located in places ideal
for farming, whereas the same is not true for farmer’s field. Moreover, there are hardly
any cost output constraints at these centres, while farmers often encounter such
problems at farm level. Above all, some of the technologies adopted at the experiment
station may not be transferable to a farmer’s field. These constraints cause Yield Gap I.
Biological constraints include (i) variety, (ii) weeds, (iii) diseases and insects, (iv)
problem of soil, (v) irrigation facilities and (vi) soil fertility. By and large, these
constraints arise from the non-application of the required inputs. Experiment station
may not face such problems, while farmers often face them at the farm level.
Socio-economic constraints arise from (i) costs and returns, (ii) credit problems,
(iii) tradition and attitudes, (iv) knowledge and (v) input availability of institutional
facilities. It is the outcome of these constraints which prevent the farmers from
adopting the technology as recommended. A farmer may consider the economic
viability of following the new technology in terms of its cost and returns. Some
farmers may not like to give up their traditional practices. Moreover, some aspects of
the technology may not be understood by them. It also results from lack of institutional
48
Kalirajan, K. (1980), “The Contribution of Location Specific Research to Agricultural Productivity”,
Indian Journal of Agricultural Economics, Vol. 35, No.4, pp.8-16. Print.
67
facilities like non-availability of inputs and credits. Biological and socio-economic
constraints together contribute towards Yield Gap II.
Seyedeh-Maryam Hasheminya et.al, (2013)49
Department of Food Science
and Technology, Islamic Azad University, Science and Research Branch, Tehran, Iran
explained in their review paper is that, Rice is the second high-consuming product in
Iran and the demand for this product is growing each year. Limitations for increasing
under-cultivation areas make policymakers to plan programs for enhancing productivity
of the under-cultivation areas. Any attempt for reducing losses as well as optimum use
of agriculture entities are indirect ways in enhancing productivity of under-cultivation
areas. Paying careful attention to management, instructional and technological issues
can aid in better understanding the causes of losses in rice industry. Better management
of water resources and agricultural lands and supporting the development and extension
of integrated industries are key factors influencing rice production and reducing losses.
The study concluded that With regard to increasing demand for rice and
optimum use of current rice-farming conditions, attempt to reduce production losses is
necessary. Rice losses are formed during all stages of rice farming namely planting,
growing, harvesting and processing. Use of agricultural machinery, high-yield verities
and updated knowledge of promotion agents can aid in optimum use of agricultural
entities. Furthermore, protective policies of government including pricing and
guaranteed purchase rate of rice, use of appropriate tariff systems for imported rice and
supporting extension and promotion of integrated industry are effective in increasing
production and reducing rice losses.
49
Seyedeh-Maryam Hasheminya1, Jalal Dehghannya, (2013), “Investigation of basic factors influencing
rice losses in Iran”, International Journal of Agriculture and Crop Sciences, Vol.5 (19),
pp. 2190-2192. Website.
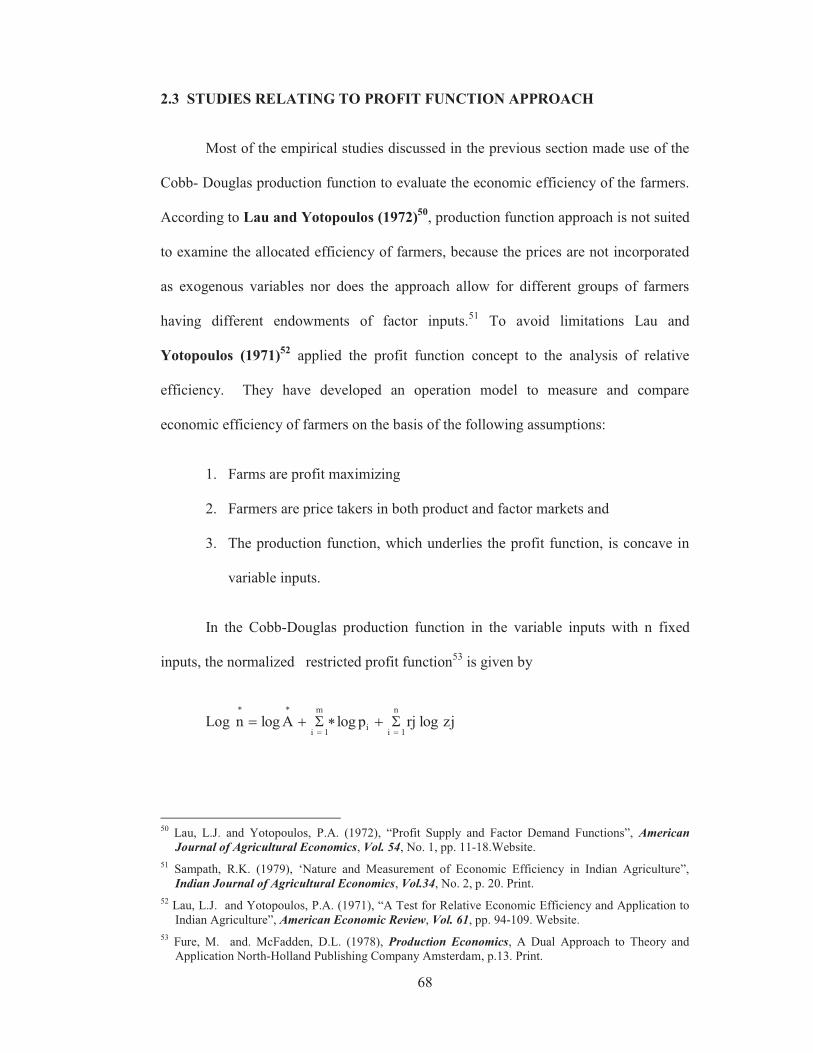
68
2.3 STUDIES RELATING TO PROFIT FUNCTION APPROACH
Most of the empirical studies discussed in the previous section made use of the
Cobb- Douglas production function to evaluate the economic efficiency of the farmers.
According to Lau and Yotopoulos (1972)50
, production function approach is not suited
to examine the allocated efficiency of farmers, because the prices are not incorporated
as exogenous variables nor does the approach allow for different groups of farmers
having different endowments of factor inputs.51
To avoid limitations Lau and
Yotopoulos (1971)52
applied the profit function concept to the analysis of relative
efficiency. They have developed an operation model to measure and compare
economic efficiency of farmers on the basis of the following assumptions:
1. Farms are profit maximizing
2. Farmers are price takers in both product and factor markets and
3. The production function, which underlies the profit function, is concave in
variable inputs.
In the Cobb-Douglas production function in the variable inputs with n fixed
inputs, the normalized restricted profit function53
is given by
Log zjlogrjplogAlognn
1ii
m
1i
**
==S+*S+=
50
Lau, L.J. and Yotopoulos, P.A. (1972), “Profit Supply and Factor Demand Functions”, American
Journal of Agricultural Economics, Vol. 54, No. 1, pp. 11-18.Website.
51 Sampath, R.K. (1979), ‘Nature and Measurement of Economic Efficiency in Indian Agriculture”,
Indian Journal of Agricultural Economics, Vol.34, No. 2, p. 20. Print.
52 Lau, L.J. and Yotopoulos, P.A. (1971), “A Test for Relative Economic Efficiency and Application to
Indian Agriculture”, American Economic Review, Vol. 61, pp. 94-109. Website.
53 Fure, M. and. McFadden, D.L. (1978), Production Economics, A Dual Approach to Theory and
Application North-Holland Publishing Company Amsterdam, p.13. Print.
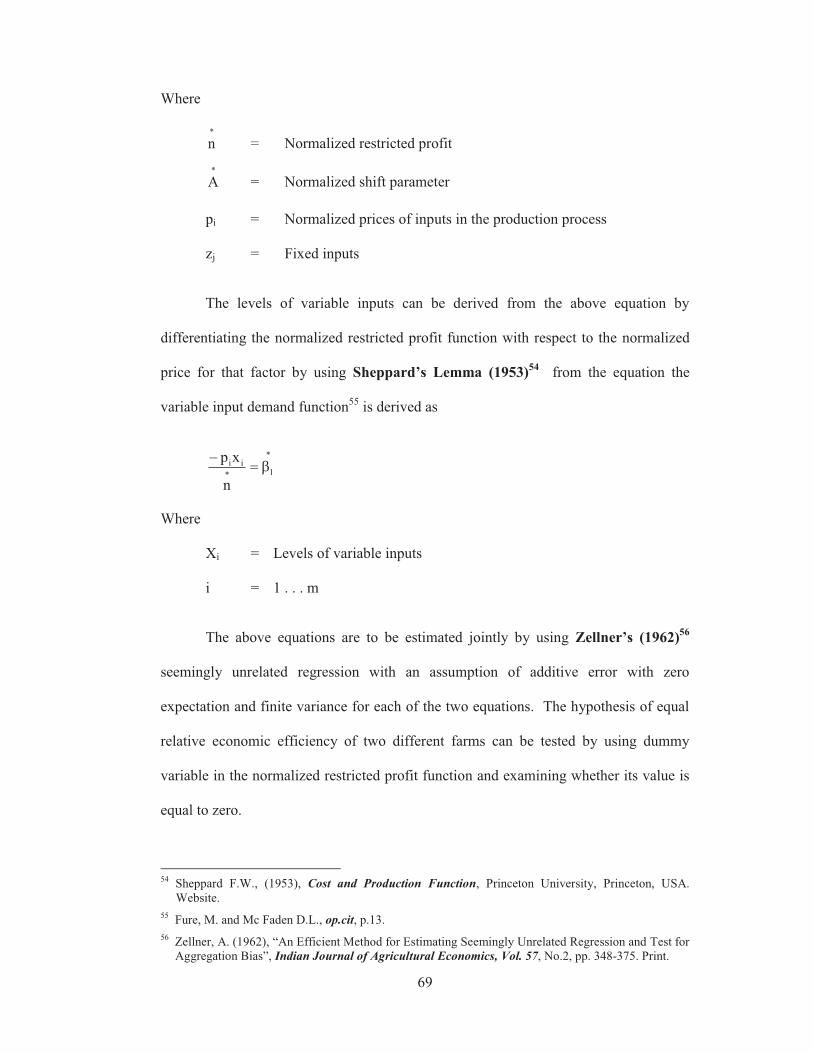
69
Where
*
n = Normalized restricted profit
*
A = Normalized shift parameter
pi = Normalized prices of inputs in the production process
zj = Fixed inputs
The levels of variable inputs can be derived from the above equation by
differentiating the normalized restricted profit function with respect to the normalized
price for that factor by using Sheppard’s Lemma (1953)54
from the equation the
variable input demand function55
is derived as
*
1ii
n
xpb=
-*
Where
Xi = Levels of variable inputs
i = 1 . . . m
The above equations are to be estimated jointly by using Zellner’s (1962)56
seemingly unrelated regression with an assumption of additive error with zero
expectation and finite variance for each of the two equations. The hypothesis of equal
relative economic efficiency of two different farms can be tested by using dummy
variable in the normalized restricted profit function and examining whether its value is
equal to zero.
54
Sheppard F.W., (1953), Cost and Production Function, Princeton University, Princeton, USA.
Website.
55 Fure, M. and Mc Faden D.L., op.cit, p.13.
56 Zellner, A. (1962), “An Efficient Method for Estimating Seemingly Unrelated Regression and Test for
Aggregation Bias”, Indian Journal of Agricultural Economics, Vol. 57, No.2, pp. 348-375. Print.
70
Parnape (1970)57
indicated that mechanization will increase the production and
ultimately raise the standard of living and increase economic welfare. He was of the
opinion that mechanization would increase the real purchasing power of the people and
thus have a leverage effect in demand for other products.
Ketkar (1977)58
has found that the farmers in the traditional sector are
generally efficient; most of the inefficiency arising from the introduction of new
technology has resulted from excessive diversification in the cropping production
patterns.
Kalirajan and Flinn (1981)59
studied allocated efficiency and supply response
in irrigated rice production through profit function. The study was confined to two
varieties of rice in the kharif reason in Coimbatore district, Tamil Nadu. The data used
were drawn from a larger intensive survey conducted from May 1977 to April 1978.
They chose 41 farmers for Exotic Modern Variety (EMV) at random. They estimated
Lau-Yotopoulos profit function along with input demand equation by using the
restricted Aitten’s estimation, imposing the conditions that the co-efficient of variable
input are equal in both profit and relevant factor demand equation. The interest terms
of the normalized profit function indicated similar technical efficiency of the EMV and
LBV producers. The sum of the elasticities of fixed factors (land and capital) indicated
that constant returns to scale prevail in both cases.
57
Parnape, R. (1970), “Experiment in the use of large scale machinery”, Journal of Farm Economics
14(2), pp.336-340. Website.
58 Ketkar, S.L. (1977), “Impact of New Technology on Indian Agriculture - A programming
Approach”, Dissertation Abstracts International 34(6), p.2874. Website.
59 Kalirajan, K. and Flinn, J.C. (1981), “Allocative Efficiency and Supply Response in Irrigated Rice
Production”, Indian Journal of Agricultural Economics, Vol. 36, No.2, pp. 16-24. Print.
71
The output responses to changing rice price were positive, significant and
greater than one. This indicated that the farmers in the study area were responsive to
changes in rice price. Besides this, farmers supply response for rice was sensitive to
changes in the prices of rice, fertilizer and labour wages.
Junankar (1980)60
tested the joint hypothesis of profit maximizing behaviour
and competitive behaviour’s of Indian farmers. The study was based on cross sections
data pertaining to paddy growing farmers of Thanjavur district in Tamil Nadu, for
1969-70. He estimated Lau-Yotopoulos profit function along with that variable input
demand equation by Zellner’s Seemingly Unrelated Regression and tested the
restriction implied by theory. Quite contrary to the earlier findings of other studies,
assuming competitive conditions, he found that Indian farmers were not profit
maximizes. He argued that small and large farmers in India did not operate in the same
credit or labour markets, and therefore, they were not competitive. Hence, he
emphasized the need for further research to explain the behaviour of farmers in poor
countries.
Abhi, Kumar and Mathur (1983)61
derived indirect production elasticities for
three varieties of cotton (Desi cotton, American cotton and Hybrid cotton) using Lau -
Yotopoulos profit function along with variable input demand equation relating to
labour. They utilized farm level primary data from Akola district in Maharashtra state,
for the year 1979-80, for 200 farmers growing three varieties of cotton. They estimated
profit equation along with input demand (labour) equation jointly by using Zellner’s
60
Junankar, P.N. (1980), “Do Indian Farmers Maximize Profit?” The Journal of Development Studies,
Vol.17, No 1, pp.48-61. Website.
61 Abhi, M.R., Kumar, P. and Mathur, V.C. (1983), “Technological Change and Factor Shares in Cotton
Production: A Case Study of Akola Cotton Farms”, Indians Journal of Agricultural Economics,
Vol. XXXVIII, No.3, pp.407-415. Print.
72
Seemingly Unrelated Regression. The study showed that the share of land in cotton
production was the maximum for all varieties of cotton, ranging from 0.42 for Desi
cotton to 0.54 for American and Hybrid cotton. The share of labour decreased
substantially as one moved from ‘old’ to ‘new’ technology. The share of capital in
Hybrid cotton technology was biased towards land and capital, and was against labour.
Kalirajan (1981)62
studied the economic efficiency of farmer groups (small and
large) using Lau-Yotopoulos profit function along with four variable input demand
equations relating to labour, chemical fertilizer, pesticides and bullock pair. For the
empirical estimation of profit and variable factor demand function a random sample of
seventy farmers (35 farmers each) growing HYV. IR 20 in rabi (winter) reason 1977-
78 was selected from a progressive village in Coimbatore district, Tamil Nadu.
To test the equality of different efficiencies (economic, price and technical)
between the two farmer groups, he estimated the profit function along with demand
functions, jointly by using Aitken’s generalized least squares through the Lagragian
Multiplier. This way of estimating profit and factor demand functions is different from
the method of Lau and Yotopoulos. The advantage of working with this method is that
it is possible to identify which elasticities estimated from the factor demand equations
differ from those of the profit functions. It helps policy makers to identify which of the
factors effect farmer decision is making. The major findings of this study were:
1. There was equal relative economic efficiency in the cultivation of IR 20 in
rabi season between small and large farm groups.
62
Kalirajan, K. (1981), “The Economic Efficiency of Farmers Growing High Yielding, Irrigated Rice in
India”, American Journal of Agricultural Economics, pp.566-570. Website.
73
2. There were equal differences between price efficiency parameters of small
and large farm groups; and
3. The null hypothesis of equal relative technical efficiency between small and
large farm groups could not be rejected.
These findings indicate that given the same acres to the input and equal terms,
small farmers would respond to economic opportunities in the same way as large
farmers. However, in order to achieve this, special institutional arrangements may be
necessary to ensure equal access for small farmers to input.
Rao (1982)63
favours mechanization in agriculture and he places some reasons
for it.
a) To overcome labour shortage during the peak periods and on draught
animals which have low productivity and high costs?
b) To increase the rate at which operations are performed by timely and
effective farm operations.
c) To step up total production by using water pumps and adopting multiple
cropping.
d) To perform tasks that cannot be done effectively by traditional methods.
e) Many of the major crop operations in India are rigidly bound by the season.
Because of the labour during peak period is very high and hence labour
shortage is usually experienced. This necessitates the use of mechanical
appliances in our agriculture.
63
Parameshwara Raw, (1982), “Southern Economist” Vol.20, No .21, p.19. Print.
74
f) As better land preparation and also timeliness of agricultural operations are
crucial for higher production, we are forced to use tractors in agriculture
despite their adverse effects on employment.
g) Our traditional implements are crude, inefficient and inadequate. It is highly
uneconomical to complete agricultural operations using them.
They need to be replaced by improved agricultural machinery and implements.
Sidhu and Singh (1986)64
define Technological change as all the available
means which improve the efficiency of converting scarce resources into products which
satisfy human wants. It manifests itself in the use of new inputs and knowledge leading
to an upward shift of the production function in the long-run.
Sharma (1988)65
in his study on farm mechanization in Punjab observed that
the average returns on the tractor operated farms were 28.47 percent higher than the
bullock operated farms. The higher income on tractor holdings was described to shift in
the cropping patterns in favour of more remunerative enterprises, increased cropping
intensity, higher expenditure on the yield, increasing technology and better preparation
of land, timely, performance of operation and better placement of seeds and fertilizer.
D.S. Karale et.al, (2008)66
the study has been carried out on Central Research
Farm (CRF) Dr PDKV, Akola and farmer based at village Gorwha. The operational
energy input of the cotton and soybean crop were collected for traditional and self
propelled mechanized small farming. The operations considered were as sowing,
64
Sidhu, D.S. and Singh, H.J. (1986) “Technological change in Indian Agricultural Development
Since Independence”, ed., M.L. Dantwala and others, Oxford & IBH Publishing Co. Pvt. Ltd. Print.
65 Sharms A.C., (1988), Op. cit. P.27.
66 Karale, D.S. et. al, (2008), “Energy Economic of Small Farming Crop Production Operations”, World
Journal of Agricultural Sciences 4(4): pp. 476-482. Website.
75
intercultural, harvesting and picking of the crop. The energy input like human power,
bullock power for traditional operation was examined in entire work of this study.
Similarly, the energy used in operations of mechanized farming was examined for the
exact quantification of the operational energy input. The study reflects the comparison
of the operational energy input of both small farming. The operational energy input in
traditional farming of soybean crop was observed more than mechanized farming. In
cotton crop practices operational energy used was more in traditional farming as
compared to mechanized farming. The cost of energy is four times more in traditional
farming as compared to mechanized for soybean crop. Similar way in cotton the cost of
energy is double in traditional farming as compared to mechanized farming. On the
basis of the cost of energy, the soybean crop with the mechanized farming is the best
option for maximize the net profit of the small farmers in the region.
The data collected in cotton and soybean crop production small farming system
were analyzed for the exact quantification. The various operation in crop production of
crops like sowing, intercultural and harvesting and picking were considered for the
operation energy input determination. Results obtained by the self propelled toolbar i.e.
mechanical farming and by human i.e. traditional farming in CRS farm and Gorwha. It
is now concluded that mechanized farming of soybean crop shows the significant
saving in operational energy as well.
Vanitha (2008)67
states that intensive cropping system are often based on
manual labour such as in traditional paddy rice and raised – bed agriculture, or on
highly mechanized systems based on purchased inputs. Intensive agriculture is an
essential component of habitat management because it limits requirements for new
67
Vanitha, K. (2008), “Development of Modern Agriculture”, Agriculture under Globalization,
Dominant Publishers and Distributors, New Delhi, p.103. Print.
76
areas of land. It can however, lead to degradation of natural resources if not managed
appropriately. Modern Agriculture includes plant breeding, biotechnology and
associated intellectual property rights, all of which are potentially able to adversely
affect the natural resource base, particularly through declining biodiversity. High
productivity is obtained in mechanized monoculture which in turn is dependent on
chemicals which may inadvertently destroy desirable flora and fauna. Intensive
cropping systems are suited to those environments where high yielding varieties,
chemical inputs, fertile soils and irrigation can be guaranteed.
Ibrahim Soliman et.al, (2010)68
the study reveals that from 1986 to 2007
Egypt’s agricultural policy transitioned from a tightly controlled to a more liberalized
regime. This study examines the impact of this change on the performance of the wheat
(imported grain) and rice (exported grain) sectors. In terms of profitability, we found
that the cost of production increased substantially in both grains, driven primarily by
the rise in land rent and labor wage. But the wheat and rice sectors’ profitability did not
suffer significantly, as advances in new seed technologies and adoption of better farm
practices including farm mechanization increased yield and compensated for the higher
cost. Considering market efficiency, we found that over the study period the farmer’s
share of the consumer’s expenditure dropped from 51 percent to 37 percent in the case
of wheat, while it increased from 24 percent to 26 percent in the case of rice. The
reverse happened for wholesale and retail margin share, where it increased for wheat
and decreased for rice. It is likely that the discipline from foreign suppliers of imported
wheat and foreign market opportunities for exported rice may explain the difference in
the changes of the distribution of consumer expenditure. Finally, we found that area
68
Ibrahim Soliman, Jacinto F. Fabiosa, Mohamed Gaber Amer, and Siham Kandil, (2010), “Impacts of
the Economic Reform Program on the Performance of the Egyptian Agricultural Sector”, Working
Paper 10-WP 509, Center for Agricultural and Rural Development Iowa State University, Ames,
Iowa, pp. 1-30. Website.
77
response elasticity decreased over time from 0.58 to 0.12 for rice and 0.60 to 0.38 for
wheat. The lack of response in rice area despite rising prices is attributed to the land
limit strictly imposed by the Government of Egypt because of water supply constraint
considerations. On the other hand, the lack of response in wheat area despite rising
wheat prices may be attributed to the rising competitiveness of Egyptian clover, which
is a main feed ingredient for the growing livestock sector.
S. Anitha et.al, (2011)69
Field experiments were conducted to compare the
System of Rice Intensification (SRI) with the best management recommendations and
farmers’ practices of rice (Oryza sativa L.) production. The study concluded that the
on-station experiments showed that SRI did not increase rice yields compared to the
recommended practices. The key management principles stated in SRI such as age of
seedling (10 day-old) and wider spacing (25 x 25 cm) had negligible effects on rice
productivity. Intermittent irrigation, however, was equally effective as continuous
flooding. By employing cono-weeding, the labour required for weeding could be
reduced by 35 man-days ha–1 and labour cost by Rs. 3125 ha–1. This study did not
support the notion that the multiple SRI component practices act synergistically under
humid tropics, implying that the yield benefits of SRI practices was inferior to that of
the recommended management practices. SRI practices, however, gave better yield
than the farmers’ practices. On farm experiments revealed that planting one or two 15
to 20 day-old seedlings hill–1 at 20 x 15cm spacing and employing cono-weeding and
intermittent irrigation are economically feasible technologies. In general, the
recommended practices outperformed SRI in the farmers’ field trials, implying the need
for sustained extension support for ensuring adoption of improved technologies.
69
Anitha, S. and Mani Chellappan, (2011), “Comparison of the system of rice intensification (SRI),
recommended practices, and farmers’ methods of rice (Oryza sativa L.) Production in the humid
tropics of Kerala, India”, Journal of Tropical Agriculture 49 (1-2): pp. 64-71. Website.
78
Khairunnisa Binti Yakub (2012)70
has presented the thesis to the Higher
Degree Committee of Ritsumeikan Asia Pacific University for the Degree of Master of
Science in Asia Pacific Studies. This research explores the food security of Brunei
Darussalam, particularly on how the state strives to be self-sufficient in rice production.
It aims to understand the contemporary rice farming and discover the changes in the
farming landscape. The fieldwork was conducted at Wasan Rice Farm which was the
first large-scale mechanized wet rice cultivation in the country. An ethnographic
method was used in the study with the use of unstructured interviews to discover the
dynamics of Wasan and provide in-depth understanding of farming from the perception
of the participants. The study discovered that the failure of Wasan project was
attributed to the management problems and the socio-economic conditions of Brunei.
The country is heavily dependant on oil and gas industry at the expense of agriculture.
In addition, the local people have negative attitudes towards agriculture. It was seen as
less prestigious compared to employment in the government and private sectors. The
revival of Wasan had huge impacts on the agricultural landscape and renewed the hope
for self-sufficiency in food. The research unraveled the roles of army personnel and
village cooperatives at reviving the abandoned rice plots. These cooperatives improved
the efficiency of the management of Wasan and restored the public confidence in rice
farming. To a large extent, farming was no longer perceived as a ‗second class‘
income. However, the government‘s intervention on the farm began to affect the
farmers. The farmers felt some of the policies were unsuitable to Wasan and reduced
the yield‘s quality. Nevertheles, Wasan is still at an experimental stage and there are
more to discover in that farmland.
70
Khairunnisa Binti Yakub (2012), “An Ethnographic study of Wasan rice farm in Brunei Darussalam”,
Dissertation, Ritsumeikan Asia Pacific University. Website.
79
Zahra Keikha et.al, (2012)71
Candidate of Master Program, Geography and
Rural Planning, Department of agricultural economics, University of Zabol, according
to their study, Being made Over Land, Irregular And Uneven Parts, Lack Of Roads
Between Farms And Irrigation And Poor Drainage are major Problems In the way of
Agricultural products that are placed in the city of Zabol. In order to increase its
production and mechanization, ultimately increasing productivity and improving the
economic status of farmers the Land Consolidation use district of Loutak Zabol started
in 1995, and ended in 2005. For this purpose, two Consolidation villages (Loutak and
Islamabad) and two non-Consolidation villages (Kalati Mosafer and Varmal) for
comparison in the study area, were examined. Methods In this study are descriptive-
analytical in the form of adaptive. Information and data obtained through a survey
(by land and interview with the operation and relevance to the following organizations),
is prepared and collected. The results show that the Land Consolidation, reducing the
number of parts, increasing acreage, increasing land values, reduced water
consumption, increased use of agricultural machinery, agricultural products and
ultimately increase the income of farmers had a significant effect. So there is a direct
relationship between the land consolidation and mechanization of the agricultural
products.
Ranjan Roy et.al, (2013)72
Department of Geography, School of Humanities,
University Sains Malaysia, Penang, Malaysia, their Indicators are increasingly
recognized as an important decision aid tool to translate sustainability issue from theory
into practice. However, indicator development for sustainable community development
71
Zahra Keikha and Alireza Keikha, (2012), “Land consolidation and its economic effects on the city
district of Loutak_Zabol”, International Journal of Economic Research, Vol. 3, Issue 5, pp. 53-60.
Website. 72
Ranjan Roy, Ngai Weng Chan and Ruslan Rainis, (2013), “Development of Indicators for Sustainable
Rice Farming in Bangladesh: A Case Study with Participative Multi-Stakeholder Involvement” World
Applied Sciences Journal 22 (5): pp. 672-682. Website.
80
is rather successful than the agricultural sector due to methodological lacuna. The aim
of this study is to develop a methodological framework for indicator development and
an essential set of indicators of sustainable rice farming in Bangladesh by adopting
participatory multi-stakeholders involvement approach. The study adopted informal
discussion with academicians, literature review, online experts’ survey and focus group
discussion with the farmers of three sub-districts that represent irrigated, rainfed
lowland and upland rice growing ecosystems. These exercises yielded a set of
indicators of three dimensions: economics (6), society (10) and environment (5), as
well as a process of deriving indicator system with requisite information. The paper
concludes that by employing a true participatory approach indicator development
collectively decisive to extract an essential and representative set of indicators.
Moreover, the study indicates the more significance of social indicators in promoting
rice farming sustainability is Bangladesh. We highlight sustainability indicator
development is a fairly demanding and challenging process. However, a blend with
stakeholder’s knowledge and local experience enhances the questions of indicator’s
applicability and practicability.
2.4 RESEARCH GAP FILLED UP IN THE STUDY
Review of earlier studies on cost, returns, determinant of yield, profit function
approach has helped the researcher to identify the research gap. The previous studies
covered mainly on cost return structure, determinants of yield and labour absorption.
Comparative study on mechanized and non-mechanized farms with size-wise studies
for paddy cultivation remains not fully explored research. Therefore, in-depth and
comprehensive study on mechanized and non-mechanized paddy cultivating farms in
this respective attempts to evaluate the cost and return structure, determinant of yield
81
gap, supply responsiveness and input demand elasticities. This kind of study will be
useful to planners and programme implementers to understand the factors which
influence on yield of paddy in the study area. Therefore, the present work in some
aspects is a follow up work and also claims improvement over the other studies.