Embed Size (px)
Citation preview
24
Chapter II
EXPERIMENTAL TECHNIQUES
2.1 INTRODUCTION
Different experimental techniques are employed for obtaining the
structural and other information about the glasses [1-3]. In the present
investigation the alkalihalo borate glasses containing the second glass
former P2O5 were prepared and characterized by different experimental
techniques. A brief description of the various experimental methods
employed is given in this chapter.
2.2 SAMPLE PREPARATION BY MELT QUENCHING METHOD
The conventional melt quenching method has been employed for the
preparation of the glass samples in the present investigation. A brief
description of the melt quenching method is presented below. The melt
quenching is a process of cooling the melt at a sufficient rate to bypass
crystallization so that the disorder of the liquid is retained in the glassy
state. In the melt quenching technique, the materials initially in crystalline
or polycrystalline state are grounded to achieve fine mixing. The mixture is
then taken in a suitable crucible and is melted in an electrically heated
furnace. The melt is then quenched on to a steel plate maintained at room
temperature or higher temperatures depending on the material to be
prepared into glass. A steel block is used to dissipate the heat from the melt
at a rate suitable to bypass crystallization of the material.
25
In the present work, different glass samples were prepared by using
reagent grade Boric acid (H3BO3), Phosphorous pentoxide (P2O5), Potassium
carbonate (K2CO3), Sodium carbonate (Na2CO3),Sodium chloride (NaCl),
Sodium bromide (NaBr), Potassium chloride (KCl),Potassium bromide (KBr),
Potassium iodide (KI),Copper oxide (CuO) and Vanadium pentoxide (V2O5).
Required starting materials (in mole %) for various compositions were
weighed to get 10 grams. Each batch was then melted in porcelain crucibles
in an electric furnace at about 1150 K for about 30 minutes. The melts were
then quenched by pouring them on to a stainless steel plate maintained at
373 K. The glasses were annealed for 24 hours at the same temperature to
relieve the mechanical stress.
The details of the composition of the glasses studied are given in
Chapters III and IV.
Different experimental techniques employed in the present
investigation are described below.
2.3 X-RAY DIFFRACTION
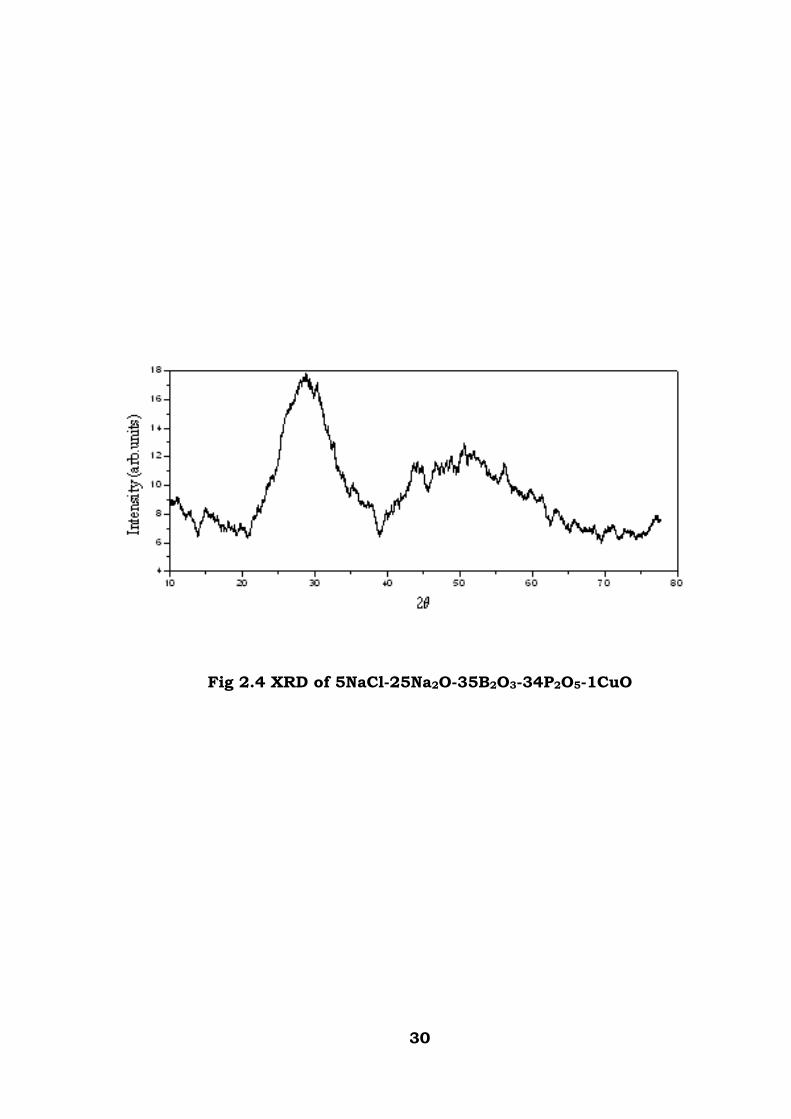
X-ray diffraction technique was used to confirm the glassy nature of
the samples. In the present study, fine powder of the glass samples is used
for X-ray diffraction investigations. Philips X pert PRO XRD (Pan Analytic)
model powder X-ray diffractometer with copper tube was used to record
the X-ray diffractrograms at room temperature.
26
Typical X-ray diffractograms of different glassy systems thus prepared
are shown in Fig’s. 2.1 to 2.4. X-ray diffraction analysis of each glass
sample revealed the absence of crystallinity. The recorded diffractograms
were featureless and peak free revealing the amorphous nature of all the
glass samples prepared.
2.4 DIFFERENTIAL SCANNIG CALORIMETRY (DSC)
Differential Scanning Calorimetry (DSC) is one of the significant
experimental techniques to study the thermal properties of solids. The glass
transition temperatures can be determined from the DSC studies.
In the present study, DSC is used to determine the glass transition
temperature of the glass samples. The glass samples in the form of flakes
are crushed are hermitically sealed in aluminum pans using TA instruments
sample encapsulating press. The empty aluminum pans pierced by the
encapsulating press were used as reference material. The sample weighing
approximately about 15 mg was kept in the DSC cell and nitrogen at a flow
rate of 90cm3/mm is used as purge gas. The sample was heated at a
constant heating rate of 100 C/min. After the run was completed, the glass
transition temperatures (Tg) were calculated from the thermal analysis
software available in the PC attached to TA instrument.
In the DSC technique the sample is heated in a programmed way and
the heat (H) flow of the sample and the reference (chemically inert) material
are compared. In a DSC trace, the Y-axis represents dH/dt that is actually

27
FIg 2.1 XRD of 1KCl-29K2O -35B2O3-34P2O5-1CuO glass

28
FIg 2.2 XRD of 1NaBr-29Na2O -35B2O3-33P2O5-2V2O5 glass

29
FIg 2.3 XRD of 1KBr-29K2O -35B2O3-33P2O5-2V2O5 glass
30
Fig 2.4 XRD of 5NaCl-25Na2O-35B2O3-34P2O5-1CuO
31
the differential power (in mW) and the X-axis represents the temperature (T).
The DSC determines the temperature and heat flow associated with material
transitions as a function of time and temperature. The thermal events are
recorded for a particular heating rate dT/dt in the form of endothermic or
exothermic peaks superimposed on the horizontal base line.
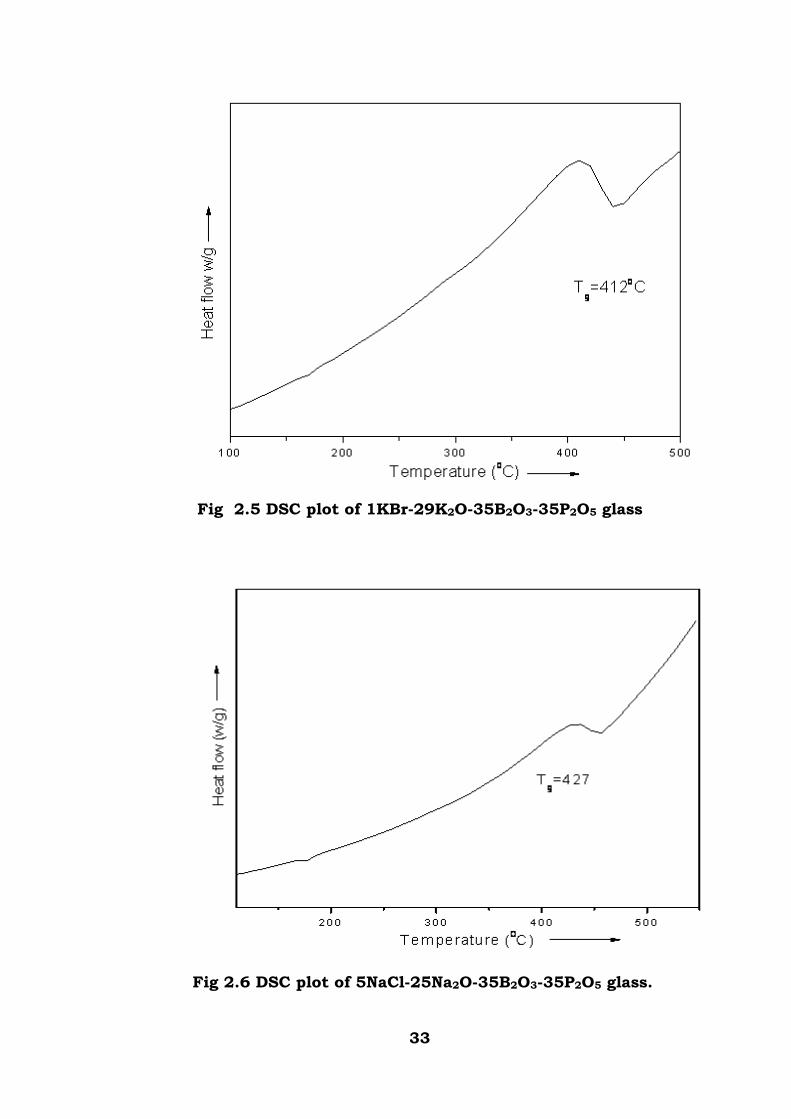
In the present investigation, the glass transition temperatures (Tg) of
all the glass systems were determined using TA instruments DSC 2010
thermal analysis PC based instrument.
A complete set of DSC 2010 system of TA instruments includes the
2010 instrument and a controller. Both temperatures and the heat flows
associated with transitions in materials can be rapidly measured by the
system. If a sample and the inert reference are heated at a known rate in a
controlled environment, the increase in the sample and reference
temperature will be about the same depending on the specific heat
differences, unless a heat-related change takes place in the sample. If this
change takes place, the sample either evolves or absorbs heat. In DSC, the
temperature difference between the sample and the reference form such a
heat change is directly related to the differential heat flow.
The 2010 DSC cell is used to measure differential heat flow. The
sample and reference materials are placed in pans that sit on raised
platforms on a constantan disc and heat is transferred through the disc up

32
into the sample and the reference. The differential heat flow is monitored by
chromel-constantan thermocouple, placed beneath the disc.
A silver-heating block, capped with a vented silver lid, encloses the
constantan disc. Purge gas is pre-heated within the block before entering
the sample chamber through the purge gas inlet. Gas exits through the vent
hole in the silver lid. A bell jar placed over the cell and sealed with an o-ring,
protects the operator from evolved gases and permits cell evacuation.
Fig 2.5 and 2.6 show the DSC thermograms.
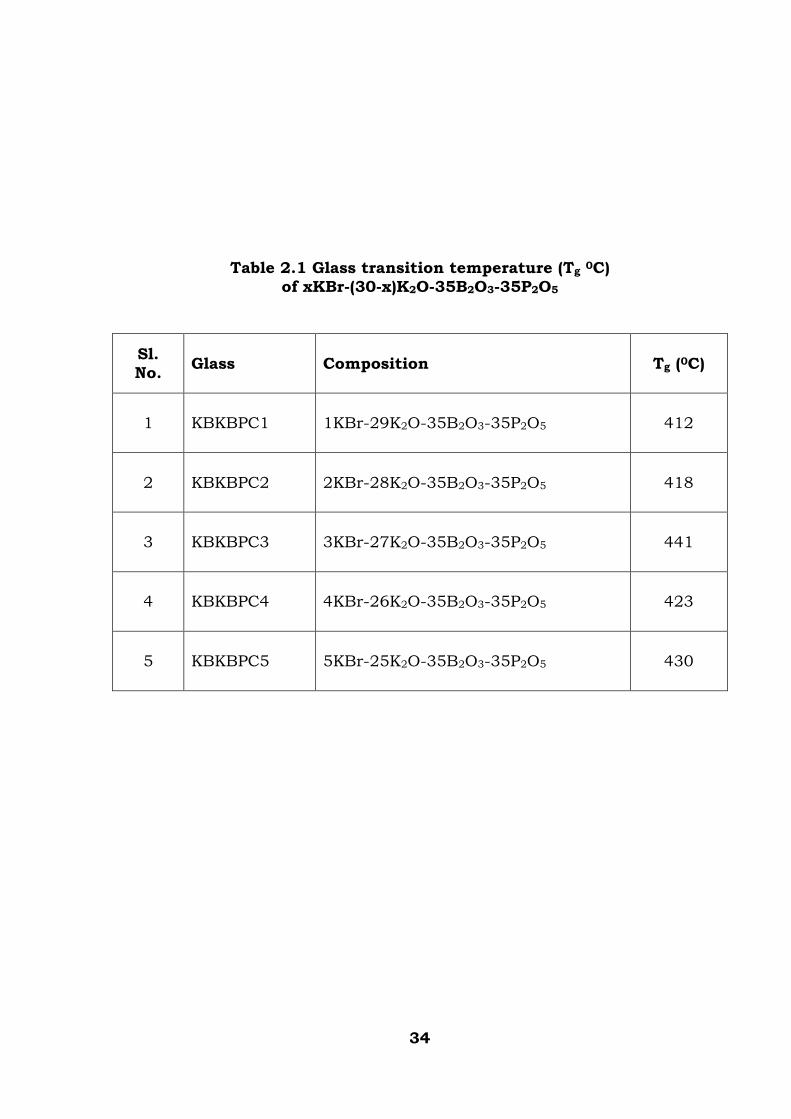
The glass transition temperatures (Tg) are given in Tables 2.1 and 2.2.
2.5 ELECTRON PARAMAGNETIC RESONANCE (EPR) SPECTROSCOPY
The EPR spectrometer operates at fixed microwave frequency and
scans the EPR spectrum by linear variation of the magnetic field. The
majority of EPR spectrometers operate in the X-band frequencies (~ 9 GHz).
The next widely used are Q-band (~35 GHz) EPR spectrometers. The
important features of EPR spectrometers are
1. A source of microwave radiation of constant frequency with
variable amplitude.
2. A means of applying microwave power to the paramagnetic sample.
3. An arrangement to measure the power absorbed from the
microwave field and
4. Homogeneous and variable magnetic field.
33
Fig 2.5 DSC plot of 1KBr-29K2O-35B2O3-35P2O5 glass
Fig 2.6 DSC plot of 5NaCl-25Na2O-35B2O3-35P2O5 glass.
34
Table 2.1 Glass transition temperature (Tg 0C) of xKBr-(30-x)K2O-35B2O3-35P2O5
Sl. No. Glass Composition Tg (0C)
1 KBKBPC1 1KBr-29K2O-35B2O3-35P2O5 412
2 KBKBPC2 2KBr-28K2O-35B2O3-35P2O5 418
3 KBKBPC3 3KBr-27K2O-35B2O3-35P2O5 441
4 KBKBPC4 4KBr-26K2O-35B2O3-35P2O5 423
5 KBKBPC5 5KBr-25K2O-35B2O3-35P2O5 430
35
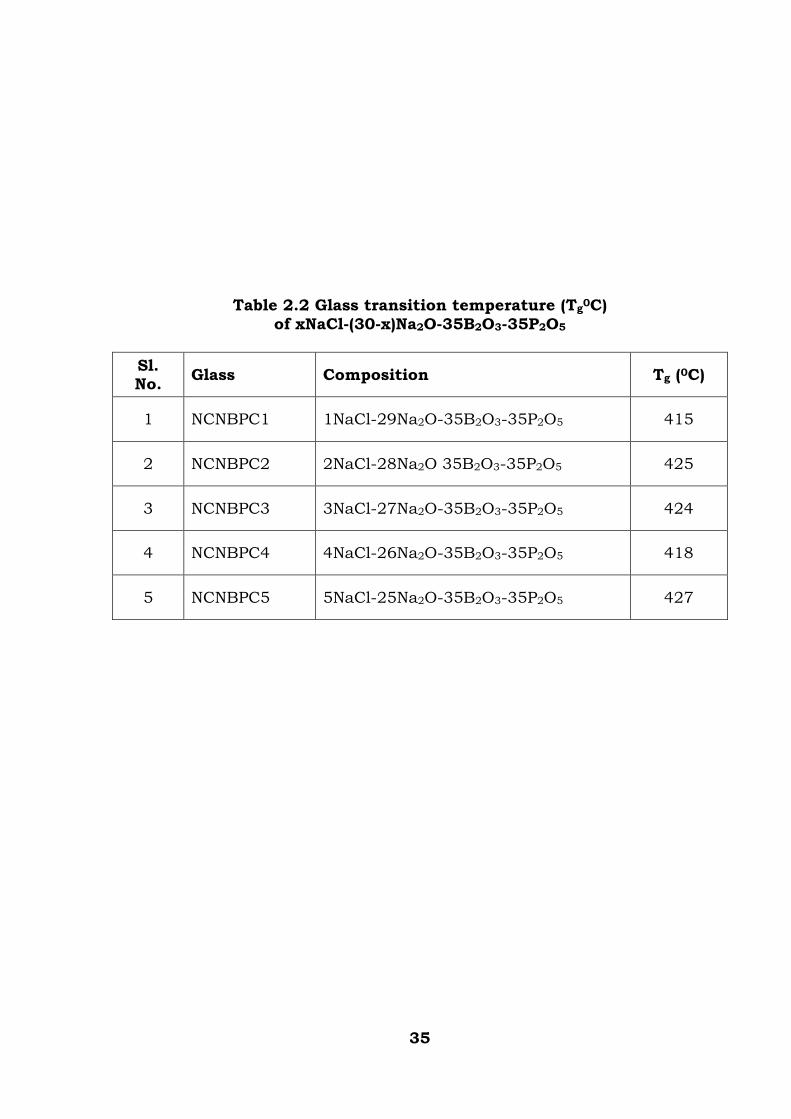
Table 2.2 Glass transition temperature (Tg0C) of xNaCl-(30-x)Na2O-35B2O3-35P2O5
Sl. No. Glass Composition Tg (0C)
1 NCNBPC1 1NaCl-29Na2O-35B2O3-35P2O5 415
2 NCNBPC2 2NaCl-28Na2O 35B2O3-35P2O5 425
3 NCNBPC3 3NaCl-27Na2O-35B2O3-35P2O5 424
4 NCNBPC4 4NaCl-26Na2O-35B2O3-35P2O5 418
5 NCNBPC5 5NaCl-25Na2O-35B2O3-35P2O5 427

36
The EPR spectra of the glasses containing transition metal ions were
recorded on a JEOL EPR spectrometer that works in X-band frequency
range with 100 kHz field modulation. The principle and construction of the
EPR spectrometer were shown in Fig. 2.7 and 2.8. The main parts of the
EPR spectrometer are (1) microwave unit (2) cavity resonator (3)
electromagnet and excitation power supply (4) signal averager and (5) CRO
and recorder.
2.5.1 EPR Spectrometer
The EPR spectrometer consists of a magnetic field control unit, a 100
kHz modulation unit, oscilloscope and recorder. The microwave unit
consists of a Gunn diode oscillator, magic T, automatic frequency control
(AFC) unit and a Gunn diode power supply with the Hall element, the linear
field sweep unit, the decoder, modulation coil etc. Its magnetic control unit
controls the magnetic field over a range of 0-600 milli Tesla. The oscilloscope
screen provides a facility for mode check and observation of EPR signal. The
DYT type recorder records the EPR signal on a chart of width 250x360mm.
The instrument includes microwave unit, pre amplifier, AFC and
Gunn diode oscillator power supply. The Gunn oscillator produce
microwaves in the frequency range 8.8 to 9.6 GHz (X-band) at power
variable from 0.1 mW to 200mW. The oscillation frequency is mechanically
varied by varying the cavity resonator frequency. The AFC can be used to
maintain the stability of the frequency so that the oscillation of the Gunn
diode oscillator matches the frequency of the sample cavity resonator.

37
Fig 2.7 Principle of X-band Electron Paramagnetic Resonance Spectrometer
Fig 2.8 The Construction of JEOL FE-1X EPR spectrometer.
38
Microwaves from Gunn diode oscillator are allowed to pass through
the isolator. The reference line and the signal line are divided by means of
the directional coupler. The signal is attenuated to the required power and
finally enters the cavity resonator. When the cavity resonator coupling is
adjusted for critical coupling, there are no reflected waves from the cavity
resonator. When EPR is exited, microwaves from the cavity resonator are
reflected and enter the balance mixer that is made up from the magic T and
the crystal mount. The waves are detected and amplified by the pre-
amplifier.
The cavity resonator consists of an ultraviolet irradiation aperture, a
cooling constant temperature device, a 100 kHz modulation coil, bayonet
connectors for connecting the variable temperature attachments, a nitrogen
gas inlet port and so on. The sample tube held by a sample tube holder is
inserted into the sample insertion port located on the upper wall of the
cavity and secured by means of a clamp screw.
The electromagnet produces a magnetic field having a maximum field
sweep of ± 2500 G. The Hall element supplies ac voltage to the magnetic
field control unit. Excitation power supply supplies a highly stabilized
excitation current to the electromagnet. The homodyne crystal detector is
used for the detection of the signal. The sample is placed in the cavity
resonator and adjusted to be at the middle of the poles of the electromagnet.
Now the sample subjected to microwave magnetic field of constant
frequency, which is perpendicular H. The magnitude of H is changed by
varying the electromagnet excitation current and when the resonance

39
condition is fulfilled, a part of microwave energy is absorbed into the sample
as a result, the cavity resonator Q value changes. This Q variation is
detected, amplified and recorded.
While the magnetic field is varied and when the frequency is kept
constant, an absorption signal is observed. Later on a differential curve is
derived from the absorption curve. Since the crystal noise output is inversely
proportional to the modulation frequency, the amplitude of high frequency
magnetic field modulation enables high sensitivity EPR measurements to be
carried out.
2.6 OPTICAL ABSORPTION SPECTROSCOPY
UV-VIS spectroscopy is an important experimental technique involving
the measurement of the absorption of the UV and visible light by a sample.
The UV and visible spectrum originates from the electronic
excitations. The absorption of UV and visible radiation by a molecule leads
to transitions among the electronic energy levels of the molecules.
In the present study, optical absorption spectra of the glass samples
doped with transition metal ions (Cu2+) were recorded at room temperature
using Shimadzu-UV 3100PC, UV-VIS-NIR spectrophotometer. The block
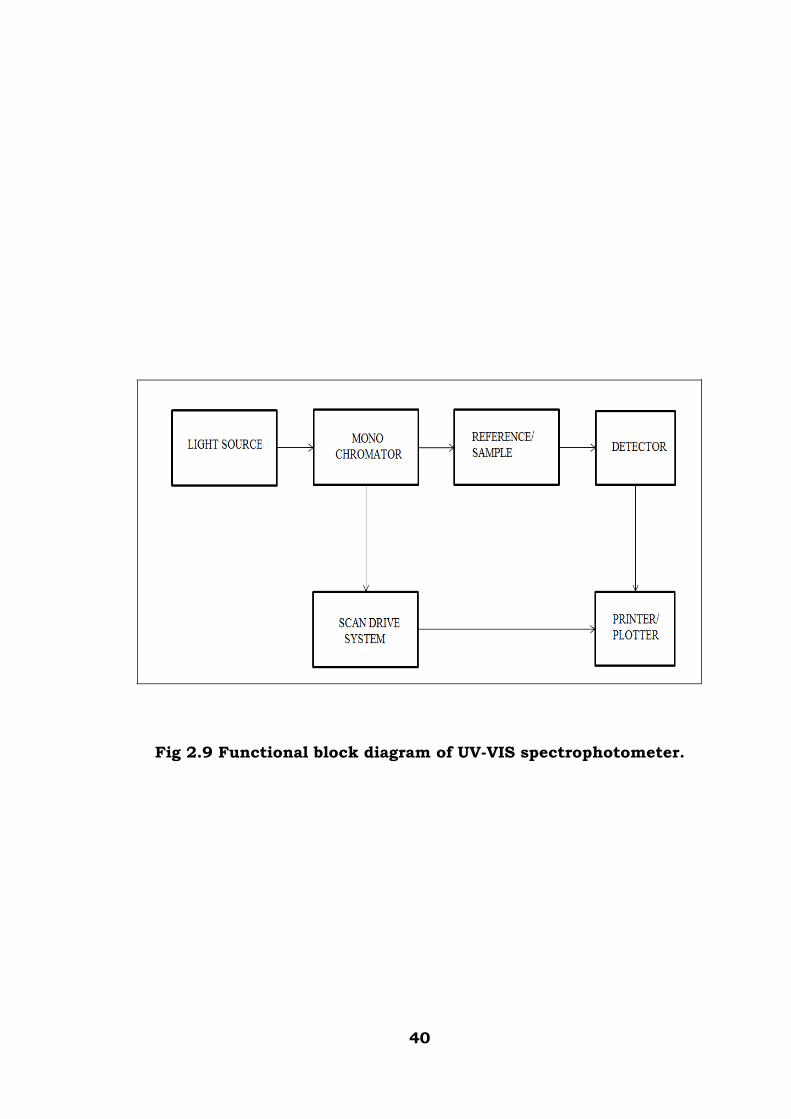
diagram of the spectrophotometer was shown in Fig. 2.9.
40
Fig 2.9 Functional block diagram of UV-VIS spectrophotometer.
41
The spectrophotometer is a computer controlled double beam, direct ratio
measuring system. It compares the data obtained from the sample with the
data from the reference. The spectrophotometer operates in the wavelength
region of 190 nm to 3200nm with a slit width variation of 0.1 to 30 nm and
a resolution of 0.1nm. The spectrophotometer (Fig. 2.9) consists of a light
source, a mono-chromater, a detector, amplifier and the recording devices
[4]. The source incorporates a tungsten halogen lamp for wavelengths
greater than 375 nm and a deuterium discharge lamp for values below that
and a solenoid operated mirror, which automatically deflects light from
either one as the machine scans through the wavelengths. The detector is a
photo multiplier tube (R-928 detectors for UV and visible, 190-800nm) and
the ratio of reference to sample beam intensities (I0 / I) is fed to a pen
recorder. The relative intensities of the two beams are given in the form of
optical density (O.D).
O.D = log10(I0/I) …… (1)
The optical absorption spectra were recorded for the glass samples in
the wavelength region 200 to 1200 nm. The peak positions of the spectrum
were obtained by using peak-pick facility provided in the spectrophotometer.
The uncertainty in the measurement was about ±1 nm.
2.7 DC IONIC CONDUCTIVITY
The dc electrical conductivity is defined as the steady state current
which flows in the sample, subjected to unit electric (d.c) field. Conductivity
is obtained from the conductance value using the relation
42
σ = ( ) 1cmohmAt.G −− ……(2)
where ‘t’ is the thickness, ‘A’ the area of cross section of the sample and ‘G’
is the conductance which is the ratio of steady state current to applied
voltage.
The dc electrical conductivity measurements on the glass samples
were performed using a laboratory built apparatus.
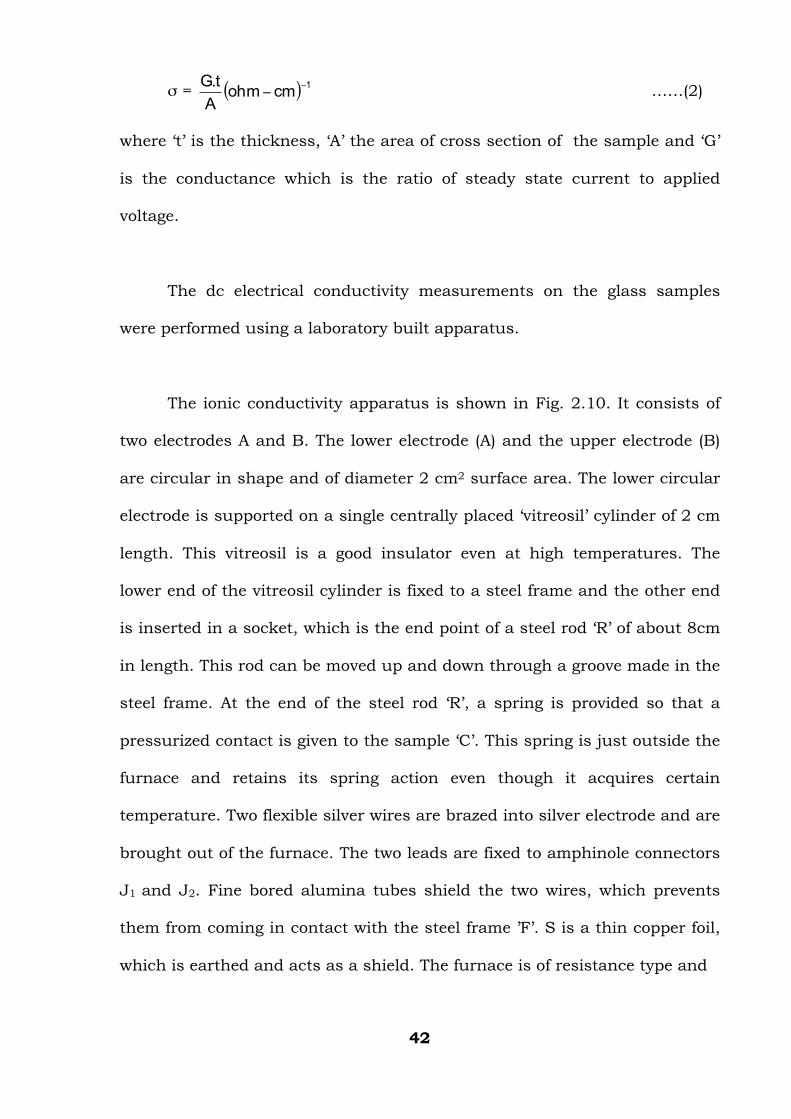
The ionic conductivity apparatus is shown in Fig. 2.10. It consists of
two electrodes A and B. The lower electrode (A) and the upper electrode (B)
are circular in shape and of diameter 2 cm2 surface area. The lower circular
electrode is supported on a single centrally placed ‘vitreosil’ cylinder of 2 cm
length. This vitreosil is a good insulator even at high temperatures. The
lower end of the vitreosil cylinder is fixed to a steel frame and the other end
is inserted in a socket, which is the end point of a steel rod ‘R’ of about 8cm
in length. This rod can be moved up and down through a groove made in the
steel frame. At the end of the steel rod ‘R’, a spring is provided so that a
pressurized contact is given to the sample ‘C’. This spring is just outside the
furnace and retains its spring action even though it acquires certain
temperature. Two flexible silver wires are brazed into silver electrode and are
brought out of the furnace. The two leads are fixed to amphinole connectors
J1 and J2. Fine bored alumina tubes shield the two wires, which prevents
them from coming in contact with the steel frame ’F’. S is a thin copper foil,
which is earthed and acts as a shield. The furnace is of resistance type and

43
Fig 2.10 Ionic Conductivity Apparatus
44
consists of alumina muffle of 30 cm long and 10 cm diameter. The
heating element is a super kanthal wire wound on the muffle. The number
of windings on the muffle is more at the place where the sample is placed.
A temperature controller controls the temperature of the furnace. The
outer surface of the furnace is covered with a metallic sheet, which in turn
connected to earth in order to avoid pick up currents. The stainless steel
frame ‘F’ hangs into the muffle over a steel rod support. A d. c voltage is
applied to the sample through a battery placed in a separate box that is
thermally insulated. The temperature of the sample is measured by
connecting the output of the chromel-alumel thermocouple arranged very
close to the sample to a digital voltmeter.
The sample used for the conductivity measurement was polished and
then painted with silver paste for good electrical contacts. The current was
measured using Digital Keithley Electrometer model 614. The polarizing
effects during the conductivity measurement were minimized by applying
smaller voltage for a short interval of time and short-circuiting the sample
leads after every reading. The error in the measurement is about +3%.
45
2.8 REFERENCES
1. S.R.Elliott, “Physics of Amorphous materials”, 2nd ed., Longman Sci. &
Technical, New York (1990).
2. S.Chandra, “Super Ionic Solids: Principles and Applications”, North -
Halland Pub.Co., (1981).
3. Colin N.Bandwell and Elaine M.McCash “Fundamentals of molecular
spectroscopy” 4th ed., Tata Mc Graw Hill Pub., New Delhi (1999).