Embed Size (px)
Citation preview

45
CHAPTER II: Characterization of Polyamidines and Functionalisation
I Synthesis and characterization of a series of polyamidines We selected further polyamidines for this study, each one having different chemical structure and therefore different glass transition temperature, Tg. The first one is an aliphatic polyamidine (POA) whereas the two others are cycloaliphatic polyamidine copolymers. The introduction of a cycloaliphatic monomer allows designing thermal properties. Trans-1,4-diaminocyclohexane monomer is introduced according to the cycloaliphatic/aliphatic molar ratios: 20:80 and 80:20. The corresponding copolymers will be called POC20 and POC80. I.1. Poly (1,8-octamethylacetamidine) oligomers (POA)
POA has been synthesized following the protocol described by Böhme [1] and reported in annex A. POA is obtained by a polycondensation reaction from 1,8 diaminooctane, triethyl orthoacetate and acetic acid as a catalyst, i.e. a bulk polycondensation without any purification. A study on polyacetacetamidine done by Shravanan [2] showed that interesting results are obtained using phenol as a catalyst. Indeed the number-average degree of polymerization ( DPn ) are higher and the phenol is easier to remove from the medium with respect to acetic acid. However, we preferred to use acetic acid for safety reason as phenol is classified as a C.M.R. (Carcinogenic, Mutagenic and Reprotoxic) substance. The POA chains bear amine and acetamide end-groups. The acetamide groups come from the hydrolysis of imidoester groups by traces of water in the medium.
NH
NH
N NH2
O
8 8n
Scheme 1: General structure of the Poly (1,8-octamethylacetamidine)

46
I.1.1 Identification of the chemical structure by NMR and MALDI spectroscopies The 1H NMR spectrum of POA (aliphatic polyamidine) is reported in Figure 1. Chemical shift values are given in ppm with reference to internal tetramethylsilane.
NHN
N NH
HN
1'
2'
3'
4'
4
3
2
1
1d 1c
6
O
6c
6 7
H2N2d
5
Scheme 2: Expected structure of the POA with assigned groups
4.0 3.5 3.0 2.5 2.0 1.5 1.0 0.5 ppm
1d
CH3COOH
1,1’
6c
61c
2,2’
3,3’4,4’
Figure 1: 1H NMR spectrum of the POA (400MHz; solvent: CD3OD; TMS)
The assignments have been done according to the data of the Shravanan’s paper [3]. The spectrum reveals that we correctly synthesized the polyacetamidine. The peak at 2.61 ppm show that the POA bears amine end-groups and the peaks at 1.92 and 3.14 ppm correspond to the acetamide end-groups. For the protons H1 and H1’ two distinct signals could be expected [3]. Nevertheless, due to the tautomerism of the amidine group (R1-NH-C(CH3)=N-R2)/ R1-NH-C(CH3)=N-R2) which is fast with respect to the 1H NMR time scale, coalescence of the signals is observed.

47
Although, a high vacuum and high temperature was applied to remove the acetic acid (catalyst), the signal at 1.88 ppm (CH3C00H) proves that some of acids remain in the reactive medium. This acid is in fact under the acetate form, i.e. bounded to the amidine, and therefore the largest part of the amidine groups are as amidium forms. This hypothesis can be confirmed by the 1H NMR. Indeed, a study done by Sharavan’s [3] showed that when free polyacetamidine is analysed in CD3OD solvent, a proton-deuteron exchange tautomerism occurs between the four hydrogens from amidine groups and the solvent which leads to the nearly disappearance of the peak of the methyl from amidine at 2.1 ppm. If the amidine is protonated, the proton-deuteron exchange tautomerism on the CH3 cannot take place and therefore the methyl (H6) group gives a peak. That is why the presence of the peak at 2.1 ppm indicates that some of the amidine are protonated. Moreover, the methyl group of the acetic acid shows up a peak at 1.99 ppm when it is considered alone in CD3OD, while in the POA solution this peak is shifted to 1.88 ppm pointing out the presence of the acetate form. It has been reported [3] that when polyacetamidine spectra are recorded in deuterated trifluoroacetic acid CF3COOD, because of the high excess of acid, the polyamidinium salt is formed. This protonation results in the splitting of the signals H1 and H1’ because in the predominant configuration adopted by the protonated amidine groups, the protons H1 and H1’ have different chemical environment. On our POA spectrum, this splitting is not observed for the proton H1 and H1’. It can be concluded that the amidine groups are in equilibrium with the protonated form. The study of the architecture from NMR spectroscopy could confirm of the microstructure of polyamidine chains and the calculation of the percentage of each terminal group. The polyamidine has two different terminal groups: an amine and an acetamide group. Then each sample of polyamidine can be composed of three different kinds of chains as shown below:
P NH2H2NP NHHN
O O
P NH2HN
O
The signal used to quantify the amine termination is the signal of protons labelled 1d at 2.6 ppm. The signal taken into account for the acetamide termination is the one of protons H6c at 1.92 ppm. The amino and acetamide end-group percentages are calculated as follows:
% amine end-groups = (I1d/2)/((I1d/2)+(I6c/3)) % acetamide end-groups = (I6c/2)/((I1d/2)+(I6c/3))
48
The results for six POA synthesized in the same experimental conditions denoted POA1, POA2,….POA6 were reported Table 1. Table 1: Percentage of amino and acetamide end-chains for different POA
Samples POA1 POA2 POA3 POA4 POA5 POA6 % amine termination 35 25 50 35 50 27
% amine termination 65 75 50 65 50 72
It appears that the percentage of amino end-groups is comprised between 25 and 50 %. The percentage of each termination depends on the initial amine- orthoester ratio. Nevertheless, during reaction, some monomer could be released from the mixture by evaporation leading to variable chain end ratios. In our case the monomers were introduced in a stoechiometric ratio, so statistically we can expect to obtain the same amount of each termination. We notice that that di-acetamido terminated and amino-acetamido chain- ends are preferentially formed with respect to di-amino terminated structures. These results have been confirmed by mass-spectrometry (MALDI-TOF). A conventional MALDI spectrum of POA is reported Figure 2. The notation a, b, c, respectively designated the di-amino terminated, amino-acetamido terminated, di-acetamido terminated chains. The notation d corresponds to the cyclic POA. The associated number corresponds to the polymerization degree (DP). For example the notation b2 is used for an amino-acetamido terminated chain with a DP of two. The spectrum shows that the three different kinds of chains are present as well as the presence of cyclic compounds.
102.0 432.8 763.6 1094.4 1425.2 1756Mass (m /z)
0
10
20
30
40
50
60
70
80
90
100
% In
tens
ity
397.3
523.4
565.4
313.3
337.3691.6
481.4733.6
172.0901.7
228.2 649.5 1027.8525.4357.3128.1 693.6 1196.0817.7 903.7369.3 483.4 985.8551.4199.8
a1
d2
b1 c1
a2
b2
c2
a3
b3c3
a4b4
c4
a5b5
c5 b6
Figure 2: MALDI spectrum of the polyacetamidine

49
I.1.2 Molar mass characterization (NMR, MALDI)
In the case of polyamidines, the molar mass cannot be calculated from a conventional technique as Size Exclusion Chromatography (SEC). Indeed, the results obtained are not reliable because of interactions created between the polymer chains and the column. This problem is generally met with polar polymers able to form strong hydrogen bonds. To overcome this problem, we chose to use the 1H NMR and the MALDI-TOF spectroscopies to calculate the molar masses of the oligomers. The NMR spectroscopy gives us an average of the molar mass while the MALDI allows reaching the value of all molar masses of each kind of chains presents in the sample. Molar mass determined by 1H NMR: This technique will not allow to obtain the weight-average molecular weight Mw and consequently the polydispersity index (Ip) but gives only the DPn and Mn The DPn is calculated from the signal of the protons from repeating units and from terminations. The repeating unit can be characterized by the signals of protons 2, 2’ to 4, 4’ (1.3-1.7 ppm) or protons: 1, 1’, 1c, 1d. According to the chain-ends, the signal of protons 1d is used for the amino group and the signal of protons 6c for the acetamide chain-ends.
NHN
N NH
HN
1'
2'
3'
4'
4
3
2
1
1d 1c
6
O
6c
6 7
H2N2d
5
Scheme 3: structure of POA with assigned nomenclature
Chain-ends distribution by MALDI-TOF: In addition to the NMR analyses, MALDI-TOF gives information on the distribution of each kind of polyamidine chains depending on their chain ends. Unfortunately MALDI is not quantitative, and could not give the percentage of in function of the DP. However the intensity of the peaks of chains with similar terminations but different masses can be compared. On the Figure 2, if we compare separately each type of chains, we notice that the chains with polymerization degree of 1, 2 and 3 are predominant. We have analyzed four aliphatic polyamidines synthesized in the same conditions. The results are summarized in the following table, the DPn calculated by 1HNMR is also reported.

50
Table 2: Comparison of DPn from MALDI and from 1H NMR
Synthesis 1 2 3
4
range of acyclic DP (MALDI)
0a-7 0-6
0-8 0-11
Cyclic DP (MALDI) 2 2 and 3 2 2,3 and 4 DPn (1HNMR) 6.8 8.2 3.2 5.5
a) a degree of polymerization of zero corresponds to the reaction of one molecule of diamine with one molecule of triethylorthoacetate. From the NMR results it appears that polyamidine oligomers were synthesized with DPn from 3 to 8. Although these polyamidines have been synthesized in the same conditions the value of DPn are variable. In the case of the sample 1, the value of the DPn is very close to that of the longer chain lengths determined by MALDI and for the sample 2 the average DPn calculated from NMR spectrum is higher than the polymerization degree determined by MALDI. These two results are not logical could be explained by an evolution of the polyamidine in solution during the MALDI analyses. It means that the results from MALDI measurements would be underestimated. I.1.3 Thermal characterization of polyamidines POA (TGA, DSC) The thermal stability of the POA has been studied performing thermogravimetric analysis, TGA, measurements under nitrogen up to a temperature of 600°C. Studies on aliphatic polyamidines show that the stability increases with the number of carbon in the amine monomer. From the TGA thermogram, the temperature for which the weight loss is of 5% (T5%) and the maximum temperature of the derivative weight loss curves (Tmax) were determined for a given heating rate. The T5% are found between 190°C and 210 °C and Tmax is equal to 468°C. The thermal behaviour was also studied by differential scanning calorimetry, DSC. The polyamidine was found to be an amorphous polymer. In our case, the glass transition temperature is molar mass dependent (Table 3) due to the low molar masses of polyamidines

51
Table 3: DPn and corresponding glass transition temperature of different POA
Synthesis 1 3
5
Tg (°C) 6 -8 8 DPn (1HNMR) 6.8 3.2 7.3
The polyamidines have low Tg comprised in the range from -3 to 8 °C. The evolution of the Tg are in agreement with the variation of the DPn . I.2 Poly (1,8-octamethyl-co-1,4-cyclohexylacetamidine)( POC)
Copolymers are obtained by a melt polycondensation reaction from 1,8 diaminooctane and trans-1,4-diaminocyclohexane as amine monomers, triethyl orthoacetate and phenol as a catalyst. The reagents were introduced with an amine: orthoester: phenol molar ratio of 1.05:1:0.8 (with respect to the orthoester). The protocol is the same as for the POA synthesis but the phenol is used as a catalyst. These samples have been made at IPF Dresden according to the synthesis protocol described in [3].Two types of POC have been prepared: • with a trans-1,4-diaminocyclohexane/1,8 diaminoooctane molar ratio of 20/80 • with trans-1,4-diaminocyclohexane/1,8 diaminoooctane molar ratio of 80/20. These samples will be respectively denoted as POC20 and POC80. The copolymers present two types of repeating unit: aliphatic and cycloaliphatic. I.2.1 Identification of the chemical structure by 1H NMR and MALDI spectroscopies The NMR spectrum of POC20 and POC80 are reported in Figure 3 and Figure 4 respectively, with the assignments of the various resonances. The structures of the possible chain-ends are shown in Scheme 5, four types have been identified and they are the same for both polymers.

52
3.0 2.5 2.0 1.5 1.0Chemical Shift (ppm)
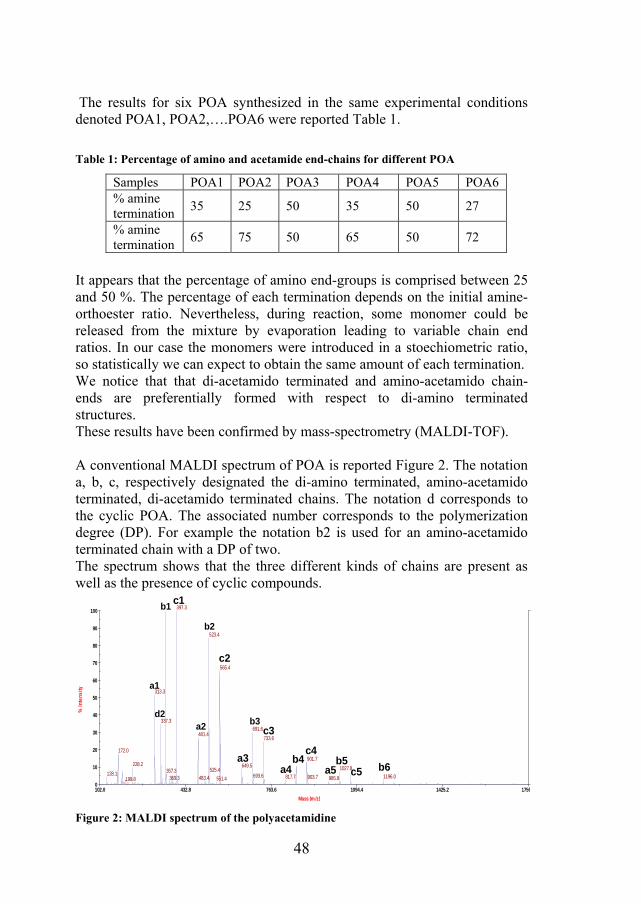
n2b
nb, 3’, 4’
2’
na
6c
m2, 1d
1’
1cm 2d
p1
Figure 3:1HNMR spectrum of POC20
NH
N
HN N
1'
2'
3'
4'
4
3
2
1
5
60.2 0.8
p
o
nanb
m'
n'
n'n
m
H H
Scheme 4: Expected chemical structure of the P0C20 with assignment of hydrogen and carbon
NH
O
1c
6c
5c m2
n2an2bH
H
H2N
O NH
m1
p1
o1
1dNH2
2d
Scheme 5: Different chain-ends of the POC20 and POC80
53
3.0 2.5 2.0 1.5 1.0Chemical Shift (ppm)
nb, 3’, 4’
2’
2d
na
6c p1m2, 1d
1’m
n2b1c
Figure 4: 1H NMR spectrum of POC80
NH
N
HN N
1'
2'
3'
4'
4
3
2
1
5
60.8 0.2
p
o
nanb
m'
n'
n'n
m
H H
Scheme 6: Expected chemical structure of POC80 with nomenclature
We can notice on the spectrum that all intensity of resonances (m, m2, p1, na, n2b) due to the cyclic part increased and all the ones (1c, 1’, 6c, 2’, 2d) from the acyclic monomers decreased. This confirms that the concentration of cycloalipahtic monomer is higher. MALDI measurements were performed on these samples to determine more precisely the molecular structure. A mixing of homopolymers and copolymers with different kind of terminations is obtained. For polyamidine POC20 (20% cycloaliphatic monomer) the following ten different structures:

54
Table 4: Molecular structures of POC20 determined by MALDI-TOF spectroscopy
H2N
A NH2x
x = 1
AH2N CH2 NH C
O
CH38x
x= 1
B *NH2
H2Ny
y = 1 and 2
CH2H2N B NH28 y
y = 1, 2, …6
By
y = 2 and 3
B CH2 NH C
CH3
OH2Nx 8
y = 0, 1, …7
NH CH2 B NH C
O
CH3C
O
H3Cy8
y = 1, 2, …4
NH2 A B NH2yx
x = 1 and 2 ; y = 1, 2, …6
NH2 A B CH2yx
NH C
O
CH38
x = 1 and 2 ; y = 1, 2, …6 NH2 A B CH2
yxNH2
8 x = 1 ; y = 2, 3…6
N C
CH3
NH N C
CH3
NH CH28
A = B =
For polyamidine POC80 (80% cycloalipahtic monomer), the composition determined by MALDI-TOF is reported in the Table 5:

55
Table 5: Molecular structures of POC80 determined by MALDI-TOF spectroscopy
H2N
Ax
NH2
x = 1,2, …,7
A B NH2yx
H2N x = 1,2, …,9 ; y = 1 and 2
HN
Ax
NH2
C
O
H3C x = 1,2 and 3
NH2 A B NHyx
CO
CH3
x = 1, 2, …8 ; y = 1 and 2
I.2.2 Molar masses characterization (NMR, MALDI) 1H NMR analyses were performed at IPF Dresden. DPn can be approximated from the resonance intensities of the repeating units and terminations. The protons used for the calculations are reported in the table below. Groups Protons considered Aliphatic moeity H1’ Cyclic moiety H m Acetamide end-groups H 6c and H p1 Amine end-groups H m2 and H 1d As reported in Figure 3 and Figure 4, the signals H m2 and H 1d are too closed to be integrated separately. To overcome this, two limit cases can be considered: one assumes that the signal at 2.62 ppm is exclusively caused by either cyclic or n-aliphatic terminal groups, therefore two different normalized intensities are available by division of the signal intensity by 1 (case a) or 2 (case b). With other words, we obtain for each sample two sets of normalized signal intensities representing one polymer with only cyclic terminal groups (case a) and one with only n-aliphatic ones (case b). With these assumptions two different compositions can be calculated. In the case of POC20 (20% cyclic monomer), we suppose that the signal at 2.62 ppm only comes from n-aliphatic terminal groups, and for POC80 we assume that the signal is only due to the proton of cyclic terminal groups.

56
Each kind of moiety (cyclic and aliphatic) is considered and added to obtain the DPn . For the cyclic moiety of POC20 the number of pattern is:
[ (IH m/2) *2]/[(I Hm2 + H1d/2) + (I Hp1 and IH6c/3)] For the aliphatic moiety POC20 the number of pattern is:
[ (IH 1’/4) *2]/[(I Hm2 + H1d/2) + (I Hp1 and IH6c/3)] On the spectrum of the copolymer POC80: For the cyclic moiety, the number of pattern is:
[(I H m/2) *2]/[(I I Hm2 + H1d /1) + (I Hp1 and IH6c /3)] For the aliphatic moiety the number of pattern is: [(IH 1’/4) *2]/[( I Hm2 + H1d /1) + (I Hp1 and IH6c /3)] The results of the 1H NMR calculations are reported and compared to the MALDI results in the Table 6. Table 6: Comparison of DPn from MALDI and from NMR
POC20 POC80 range of acyclic DP (MALDI) 0-7 1-10
Cyclic DP (MALDI) 2 and 3 2 and 3
DPn (1HNMR) 12 9 aa degree of polymerization of zero corresponds to the reaction of only one molecule of diamine with one molecule of triethylorthoacetate For polyamidine POC20 the average DPn calculated from NMR spectrum is higher than the polymerization degree determined by MALDI and for POC80, the value of the DPn is very close to that of the longer chain lengths determined by MALDI.These two results are not logical could be explained by an evolution of the polyamidine in solution during the MALDI analyses or by a poor solubility of the longer chains which are not detected.

57
I.2.3 Characterization of thermal properties of polyamidines POC (DSC, TGA)
The value of the, Tg, T5% and Tmax are reported in the Table 7 .
Table 7: Thermal properties of the POC20 and POC80
Tg (°C) T5%a (°C) Tmax
b
(°C) POC20 20 300 419 POC80 84 339 412
a) temperature for which one the weight loss is of 5% b) the maximum temperature of the derivative weight loss curve The effect of the introduction of cycloaliphatic groups in the oligomer backbone is very important. In fact, the glass transition temperature and the value of T5% are increased for the copolymer having more cycloaliphatic groups due to the stiffnes of the cycloaliphatic group compared to the methylene groups in the main chain.
II Functionalisation of Polyamidines with an epoxysilane As reported, the neat polyamidines can be used directly to prepare class-I hybrids materials, i.e. no covalent bonds between the organic and inorganic phase. For the preparation of the class-II hybrid materials in which a covalent bond exists between the two phases, the oligomers have to be functionalised first. For that purpose the chain ends of the polyamidine oligomers will be reacted with organoethoxysilane compounds. II.1 Functionalisation of the Poly(1,8-octamethylacetamidine) with an epoxysilane
For polyamidines POA there are two types of terminal groups: (i) amino and (ii) acetamide groups. Because of the low reactivity of the acetamide groups we considered amino-end groups for grafting alkoxysilane functions. We used the 3 glycidyloxypropyltriethoxysilane (GPTS) as organosilane to functionalise POA, taking profit of the well-known and quantitative epoxy-amine condensation reaction.
58
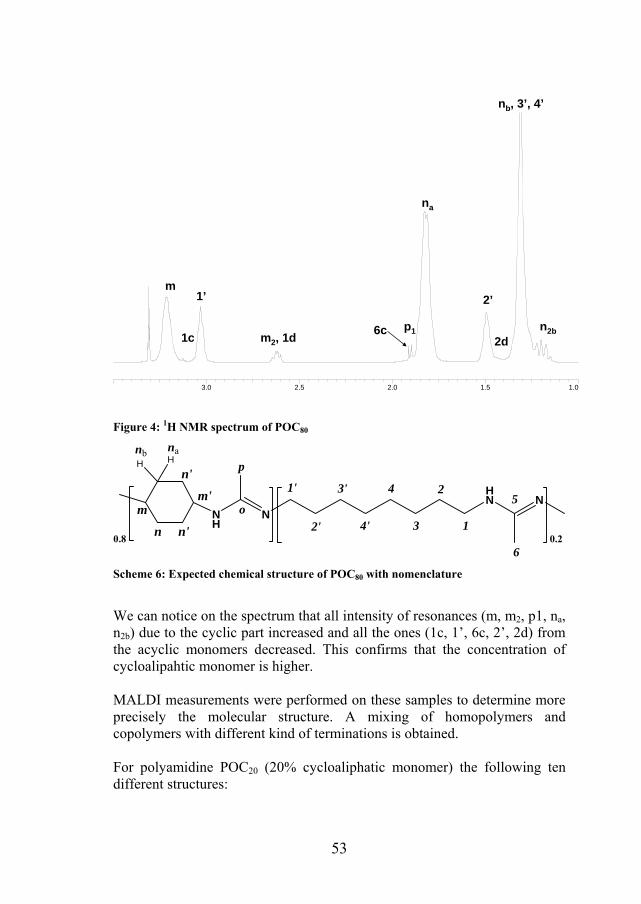
The experimental protocol of the polyamidine functionalisation is described in annex A. The structure of the expected compound is shown below:
NH
NH
N NH O SiO
O
OH
338n8
Scheme 7: Expected chemical structure of the triethoxysilane functionalised POA
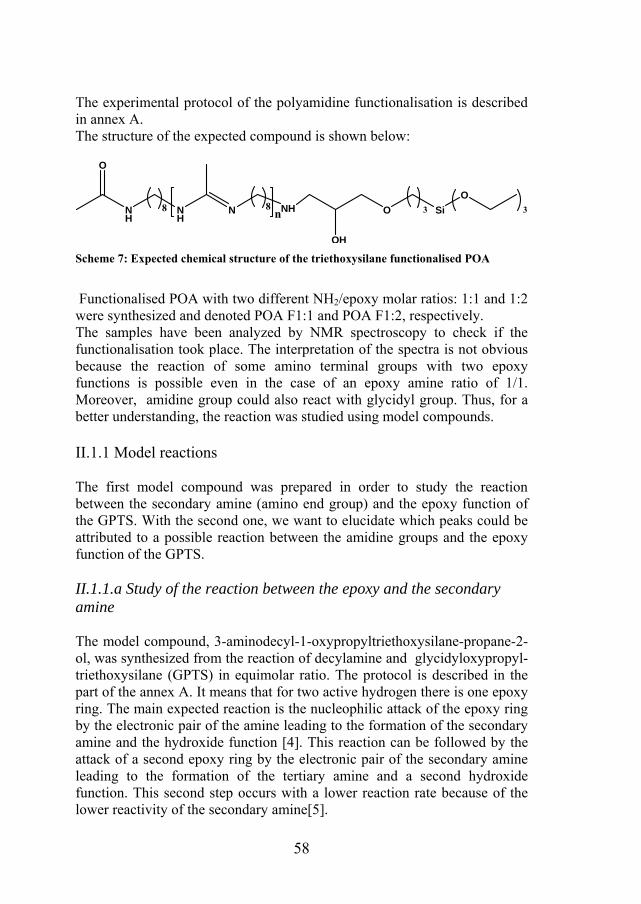
Functionalised POA with two different NH2/epoxy molar ratios: 1:1 and 1:2 were synthesized and denoted POA F1:1 and POA F1:2, respectively. The samples have been analyzed by NMR spectroscopy to check if the functionalisation took place. The interpretation of the spectra is not obvious because the reaction of some amino terminal groups with two epoxy functions is possible even in the case of an epoxy amine ratio of 1/1. Moreover, amidine group could also react with glycidyl group. Thus, for a better understanding, the reaction was studied using model compounds. II.1.1 Model reactions The first model compound was prepared in order to study the reaction between the secondary amine (amino end group) and the epoxy function of the GPTS. With the second one, we want to elucidate which peaks could be attributed to a possible reaction between the amidine groups and the epoxy function of the GPTS. II.1.1.a Study of the reaction between the epoxy and the secondary amine The model compound, 3-aminodecyl-1-oxypropyltriethoxysilane-propane-2-ol, was synthesized from the reaction of decylamine and glycidyloxypropyl-triethoxysilane (GPTS) in equimolar ratio. The protocol is described in the part of the annex A. It means that for two active hydrogen there is one epoxy ring. The main expected reaction is the nucleophilic attack of the epoxy ring by the electronic pair of the amine leading to the formation of the secondary amine and the hydroxide function [4]. This reaction can be followed by the attack of a second epoxy ring by the electronic pair of the secondary amine leading to the formation of the tertiary amine and a second hydroxide function. This second step occurs with a lower reaction rate because of the lower reactivity of the secondary amine[5].

59
Even in the case of an initial epoxy-amine ratio of 1:1, two epoxy can react with one primary amino group. Indeed, the reaction of the butylamine (BA) with phenylglycidylteher (PGE) with a PGE/BA ratio of 1:1 yields three products: residual butylamine (21%), secondary amine resulting from the addition of one butylamine on the epoxy ring (53%), and tertiary amine (26 %) [6]. Secondary reactions may occur such as the homopolymerization of epoxy functions [5] and also the condensation of the hydroxide from opened epoxy with silanol groups [7]. To study the reaction in our case, 1H and 13C NMR analyses were carried out on the coupling agent (GPTS) and on the reaction product.
A- 1H NMR characterisation The 1H NMR spectrum of GPTS (structure shown below) exhibits 10 peaks having the following assignment: 3.31 and 3.72 ppm (6e), 3.12 ppm (5e), 2.58 and 2.76 ppm (4e), 3.47 ppm(3e), 1.67 ppm (2e), 0.64 (1e), 3.72(7e) and at 1.17 ppm (8e).
O
O SiO
3
6e 5e 4e 3e
2e
1e
7e
8e
Scheme 8: Chemical structure of γ-glycidoxypropyltriethoxysilane GPTS
The main compound that we are supposed to obtain is the reaction product between the amino group and the epoxy ring with formation of a hydroxyl ether and a secondary amine function:
NH
O SiO
OH10i
9i
8i
7i
6i
5i
4i
3i
2i
1i ab
c d
e
f
g
h
Scheme 9: Expected chemical structure of the reaction product from GPTS and decylamine
On the spectrum of this compound shown in Figure 5, the 5e and 6e resonances of the epoxy ring are no more present. It indicates that all the epoxy groups have reacted to completion. Unreacted amine could be present in the final product: the following nomenclature is used for designating the starting amine.
NH2H3C
1d
2d10
3-9 Scheme 10: Chemical of the starting amine

60
The overlay of the 1H NMR spectrum of GPTS and model compound is reported below:
4.0 3.5 3.0 2.5 2.0 1.5 1.0 0.5 ppm
4.0 3.5 3.0 2.5 2.0 1.5 1.0 0.5 ppm
1e
8e
2e
4e6e
3e
5e
7e
f
10
3-9
2i,2de1i,1d, ac+d
b
CH3CH2OH CH3CH2OH
Figure 5: 1H NMR spectra of GPTS (bottom) and GPTS-decylamine reaction product (top) (0-4.5 ppm) (400MHz; solvent: CD3OD; TMS)
The peak b at 3.84 ppm is characteristic of protons like CH-OH arising from the epoxy opening by the amino group [8]. The signals of the ethoxy groups are replaced by up-field shifted signals which correspond to ethanol. This ethanol could come either from the hydrolysis of ethoxy groups by residual traces of water or from the condensation between the hydroxyl function (arising from the epoxy ring opening) and the ethoxy groups. When C-O-Si bridge is formed, the -CH- of the epoxy ring gives a peak at 4.2 ppm for in the case of a GPTMS/oligo(NH2) system [8]. On our spectrum such peak is not observed.
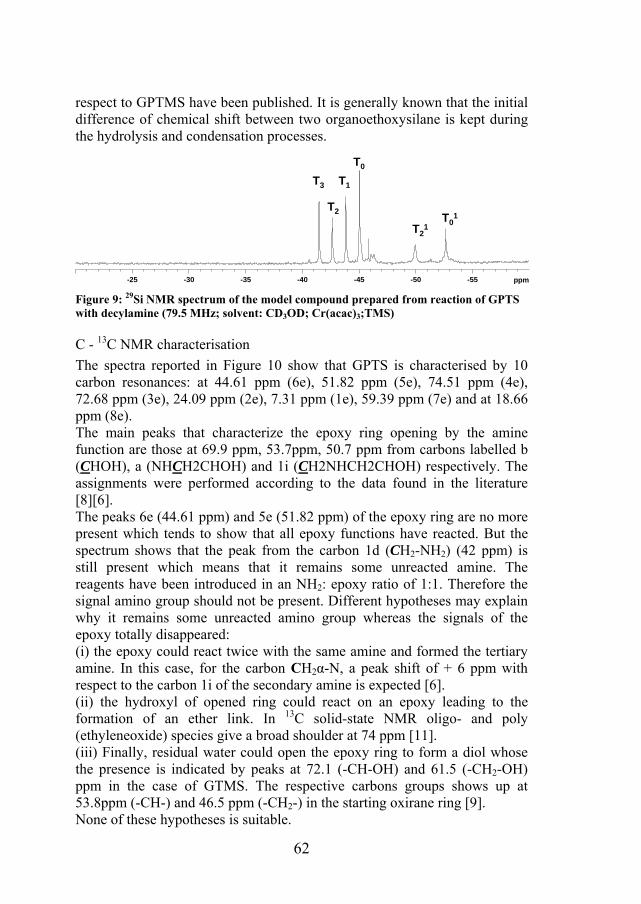
B- 29Si NMR characterisation The study of the model compound by 29SiNMR (Figure 9) demonstrates that six different Si-containing species, corresponding to different degree of hydrolysis and condensation on silicon, are present. The silicon sites are labelled by the Qj, Tj, Dj notation (Q= Si(RO)4; T= R’Si(OR)3; D= R’2-Si-(OR)2) where j denotes the number of siloxane bridges (Si-O-Si) on the considered silicon atom.

61
Si
OR
ORORO
Si
OR
OROO
Si
O
OROO
Si
O
OOO
Q1 Q2 Q3 Q4
Figure 6: Nomencalture of silicon species as a function of condensation state for tetraalkoxysilane
Si
R
ORORO
Si
R
OROO
Si
R
OOO
T1 T2 T3
Figure 7: Nomencalture of silicon species as a function of condensation state for tetraalkoxysilane
The subscript i indicates the degree of hydrolysis of the alkoxy groups attached to the given silicon. For example, T2
0 represents a di-hydrolysed
silicon. Therefore the number of ethoxy groups on the Q silicon is 4-i-j.
Si
R
OHORHO
T20
Figure 8: Nomenclature for di-hydrolysed trialkoxysilane
The analysis of the GPTS in the same conditions allows to conclude that the peak at -45 ppm correspond to the R’Si(OR)3 species. The subsequent hydrolysis of Si-OCH2CH3 to Si-OH causes a downfield shift. Signals are caused by mono, bi and hydrolysed species presents in the samples and also condensed species (T1). The spectra was recorded in presence of tris(acetylacetonato)chromium III Cr(acac)3 which allows to decrease the relaxation time and obtain quantitative spectra. As a consequence, we can conclude that only a few part of ethoxysilane groups are condensed. Identifications of the peaks were made using the data reported in the references [9][10]. Few articles related to the 29SiNMR of the GPTS with
62
respect to GPTMS have been published. It is generally known that the initial difference of chemical shift between two organoethoxysilane is kept during the hydrolysis and condensation processes.
-25 -30 -35 -40 -45 -50 -55 ppm
T0
T1T3
T2 T01
T21
Figure 9: 29Si NMR spectrum of the model compound prepared from reaction of GPTS with decylamine (79.5 MHz; solvent: CD3OD; Cr(acac)3;TMS)
C - 13C NMR characterisation The spectra reported in Figure 10 show that GPTS is characterised by 10 carbon resonances: at 44.61 ppm (6e), 51.82 ppm (5e), 74.51 ppm (4e), 72.68 ppm (3e), 24.09 ppm (2e), 7.31 ppm (1e), 59.39 ppm (7e) and at 18.66 ppm (8e). The main peaks that characterize the epoxy ring opening by the amine function are those at 69.9 ppm, 53.7ppm, 50.7 ppm from carbons labelled b (CHOH), a (NHCH2CHOH) and 1i (CH2NHCH2CHOH) respectively. The assignments were performed according to the data found in the literature [8][6]. The peaks 6e (44.61 ppm) and 5e (51.82 ppm) of the epoxy ring are no more present which tends to show that all epoxy functions have reacted. But the spectrum shows that the peak from the carbon 1d (CH2-NH2) (42 ppm) is still present which means that it remains some unreacted amine. The reagents have been introduced in an NH2: epoxy ratio of 1:1. Therefore the signal amino group should not be present. Different hypotheses may explain why it remains some unreacted amino group whereas the signals of the epoxy totally disappeared: (i) the epoxy could react twice with the same amine and formed the tertiary amine. In this case, for the carbon CH2α-N, a peak shift of + 6 ppm with respect to the carbon 1i of the secondary amine is expected [6]. (ii) the hydroxyl of opened ring could react on an epoxy leading to the formation of an ether link. In 13C solid-state NMR oligo- and poly (ethyleneoxide) species give a broad shoulder at 74 ppm [11]. (iii) Finally, residual water could open the epoxy ring to form a diol whose the presence is indicated by peaks at 72.1 (-CH-OH) and 61.5 (-CH2-OH) ppm in the case of GTMS. The respective carbons groups shows up at 53.8ppm (-CH-) and 46.5 ppm (-CH2-) in the starting oxirane ring [9]. None of these hypotheses is suitable.

63
The explanation could be the partial condensation of epoxy silane to give solid species which are no longer detectable by liquid NMR. But, on the spectrum (Figure 9), as condensed species only T1 species are observed. If in the medium there was highly condensed species which cannot be detected, we should also observe intermediate species, i.e. T2 and T3. The presence on the spectrum (Figure 10) of both signals of ethoxy groups and ethanol shows that the hydrolysis and condensation of ethoxy groups occurred partially. This condensation reaction only happened between the silanol and ethoxyilane silane groups. Indeed, the condensation reaction between an ethoxysilane group and the hydroxyl function of the opened epoxy leads to the formation of a a C-O-Si link. This link is characterized by a peak at 60 ppm [7][12] which is not observed in our case.
75 70 65 60 55 50 45 40 35 30 25 20 15 10 5 ppm
75 70 65 60 55 50 45 40 35 30 25 20 15 10 5 ppm
CH-OH
Model compound
GPTS
f10
CH3CH2OH
CH3CH2OH
h
9
3
4-7
2i8
2d1d1iagc,d
1e
8e
2e6e5e
7e3e4e
be
Figure 10: 13C NMR spectrum of model compound prepared from reaction of GPTS with decylamine (100.6 MHz; solvent: CD3OD;TMS)
In summary, this NMR study allows to: show that the epoxy ring of GPTS is opened by the addition reaction with the secondary amine. But the reaction does not go to completion. identify the signals of the differents carbons coming from the epoxysilane/amine reaction. These signals will be used as references in the characterization of the functionalised polyamidines. exhibit that the hydrolysis and condensation of the ethoxysilane groups started and induced the formation of insoluble GPTS.

64
II.1.1.b Study of the reaction between the epoxy and the amidine functions: model compound A second model compound was synthesized in order to study the reactivity of amidine functions with the epoxysilane. It was prepared in two steps: first by the synthesis of N, N'-dioctylacetamidine then by its reaction with γ-glycidyloxypropyltriethoxysilane GPTS to obtain the final model compound, i.e. triethoxysilane-functionalised dioctylacetamidine. II.1.1.b.1 Synthesis of N, N'-dioctylacetamidine N, N'-dioctylacetamidine was obtained from the reaction of octylamine and triethylorthoacetate with acetic acid as a catalyst (cf. annex A). The scheme of reaction is shown below:
H3C NH2 H3C O CH3 3+7 H3C N NH7 CH372
If the reaction does not go to completion intermediate species can be hydrolysed to give the corresponding acetamide:
H3C N O CH37 H3C NH
O7 As explained earlier, in the presence of acid, amidine functions are protonated. This is the reason why we certainly synthesized the acetate of N, N'-dioctylacetamidinium. The synthesis procedure was described by Sharavanan [2] .
65
A- 1H NMR characterisation
4.0 3.5 3.0 2.5 2.0 1.5 1.0 0.5 ppm
5.94
23.8
9
2.17
0.12
0.41
0.06
3.87
8
3-7
2,2’
CH3COOH
3c9
Residue of octylamine:CH2NH2
1c1,1’
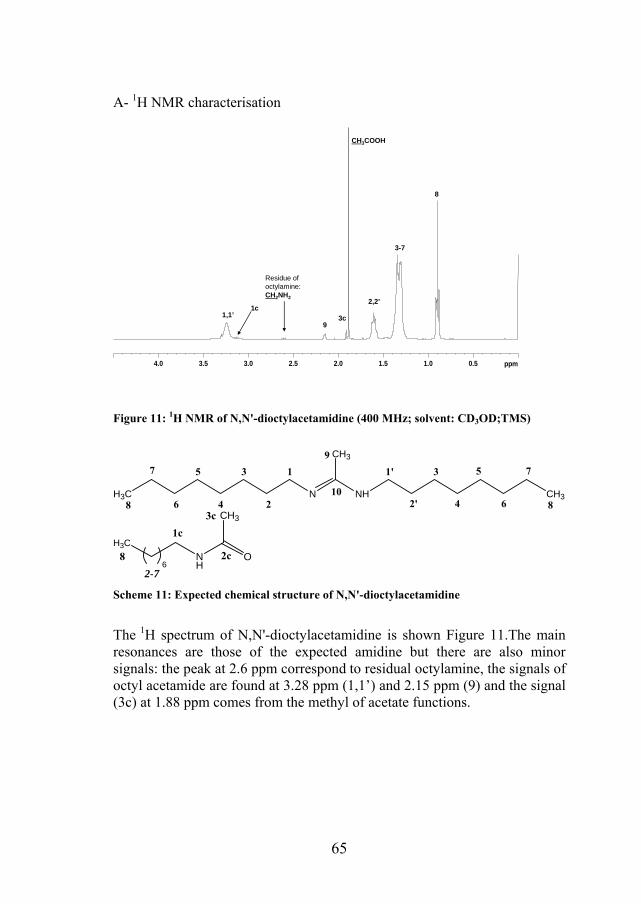
Figure 11: 1H NMR of N,N'-dioctylacetamidine (400 MHz; solvent: CD3OD;TMS)
N NH
CH3
CH3H3C8
7
6
5
4
3
2
1 1'
2'
3
4
5
6
7
8
9
10
NH
O
CH3
H3C1c
2c
3c
68
2-7 Scheme 11: Expected chemical structure of N,N'-dioctylacetamidine
The 1H spectrum of N,N'-dioctylacetamidine is shown Figure 11.The main resonances are those of the expected amidine but there are also minor signals: the peak at 2.6 ppm correspond to residual octylamine, the signals of octyl acetamide are found at 3.28 ppm (1,1’) and 2.15 ppm (9) and the signal (3c) at 1.88 ppm comes from the methyl of acetate functions.

66
B- 13C NMR characterisation The 13C spectrum of of N,N'-dioctylacetamidine is shown in Figure 12.
55 50 45 40 35 30 25 20 15 10 5 ppm
155160165170175180185 ppm
16
3.
57
17
2.
74
17
9.
79
8
93c
7
1,1’
CH2NH2
1c
CH3COOH
CH3COOH2c 10
34,5
6
1d
2d
2+2’
Figure 12: 13C NMR of N,N'-dioctylacetamidine (100.6 MHz; solvent: CD3OD;TMS)
The carbon spectrum confirms the presence of octylacetamide (signal of C10 at 163.7 ppm), of N-octylacetamide (peak 3c at 22.5 ppm and peak 2c at 172.74 ppm) and of residual octylamine (40.38 and 33.84 ppm). II.1.1.b.2 Reaction of N, N'-dioctylacetamidine with GPTS The synthesis protocol is reported in annex A. The starting model compound (N, N'-dioctylacetamidine) was not purified before the reaction with the epoxysilane (which makes the interpretation of the spectra more difficult). As previously mentioned, the aim of this experiment is to check if the epoxy ring reacts with the secondary nitrogen of the amidine function. According to the wide spectrum of amine structures which react with the epoxy in an addition reaction, we assumed that the imino nitrogen of the amidine could open the epoxy ring.

67
The following scheme shows the expected structure of the reaction product;
+
O
O SiO CH3
H3C N NH CH3
H3C N N
H3C
O SiO CH3
OH
3
3
377
7
7
3
?
Scheme 12: Expected structure from functionalisation of N,N' dioctylacetamidine with GPTS
The molecules that could be found in the final product of the reaction between the N, N'-dioctylacetamidine and GPTS are: - the octylamine (Scheme 13), - unreacted N, N'-dioctylacetamidine (Scheme 11), - N-octylacetamide (Scheme 11), - unreacted GPTS (Scheme 8), - 3-aminoctyl-1-oxypropyltriethoxysilane-propan-2-ol (Scheme 9) - and the functionalised N, N'-dioctylacetamidine (Scheme 14).
NH2H3C
1d
2d8
3-75
Scheme 13: Chemical structure of the octylamine with assignments of group
N N O SiO
OH
1m
2m
8
1'm
3-7
ambm
cm dm
em
fm
g
h10m
9m
35
5
8
3-7
2'm
Scheme 14: Expected structure of functionalised N, N'-dioctylacetamidine

68
A- 1H NMR characterisation
4.0 3.5 3.0 2.5 2.0 1.5 1.0 0.5 ppm
f
8,8’CH3CH2OH
3-7,3’-7’
2,2’
e,em
CH3COOH
2c1m
c,d,cm,dm, 1’m, am
b, bm
GPTSCH3CH2OH
1d
a,1i
Figure 13: 1H NMR spectrum of functionalised N,N'-dioctylacetamidine (400 MHz; solvent: CD3OD;TMS)
The main information which can be drawn from the 1H NMR spectrum is that the signals of the GPTS are still present. In this case, the 1H NMR does not give us further information. The assignments of characteristic peaks of reaction are done in Figure 13.
B- 29Si NMR characterisation The analysis of the spectrum shows the presence the GPTS is mainly fully hydrolysed and a small part is condensed to form dimers (T1 species) (see II.I.I.a.B).
B- 13C NMR characterisation The 13C NMR spectrum of the model compound is shown in Figure 14. The different resonances were assigned from comparaison of the 13C spectrum of this last model compound with the spectra of GPTS, the model compound prepared from decylamine-GPTS reaction product and N,N'-dioctylacetamidine. The signals of the epoxy ring of the starting GPTS are present. It means that if the reaction between the amidine and GPTS occurred, the yield remains very low.

69
Chemical shifts of signals from carbons C1, C1’ and C9 that could be influenced by the possible addition reaction, because they are in the close environment of the imino nitrogen, are only slightly modified. Therefore these signals do not allow to give rise the reaction. The signal of carbon C10 (163.6,ppm) is shifted to 160.90ppm, this resonance could be attributed to carbon 10m. New resonances, at 64.5 72.1, 73.1 and 74.4 ppm are also observed and could characterise carbons am, bm, cm and dm. In the literature, no paper dealing with the NMR characterization of the reaction between a trisubstituted amidine and epoxy is reported presently.

70
155
160
165
170
175
180
185
190
195
ppm
7570
6560
5550
4540
3530
2520
1510
5p
pm
f m
GP
TSG
PTS
8,8’
m
CH
3CH
2OH
7,7’
m3,
3’m
4,4’
5,5’
m
6,6’
m
9 m3c
CH
3CO
OH
1c
CH
2NH
2
1,1 m
’
g m
e
a
CH
3CH
2OH
g mb
c,d
b mc m
,dm
10m
CH
3CO
OH
2c
a m2,
2’m
1d
1i
3i,3
,3’
Figure 14: 13C NMR spectrum of the functionalised N,N'-dioctylacetamidine (100.6 MHz; solvent: CD3OD;TMS)

71
From this study, we can conclude that we correctly synthesized the N, N'-dioctylacetamidine and identified all the reaction products. Concerning the reaction of the amidine with the GPTS, a part of GPTS did not react; another part was involved in a secondary reaction i.e. the addition of the remaining octylamine on the epoxy and a third part reacted with amidine. A small amount is maybe as insoluble form which cannot be detected as Si NMR showed the presence of condensed species. II.1.2 Study of the alkoxysilane- functionalised oligomers by RMN and MALDI spectroscopies
The aim of this part is to characterise the products of the reaction of polyamidine with epoxysilane, which were synthezised with different molar ratio: NH2/epoxy = 1 and 2. The corresponding model compounds are 3-aminodecyl-1-oxypropyltriethoxysilane-propan-2-ol and N,N'-dioctylacetamidine-GPTS reaction product respectively. II.1.2.a Functionalisation of the POA with a amine: epoxy ratio of 1:1 The expected structure which corresponds to the reaction product between the epoxy groups and the amino chain ends is represented in Scheme 15. The structure does not consider the possible reaction between the imino nitrogen of the amidine and the epoxy ring.
N NH1'
2'
3,3'-4,4'
2
11i
1c6c
6NH 2i
5cN NH
NH O74OSi
O*n
OH
33 abcd-f
g
h5
6 Scheme 15: Expected chemical structure of the functionalised polyamidine
A- 1H NMR characterisation 1H NMR does not allow the exact elucidation of the whole structure. On the spectrum the peaks of the epoxy ring of starting GPTS are no more present. We noticed the presence of new resonances (with respect of the POA) at 0.66, 1.69 2.69, 3.47 and 3.76 ppm which, in agreement with the model compound, are due to the reaction of the epoxy group from GPTS with an amino group. Thus, one can conclude the expected functionalisation of the POA from the amino end groups occurred. The comparison of the POAF1:1 and GPTS shows that the peak at 1.17 ppm and 3.6 ppm are due to the ethanol and then that the ethoxy groups started to be hydrolysed.

72
4.0 3.5 3.0 2.5 2.0 1.5 1.0 0.5 ppm
CH3CH20H
3,3’, 4,4’
2,2’
CH3COOH
6c
61d
1,1’
1cCH3CH20H
c+dfe1i-ab
Figure 15: 1H NMR of the functionalised polyamidine (400 MHz; solvent: CD3OD;TMS)
B- 13C NMR characterisation The resonances of epoxy ring at 44.6 ppm and 51.9 ppm are no more present in the 13C NMR spectrum. Nevertheless, as showed in the paragraph C of the part II.1.1., the disappearance of these peaks may be partially due to the formation insoluble condensed GPTS. Therefore, this observation is not sufficient to conclude to the complete reaction of the GPTS. If we compare the spectra of POA (Figure 16), before and after functionalisation, 9 new resonances can be evidenced. The chemical shifts and the corresponding assignments are reported in Table 8.
73
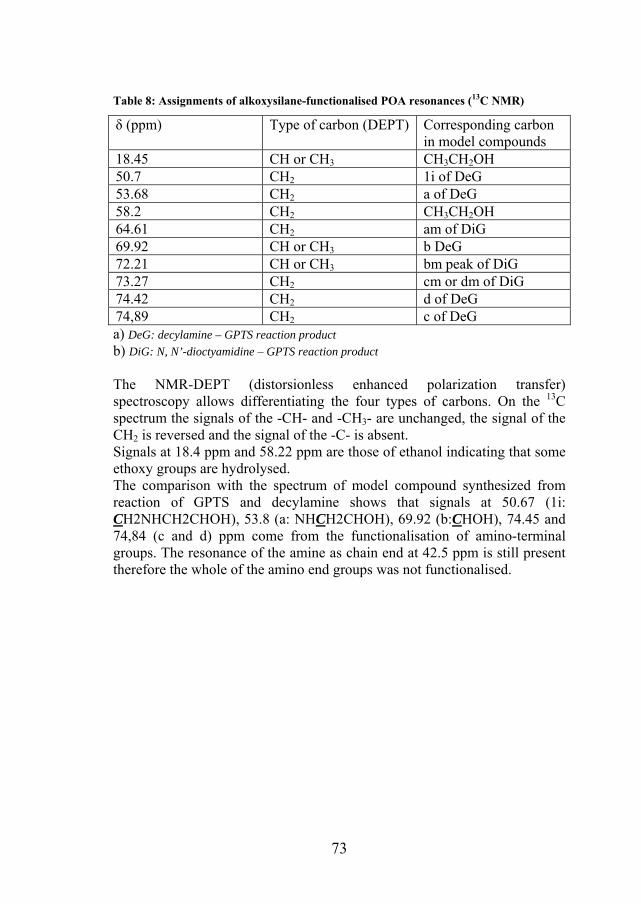
Table 8: Assignments of alkoxysilane-functionalised POA resonances (13C NMR)
δ (ppm) Type of carbon (DEPT) Corresponding carbon in model compounds
18.45 CH or CH3 CH3CH2OH 50.7 CH2 1i of DeG 53.68 CH2 a of DeG 58.2 CH2 CH3CH2OH 64.61 CH2 am of DiG 69.92 CH or CH3 b DeG 72.21 CH or CH3 bm peak of DiG 73.27 CH2 cm or dm of DiG 74.42 CH2 d of DeG 74,89 CH2 c of DeG a) DeG: decylamine – GPTS reaction product b) DiG: N, N’-dioctyamidine – GPTS reaction product The NMR-DEPT (distorsionless enhanced polarization transfer) spectroscopy allows differentiating the four types of carbons. On the 13C spectrum the signals of the -CH- and -CH3- are unchanged, the signal of the CH2 is reversed and the signal of the -C- is absent. Signals at 18.4 ppm and 58.22 ppm are those of ethanol indicating that some ethoxy groups are hydrolysed. The comparison with the spectrum of model compound synthesized from reaction of GPTS and decylamine shows that signals at 50.67 (1i: CH2NHCH2CHOH), 53.8 (a: NHCH2CHOH), 69.92 (b:CHOH), 74.45 and 74,84 (c and d) ppm come from the functionalisation of amino-terminal groups. The resonance of the amine as chain end at 42.5 ppm is still present therefore the whole of the amino end groups was not functionalised.

74
NHN
N NH
HN
1'
2'
3'
4'
4
3
2
1
1d 1c
6
O
6c
6 7
H2N2d
5
5c
155160165170175180185190195 ppm
45 40 35 30 25 20 15 10 5 ppm
6
6c
CH3C(O)O-3,3’4,4’
1c
5
1d 2d
5c
CH3C(O)O-
1,1’ 2,2’
Figure 16: 13C NMR and assigned chemical structure of the POA (100.6 MHz; solvent: CD3OD;TMS)
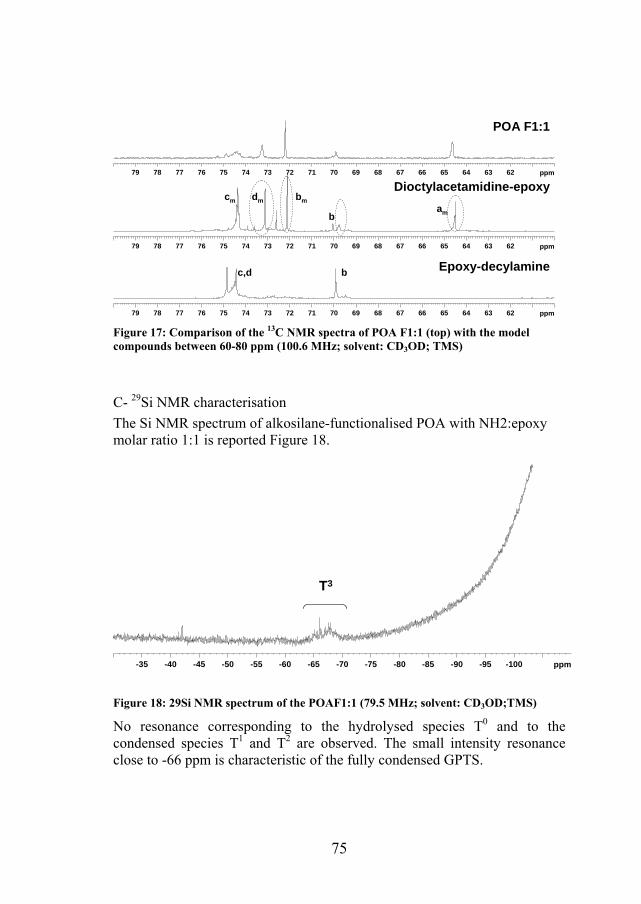
The comparison of spectra from both model compounds, decylamine-GPTS and functionalised N,N'-dioctylacetamidine, and functionalised and POA F1:1 (Figure 17 ) shows that the peaks at 64.63, 69.92, and 74.45 ppm can be attributed to the reaction of epoxy functions with amidine groups.
75
626364656667686970717273747576777879 ppm
626364656667686970717273747576777879 ppm
626364656667686970717273747576777879 ppm
Epoxy-decylamine
POA F1:1
Dioctylacetamidine-epoxy
bc,d
bam
bmcm dm
Figure 17: Comparison of the 13C NMR spectra of POA F1:1 (top) with the model compounds between 60-80 ppm (100.6 MHz; solvent: CD3OD; TMS)
C- 29Si NMR characterisation The Si NMR spectrum of alkosilane-functionalised POA with NH2:epoxy molar ratio 1:1 is reported Figure 18.
-35 -40 -45 -50 -55 -60 -65 -70 -75 -80 -85 -90 -95 -100 ppm
T3
Figure 18: 29Si NMR spectrum of the POAF1:1 (79.5 MHz; solvent: CD3OD;TMS)
No resonance corresponding to the hydrolysed species T0 and to the condensed species T1 and T2 are observed. The small intensity resonance close to -66 ppm is characteristic of the fully condensed GPTS.
76
D – MALDI-TOF spectroscopy We expected to evidence species with molar masses equal to the sum of POA and GPTS or hydrolysed GPTS molar mass (278.42g.mol-1). But the MALDI-TOF spectra display only peaks of the starting POA. The reaction compounds are probably a mixture of the neat oligomer and functionalised POAs. As the 29Si NMR shown, the alkoxysilane groups are condensed and the functionalised POAs form probably insoluble dimers and trimers. These species are therefore cannot be detected by MALDI (maybe the matrix used for MALDI analyses is not convenient for the alkoxysilane-functionalised POA in contrast to the neat polymer). In summary, NMR and MALDI showed that: - the functionalisation of the amino end groups of the polyamidine take place - the GPTS also reacted on the amidine groups at a low extent -some POA chains remain unfonctionalised - a large amount of alkosilane groups condense II.1.2.b Functionalisation of the POA with a amine NH2: epoxy ratio of 1:2
N NH1'
2'
3,3'-4,4'
2
11i
1c6c
6N 2i
5cN NH
NH O74OSi
O*n
OH
33 abcd-f
g
h5
62
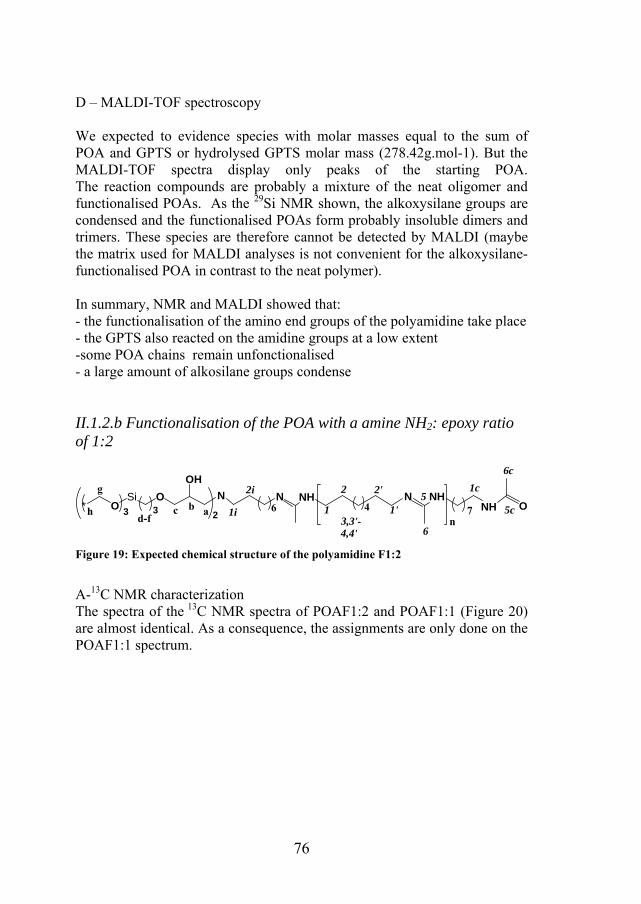
Figure 19: Expected chemical structure of the polyamidine F1:2
A-13C NMR characterization The spectra of the 13C NMR spectra of POAF1:2 and POAF1:1 (Figure 20) are almost identical. As a consequence, the assignments are only done on the POAF1:1 spectrum.

77
75 70 65 60 55 50 45 40 35 30 25 20 15 10 5 ppm
75 70 65 60 55 50 45 40 35 30 25 20 15 10 5 ppm
POA F1:1
POA F1:2
6
CH3CH2OH
6c
CH3C(O)O-
4,4’3,3’
2,2’
2d
1c1d
1,1’
CH3CH2OH
amb
bm
dm
c,d,cm
a1i
Figure 20: 13C NMR spectra of the POA F 1:1 and POAF 1:2 (from 0 to 80 ppm) (100.6 MHz; solvent: CD3OD;TMS)
155160165170175180185 ppm
155160165170175180185 ppm
5CH3COO-
5c
POA F1:1
POA F1:2
Figure 21: 13C NMR spectra of the POA F 1:1 and POAF 1:2 between 160 and 190 ppm (100.6 MHz; solvent: CD3OD;TMS)
Therefore the conclusions drawn about the functionalisation are the same. As the GPTS was introduce with amine (NH2) to epoxy ratio of 1:2, one can expect a resonance at about 50.7 +6 ppm corresponding to the carbon
78
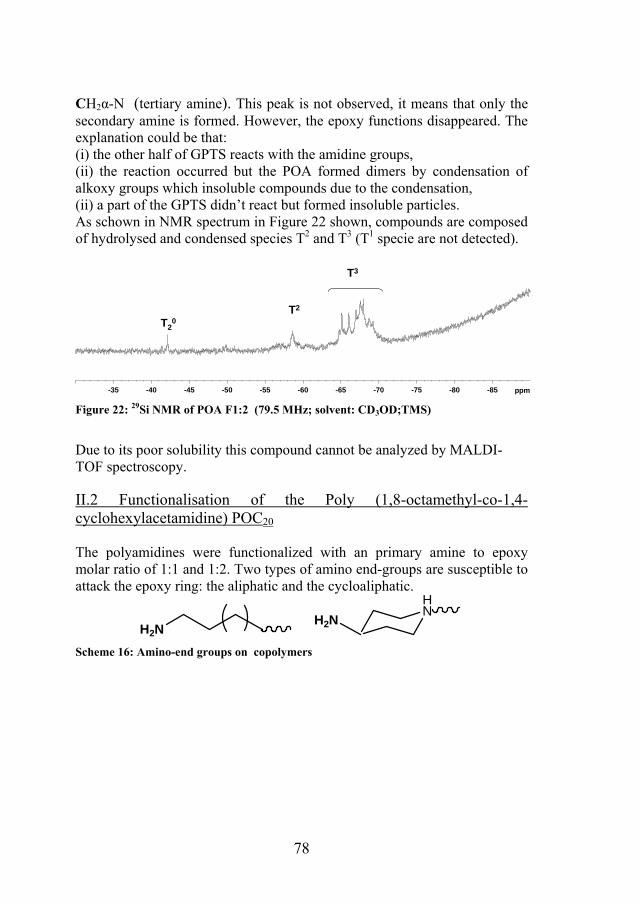
CH2α-N (tertiary amine). This peak is not observed, it means that only the secondary amine is formed. However, the epoxy functions disappeared. The explanation could be that: (i) the other half of GPTS reacts with the amidine groups, (ii) the reaction occurred but the POA formed dimers by condensation of alkoxy groups which insoluble compounds due to the condensation, (ii) a part of the GPTS didn’t react but formed insoluble particles. As schown in NMR spectrum in Figure 22 shown, compounds are composed of hydrolysed and condensed species T2 and T3 (T1 specie are not detected).
-35 -40 -45 -50 -55 -60 -65 -70 -75 -80 -85 ppm
T2
T3
T20
Figure 22: 29Si NMR of POA F1:2 (79.5 MHz; solvent: CD3OD;TMS)
Due to its poor solubility this compound cannot be analyzed by MALDI-TOF spectroscopy.
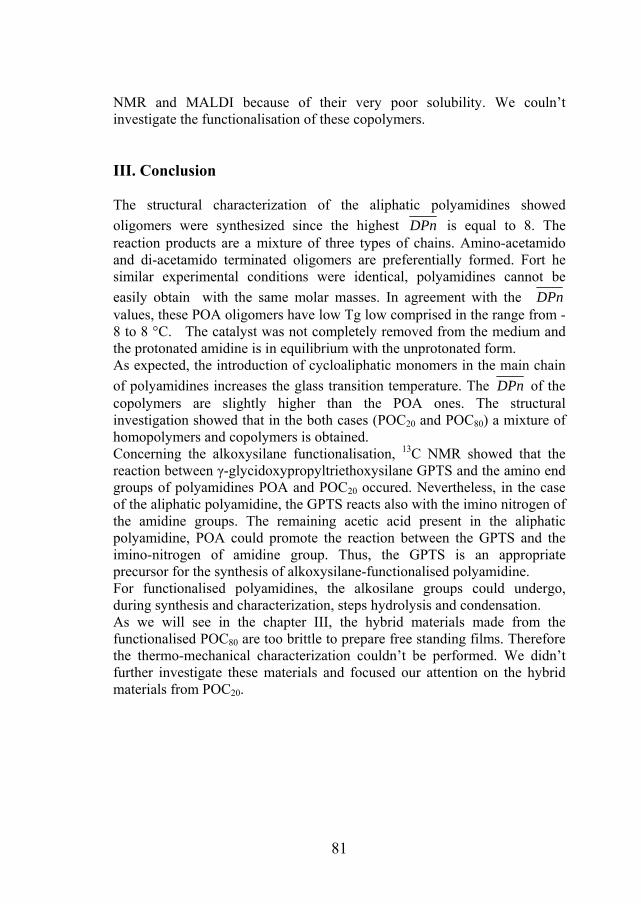
II.2 Functionalisation of the Poly (1,8-octamethyl-co-1,4-cyclohexylacetamidine) POC20 The polyamidines were functionalized with an primary amine to epoxy molar ratio of 1:1 and 1:2. Two types of amino end-groups are susceptible to attack the epoxy ring: the aliphatic and the cycloaliphatic.
HNH2NH2N
Scheme 16: Amino-end groups on copolymers

79
II.2.1 Poly (1,8-octamethyl-co-1,4-cyclohexylacetamidine) with 20% of cycloaliphatic units with a amine: epoxy ratio of 1:1 As the functionalisation may happen on two kind of amino groups two structures are possibles (Figure 23).
NH NNH N
1'
2'
3'
4'
4
3
2
15
60.2 0.8
p
om'
n'
n'
n
nmNHO
NH O SiO
OH
*
7 3 3
o1
p1
a bc d-f
g
h1i
NH NNH N
1'
2'
3'
4'
4
3
2
15
60.2 0.8
p
om'
n'
n'
n
nmNH
NH733
a'b'
c'd'-f'
g'
h'
O5c
6c1c
OSiO*
OH
Figure 23: Expected chemical structures of the POC20 F1:1
A. 13C NMR characterization The 13C spectrum of the triethoxysilane-functionalised POCc20 in reported in Figure 24.
8090100110120130140150160170 ppm
55 50 45 40 35 30 25 20 15 10 5 ppm
6,p6c, p1
CH3CH20H
3,3’4,4’
n,n’
2d1d
1c
1,1’
5c
5
o(x) Traces of phenol
m,m’
a,a’
b,b’c,d,c’x
x xx
2,2’
e
1i
f
CH3CH20H
m1 n1
Figure 24: 13C NMR spectrum of POC20 F1:1

80
The resonances at 44.6 and 51.8 corresponding to the epoxy ring of starting GPTS cannot be seen. In the case of the POC20, the functionalisation only happened on amino end chains. Indeed, the signals am and bm 64.6 and 72.2 corresponding to the reaction imino nitrogen of amidine on GPTS are not observed. The synthesis of the POC20 was catalysed by the phenol. And the spectrum shows that it has been almost completely removed from the medium. The amidine group is mainly under the underprotonated form in opposition to the POA. II.2.1 Poly (1,8-octamethyl-co-1,4-cyclohexylacetamidine) with 20% of cycloaliphatic units with a amine: epoxy ratio of 1:2
708090100110120130140150160170 ppm
55 50 45 40 35 30 25 20 15 10 5 ppm
6,p6c, p1
CH3CH20H
3,3’4,4’
n,n’
2d
1d1c
1,1’
m,m’
a,a’
2,2’
e
1i
f
CH3CH20H
m1n1
5c
5
ob,b’c,d,c’
o1
Figure 25: 13C NMR spectrum of POC20 F1:2
The POC20 F1:2 have a poor solubility and as the polyamidine change in solution, the solubilization time has to be limited. It is likely that the whole polyamide chains were not analysed. As a consequence, the spectra are not completely representative of the synthesized polyamidines. On the spectrum the resonances at 44.6 and 51.8 corresponding to the epoxy ring of starting GPTS are not present. The polyamidines alkosilane-functionalised Poly (1,8-octamethyl-co-1,4-cyclohexylacetamidine) with 80% cycloaliphatic could not be analyzed by
81
NMR and MALDI because of their very poor solubility. We couln’t investigate the functionalisation of these copolymers. III. Conclusion The structural characterization of the aliphatic polyamidines showed oligomers were synthesized since the highest DPn is equal to 8. The reaction products are a mixture of three types of chains. Amino-acetamido and di-acetamido terminated oligomers are preferentially formed. Fort he similar experimental conditions were identical, polyamidines cannot be easily obtain with the same molar masses. In agreement with the DPn values, these POA oligomers have low Tg low comprised in the range from -8 to 8 °C. The catalyst was not completely removed from the medium and the protonated amidine is in equilibrium with the unprotonated form. As expected, the introduction of cycloaliphatic monomers in the main chain of polyamidines increases the glass transition temperature. The DPn of the copolymers are slightly higher than the POA ones. The structural investigation showed that in the both cases (POC20 and POC80) a mixture of homopolymers and copolymers is obtained. Concerning the alkoxysilane functionalisation, 13C NMR showed that the reaction between γ-glycidoxypropyltriethoxysilane GPTS and the amino end groups of polyamidines POA and POC20 occured. Nevertheless, in the case of the aliphatic polyamidine, the GPTS reacts also with the imino nitrogen of the amidine groups. The remaining acetic acid present in the aliphatic polyamidine, POA could promote the reaction between the GPTS and the imino-nitrogen of amidine group. Thus, the GPTS is an appropriate precursor for the synthesis of alkoxysilane-functionalised polyamidine. For functionalised polyamidines, the alkosilane groups could undergo, during synthesis and characterization, steps hydrolysis and condensation. As we will see in the chapter III, the hybrid materials made from the functionalised POC80 are too brittle to prepare free standing films. Therefore the thermo-mechanical characterization couldn’t be performed. We didn’t further investigate these materials and focused our attention on the hybrid materials from POC20.
82
REFERENCES [1] F. Böhme, C. Klinge, C. Bellmann. Colloid Surface A, 2001, 189, 21. [2] K. Sharavanan. Influence of inter- and intramolecular interactions on the properties of amidines and polyamidines. Thèse Fakultät Mathematik und Naturwissenschaften. Dresden : Technische Universität Dresden, 2003, 122 p. [3] K. Shravanan, H. Kombe, F. Böhme. Macromol. Chem. Physic., 2002, 203, 1852. [4] J. A. A. Sales, A. G. S. Prado, C. Airoldi. Polyhedron, 2002, 21, 2467. [5] P. Innocenzi, T. Kidchob, T. Yoko. J. Sol-Gel Sci. Techn., 2005, 35, 225. [6] J. Francillette, P. Madec, P. Hoarau. Makromol. Chem- M. Symp., 1987, 9, 131. [7] S. R. Davis, A. R. Brough, A. Atkinson. J. of Non-Cryst. Solids, 2003, 315, 197. [8] I. Ferreira. Synthèse d'adhésifs thermofusibles réticulables à base de polyamide. Thèse . Lyon : Université Claude Bernard, 1999, 245 p. [9] L. Matejka, O. Dukh, J. Brus, W. J. Simonsick Jr, B. Meissner. J. of Non-Cryst. Solids, 2000, 270, 34. [10] M. W. Daniels, L.F. Francis. J.Colloid Interf. Sci, 1998, 205, 191. [11] M. Templin, U. Wiesner, H.W. Spiess. Adv. Mater., 1997, 9, 814. [12] M. R. Gizdavic-Nikolaidis, Z. D. Zujovic, N. R. Edmonds, C. J. Bolt, A.J. Easteal. J. of Non-Cryst. Solids, 2007, 353, 1598.