Embed Size (px)
Citation preview
CHAPTER-II
Development and Validation of a Specific Stability Indicating
High Performance Liquid Chromatographic Methods for
Related Compounds and Assay of Solifenacin Succinate
Chapter-II-HPLC Determination of Solifenacin Succinate impurities by Stability Indicating HPLC Method
Development and Validation of a Specific Stability Indicating High Performance Liquid
Chromatographic Methods for Related Compounds and Assay of Solifenacin Succinate
2.0 Introduction
Solifenacin succinate (SFS) is a muscarinic receptor antagonist [1], which play an important
role in several major cholinergically mediated functions, including contractions of urinary
bladder smooth muscle and stimulation of salivary secretion, antagonist belongs to
anticholinergics which are used for the treatment of overactive bladder [2-4] and has higher
selectivity for the urinary bladder over salivary glands [5,6]. It acts as a selective antagonist to
the M (3) receptor and works by relaxing the bladder muscles to prevent urgent, frequent, or
uncontrolled urination. Chemically, solifenacin is (1S)-(3R)-1-azabicyclo [2.2.2] oct-3-yl 3,4-
dihydro-1-phenyl-2(1H)-iso-quinolinecarboxylate (1:1) [7] having an empirical formula of
C23H26N2O2.C4H6O4 and molecular weight is 480.55 grams/mole. It is a white to pale-
yellowish-white crystal or crystalline powder. It is freely soluble in water, glacial acetic acid,
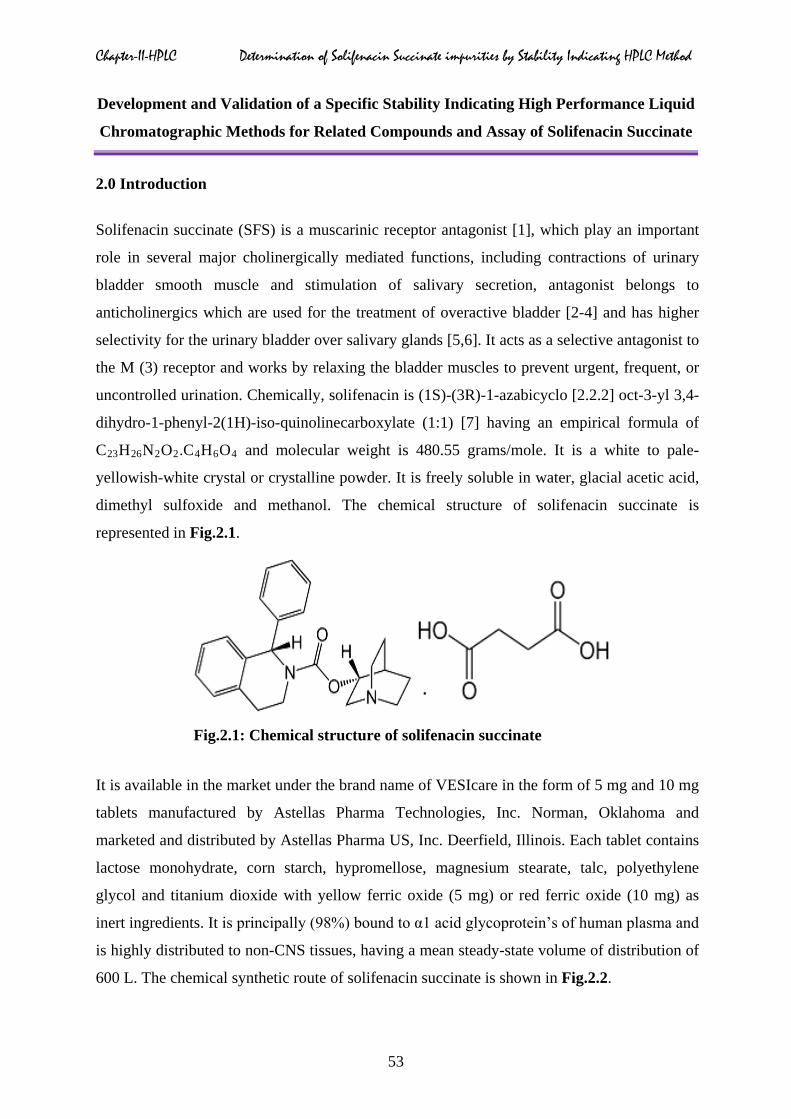
dimethyl sulfoxide and methanol. The chemical structure of solifenacin succinate is
represented in Fig.2.1.
Fig.2.1: Chemical structure of solifenacin succinate
It is available in the market under the brand name of VESIcare in the form of 5 mg and 10 mg
tablets manufactured by Astellas Pharma Technologies, Inc. Norman, Oklahoma and
marketed and distributed by Astellas Pharma US, Inc. Deerfield, Illinois. Each tablet contains
lactose monohydrate, corn starch, hypromellose, magnesium stearate, talc, polyethylene
glycol and titanium dioxide with yellow ferric oxide (5 mg) or red ferric oxide (10 mg) as
inert ingredients. It is principally (98%) bound to α1 acid glycoprotein’s of human plasma and
is highly distributed to non-CNS tissues, having a mean steady-state volume of distribution of
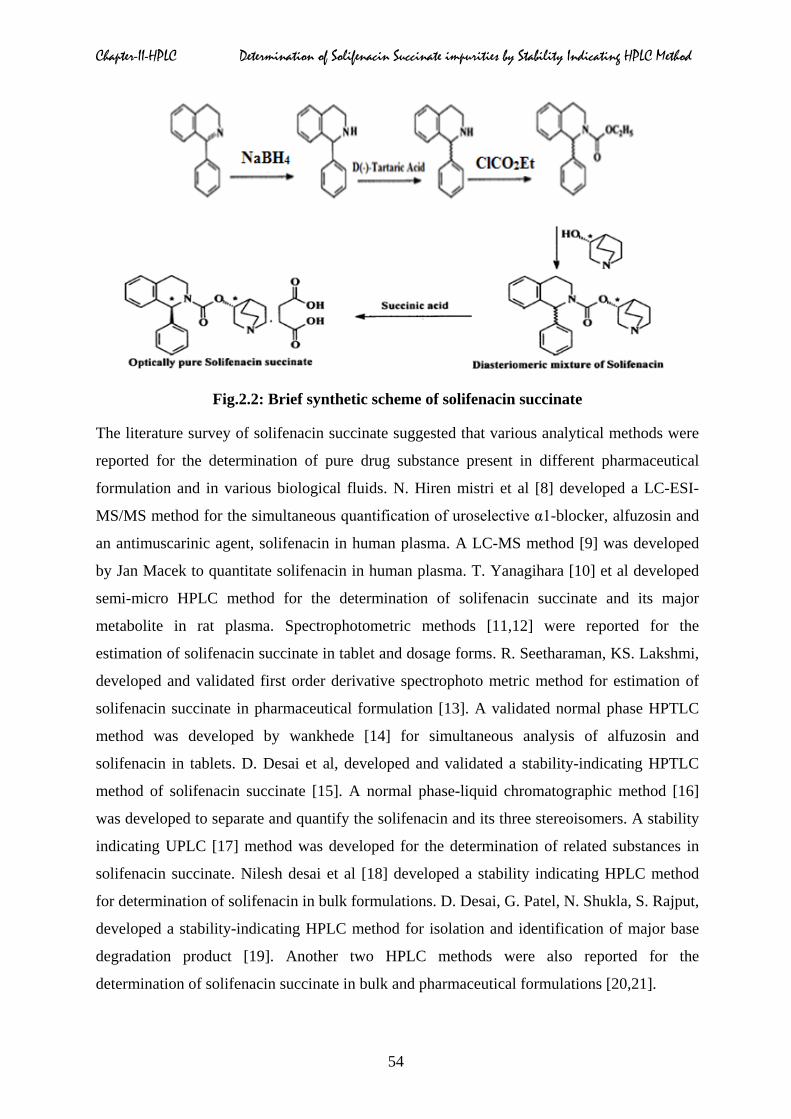
600 L. The chemical synthetic route of solifenacin succinate is shown in Fig.2.2.
53
Chapter-II-HPLC Determination of Solifenacin Succinate impurities by Stability Indicating HPLC Method
Fig.2.2: Brief synthetic scheme of solifenacin succinate
The literature survey of solifenacin succinate suggested that various analytical methods were
reported for the determination of pure drug substance present in different pharmaceutical
formulation and in various biological fluids. N. Hiren mistri et al [8] developed a LC-ESI-
MS/MS method for the simultaneous quantification of uroselective α1-blocker, alfuzosin and
an antimuscarinic agent, solifenacin in human plasma. A LC-MS method [9] was developed
by Jan Macek to quantitate solifenacin in human plasma. T. Yanagihara [10] et al developed
semi-micro HPLC method for the determination of solifenacin succinate and its major
metabolite in rat plasma. Spectrophotometric methods [11,12] were reported for the
estimation of solifenacin succinate in tablet and dosage forms. R. Seetharaman, KS. Lakshmi,
developed and validated first order derivative spectrophoto metric method for estimation of
solifenacin succinate in pharmaceutical formulation [13]. A validated normal phase HPTLC
method was developed by wankhede [14] for simultaneous analysis of alfuzosin and
solifenacin in tablets. D. Desai et al, developed and validated a stability-indicating HPTLC
method of solifenacin succinate [15]. A normal phase-liquid chromatographic method [16]
was developed to separate and quantify the solifenacin and its three stereoisomers. A stability
indicating UPLC [17] method was developed for the determination of related substances in
solifenacin succinate. Nilesh desai et al [18] developed a stability indicating HPLC method
for determination of solifenacin in bulk formulations. D. Desai, G. Patel, N. Shukla, S. Rajput,
developed a stability-indicating HPLC method for isolation and identification of major base
degradation product [19]. Another two HPLC methods were also reported for the
determination of solifenacin succinate in bulk and pharmaceutical formulations [20,21].
54
Chapter-II-HPLC Determination of Solifenacin Succinate impurities by Stability Indicating HPLC Method
The main objective of the present investigation was to develop [22] a stability
indicating reverse phase, gradient liquid chromatographic method for the determination of
solifenacin succinate and its impurities in API and pharmaceutical formulations. The
characterization and determination of three impurities of solifenacin succinate by the
developed method, and assay of API sample, study of forced degradation under stress
condition, to resolve all known impurities that were generated during the forced degradation
studies and perform analytical method validation for the proposed method as per ICH
guideline is carried in this study [23-26].
2.1 Experimental
2.1.1 Instrumentation details
UV-Visible spectrophotometer:
Perkin Elmer UV-Visible spectrophotometer (Model: Lambda 35) was used for the UV
absorption in the range of 200-400 nm.
FT-IR spectrophotometer:
Perkin Elmer FT-IR spectrophotometer (Model: Spectrum GX) controlled with spectrum one
software was used for characterization of different functional groups in the SFS and its related
substances.
NMR spectrometer:
The 1H and 13C experiments were performed on a Bruker Advance DPX-300MHz NMR
spectrometer [Bruker AG, Faellanden, Switzerland] using deuterated Dimethyl sulfoxide
(DMSO-d6) as solvent and tetramethylsilane (TMS) as internal standard.
Mass spectrometer:
Alliance 2695 HPLC and Micromass ZQ-2000 MS (Waters Assoc., Milford, MA, USA),
controlled with Mass Lynx version 4.0 software was used for the identification of oxidative
stress impurities.
LC-MS equipment:
Alliance 2695 model HPLC and Micromass ZQ-2000 MS (Waters Assoc., Milford, MA,
U.S.A.), controlled with Mass Lynx (version 4.0) software, used for impurity identification.
Mass spectrometer was provided with electrospray ionization source in positive ion mode.
The capillary sprayer voltage was 3.5 kV and the sample cone voltage was 25 V. The source
temperature was 120° and the desolvation temperature was 350°C. The desolvation and cone
55
Chapter-II-HPLC Determination of Solifenacin Succinate impurities by Stability Indicating HPLC Method
gas flow-rates were set to 100 and 650 L/hr, respectively. The acquisition mass range is m/z
0-1000 at 0.5 s per scan with a 0.1 s inter scan delay.
HPLC system-I:
A Waters alliance HPLC system equipped with 2695 separation module with quaternary
gradient pumps with inbuilt auto injector, 270852 thermostatic compartments and connected
with 2996 photodiode array detector was used for peak purity. This was controlled with
empower chromatography manager software.
HPLC system-II: Shimadzu make 2010 series HPLC system equipped with quaternary
gradient pump, auto sampler, column oven and dual wavelength UV-visible detector
controlled with LC solutions software.
2.1.2 Materials and reagents
Samples of SFS API reference standard as well as impurities were characterized in in-house
research and development laboratory. Solifenacin succinate, reference standard (SFSWS/12,
99.90% potency), test samples, impurity-A (purity-92.14%), impurity-B (purity-99.93%),
impurity-C (purity-91.51%) were obtained from Hetero Drugs Limited and solifenacin
succinate innovator tablets 10 mg vesicare (EI000081, Potency-99.8%) obtained from
Astellas Pharma US. HPLC grade acetonitrile (Merck, India), other analytical grade
chemicals and reagents such as potassium dihydrogen orthophosphate, ammonium formate,
orthophosphoric acid and formic acid were purchased from Qualizen Fine chemicals, India.
High pure water was prepared from Milli ‘Q’ system.
2.2 Characterization of SFS Impurities by Spectral Analysis
2.2.1 Characterization of solifenacin succinate impurity-A
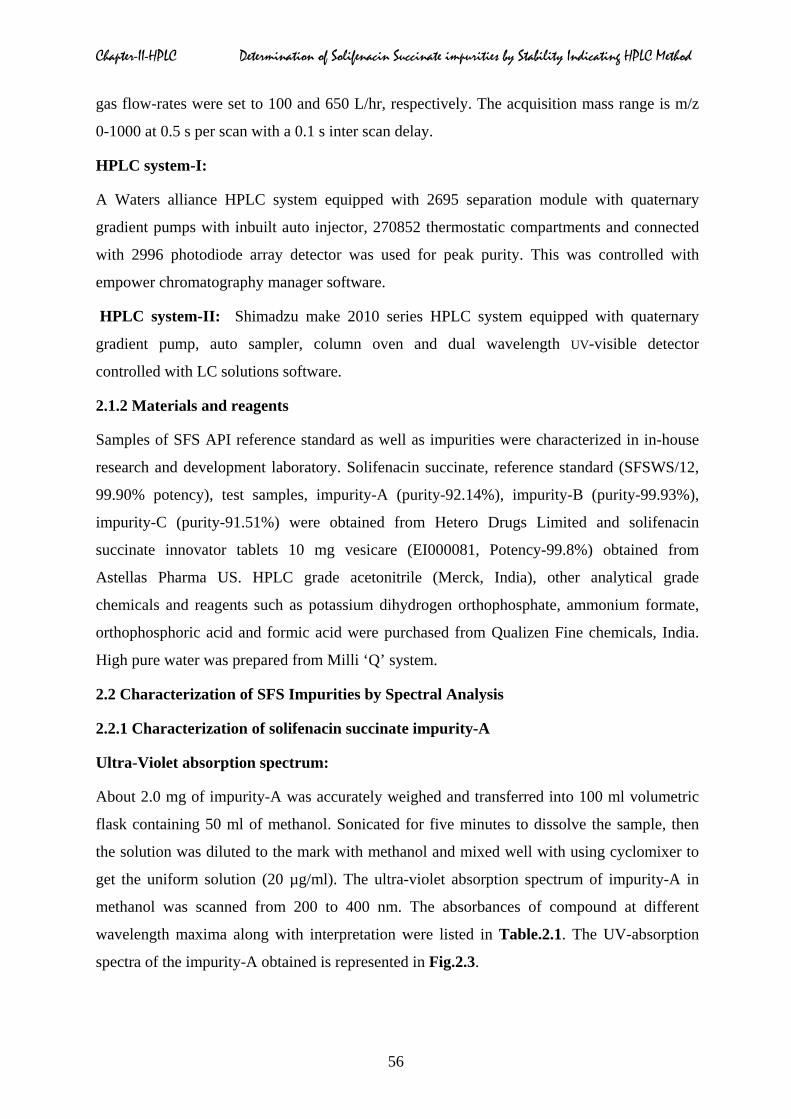
Ultra-Violet absorption spectrum:
About 2.0 mg of impurity-A was accurately weighed and transferred into 100 ml volumetric
flask containing 50 ml of methanol. Sonicated for five minutes to dissolve the sample, then
the solution was diluted to the mark with methanol and mixed well with using cyclomixer to
get the uniform solution (20 µg/ml). The ultra-violet absorption spectrum of impurity-A in
methanol was scanned from 200 to 400 nm. The absorbances of compound at different
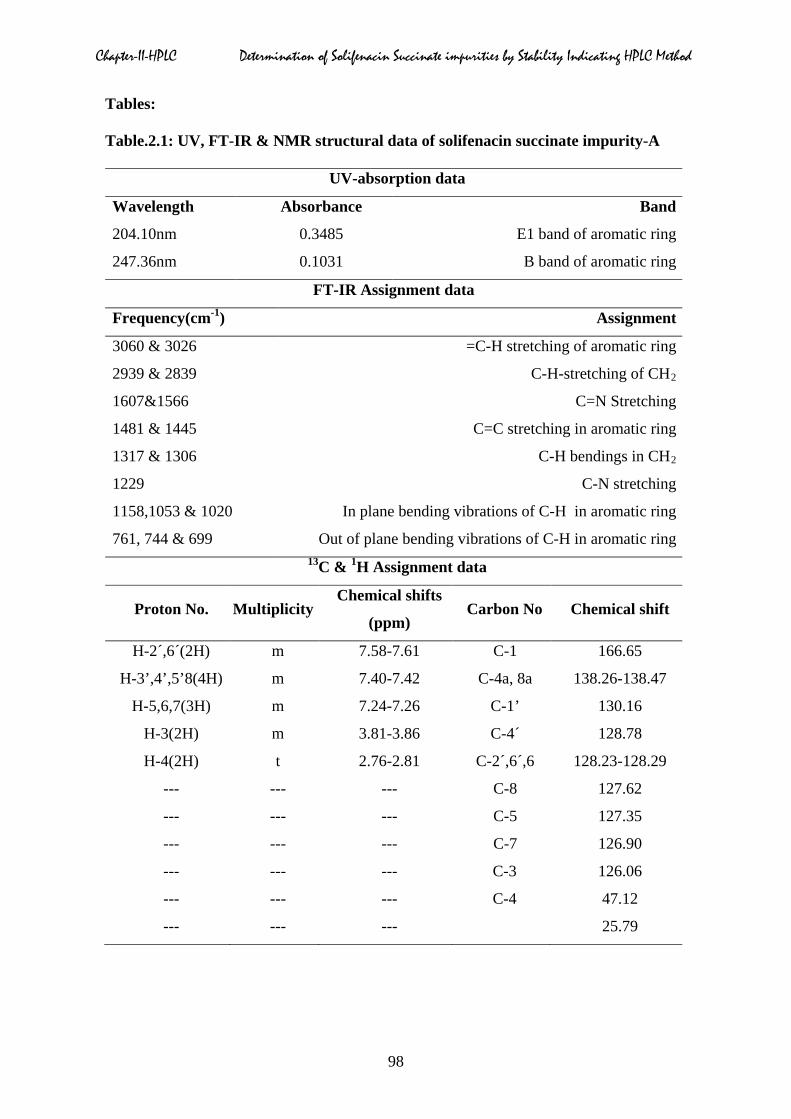
wavelength maxima along with interpretation were listed in Table.2.1. The UV-absorption
spectra of the impurity-A obtained is represented in Fig.2.3.
56
Chapter-II-HPLC Determination of Solifenacin Succinate impurities by Stability Indicating HPLC Method
Fig.2.3: UV-Absorption spectrum of solifenacin succinate impurity-A
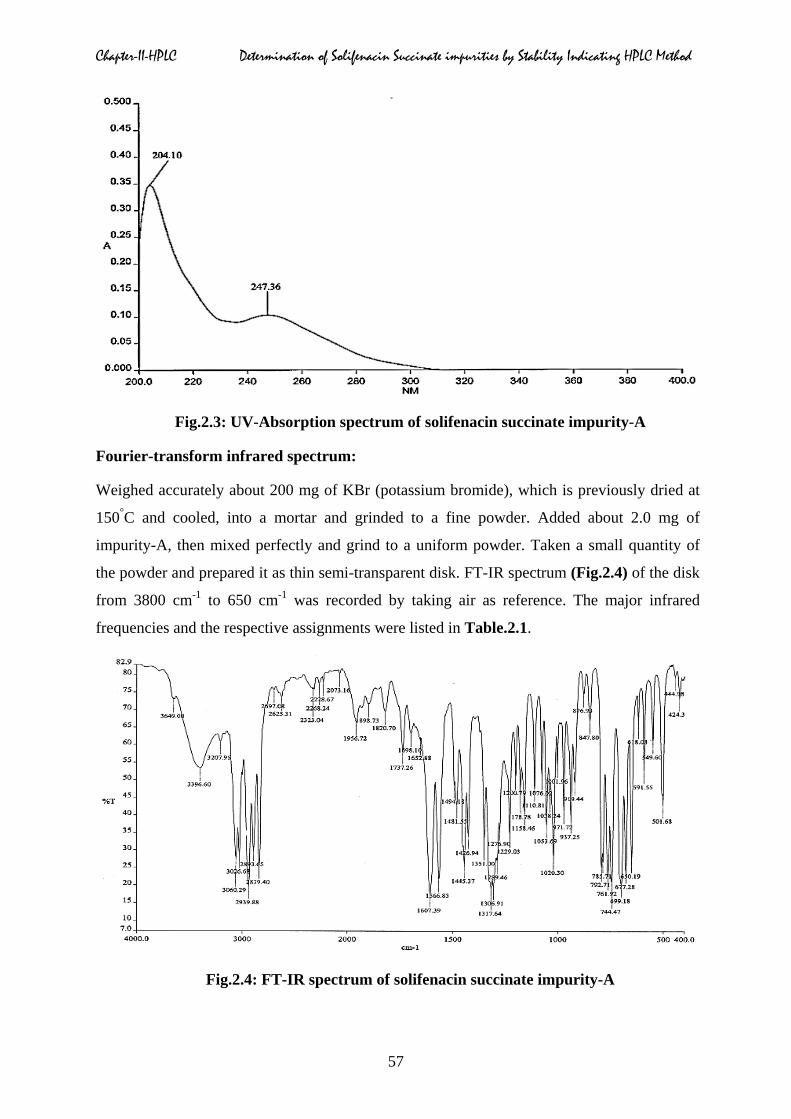
Fourier-transform infrared spectrum:
Weighed accurately about 200 mg of KBr (potassium bromide), which is previously dried at
150°C and cooled, into a mortar and grinded to a fine powder. Added about 2.0 mg of
impurity-A, then mixed perfectly and grind to a uniform powder. Taken a small quantity of
the powder and prepared it as thin semi-transparent disk. FT-IR spectrum (Fig.2.4) of the disk
from 3800 cm-1 to 650 cm-1 was recorded by taking air as reference. The major infrared
frequencies and the respective assignments were listed in Table.2.1.
Fig.2.4: FT-IR spectrum of solifenacin succinate impurity-A
57
Chapter-II-HPLC Determination of Solifenacin Succinate impurities by Stability Indicating HPLC Method
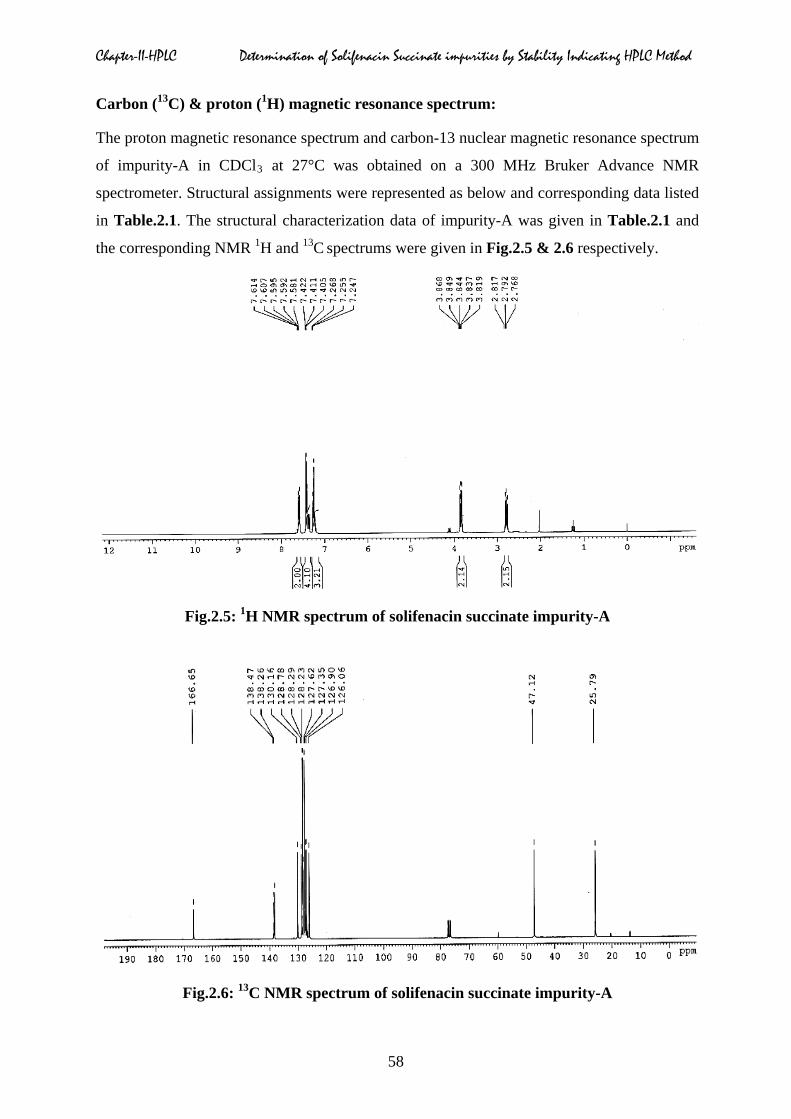
Carbon (13C) & proton (1H) magnetic resonance spectrum:
The proton magnetic resonance spectrum and carbon-13 nuclear magnetic resonance spectrum
of impurity-A in CDCl3 at 27°C was obtained on a 300 MHz Bruker Advance NMR
spectrometer. Structural assignments were represented as below and corresponding data listed
in Table.2.1. The structural characterization data of impurity-A was given in Table.2.1 and
the corresponding NMR 1H and 13C spectrums were given in Fig.2.5 & 2.6 respectively.
Fig.2.5: 1H NMR spectrum of solifenacin succinate impurity-A
Fig.2.6: 13C NMR spectrum of solifenacin succinate impurity-A
58
Chapter-II-HPLC Determination of Solifenacin Succinate impurities by Stability Indicating HPLC Method
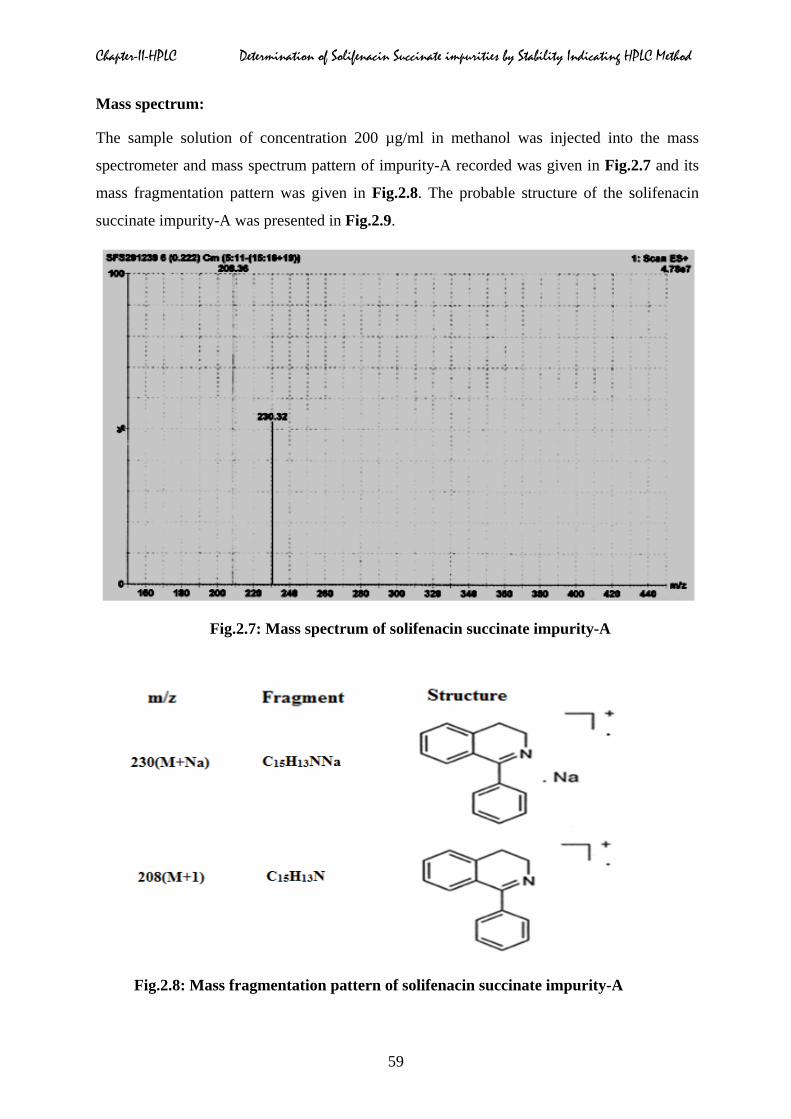
Mass spectrum:
The sample solution of concentration 200 µg/ml in methanol was injected into the mass
spectrometer and mass spectrum pattern of impurity-A recorded was given in Fig.2.7 and its
mass fragmentation pattern was given in Fig.2.8. The probable structure of the solifenacin
succinate impurity-A was presented in Fig.2.9.
Fig.2.7: Mass spectrum of solifenacin succinate impurity-A
Fig.2.8: Mass fragmentation pattern of solifenacin succinate impurity-A
59
Chapter-II-HPLC Determination of Solifenacin Succinate impurities by Stability Indicating HPLC Method
Fig.2.9: Probable structure of the solifenacin succinate impurity-A
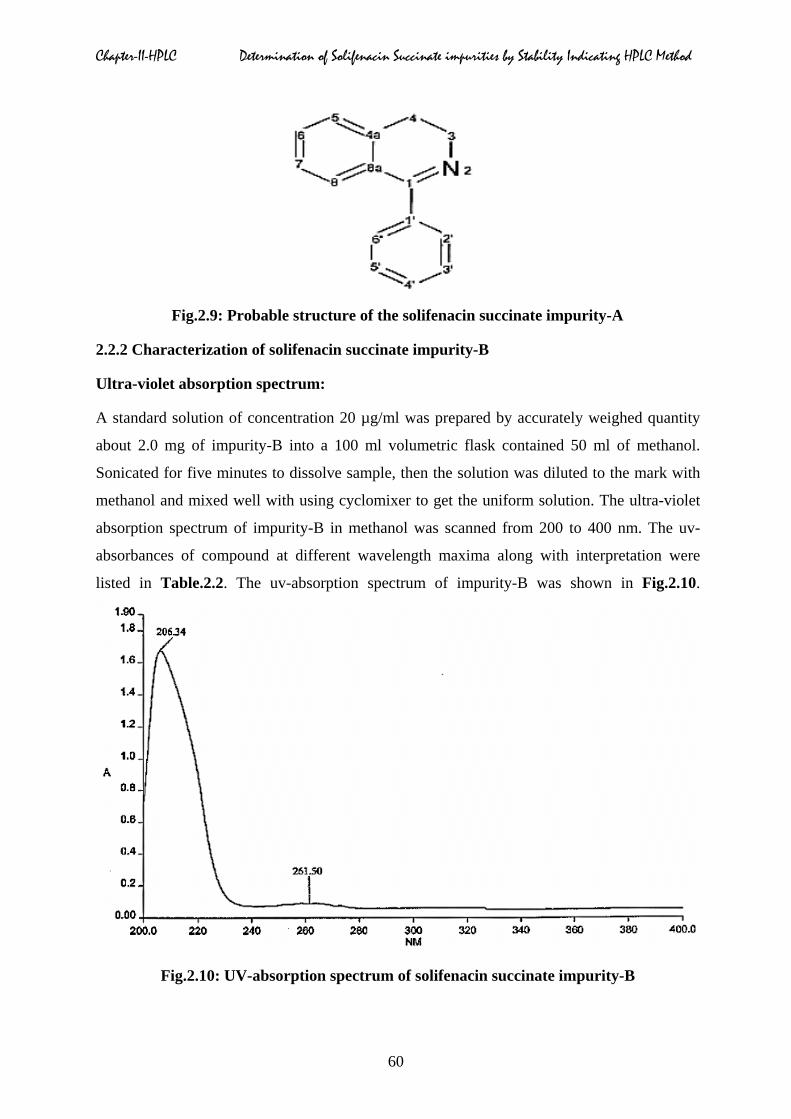
2.2.2 Characterization of solifenacin succinate impurity-B
Ultra-violet absorption spectrum:
A standard solution of concentration 20 µg/ml was prepared by accurately weighed quantity
about 2.0 mg of impurity-B into a 100 ml volumetric flask contained 50 ml of methanol.
Sonicated for five minutes to dissolve sample, then the solution was diluted to the mark with
methanol and mixed well with using cyclomixer to get the uniform solution. The ultra-violet
absorption spectrum of impurity-B in methanol was scanned from 200 to 400 nm. The uv-
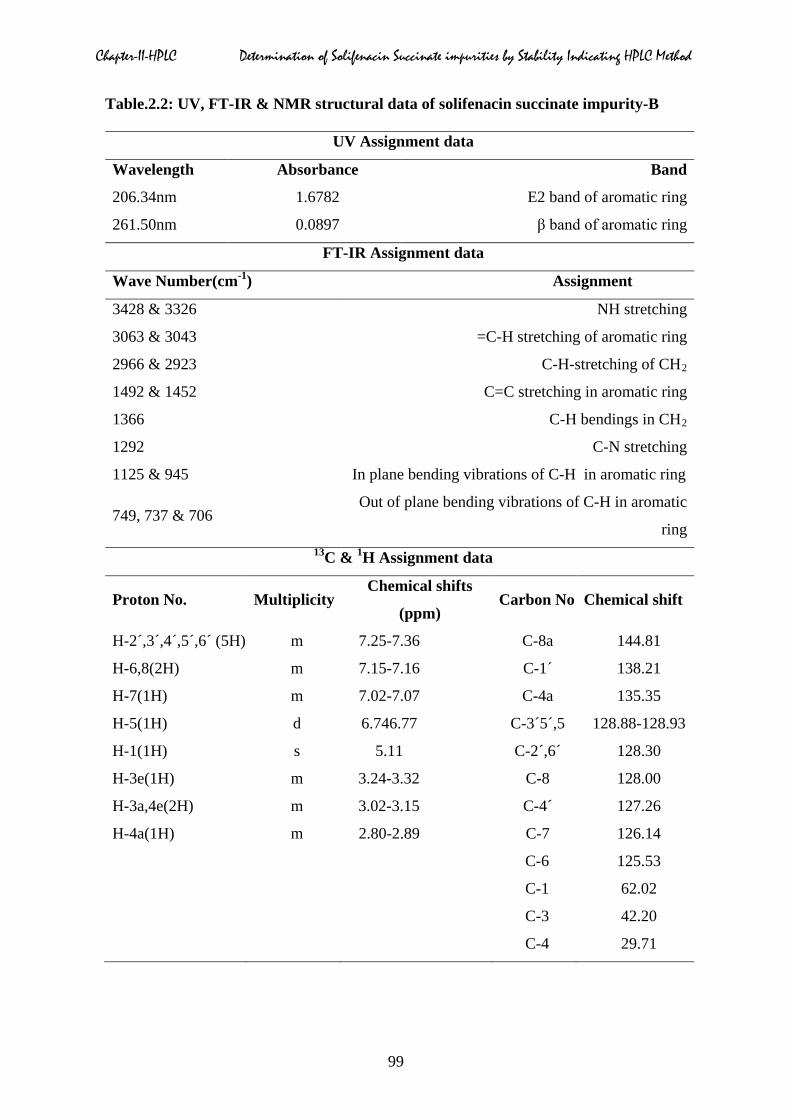
absorbances of compound at different wavelength maxima along with interpretation were
listed in Table.2.2. The uv-absorption spectrum of impurity-B was shown in Fig.2.10.
Fig.2.10: UV-absorption spectrum of solifenacin succinate impurity-B
60
Chapter-II-HPLC Determination of Solifenacin Succinate impurities by Stability Indicating HPLC Method
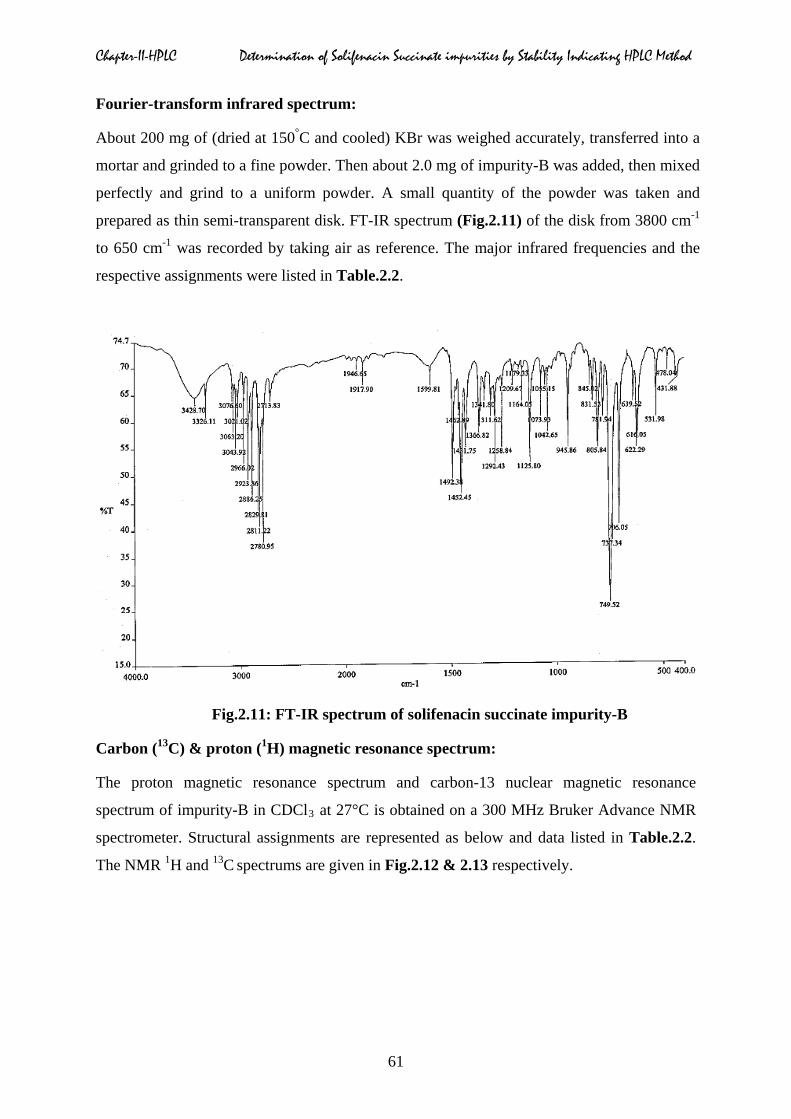
Fourier-transform infrared spectrum:
About 200 mg of (dried at 150°C and cooled) KBr was weighed accurately, transferred into a
mortar and grinded to a fine powder. Then about 2.0 mg of impurity-B was added, then mixed
perfectly and grind to a uniform powder. A small quantity of the powder was taken and
prepared as thin semi-transparent disk. FT-IR spectrum (Fig.2.11) of the disk from 3800 cm-1
to 650 cm-1 was recorded by taking air as reference. The major infrared frequencies and the
respective assignments were listed in Table.2.2.
Fig.2.11: FT-IR spectrum of solifenacin succinate impurity-B
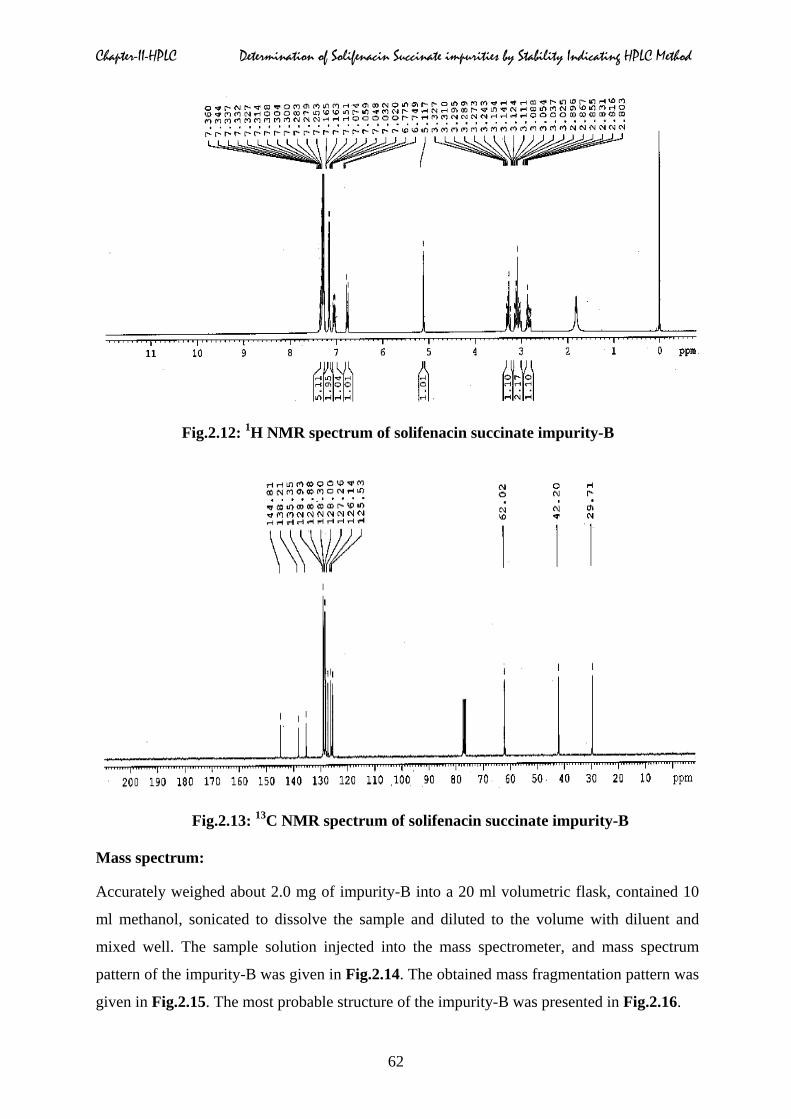
Carbon (13C) & proton (1H) magnetic resonance spectrum:
The proton magnetic resonance spectrum and carbon-13 nuclear magnetic resonance
spectrum of impurity-B in CDCl3 at 27°C is obtained on a 300 MHz Bruker Advance NMR
spectrometer. Structural assignments are represented as below and data listed in Table.2.2.
The NMR 1H and 13C spectrums are given in Fig.2.12 & 2.13 respectively.
61
Chapter-II-HPLC Determination of Solifenacin Succinate impurities by Stability Indicating HPLC Method
Fig.2.12: 1H NMR spectrum of solifenacin succinate impurity-B
Fig.2.13: 13C NMR spectrum of solifenacin succinate impurity-B
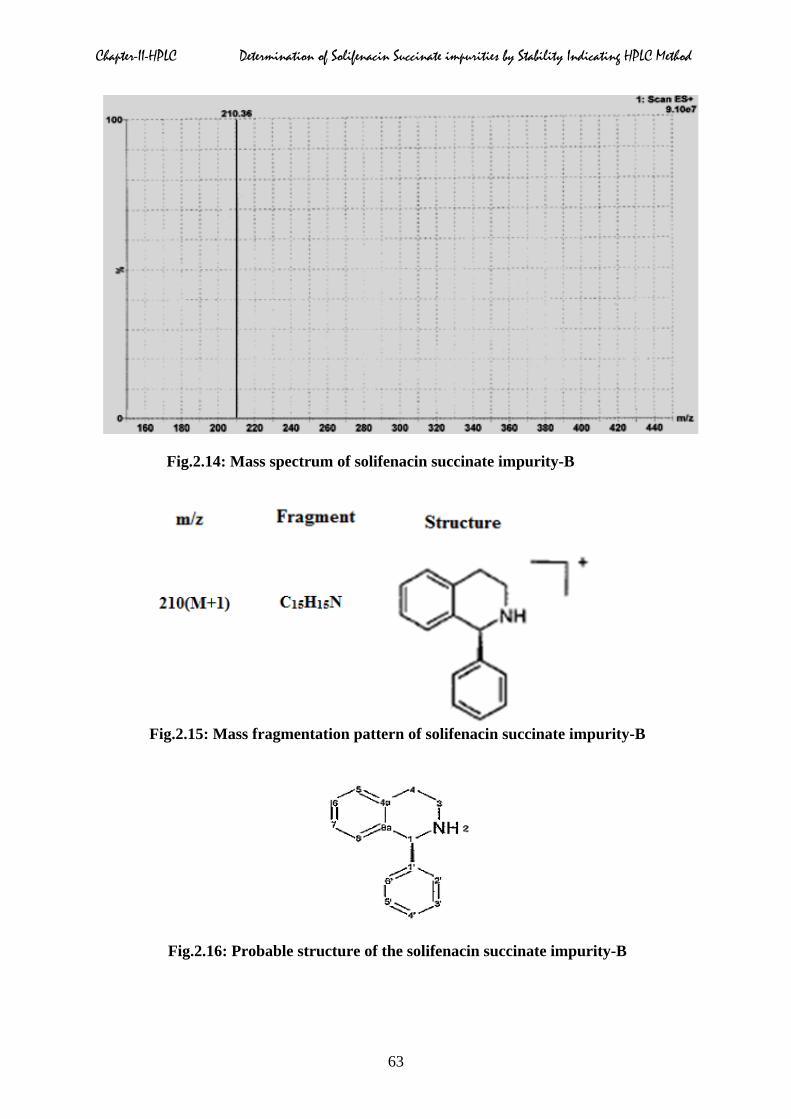
Mass spectrum:
Accurately weighed about 2.0 mg of impurity-B into a 20 ml volumetric flask, contained 10
ml methanol, sonicated to dissolve the sample and diluted to the volume with diluent and
mixed well. The sample solution injected into the mass spectrometer, and mass spectrum
pattern of the impurity-B was given in Fig.2.14. The obtained mass fragmentation pattern was
given in Fig.2.15. The most probable structure of the impurity-B was presented in Fig.2.16.
62
Chapter-II-HPLC Determination of Solifenacin Succinate impurities by Stability Indicating HPLC Method
Fig.2.14: Mass spectrum of solifenacin succinate impurity-B
Fig.2.15: Mass fragmentation pattern of solifenacin succinate impurity-B
Fig.2.16: Probable structure of the solifenacin succinate impurity-B
63
Chapter-II-HPLC Determination of Solifenacin Succinate impurities by Stability Indicating HPLC Method
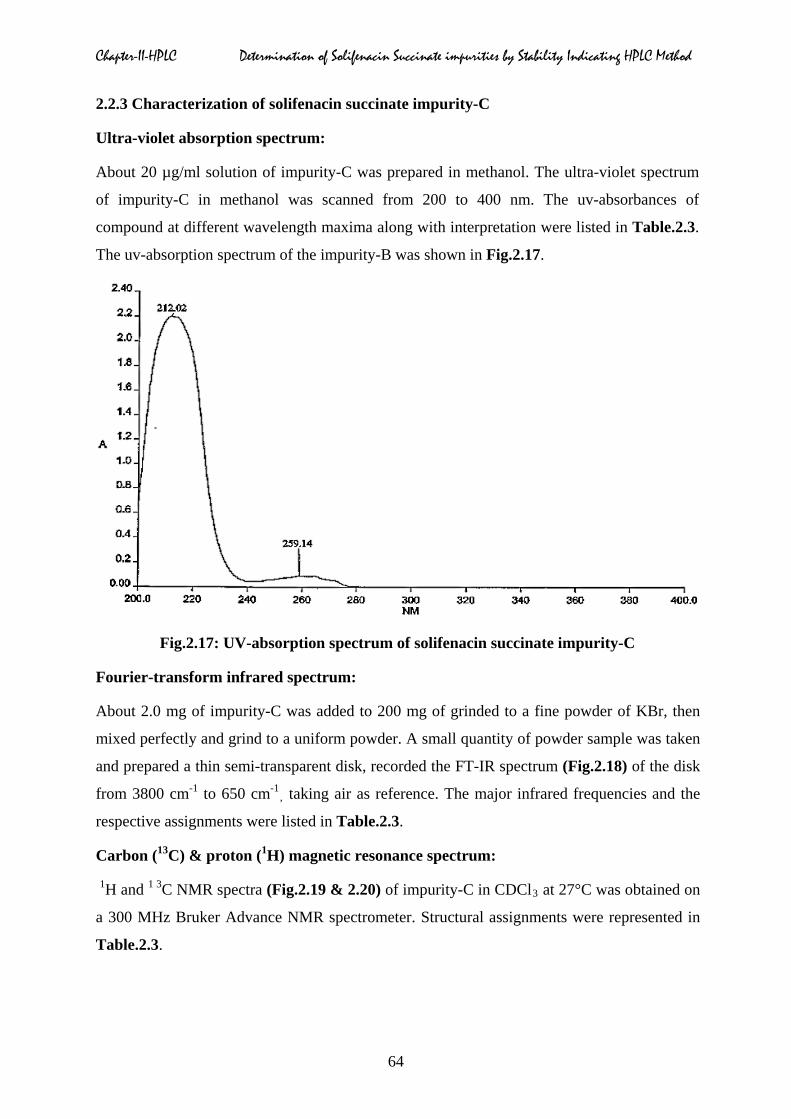
2.2.3 Characterization of solifenacin succinate impurity-C
Ultra-violet absorption spectrum:
About 20 µg/ml solution of impurity-C was prepared in methanol. The ultra-violet spectrum
of impurity-C in methanol was scanned from 200 to 400 nm. The uv-absorbances of
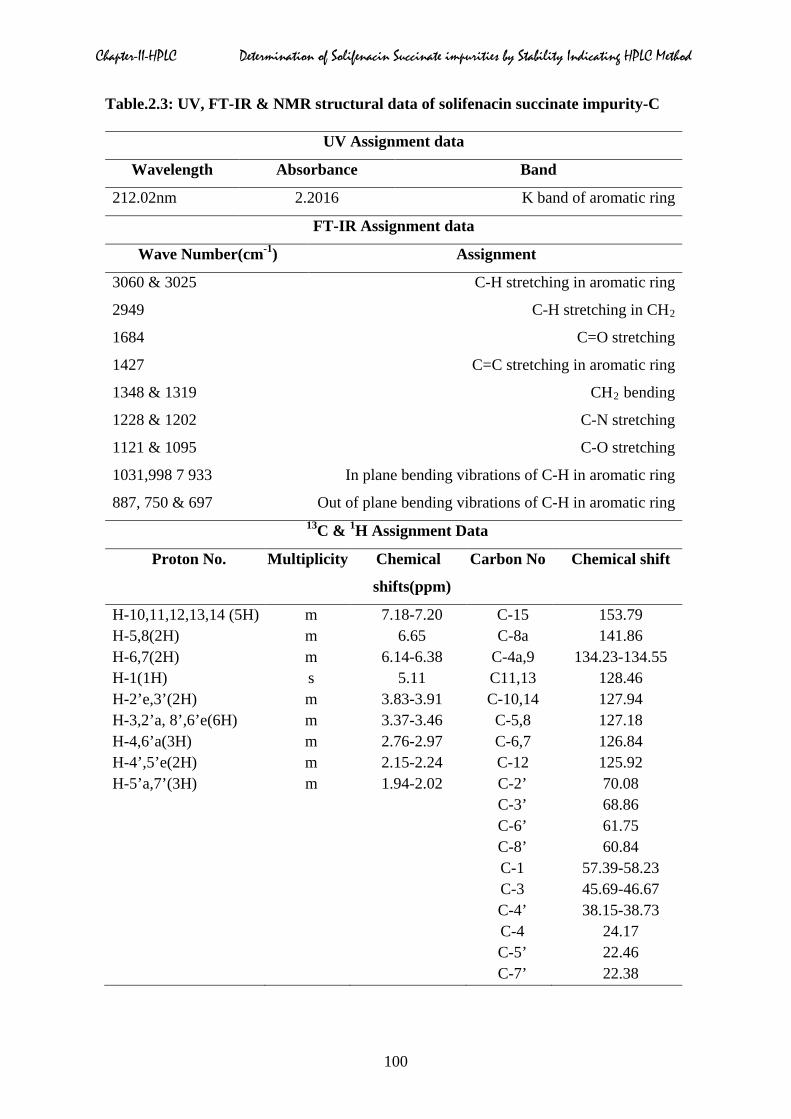
compound at different wavelength maxima along with interpretation were listed in Table.2.3.
The uv-absorption spectrum of the impurity-B was shown in Fig.2.17.
Fig.2.17: UV-absorption spectrum of solifenacin succinate impurity-C
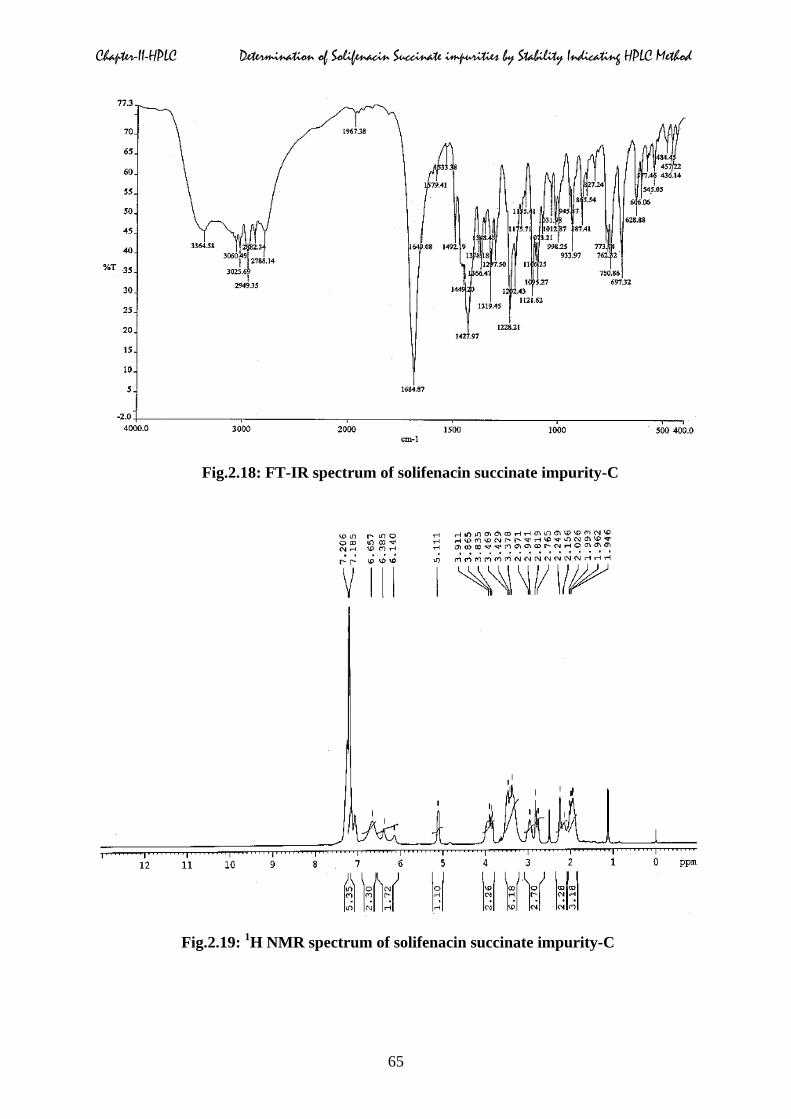
Fourier-transform infrared spectrum:
About 2.0 mg of impurity-C was added to 200 mg of grinded to a fine powder of KBr, then
mixed perfectly and grind to a uniform powder. A small quantity of powder sample was taken
and prepared a thin semi-transparent disk, recorded the FT-IR spectrum (Fig.2.18) of the disk
from 3800 cm-1 to 650 cm-1, taking air as reference. The major infrared frequencies and the
respective assignments were listed in Table.2.3.
Carbon (13C) & proton (1H) magnetic resonance spectrum:
1H and 1 3C NMR spectra (Fig.2.19 & 2.20) of impurity-C in CDCl3 at 27°C was obtained on
a 300 MHz Bruker Advance NMR spectrometer. Structural assignments were represented in
Table.2.3.
64
Chapter-II-HPLC Determination of Solifenacin Succinate impurities by Stability Indicating HPLC Method
Fig.2.18: FT-IR spectrum of solifenacin succinate impurity-C
Fig.2.19: 1H NMR spectrum of solifenacin succinate impurity-C
65
Chapter-II-HPLC Determination of Solifenacin Succinate impurities by Stability Indicating HPLC Method
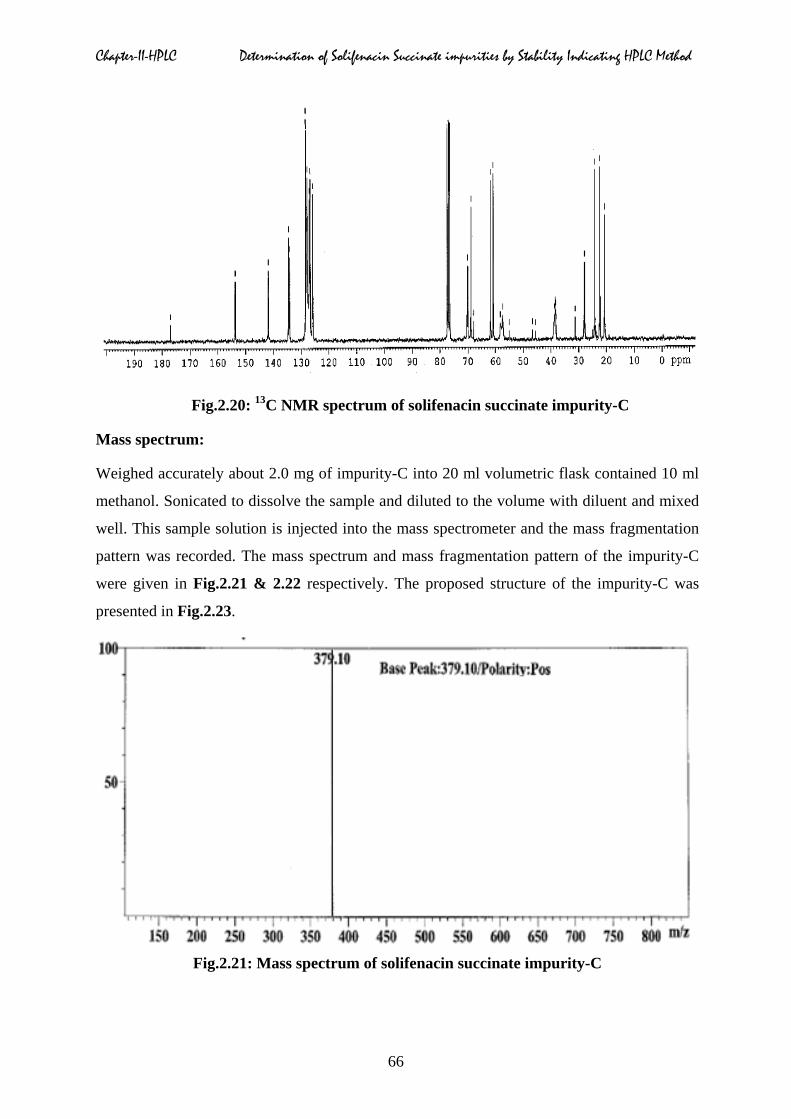
Fig.2.20: 13C NMR spectrum of solifenacin succinate impurity-C
Mass spectrum:
Weighed accurately about 2.0 mg of impurity-C into 20 ml volumetric flask contained 10 ml
methanol. Sonicated to dissolve the sample and diluted to the volume with diluent and mixed
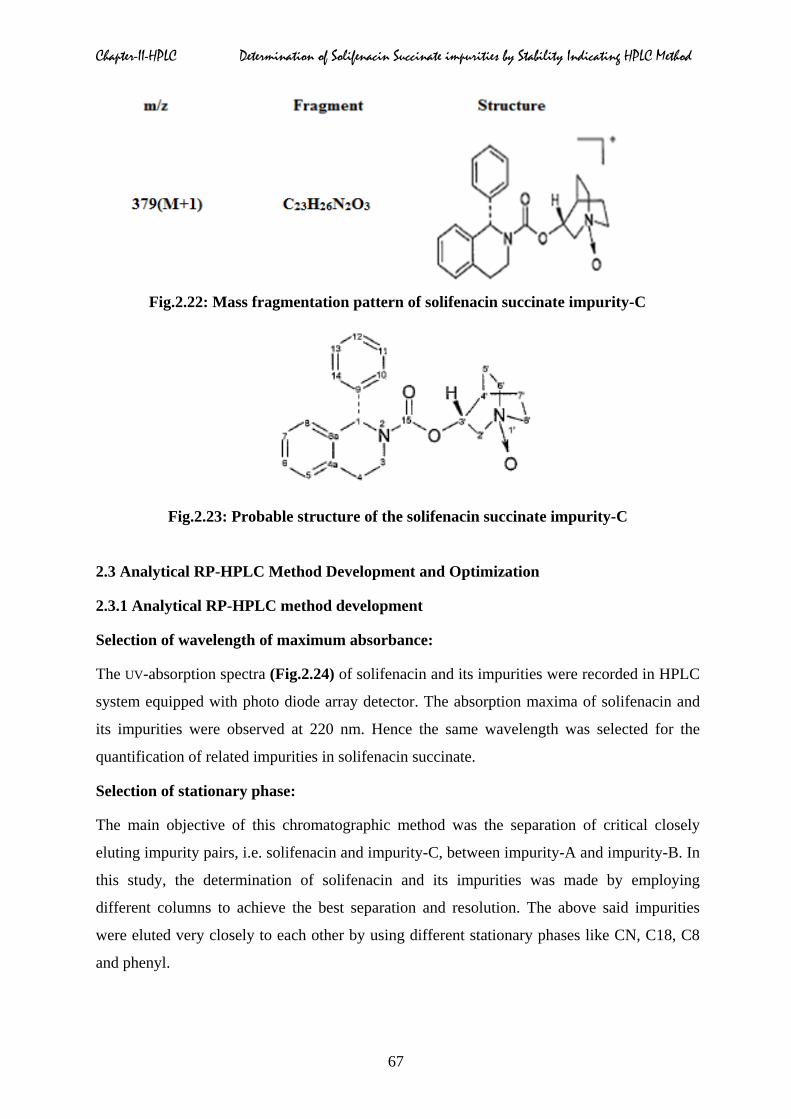
well. This sample solution is injected into the mass spectrometer and the mass fragmentation
pattern was recorded. The mass spectrum and mass fragmentation pattern of the impurity-C
were given in Fig.2.21 & 2.22 respectively. The proposed structure of the impurity-C was
presented in Fig.2.23.
Fig.2.21: Mass spectrum of solifenacin succinate impurity-C
66
Chapter-II-HPLC Determination of Solifenacin Succinate impurities by Stability Indicating HPLC Method
Fig.2.22: Mass fragmentation pattern of solifenacin succinate impurity-C
Fig.2.23: Probable structure of the solifenacin succinate impurity-C
2.3 Analytical RP-HPLC Method Development and Optimization
2.3.1 Analytical RP-HPLC method development
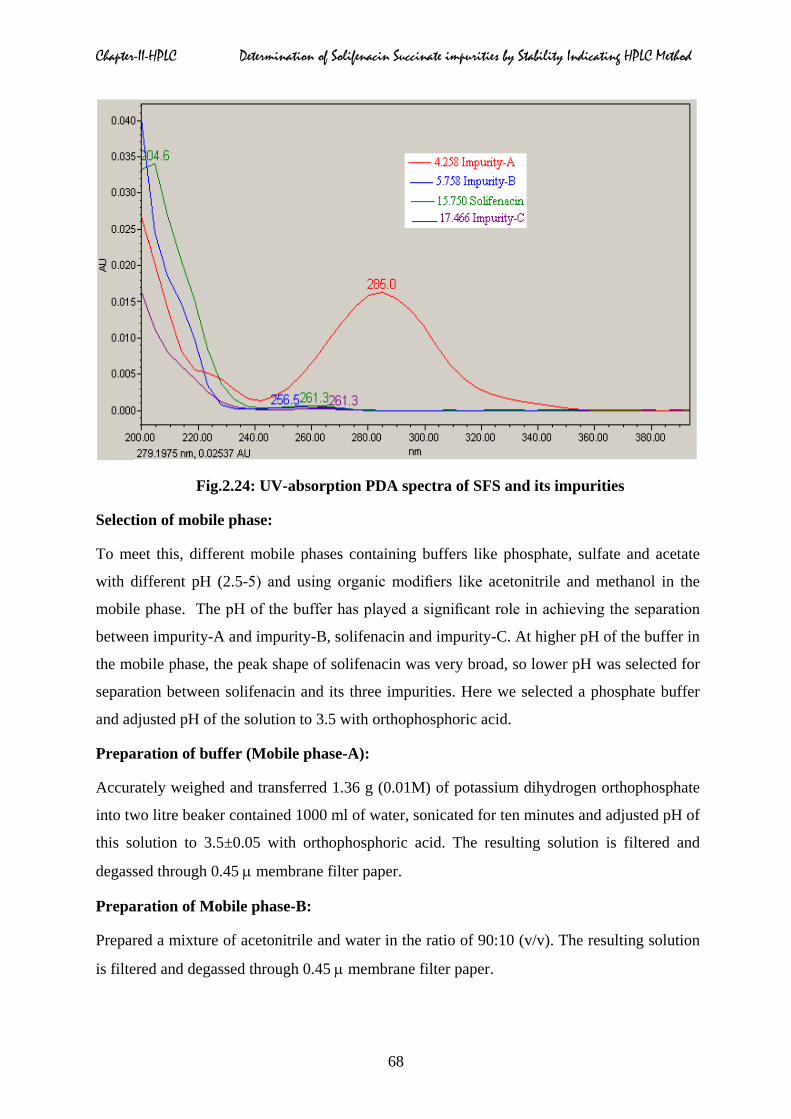
Selection of wavelength of maximum absorbance:
The UV-absorption spectra (Fig.2.24) of solifenacin and its impurities were recorded in HPLC
system equipped with photo diode array detector. The absorption maxima of solifenacin and
its impurities were observed at 220 nm. Hence the same wavelength was selected for the
quantification of related impurities in solifenacin succinate.
Selection of stationary phase:
The main objective of this chromatographic method was the separation of critical closely
eluting impurity pairs, i.e. solifenacin and impurity-C, between impurity-A and impurity-B. In
this study, the determination of solifenacin and its impurities was made by employing
different columns to achieve the best separation and resolution. The above said impurities
were eluted very closely to each other by using different stationary phases like CN, C18, C8
and phenyl.
67
Chapter-II-HPLC Determination of Solifenacin Succinate impurities by Stability Indicating HPLC Method
Fig.2.24: UV-absorption PDA spectra of SFS and its impurities
Selection of mobile phase:
To meet this, different mobile phases containing buffers like phosphate, sulfate and acetate
with different pH (2.5-5) and using organic modifiers like acetonitrile and methanol in the
mobile phase. The pH of the buffer has played a significant role in achieving the separation
between impurity-A and impurity-B, solifenacin and impurity-C. At higher pH of the buffer in
the mobile phase, the peak shape of solifenacin was very broad, so lower pH was selected for
separation between solifenacin and its three impurities. Here we selected a phosphate buffer
and adjusted pH of the solution to 3.5 with orthophosphoric acid.
Preparation of buffer (Mobile phase-A):
Accurately weighed and transferred 1.36 g (0.01M) of potassium dihydrogen orthophosphate
into two litre beaker contained 1000 ml of water, sonicated for ten minutes and adjusted pH of
this solution to 3.5±0.05 with orthophosphoric acid. The resulting solution is filtered and
degassed through 0.45 µ membrane filter paper.
Preparation of Mobile phase-B:
Prepared a mixture of acetonitrile and water in the ratio of 90:10 (v/v). The resulting solution
is filtered and degassed through 0.45 µ membrane filter paper.
68
Chapter-II-HPLC Determination of Solifenacin Succinate impurities by Stability Indicating HPLC Method
Preparation Diluent:
Prepared a mixture of mobile phase-A and acetonitrile in the ratio of 90:10 (v/v).
Mode of elution:
In order to get the clear separation between all the known, unknown impurities as well as
degradants, the gradient method was recommended rather than isocratic method. Since there
was no clear separation between these impurities in isocratic method, the gradient method was
used to assay and process related impurities in solifenacin succinate in the present study.
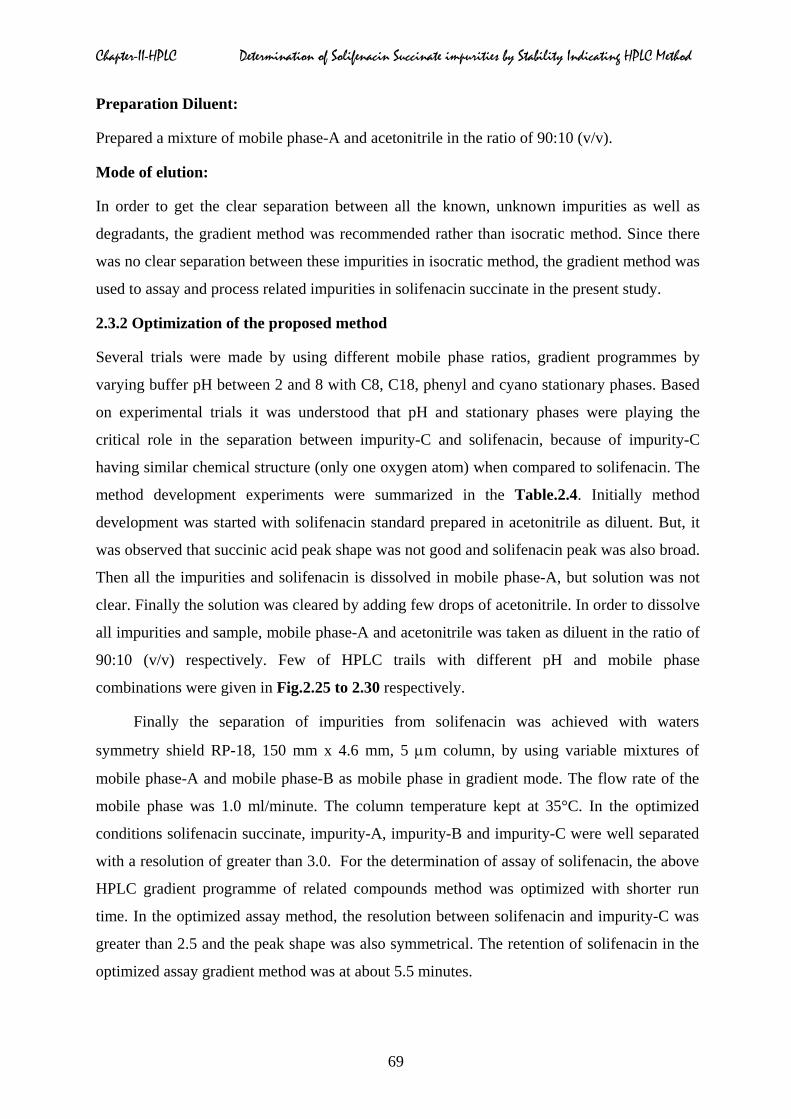
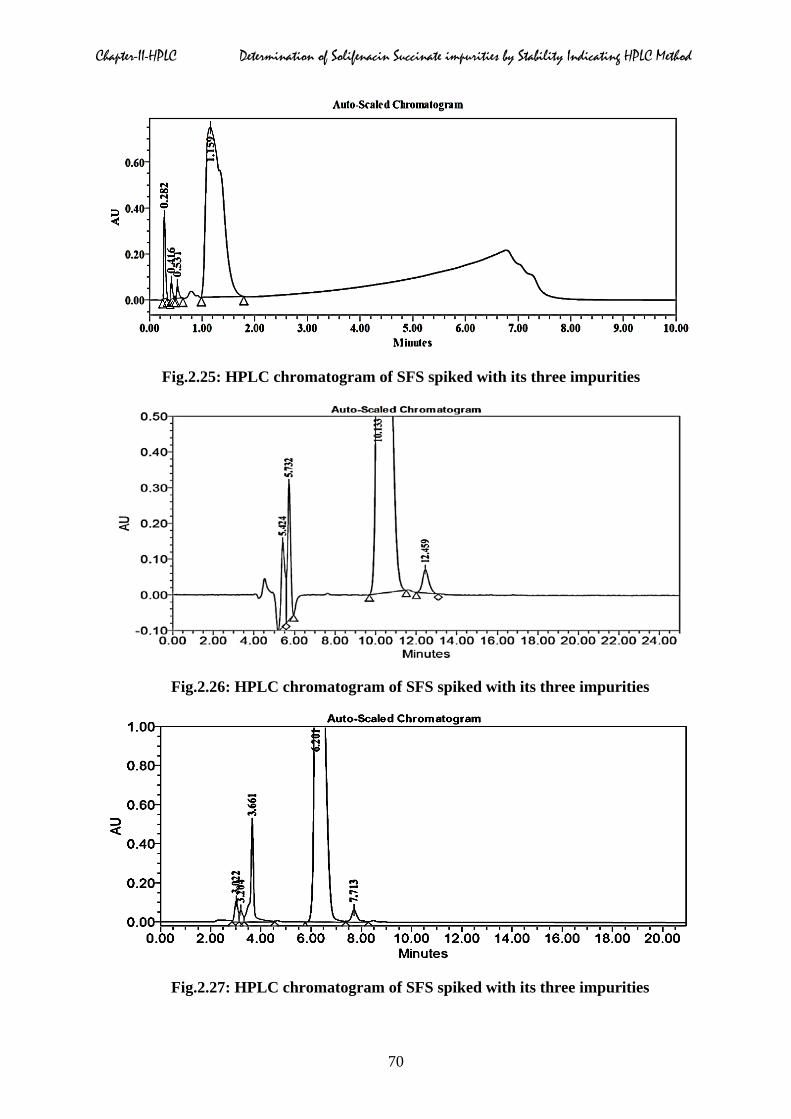
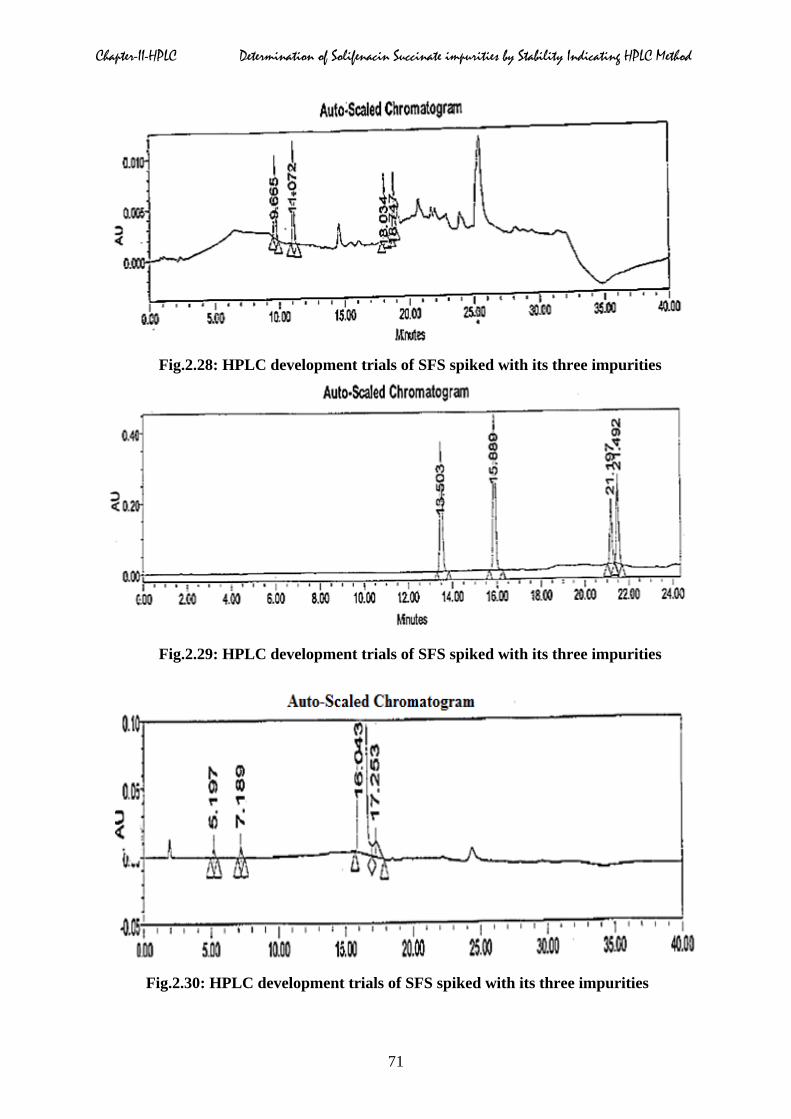
2.3.2 Optimization of the proposed method
Several trials were made by using different mobile phase ratios, gradient programmes by
varying buffer pH between 2 and 8 with C8, C18, phenyl and cyano stationary phases. Based
on experimental trials it was understood that pH and stationary phases were playing the
critical role in the separation between impurity-C and solifenacin, because of impurity-C
having similar chemical structure (only one oxygen atom) when compared to solifenacin. The
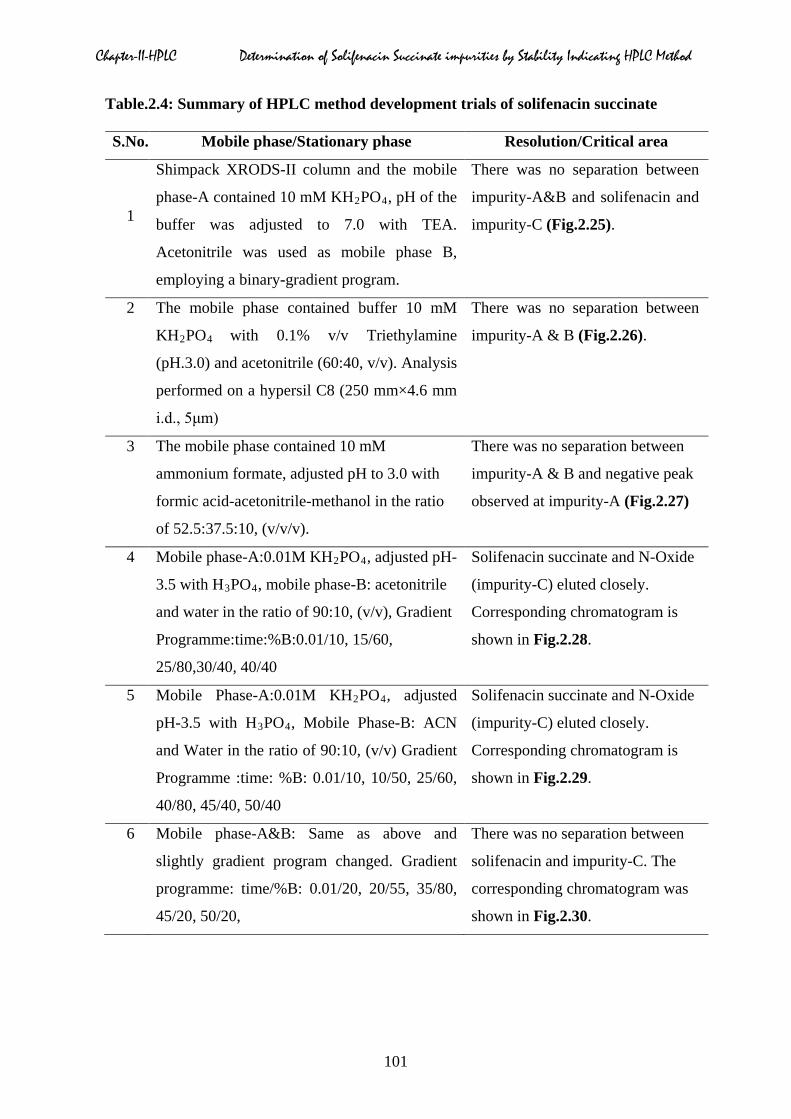
method development experiments were summarized in the Table.2.4. Initially method
development was started with solifenacin standard prepared in acetonitrile as diluent. But, it
was observed that succinic acid peak shape was not good and solifenacin peak was also broad.
Then all the impurities and solifenacin is dissolved in mobile phase-A, but solution was not
clear. Finally the solution was cleared by adding few drops of acetonitrile. In order to dissolve
all impurities and sample, mobile phase-A and acetonitrile was taken as diluent in the ratio of
90:10 (v/v) respectively. Few of HPLC trails with different pH and mobile phase
combinations were given in Fig.2.25 to 2.30 respectively.
Finally the separation of impurities from solifenacin was achieved with waters
symmetry shield RP-18, 150 mm x 4.6 mm, 5 µm column, by using variable mixtures of
mobile phase-A and mobile phase-B as mobile phase in gradient mode. The flow rate of the
mobile phase was 1.0 ml/minute. The column temperature kept at 35°C. In the optimized
conditions solifenacin succinate, impurity-A, impurity-B and impurity-C were well separated
with a resolution of greater than 3.0. For the determination of assay of solifenacin, the above
HPLC gradient programme of related compounds method was optimized with shorter run
time. In the optimized assay method, the resolution between solifenacin and impurity-C was
greater than 2.5 and the peak shape was also symmetrical. The retention of solifenacin in the
optimized assay gradient method was at about 5.5 minutes.
69
Chapter-II-HPLC Determination of Solifenacin Succinate impurities by Stability Indicating HPLC Method
Fig.2.25: HPLC chromatogram of SFS spiked with its three impurities
Fig.2.26: HPLC chromatogram of SFS spiked with its three impurities
Fig.2.27: HPLC chromatogram of SFS spiked with its three impurities
70
Chapter-II-HPLC Determination of Solifenacin Succinate impurities by Stability Indicating HPLC Method
Fig.2.28: HPLC development trials of SFS spiked with its three impurities
Fig.2.29: HPLC development trials of SFS spiked with its three impurities
Fig.2.30: HPLC development trials of SFS spiked with its three impurities
71
Chapter-II-HPLC Determination of Solifenacin Succinate impurities by Stability Indicating HPLC Method
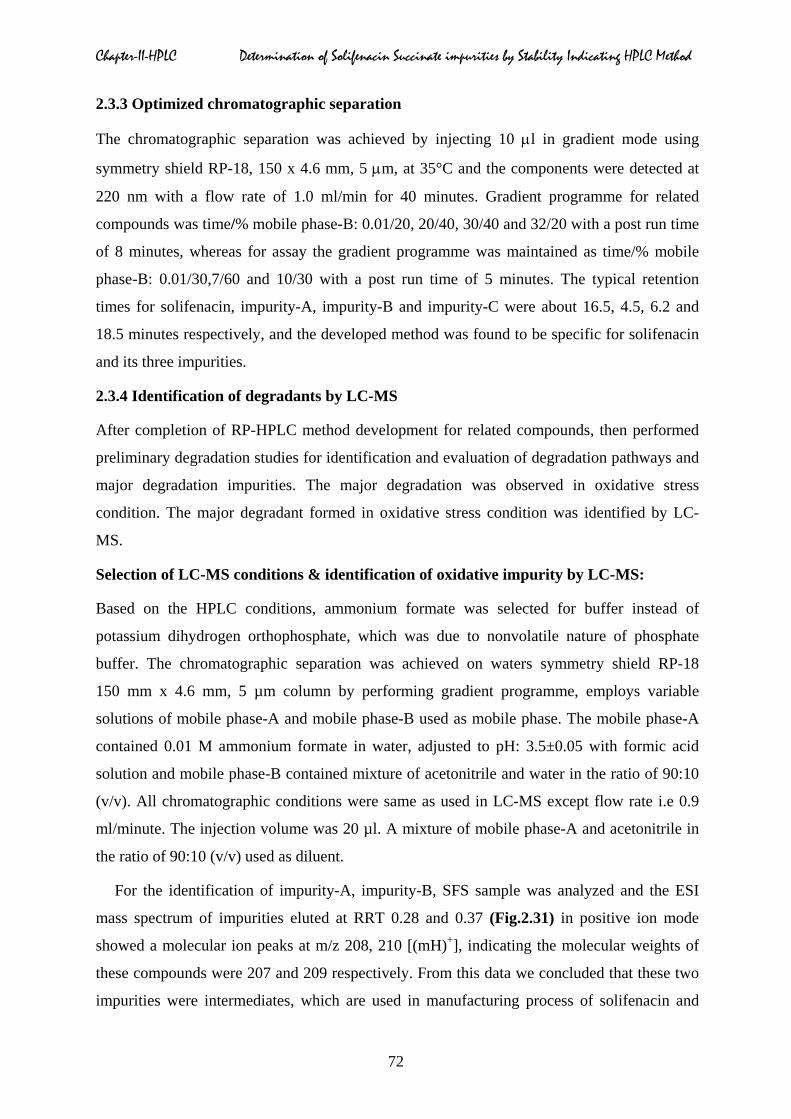
2.3.3 Optimized chromatographic separation
The chromatographic separation was achieved by injecting 10 µl in gradient mode using
symmetry shield RP-18, 150 x 4.6 mm, 5 µm, at 35°C and the components were detected at
220 nm with a flow rate of 1.0 ml/min for 40 minutes. Gradient programme for related
compounds was time/% mobile phase-B: 0.01/20, 20/40, 30/40 and 32/20 with a post run time
of 8 minutes, whereas for assay the gradient programme was maintained as time/% mobile
phase-B: 0.01/30,7/60 and 10/30 with a post run time of 5 minutes. The typical retention
times for solifenacin, impurity-A, impurity-B and impurity-C were about 16.5, 4.5, 6.2 and
18.5 minutes respectively, and the developed method was found to be specific for solifenacin
and its three impurities.
2.3.4 Identification of degradants by LC-MS
After completion of RP-HPLC method development for related compounds, then performed
preliminary degradation studies for identification and evaluation of degradation pathways and
major degradation impurities. The major degradation was observed in oxidative stress
condition. The major degradant formed in oxidative stress condition was identified by LC-
MS.
Selection of LC-MS conditions & identification of oxidative impurity by LC-MS:
Based on the HPLC conditions, ammonium formate was selected for buffer instead of
potassium dihydrogen orthophosphate, which was due to nonvolatile nature of phosphate
buffer. The chromatographic separation was achieved on waters symmetry shield RP-18
150 mm x 4.6 mm, 5 µm column by performing gradient programme, employs variable
solutions of mobile phase-A and mobile phase-B used as mobile phase. The mobile phase-A
contained 0.01 M ammonium formate in water, adjusted to pH: 3.5±0.05 with formic acid
solution and mobile phase-B contained mixture of acetonitrile and water in the ratio of 90:10
(v/v). All chromatographic conditions were same as used in LC-MS except flow rate i.e 0.9
ml/minute. The injection volume was 20 µl. A mixture of mobile phase-A and acetonitrile in
the ratio of 90:10 (v/v) used as diluent.
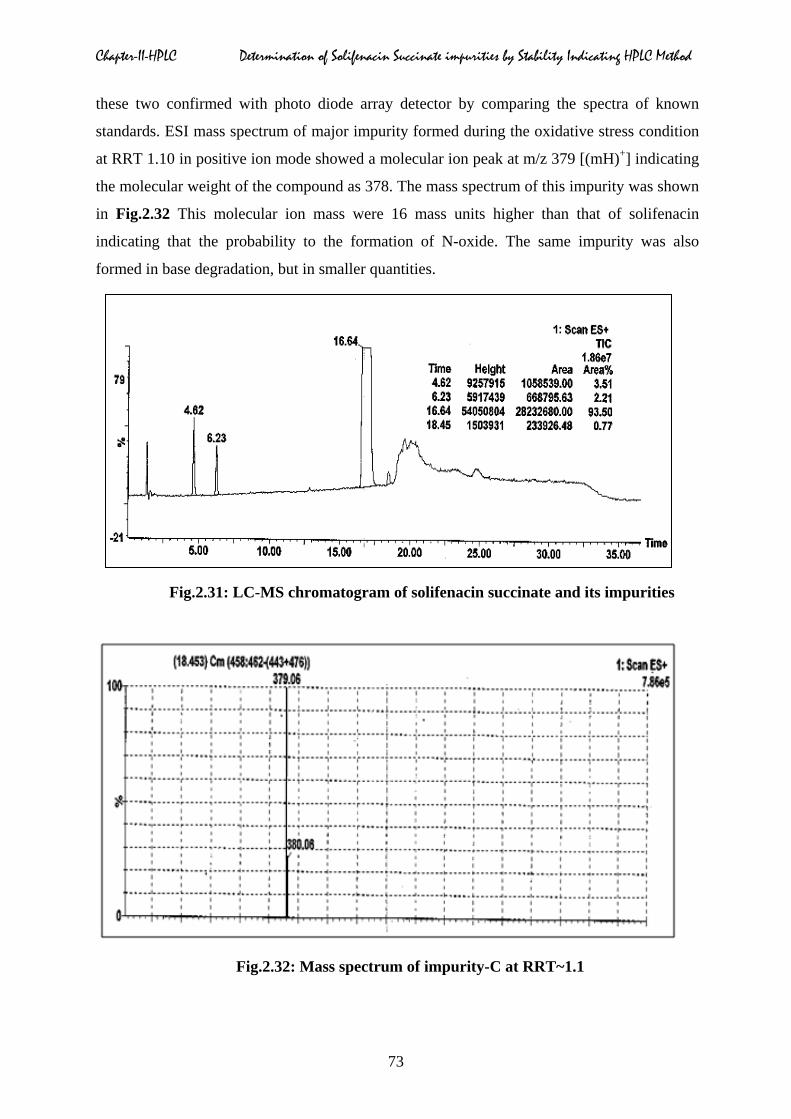
For the identification of impurity-A, impurity-B, SFS sample was analyzed and the ESI
mass spectrum of impurities eluted at RRT 0.28 and 0.37 (Fig.2.31) in positive ion mode
showed a molecular ion peaks at m/z 208, 210 [(mH)+], indicating the molecular weights of
these compounds were 207 and 209 respectively. From this data we concluded that these two
impurities were intermediates, which are used in manufacturing process of solifenacin and
72
Chapter-II-HPLC Determination of Solifenacin Succinate impurities by Stability Indicating HPLC Method
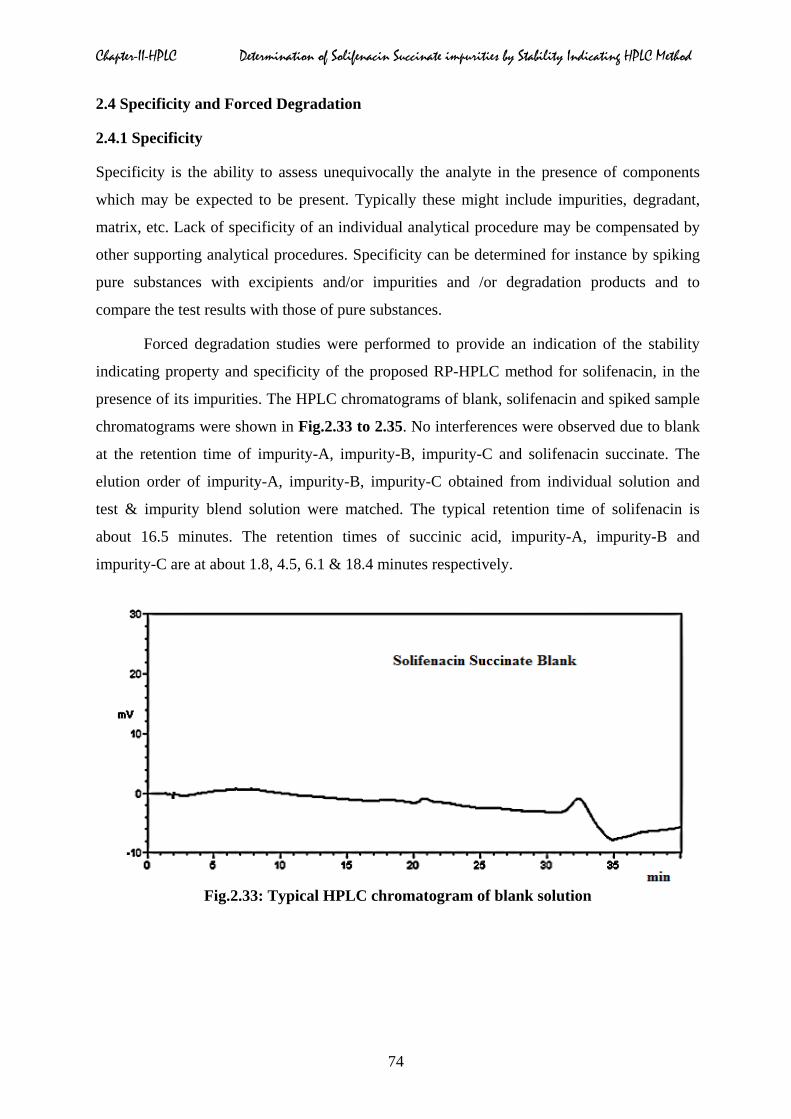
these two confirmed with photo diode array detector by comparing the spectra of known
standards. ESI mass spectrum of major impurity formed during the oxidative stress condition
at RRT 1.10 in positive ion mode showed a molecular ion peak at m/z 379 [(mH)+] indicating
the molecular weight of the compound as 378. The mass spectrum of this impurity was shown
in Fig.2.32 This molecular ion mass were 16 mass units higher than that of solifenacin
indicating that the probability to the formation of N-oxide. The same impurity was also
formed in base degradation, but in smaller quantities.
Fig.2.31: LC-MS chromatogram of solifenacin succinate and its impurities
Fig.2.32: Mass spectrum of impurity-C at RRT~1.1
73
Chapter-II-HPLC Determination of Solifenacin Succinate impurities by Stability Indicating HPLC Method
2.4 Specificity and Forced Degradation
2.4.1 Specificity
Specificity is the ability to assess unequivocally the analyte in the presence of components
which may be expected to be present. Typically these might include impurities, degradant,
matrix, etc. Lack of specificity of an individual analytical procedure may be compensated by
other supporting analytical procedures. Specificity can be determined for instance by spiking
pure substances with excipients and/or impurities and /or degradation products and to
compare the test results with those of pure substances.
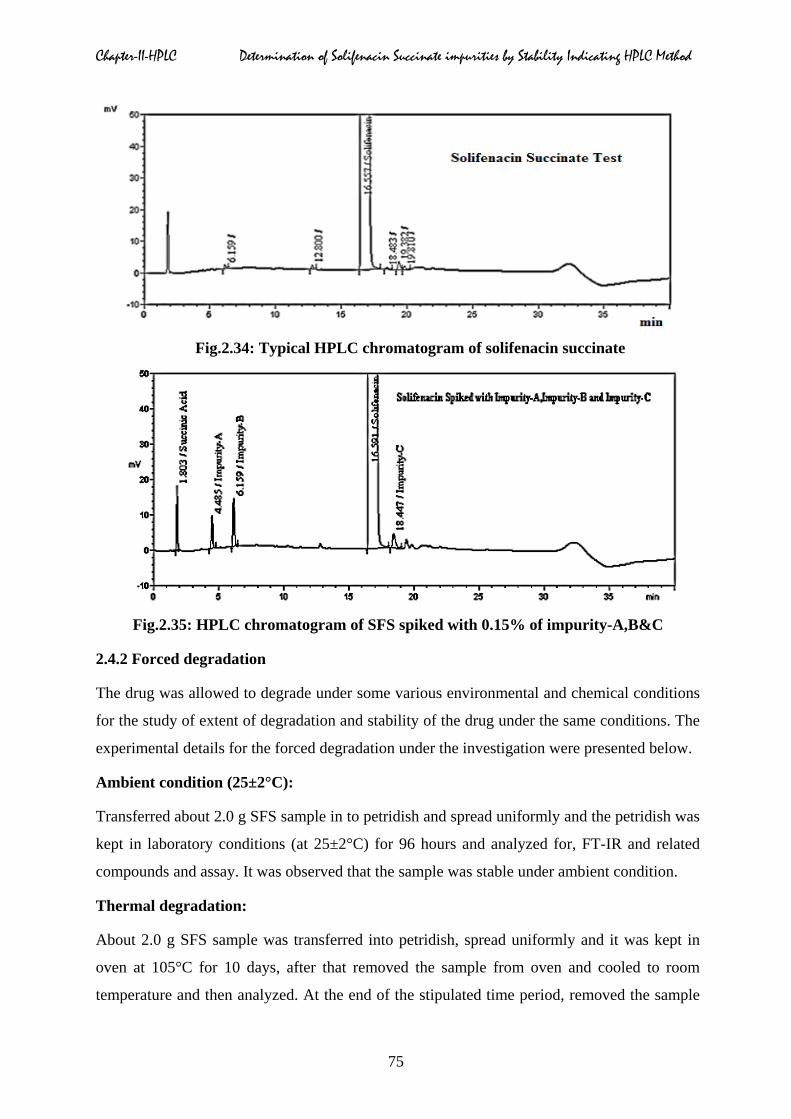
Forced degradation studies were performed to provide an indication of the stability
indicating property and specificity of the proposed RP-HPLC method for solifenacin, in the
presence of its impurities. The HPLC chromatograms of blank, solifenacin and spiked sample
chromatograms were shown in Fig.2.33 to 2.35. No interferences were observed due to blank
at the retention time of impurity-A, impurity-B, impurity-C and solifenacin succinate. The
elution order of impurity-A, impurity-B, impurity-C obtained from individual solution and
test & impurity blend solution were matched. The typical retention time of solifenacin is
about 16.5 minutes. The retention times of succinic acid, impurity-A, impurity-B and
impurity-C are at about 1.8, 4.5, 6.1 & 18.4 minutes respectively.
Fig.2.33: Typical HPLC chromatogram of blank solution
74
Chapter-II-HPLC Determination of Solifenacin Succinate impurities by Stability Indicating HPLC Method
Fig.2.34: Typical HPLC chromatogram of solifenacin succinate
Fig.2.35: HPLC chromatogram of SFS spiked with 0.15% of impurity-A,B&C
2.4.2 Forced degradation
The drug was allowed to degrade under some various environmental and chemical conditions
for the study of extent of degradation and stability of the drug under the same conditions. The
experimental details for the forced degradation under the investigation were presented below.
Ambient condition (25±2°C):
Transferred about 2.0 g SFS sample in to petridish and spread uniformly and the petridish was
kept in laboratory conditions (at 25±2°C) for 96 hours and analyzed for, FT-IR and related
compounds and assay. It was observed that the sample was stable under ambient condition.
Thermal degradation:
About 2.0 g SFS sample was transferred into petridish, spread uniformly and it was kept in
oven at 105°C for 10 days, after that removed the sample from oven and cooled to room
temperature and then analyzed. At the end of the stipulated time period, removed the sample
75
Chapter-II-HPLC Determination of Solifenacin Succinate impurities by Stability Indicating HPLC Method
from oven and analyzed for description, FT-IR and related compounds and assay. It was
found that the sample was stable under thermal condition.
Exposure to humidity (90% RH):
About 2.0 g SFS sample was taken into petridish and spread uniformly. Then the petridish
was kept in desiccator containing saturated ammonium chloride solution (to obtain 90% RH)
for 10 days. At the end of the stipulated time period, removed the sample from desiccator and
analyzed for description, FT-IR and related compounds, assay. Sample was found to be stable
under humidity conditions.
Exposure to photo light (Photolysis):
Transferred about 2.0 g SFS sample into petridish and spread uniformly. Then the petridish
was kept in photo light chamber and exposed it to light for three times cycle to 1.2 million
LUX hours and 200 Watt-Hours/Sq.mts. At the end of the stipulated time period, removed the
sample from photolytic chamber and analyzed for description, FT-IR and related compounds
and assay, and found that the sample was stable under photolytic condition.
Hydrolysis (Water degradation):
Weighed and transferred accurately 50 mg of SFS sample into a 100 ml volumetric flask,
added 10 ml of water and heated the solution at 80°C for 4 hrs. At the end of the exposure
time period, cooled the solution and made up to the volume with diluent and mixed well and
analyzed for description, FT-IR, related compounds and assay. It was observed that sample
was stable under photolytic condition.
Acid hydrolysis (Acid degradation):
About 50 mg of SFS sample was weighed and transferred accurately into a 100 ml volumetric
flask, added 10 ml of 0.1N HCl and heated the solution at 80°C for 4 hrs. At the end of the
exposure, cooled the solution and made up to the volume with diluent and mixed well. Taken
this solution and analyzed for description, FT-IR, related compounds and assay. The sample
was stable under acid hydrolysis.
Base hydrolyses (Base dégradation) :
Weighed and transferred accurately 50 mg of SFS sample into a 100 ml volumetric flask,
added 10 ml of 0.1N NaOH and heated the solution at 80°C for 4 hours. At the end of the
exposure, cooled the solution and made up to the volume with diluent and mixed well. Taken
this solution and analyzed for description, FT-IR, related compounds and assay. It was found
76
Chapter-II-HPLC Determination of Solifenacin Succinate impurities by Stability Indicating HPLC Method
that the SFS was stable under base hydrolysis.
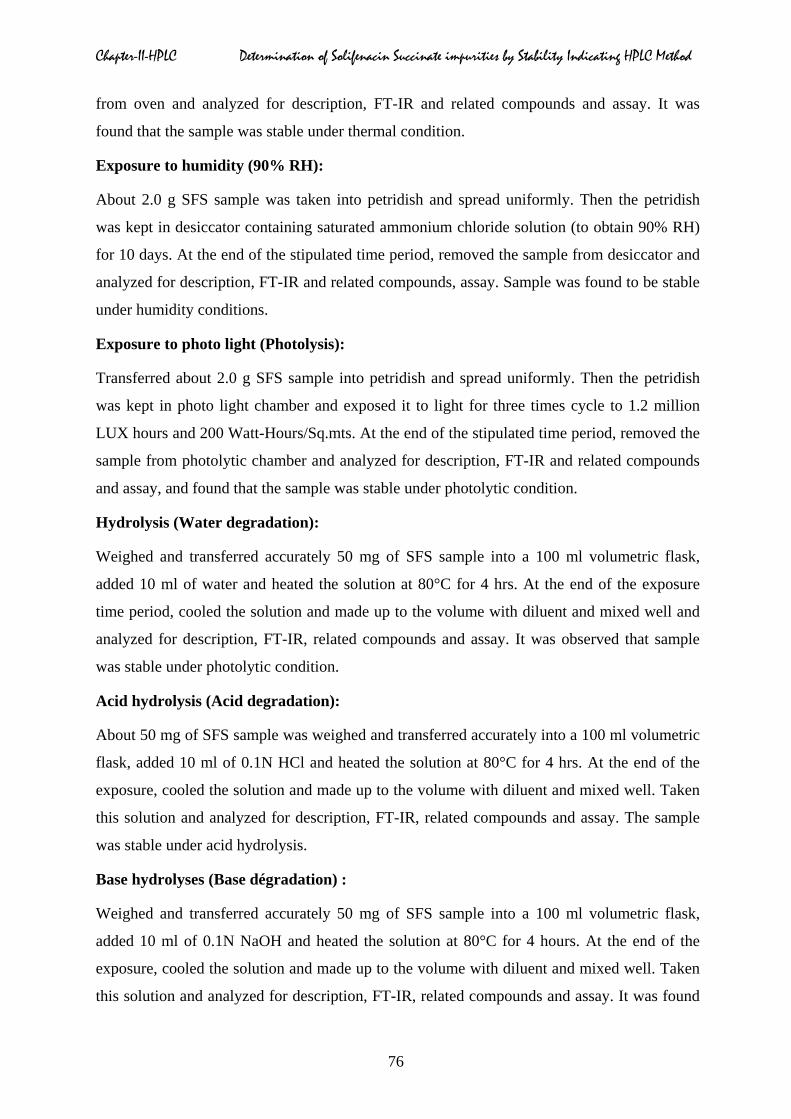
Oxidation: Weighed and transferred accurately 50 mg of SFS sample into a 100 ml
volumetric flask, added 10 ml of 10% H2O2 and heated the solution at 80°C for 2 hours. At
the end of the exposure, cooled the solution and made up to the volume with diluent and
mixed well. This solution was analyzed for description, FT-IR, related compounds and assay.
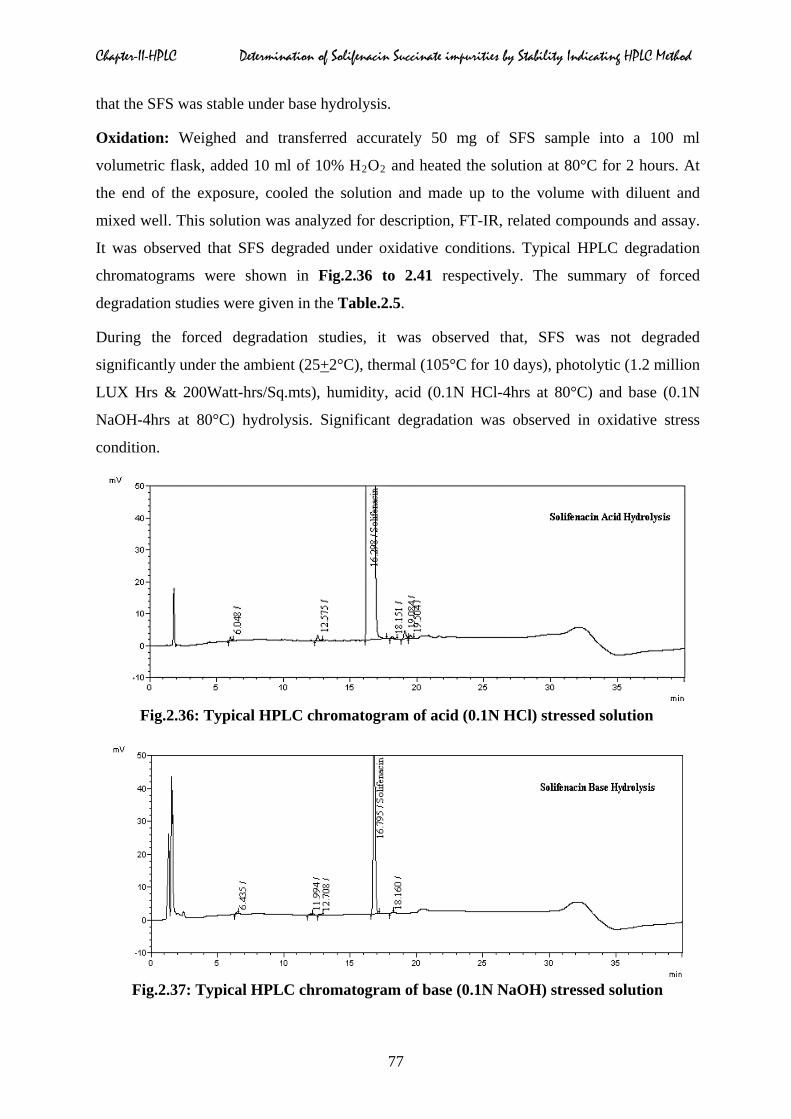
It was observed that SFS degraded under oxidative conditions. Typical HPLC degradation
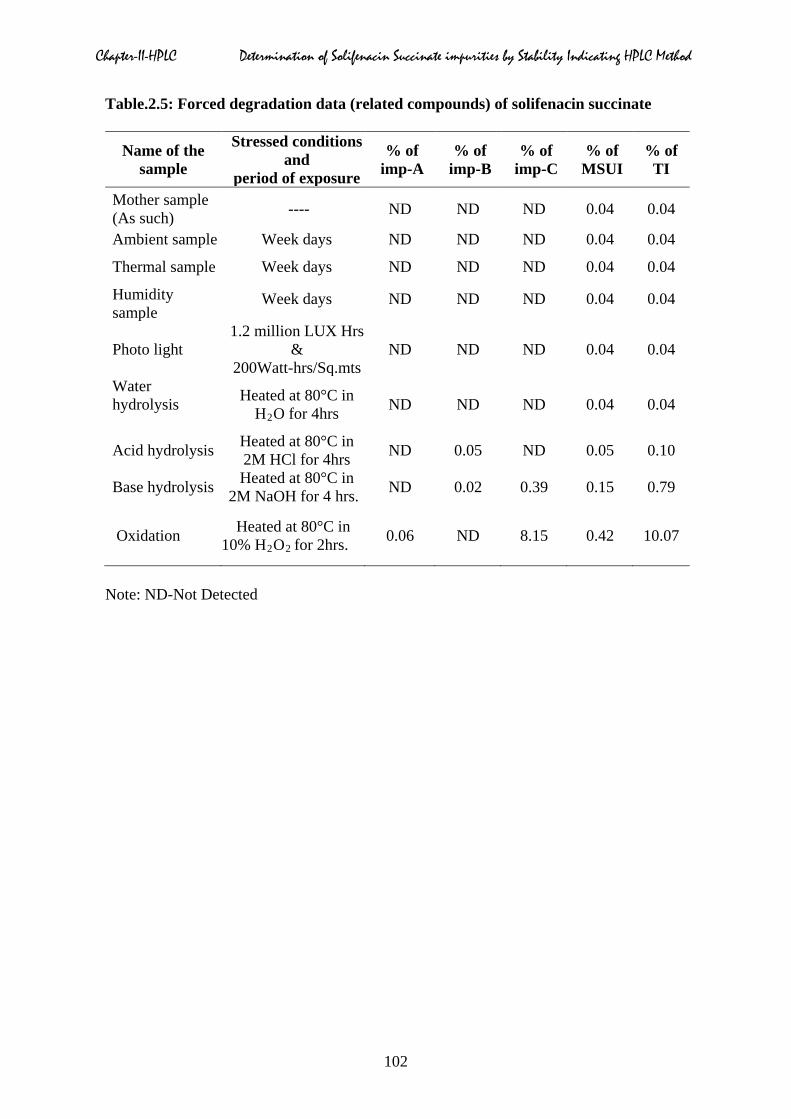
chromatograms were shown in Fig.2.36 to 2.41 respectively. The summary of forced
degradation studies were given in the Table.2.5.
During the forced degradation studies, it was observed that, SFS was not degraded
significantly under the ambient (25+2°C), thermal (105°C for 10 days), photolytic (1.2 million
LUX Hrs & 200Watt-hrs/Sq.mts), humidity, acid (0.1N HCl-4hrs at 80°C) and base (0.1N
NaOH-4hrs at 80°C) hydrolysis. Significant degradation was observed in oxidative stress
condition.
Fig.2.36: Typical HPLC chromatogram of acid (0.1N HCl) stressed solution
Fig.2.37: Typical HPLC chromatogram of base (0.1N NaOH) stressed solution
77
Chapter-II-HPLC Determination of Solifenacin Succinate impurities by Stability Indicating HPLC Method
Fig.2.38: Typical HPLC chromatogram of oxidative (10%H2O2) solution
Fig.2.39: Typical HPLC chromatogram of water hydrolysis solution
Fig.2.40: Typical HPLC chromatogram of thermal stressed solution
78
Chapter-II-HPLC Determination of Solifenacin Succinate impurities by Stability Indicating HPLC Method
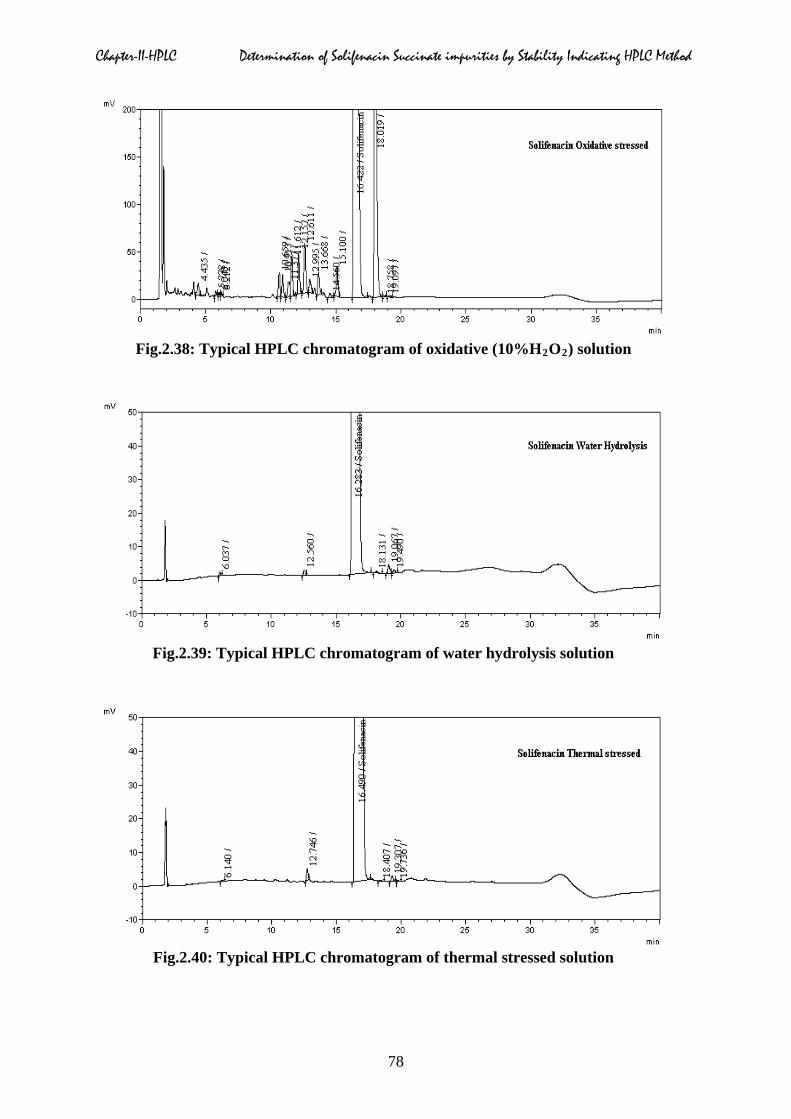
Fig.2.41: Typical HPLC chromatogram of photo light stressed solution
The peak purity test was carried out for SFS sample for each stress condition by using with
PDA detector. In each stressed condition the single point threshold of SFS was less than that
of peak purity index value. Assay studies were carried out for stress samples against qualified
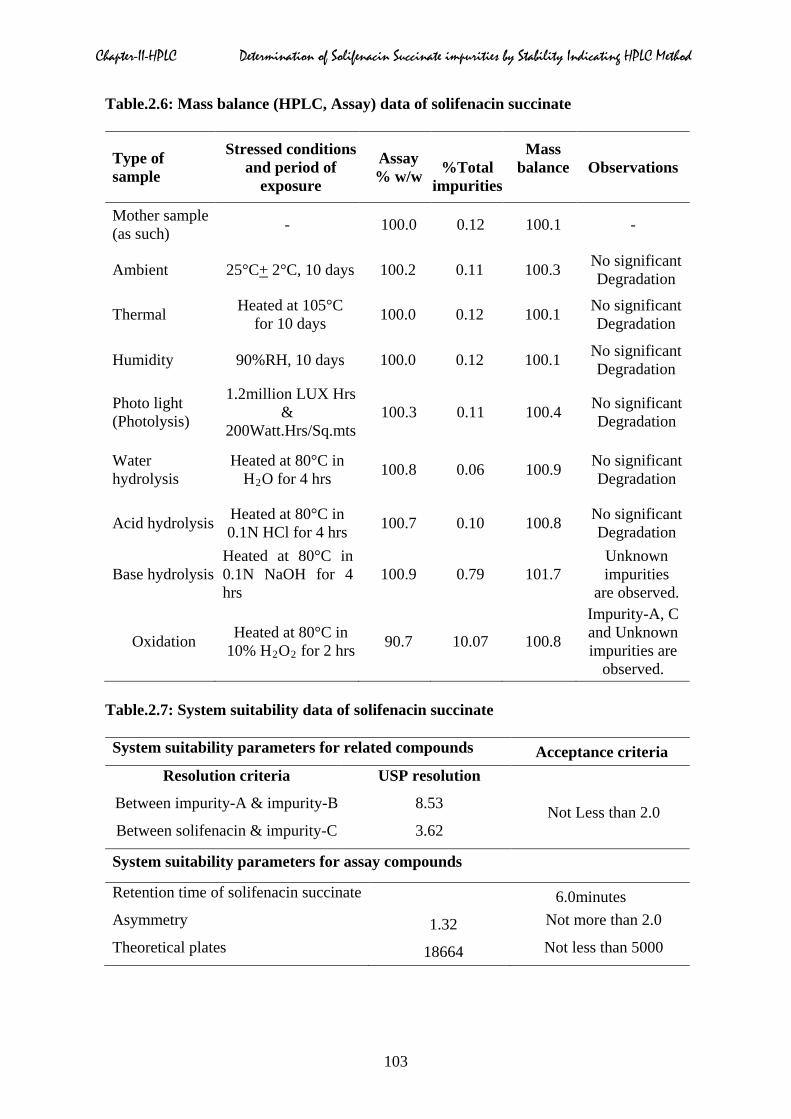
reference standard and the mass balance (%assay + %impurities + %degradation products)
was calculated. Assay was also calculated for bulk sample by spiking all three impurities
(impurity-A, B & C) at the specification level (i.e. 0.15 % of impurity-A, B and C with
respect to analyte concentration, which was 0.5 mg/ml). The mass balance data of forced
degradation samples were shown in Table.2.6.
2.5 Analytical Method Validation
2.5.1 Preparation of solutions
Preparation of working standard stock solution (200 µg/ml):
Accurately weighed and transferred 500 mg of SFS reference standard into a 100 ml
volumetric flask containing 50 ml diluent, sonicated for ten minutes and diluted up to the
mark with diluent and mixed homogeneously by kept on cyclo mixer for five minutes.
Transferred 4.0 ml of this solution into 100 ml volumetric flask and diluted to the volume
with diluent, mixed homogeneously by using on cyclo mixer for five minutes.
Preparation of working standard reference solution (20 µg/ml):
Accurately weighed and transferred 2.0 mg of SFS reference standard into a 100 ml
volumetric flask containing 50 ml diluent, sonicated for ten minutes and diluted up to the
mark with diluent and mixed homogeneously by using cyclo mixer for five minutes.
79

Chapter-II-HPLC Determination of Solifenacin Succinate impurities by Stability Indicating HPLC Method
Preparation of impurity stock solution (30 µg/ml): Accurately weighed and transferred
each 3.0 mg of impurity-A, impurity-B and impurity-C into a 100 ml volumetric flask
containing 50 ml diluent. Sonicated for five minutes and diluted to the mark with diluent and
mixed homogeneously by using cyclo mixer for five minutes.
Preparation of standard solution (0.75 µg/ml of impurities & 0.5 µg/ml of standard):
Transferred 2.5 ml of impurity stock solution (30 µg/ml) and 0.25 ml of working standard
solution (200 µg/ml) into 100 ml volumetric flask and then diluted to the volume with diluent
and mixed homogeneously by using cyclo mixer for five minutes.
Preparation of system suitability solution (500 µg/ml of test & 0.75 µg/ml of impurities):
Accurately weighed and transferred 50 mg of test sample into a 100 ml volumetric flask
containing 50 ml diluent, sonicated for 10 minutes and added 2.5 ml of impurity stock
solution and then diluted to the mark with diluent and mixed homogeneously by using cyclo
mixer for five minutes.
Preparation of test solution (500 µg/ml): Accurately weighed and transferred 50 mg of the
test sample into a 100 ml volumetric flask containing 50 ml of diluent, sonicated for 10
minutes and diluted to the mark with diluent and mixed homogeneously by using on cyclo
mixer for five minutes.
Preparation of assay standard solution (100 µg/ml): Accurately weighed and transferred 10
mg of SFS reference standard into a 100 ml volumetric flask containing 50 ml diluent,
sonicated for 10 minutes and diluted to the mark with diluent and mixed homogeneously.
Preparation of assay test solution (100 µg/ml): Accurately weighed and transferred 10 mg
of SFS test sample into a 100 ml volumetric flask containing 50 ml diluent, sonicated for 10
minutes and diluted to the volume with diluent and mixed homogeneously by kept on cyclo
mixer for five minutes.
Preparation of SFS tablet solution (100 µg/ml): Thirty tablets were crushed to fine powder
by mortar and pestle. Sample powder equivalent to about 50 mg of SFS was weighed and
transferred to 100 ml volumetric flask, 70 ml of diluent was added and sonicated for 30
minute with intermittent swirling, diluted to volume with diluent (0.5 mg/ml of solifenacin
succinate) and filtered with 0.45 μm nylon membrane filter. Evaluated the resolution between
SFS and impurity-C (N-Oxide). The system suitability parameters like, resolution between
closely eluting impurities, theoretical plates and tailing factor of SFS was shown in Table.2.7.
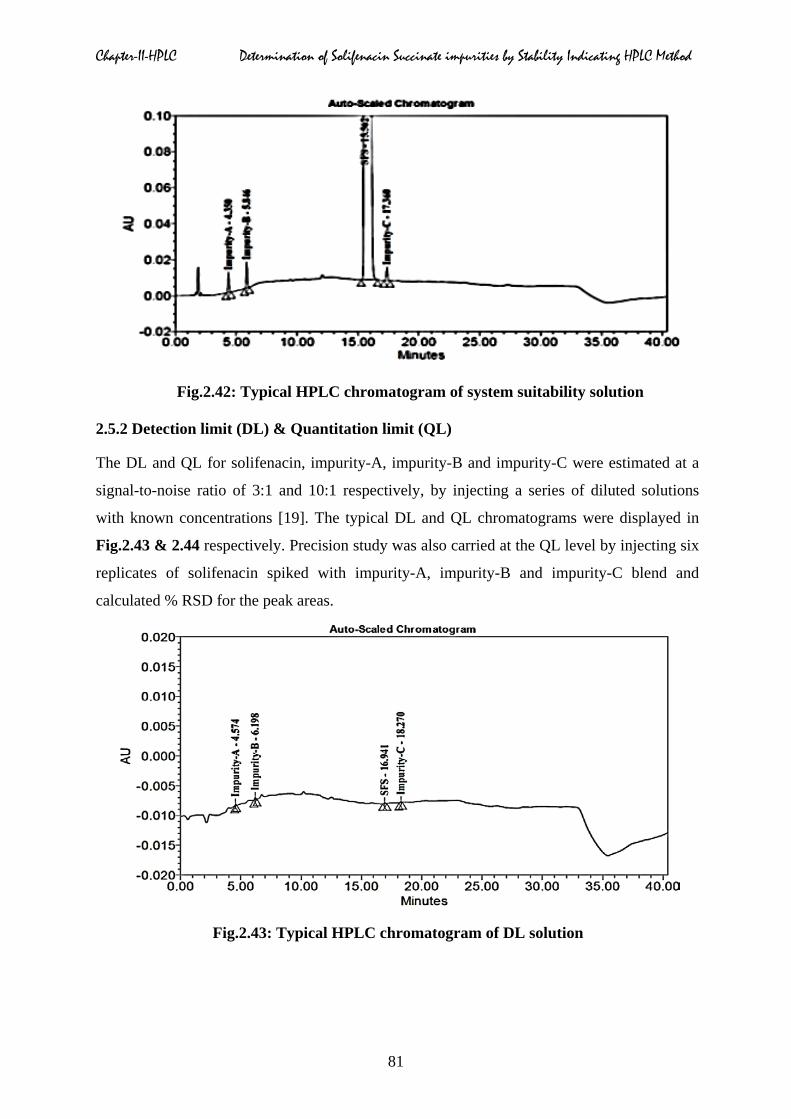
Typical spiked chromatogram of SFS with its impurities was shown in Fig.2.42.
80
Chapter-II-HPLC Determination of Solifenacin Succinate impurities by Stability Indicating HPLC Method
Fig.2.42: Typical HPLC chromatogram of system suitability solution
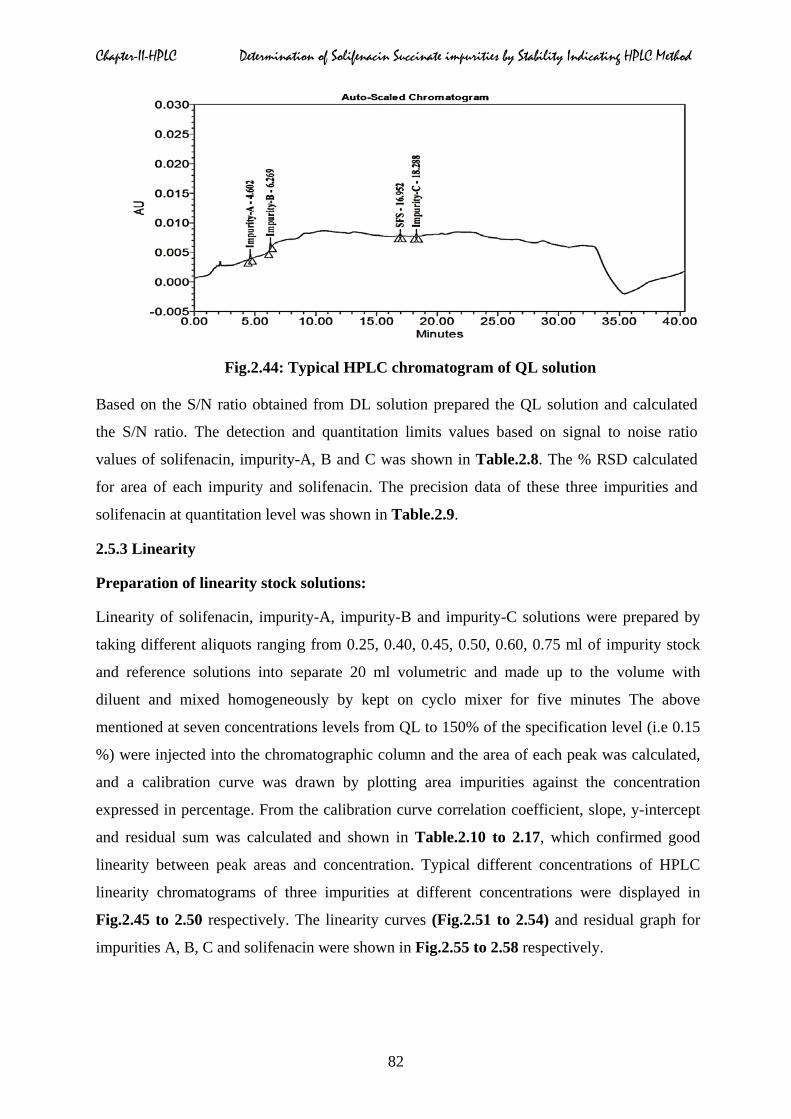
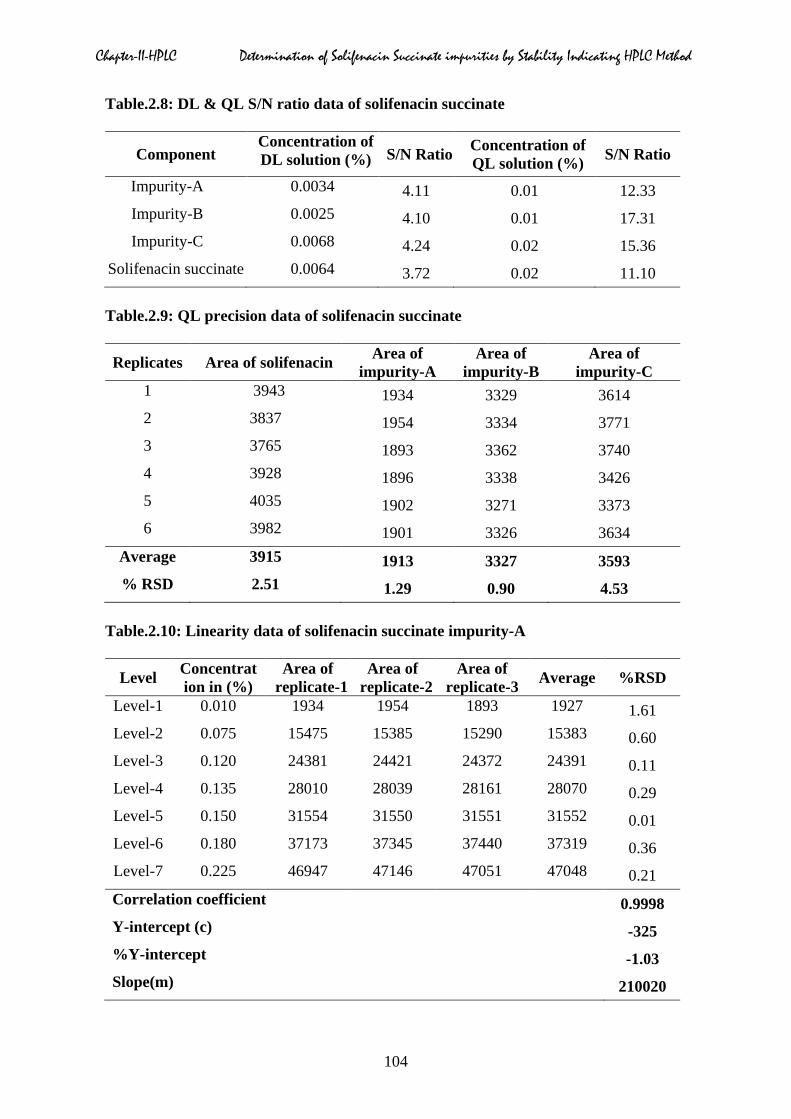
2.5.2 Detection limit (DL) & Quantitation limit (QL)
The DL and QL for solifenacin, impurity-A, impurity-B and impurity-C were estimated at a
signal-to-noise ratio of 3:1 and 10:1 respectively, by injecting a series of diluted solutions
with known concentrations [19]. The typical DL and QL chromatograms were displayed in
Fig.2.43 & 2.44 respectively. Precision study was also carried at the QL level by injecting six
replicates of solifenacin spiked with impurity-A, impurity-B and impurity-C blend and
calculated % RSD for the peak areas.
Fig.2.43: Typical HPLC chromatogram of DL solution
81
Chapter-II-HPLC Determination of Solifenacin Succinate impurities by Stability Indicating HPLC Method
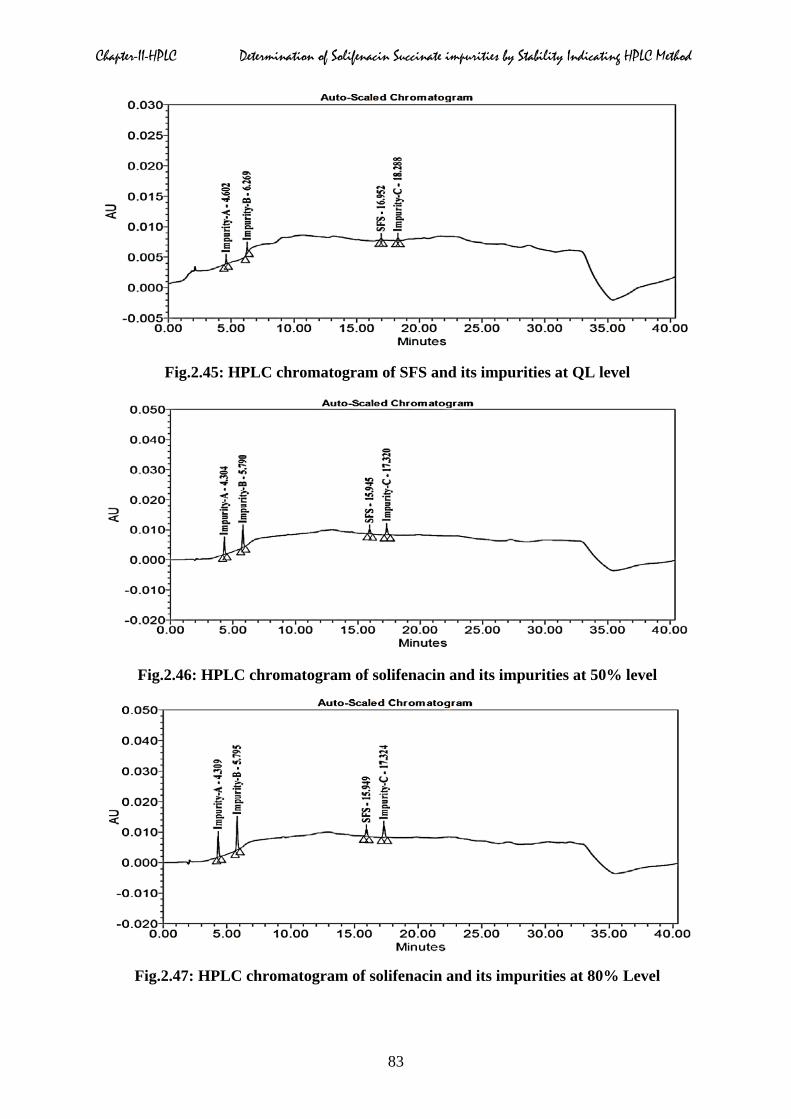
Fig.2.44: Typical HPLC chromatogram of QL solution
Based on the S/N ratio obtained from DL solution prepared the QL solution and calculated
the S/N ratio. The detection and quantitation limits values based on signal to noise ratio
values of solifenacin, impurity-A, B and C was shown in Table.2.8. The % RSD calculated
for area of each impurity and solifenacin. The precision data of these three impurities and
solifenacin at quantitation level was shown in Table.2.9.
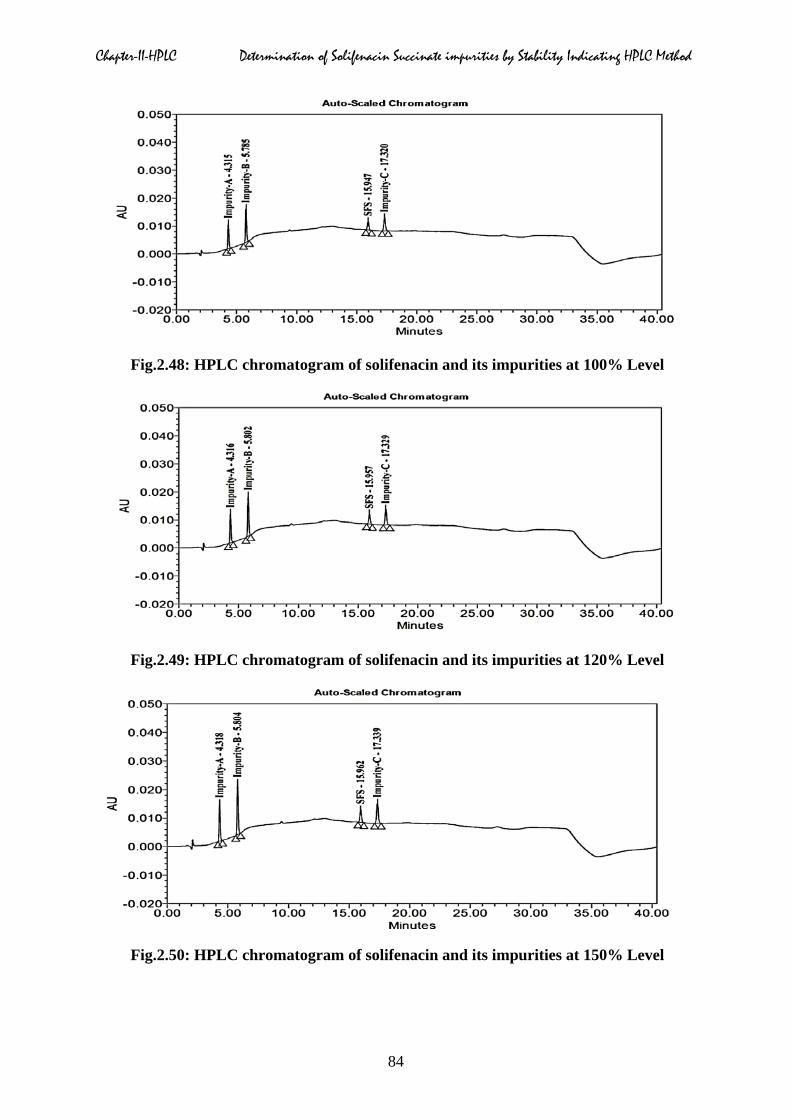
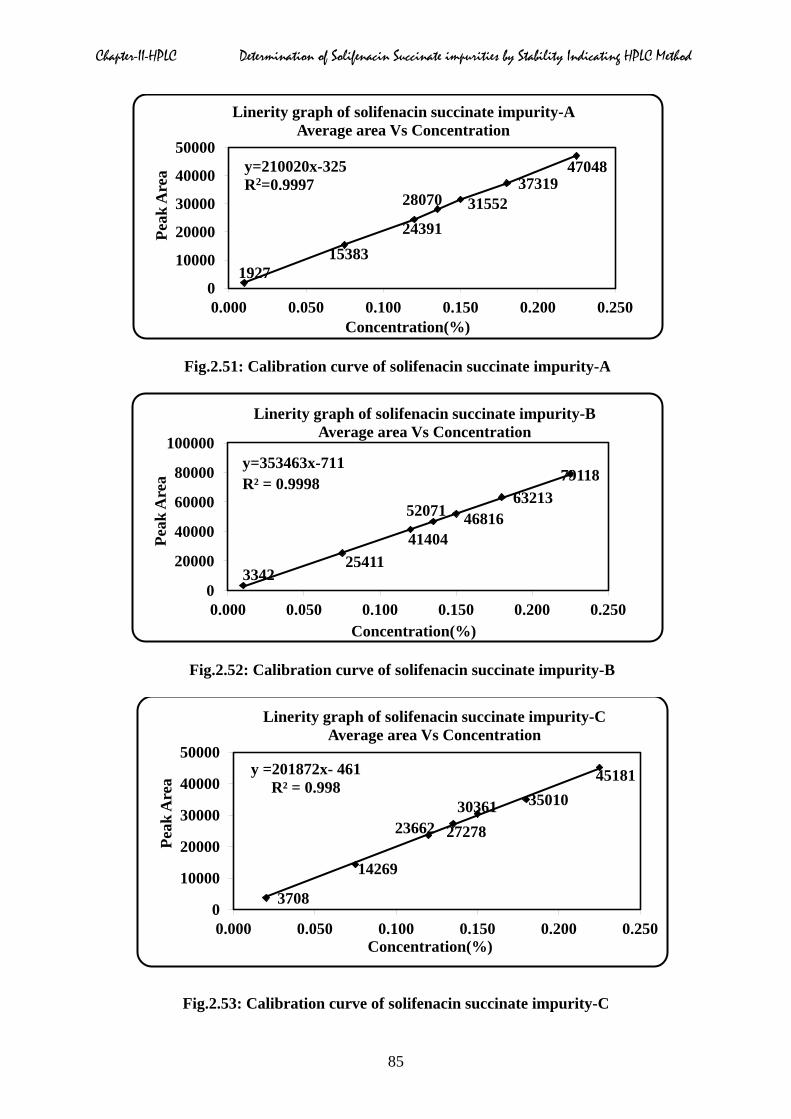
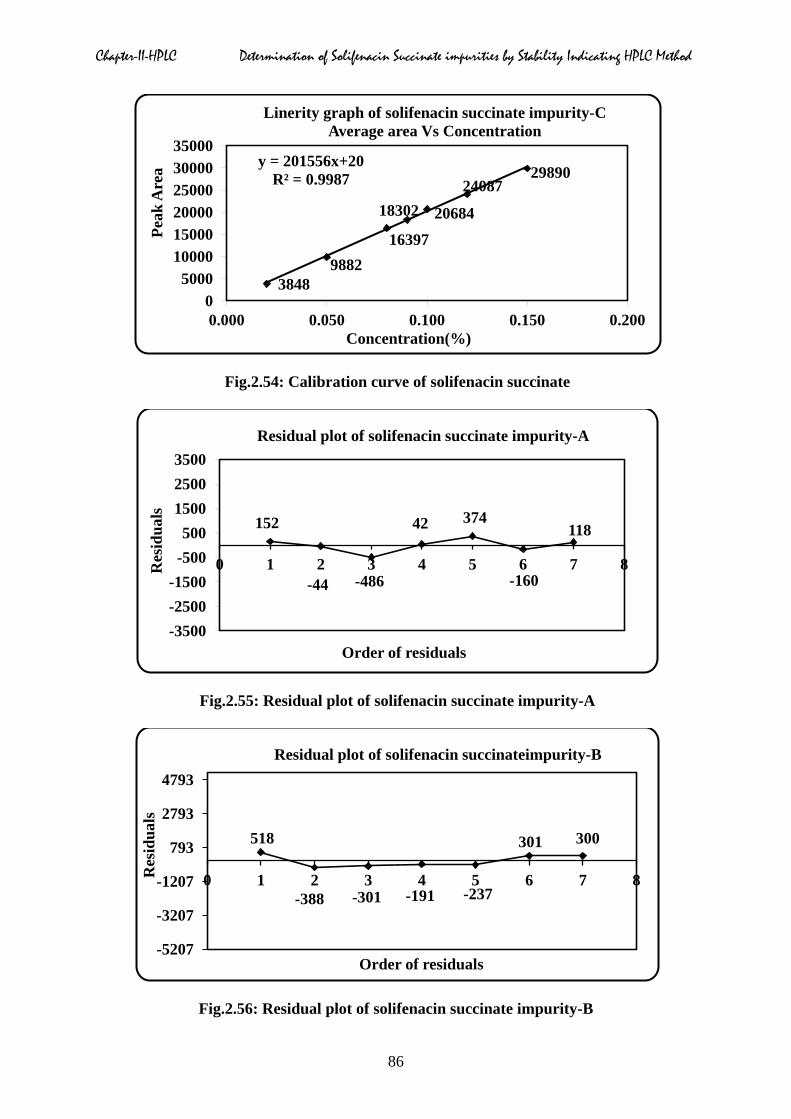
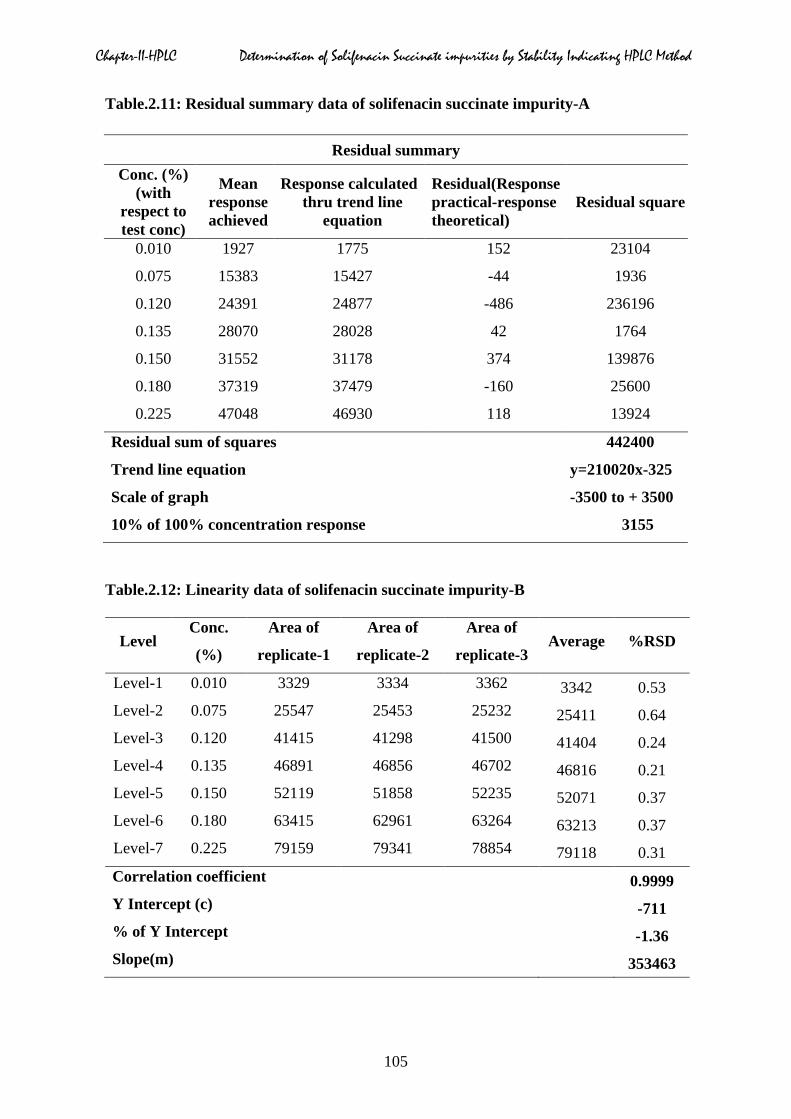
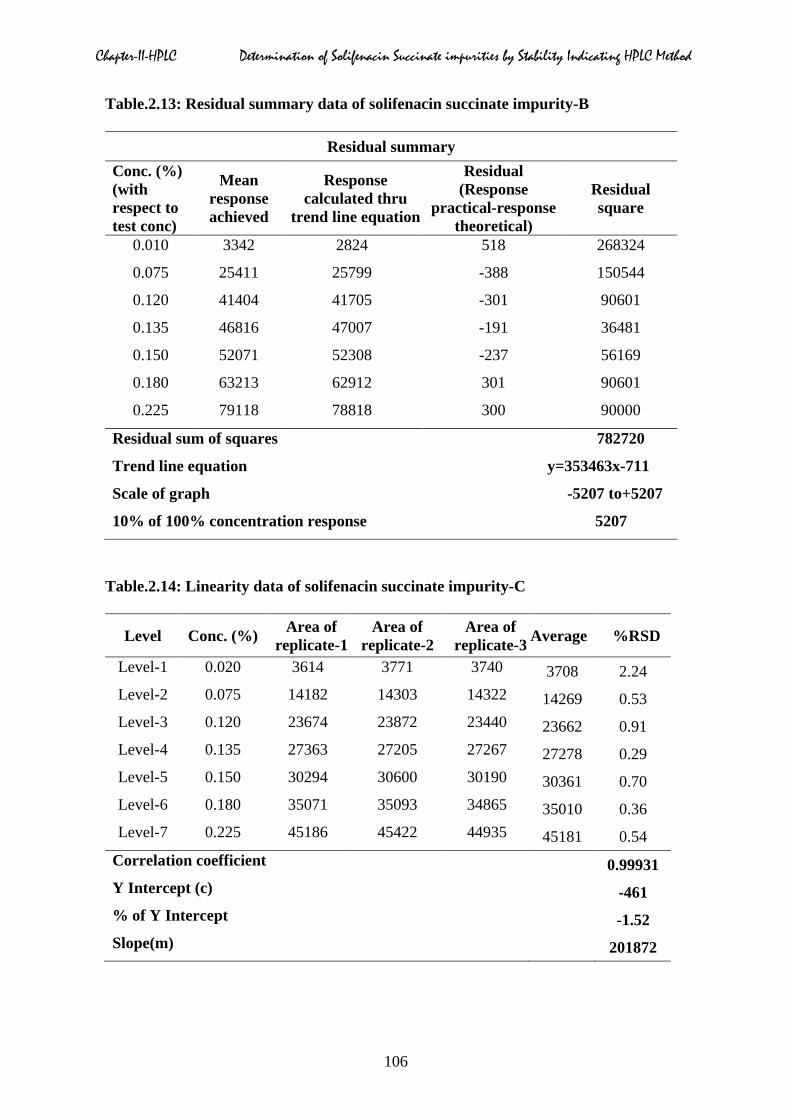
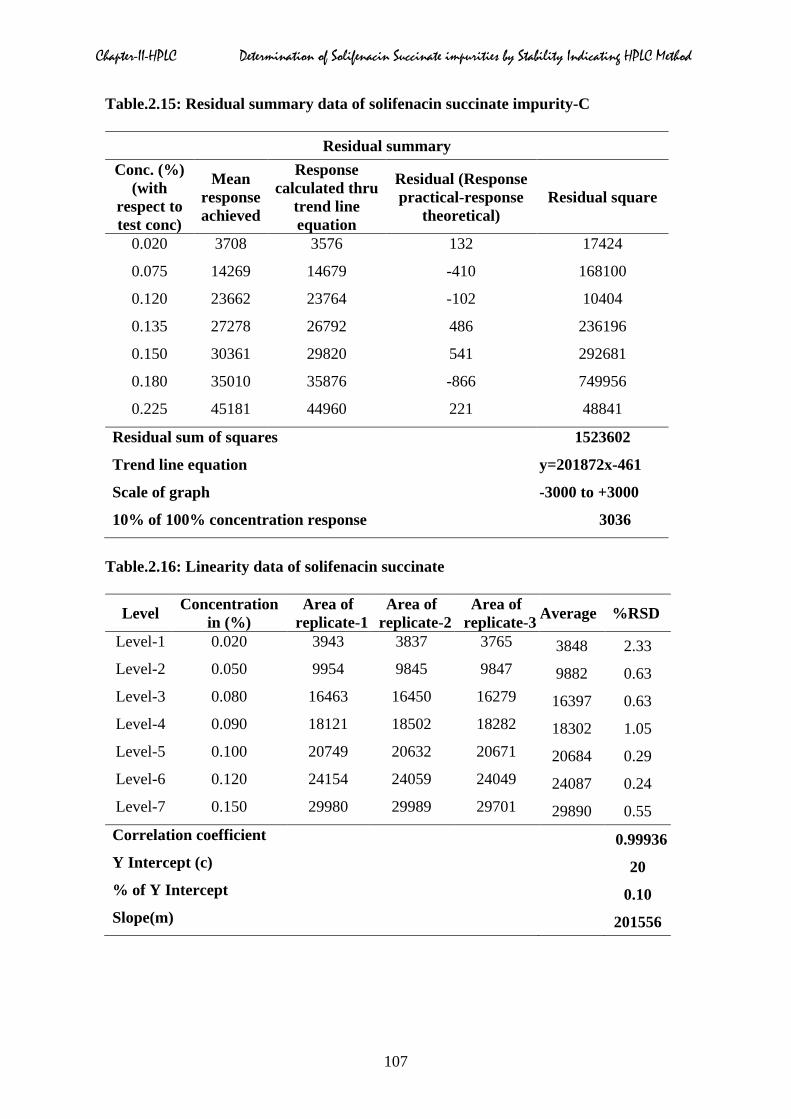
2.5.3 Linearity
Preparation of linearity stock solutions:
Linearity of solifenacin, impurity-A, impurity-B and impurity-C solutions were prepared by
taking different aliquots ranging from 0.25, 0.40, 0.45, 0.50, 0.60, 0.75 ml of impurity stock
and reference solutions into separate 20 ml volumetric and made up to the volume with
diluent and mixed homogeneously by kept on cyclo mixer for five minutes The above
mentioned at seven concentrations levels from QL to 150% of the specification level (i.e 0.15
%) were injected into the chromatographic column and the area of each peak was calculated,
and a calibration curve was drawn by plotting area impurities against the concentration
expressed in percentage. From the calibration curve correlation coefficient, slope, y-intercept
and residual sum was calculated and shown in Table.2.10 to 2.17, which confirmed good
linearity between peak areas and concentration. Typical different concentrations of HPLC
linearity chromatograms of three impurities at different concentrations were displayed in
Fig.2.45 to 2.50 respectively. The linearity curves (Fig.2.51 to 2.54) and residual graph for
impurities A, B, C and solifenacin were shown in Fig.2.55 to 2.58 respectively.
82
Chapter-II-HPLC Determination of Solifenacin Succinate impurities by Stability Indicating HPLC Method
Fig.2.45: HPLC chromatogram of SFS and its impurities at QL level
Fig.2.46: HPLC chromatogram of solifenacin and its impurities at 50% level
Fig.2.47: HPLC chromatogram of solifenacin and its impurities at 80% Level
83
Chapter-II-HPLC Determination of Solifenacin Succinate impurities by Stability Indicating HPLC Method
Fig.2.48: HPLC chromatogram of solifenacin and its impurities at 100% Level
Fig.2.49: HPLC chromatogram of solifenacin and its impurities at 120% Level
Fig.2.50: HPLC chromatogram of solifenacin and its impurities at 150% Level
84
Chapter-II-HPLC Determination of Solifenacin Succinate impurities by Stability Indicating HPLC Method
Fig.2.51: Calibration curve of solifenacin succinate impurity-A
Fig.2.52: Calibration curve of solifenacin succinate impurity-B
Fig.2.53: Calibration curve of solifenacin succinate impurity-C
1927 15383
24391
28070 31552 37319
47048
0
10000
20000
30000
40000
50000
0.000 0.050 0.100 0.150 0.200 0.250
Peak
Are
a
Concentration(%)
Linerity graph of solifenacin succinate impurity-A Average area Vs Concentration
y=210020x-325 R2=0.9997
3342 25411
41404 46816 52071
63213 79118
0
20000
40000
60000
80000
100000
0.000 0.050 0.100 0.150 0.200 0.250
Peak
Are
a
Concentration(%)
Linerity graph of solifenacin succinate impurity-B Average area Vs Concentration
3708
14269
23662 27278 30361 35010
45181 y =201872x- 461 R² = 0.998
0
10000
20000
30000
40000
50000
0.000 0.050 0.100 0.150 0.200 0.250
Peak
Are
a
Concentration(%)
Linerity graph of solifenacin succinate impurity-C Average area Vs Concentration
y=353463x-711 R² = 0.9998
85
Chapter-II-HPLC Determination of Solifenacin Succinate impurities by Stability Indicating HPLC Method
Fig.2.54: Calibration curve of solifenacin succinate
Fig.2.55: Residual plot of solifenacin succinate impurity-A
Fig.2.56: Residual plot of solifenacin succinate impurity-B
3848 9882
16397
18302 20684
24087 29890
y = 201556x+20 R² = 0.9987
0 5000
10000 15000 20000 25000 30000 35000
0.000 0.050 0.100 0.150 0.200
Peak
Are
a
Concentration(%)
Linerity graph of solifenacin succinate impurity-C Average area Vs Concentration
152
-44 -486
42 374
-160
118
-3500 -2500 -1500 -500 500
1500 2500 3500
0 1 2 3 4 5 6 7 8 Res
idua
ls
Order of residuals
Residual plot of solifenacin succinate impurity-A
518
-388 -301 -191 -237
301 300
-5207
-3207
-1207
793
2793
4793
0 1 2 3 4 5 6 7 8 Res
idua
ls
Order of residuals
Residual plot of solifenacin succinateimpurity-B
86
Chapter-II-HPLC Determination of Solifenacin Succinate impurities by Stability Indicating HPLC Method
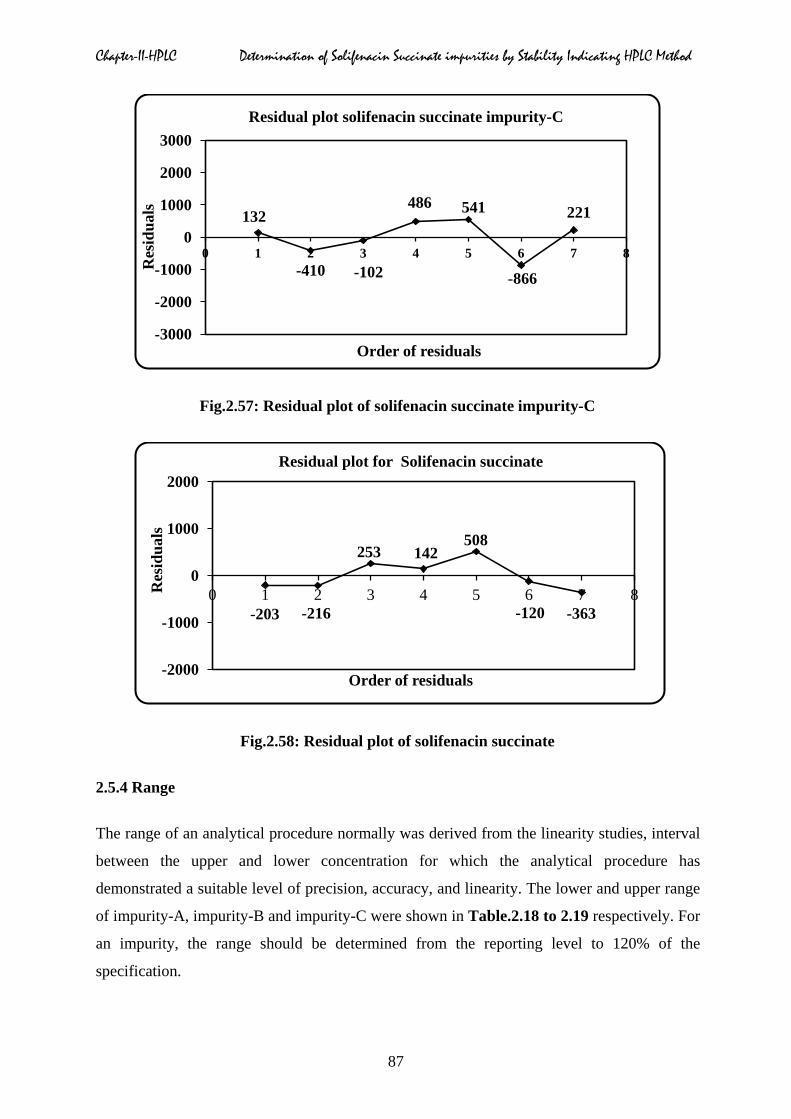
Fig.2.57: Residual plot of solifenacin succinate impurity-C
Fig.2.58: Residual plot of solifenacin succinate
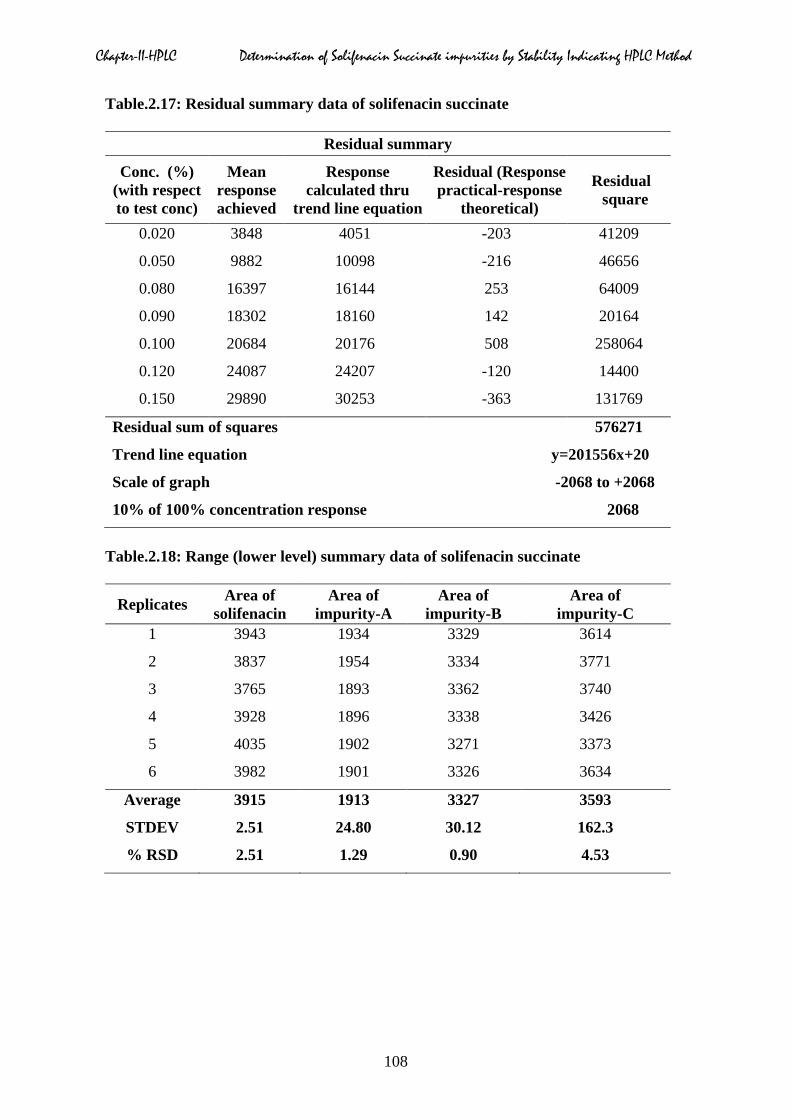
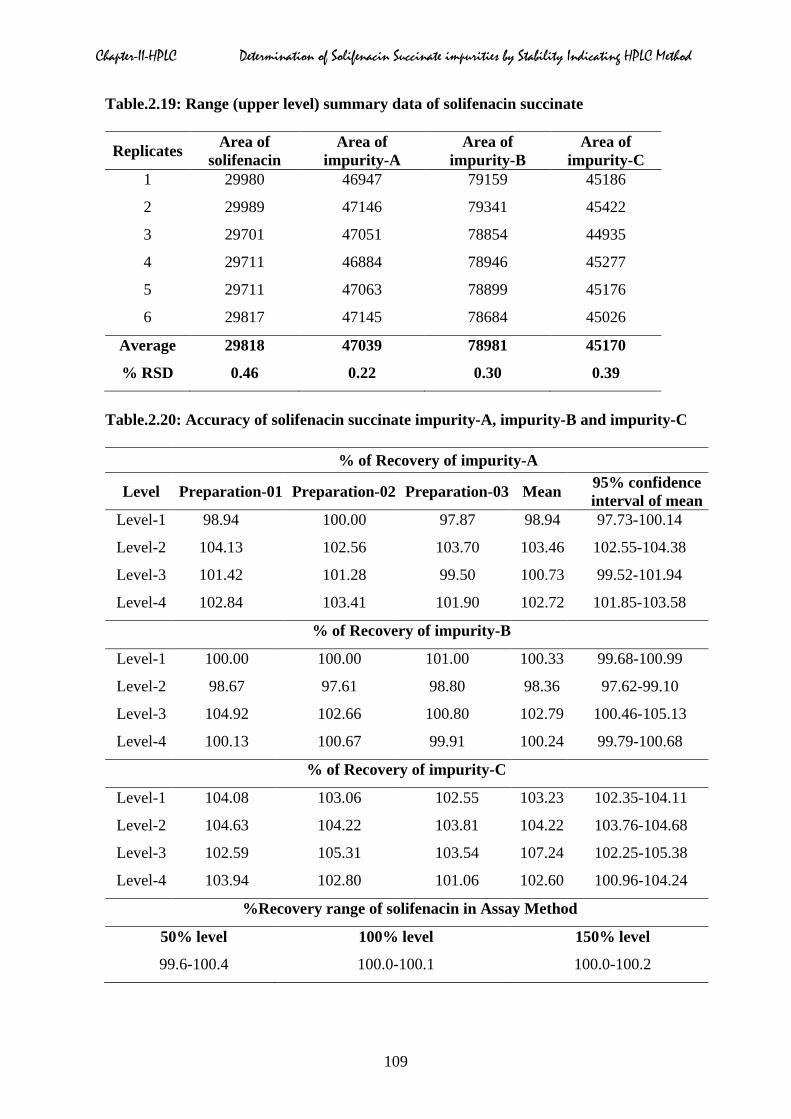
2.5.4 Range
The range of an analytical procedure normally was derived from the linearity studies, interval
between the upper and lower concentration for which the analytical procedure has
demonstrated a suitable level of precision, accuracy, and linearity. The lower and upper range
of impurity-A, impurity-B and impurity-C were shown in Table.2.18 to 2.19 respectively. For
an impurity, the range should be determined from the reporting level to 120% of the
specification.
132
-410 -102
486 541
-866
221
-3000
-2000
-1000
0
1000
2000
3000
0 1 2 3 4 5 6 7 8
Res
idua
ls
Order of residuals
Residual plot solifenacin succinate impurity-C
-203 -216
253 142 508
-120 -363
-2000
-1000
0
1000
2000
0 1 2 3 4 5 6 7 8 Res
idua
ls
Order of residuals
Residual plot for Solifenacin succinate
87
Chapter-II-HPLC Determination of Solifenacin Succinate impurities by Stability Indicating HPLC Method
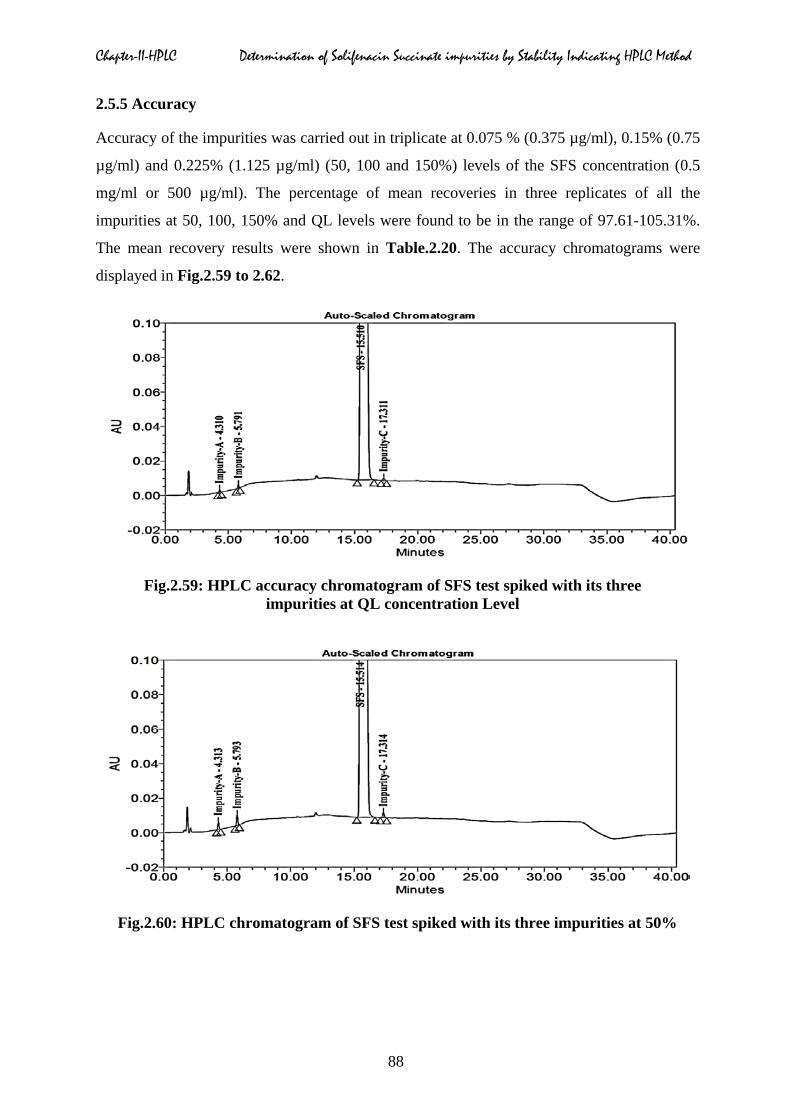
2.5.5 Accuracy
Accuracy of the impurities was carried out in triplicate at 0.075 % (0.375 µg/ml), 0.15% (0.75
µg/ml) and 0.225% (1.125 µg/ml) (50, 100 and 150%) levels of the SFS concentration (0.5
mg/ml or 500 µg/ml). The percentage of mean recoveries in three replicates of all the
impurities at 50, 100, 150% and QL levels were found to be in the range of 97.61-105.31%.
The mean recovery results were shown in Table.2.20. The accuracy chromatograms were
displayed in Fig.2.59 to 2.62.
Fig.2.59: HPLC accuracy chromatogram of SFS test spiked with its three impurities at QL concentration Level
Fig.2.60: HPLC chromatogram of SFS test spiked with its three impurities at 50%
88
Chapter-II-HPLC Determination of Solifenacin Succinate impurities by Stability Indicating HPLC Method
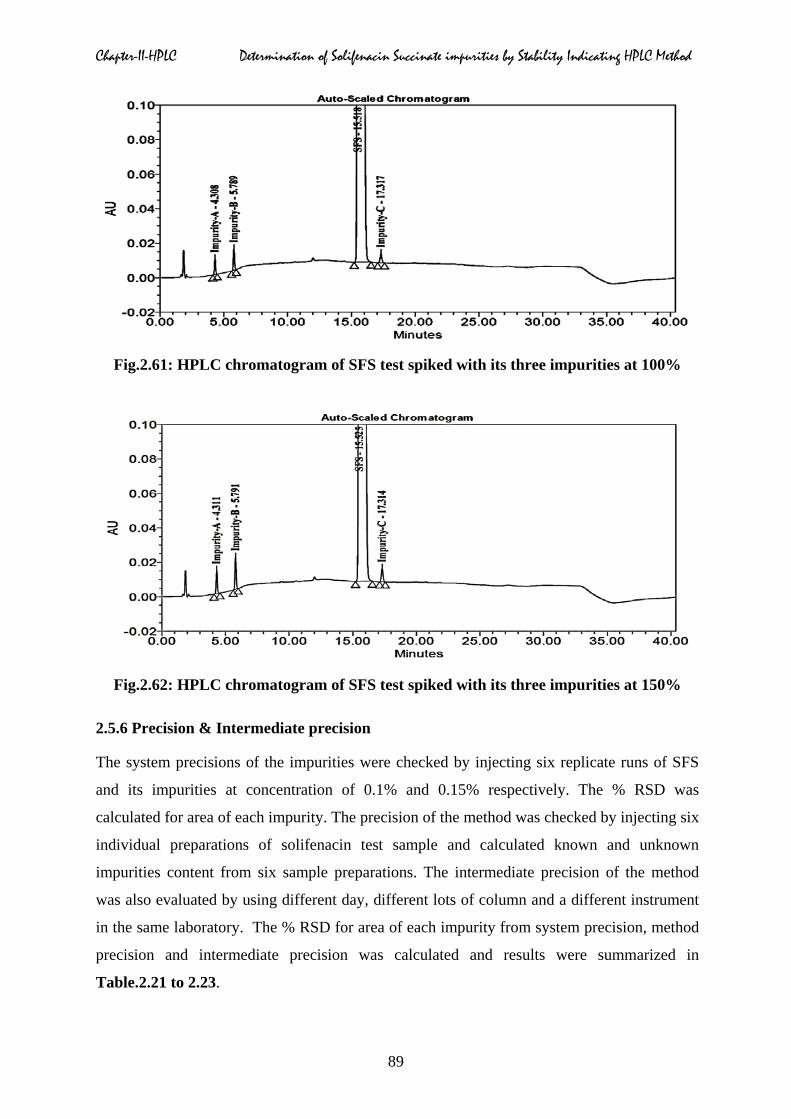
Fig.2.61: HPLC chromatogram of SFS test spiked with its three impurities at 100%
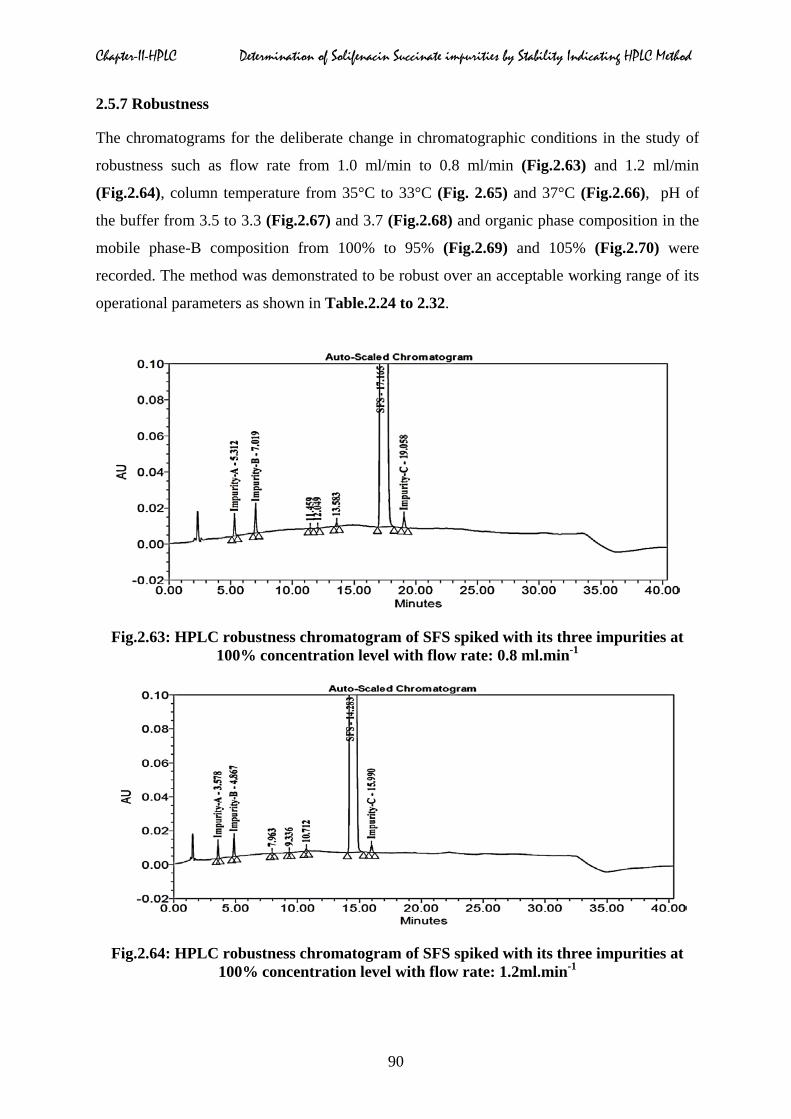
Fig.2.62: HPLC chromatogram of SFS test spiked with its three impurities at 150%
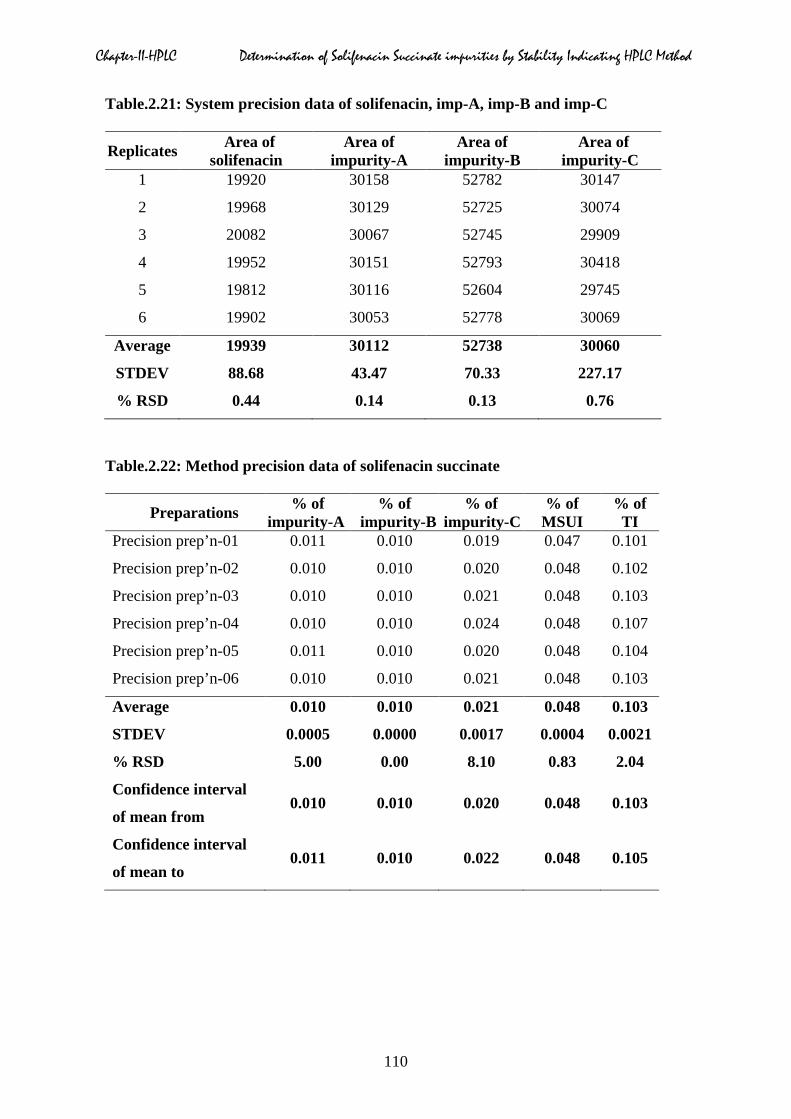
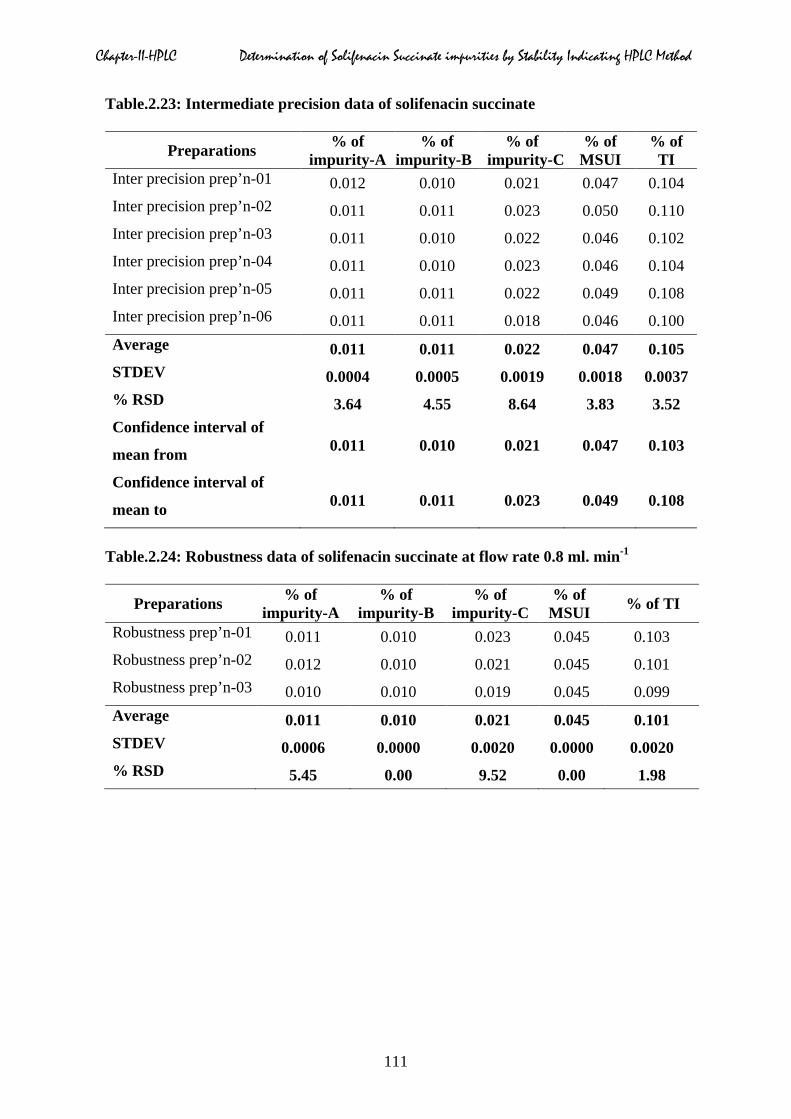
2.5.6 Precision & Intermediate precision
The system precisions of the impurities were checked by injecting six replicate runs of SFS
and its impurities at concentration of 0.1% and 0.15% respectively. The % RSD was
calculated for area of each impurity. The precision of the method was checked by injecting six
individual preparations of solifenacin test sample and calculated known and unknown
impurities content from six sample preparations. The intermediate precision of the method
was also evaluated by using different day, different lots of column and a different instrument
in the same laboratory. The % RSD for area of each impurity from system precision, method
precision and intermediate precision was calculated and results were summarized in
Table.2.21 to 2.23.
89
Chapter-II-HPLC Determination of Solifenacin Succinate impurities by Stability Indicating HPLC Method
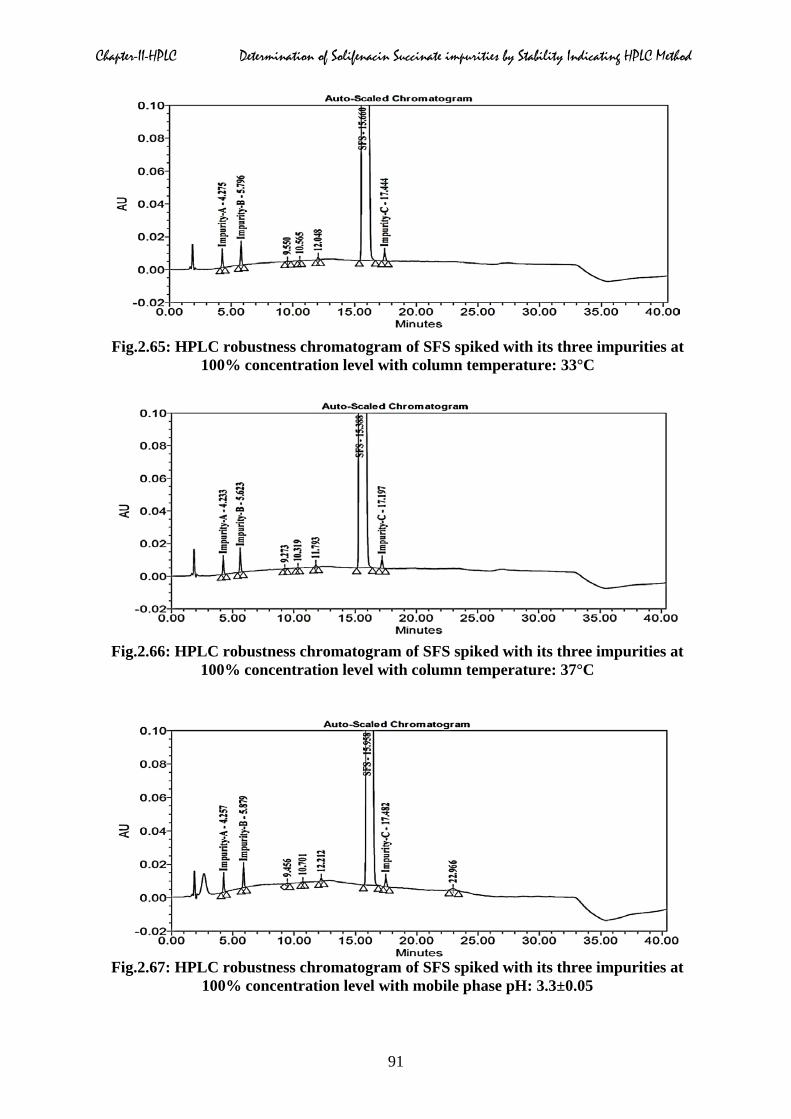
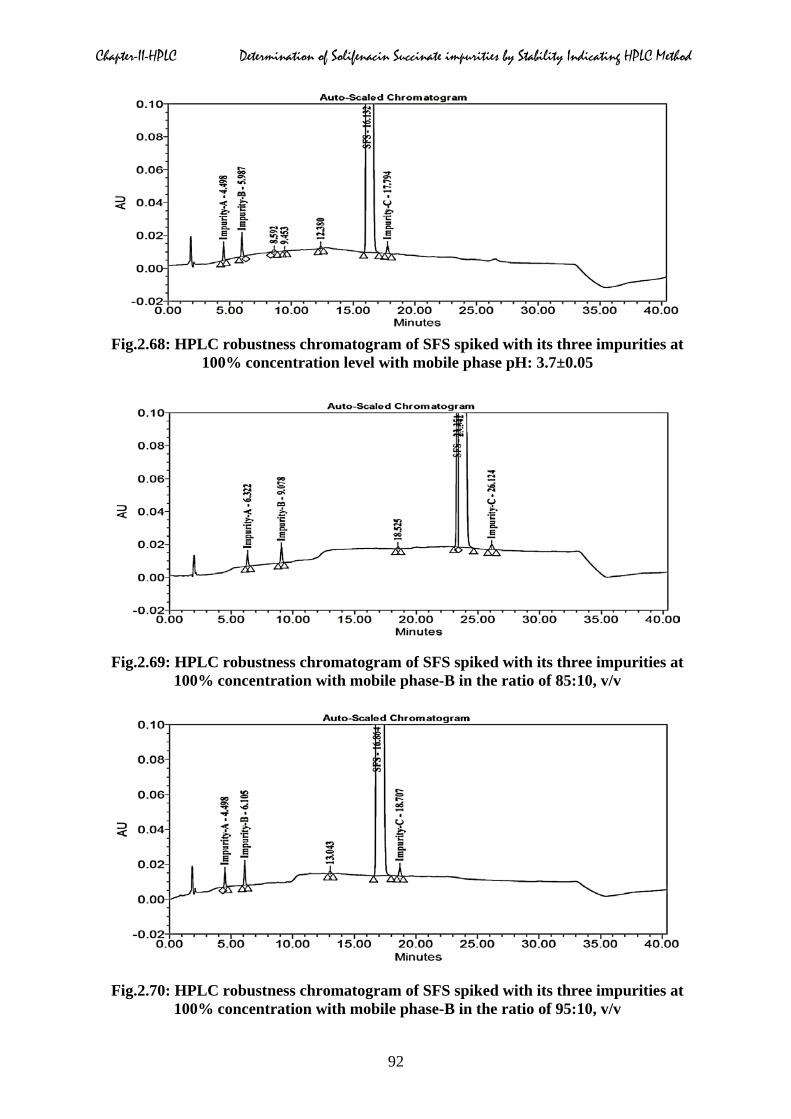
2.5.7 Robustness
The chromatograms for the deliberate change in chromatographic conditions in the study of
robustness such as flow rate from 1.0 ml/min to 0.8 ml/min (Fig.2.63) and 1.2 ml/min
(Fig.2.64), column temperature from 35°C to 33°C (Fig. 2.65) and 37°C (Fig.2.66), pH of
the buffer from 3.5 to 3.3 (Fig.2.67) and 3.7 (Fig.2.68) and organic phase composition in the
mobile phase-B composition from 100% to 95% (Fig.2.69) and 105% (Fig.2.70) were
recorded. The method was demonstrated to be robust over an acceptable working range of its
operational parameters as shown in Table.2.24 to 2.32.
Fig.2.63: HPLC robustness chromatogram of SFS spiked with its three impurities at 100% concentration level with flow rate: 0.8 ml.min-1
Fig.2.64: HPLC robustness chromatogram of SFS spiked with its three impurities at 100% concentration level with flow rate: 1.2ml.min-1
90
Chapter-II-HPLC Determination of Solifenacin Succinate impurities by Stability Indicating HPLC Method
Fig.2.65: HPLC robustness chromatogram of SFS spiked with its three impurities at
100% concentration level with column temperature: 33°C
Fig.2.66: HPLC robustness chromatogram of SFS spiked with its three impurities at
100% concentration level with column temperature: 37°C
Fig.2.67: HPLC robustness chromatogram of SFS spiked with its three impurities at 100% concentration level with mobile phase pH: 3.3±0.05
91
Chapter-II-HPLC Determination of Solifenacin Succinate impurities by Stability Indicating HPLC Method
Fig.2.68: HPLC robustness chromatogram of SFS spiked with its three impurities at
100% concentration level with mobile phase pH: 3.7±0.05
Fig.2.69: HPLC robustness chromatogram of SFS spiked with its three impurities at 100% concentration with mobile phase-B in the ratio of 85:10, v/v
Fig.2.70: HPLC robustness chromatogram of SFS spiked with its three impurities at 100% concentration with mobile phase-B in the ratio of 95:10, v/v
92
Chapter-II-HPLC Determination of Solifenacin Succinate impurities by Stability Indicating HPLC Method
2.5.8 Solution stability and mobile phase stability
The solution stability of SFS and its three impurities was carried out by leaving spiked sample
solutions in tightly capped volumetric flasks at room temperature for 48 hrs. Content of each
impurity was estimated for every 12 hrs interval up to 48 hrs. The mobile phase stability was
also carried by analyzing freshly prepared sample solutions in stored mobile phase at bench
top for six days and observed the results with precision study. No significant changes were
observed in the content of impurities of SFS i.e. impurity-A, impurity-B and impurity-C
during the solution stability and mobile phase stability experiments. The mobile phase and
solution stability results were presented in Table.2.33 & 2.34 respectively.
2.5.9 Relative response factor (RRF)
The relative response factor for each impurity was established by injecting known
concentrations i.e 0.75 µg/ml (0.15%) of impurity-A, impurity-B and impurity-C and
solifenacin. The RRF for the above said impurities were calculated by comparing area of
solifenacin. The RRF values for all the impurities found to be between 1.08 and 1.74. The
chromatographic data, including retention times, relative retention times and relative response
factors for the three impurities were tabulated in Table.2.35.
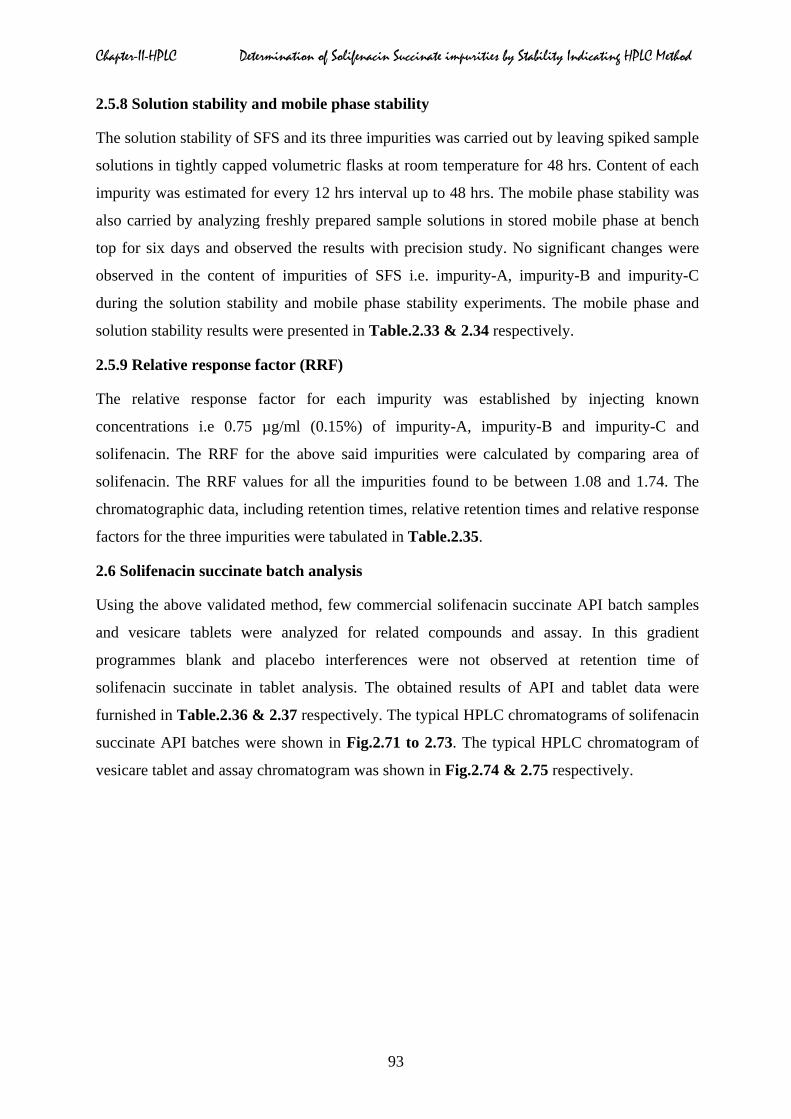
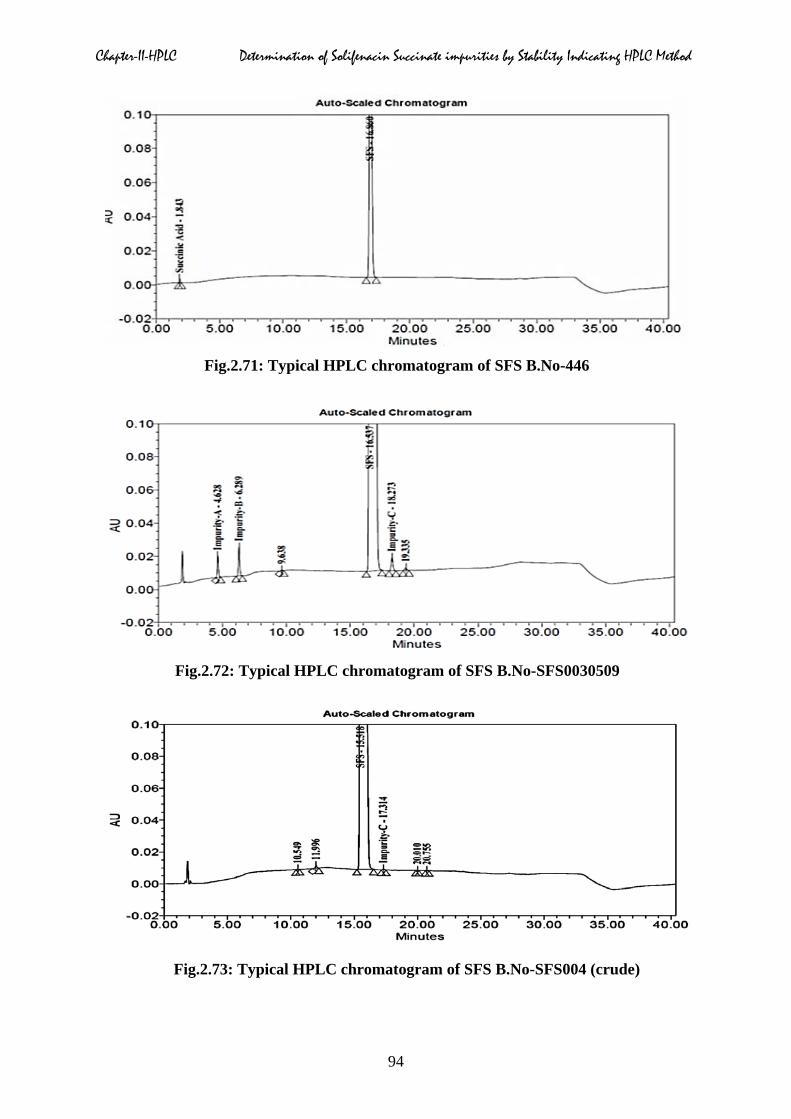
2.6 Solifenacin succinate batch analysis
Using the above validated method, few commercial solifenacin succinate API batch samples
and vesicare tablets were analyzed for related compounds and assay. In this gradient
programmes blank and placebo interferences were not observed at retention time of
solifenacin succinate in tablet analysis. The obtained results of API and tablet data were
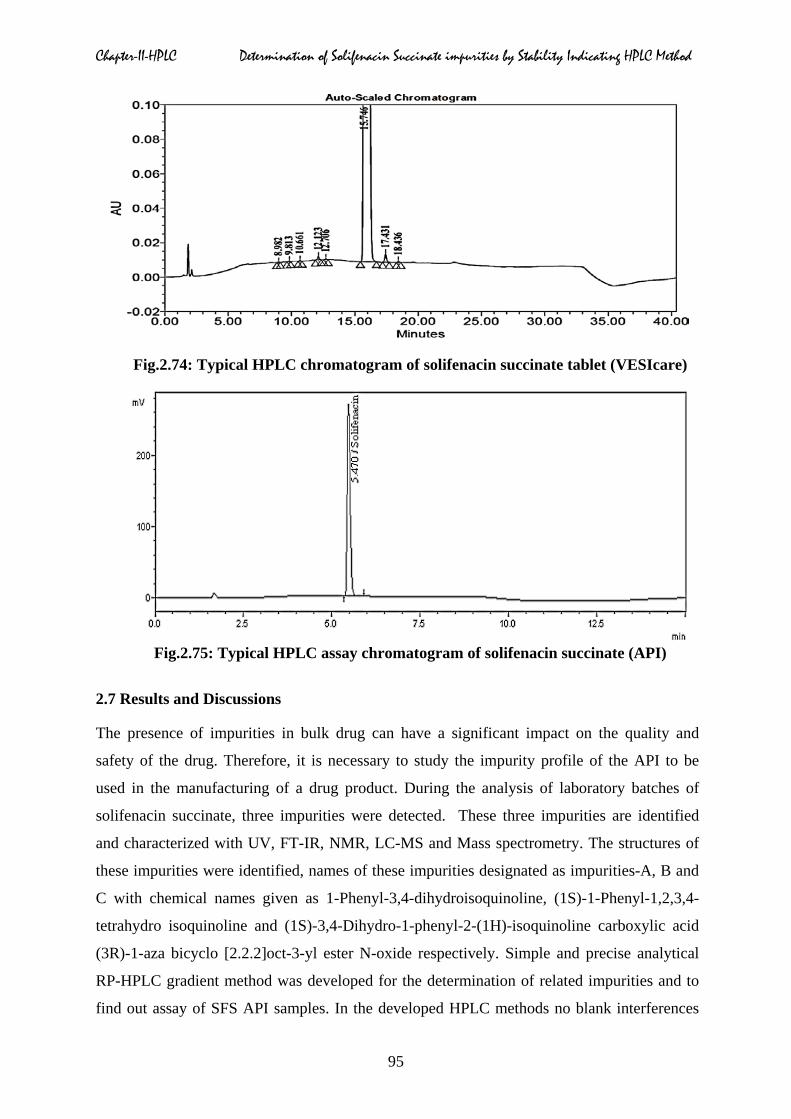
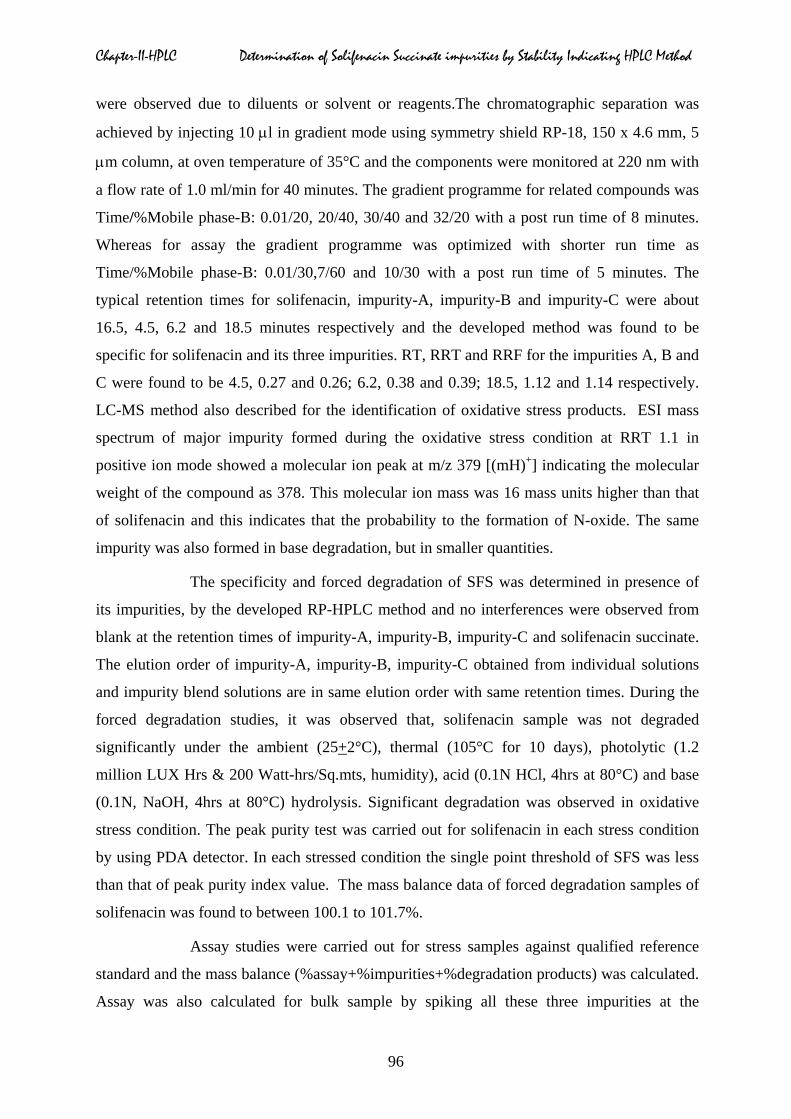
furnished in Table.2.36 & 2.37 respectively. The typical HPLC chromatograms of solifenacin
succinate API batches were shown in Fig.2.71 to 2.73. The typical HPLC chromatogram of
vesicare tablet and assay chromatogram was shown in Fig.2.74 & 2.75 respectively.
93
Chapter-II-HPLC Determination of Solifenacin Succinate impurities by Stability Indicating HPLC Method
Fig.2.71: Typical HPLC chromatogram of SFS B.No-446
Fig.2.72: Typical HPLC chromatogram of SFS B.No-SFS0030509
Fig.2.73: Typical HPLC chromatogram of SFS B.No-SFS004 (crude)
94
Chapter-II-HPLC Determination of Solifenacin Succinate impurities by Stability Indicating HPLC Method
Fig.2.74: Typical HPLC chromatogram of solifenacin succinate tablet (VESIcare)
Fig.2.75: Typical HPLC assay chromatogram of solifenacin succinate (API)
2.7 Results and Discussions
The presence of impurities in bulk drug can have a significant impact on the quality and
safety of the drug. Therefore, it is necessary to study the impurity profile of the API to be
used in the manufacturing of a drug product. During the analysis of laboratory batches of
solifenacin succinate, three impurities were detected. These three impurities are identified
and characterized with UV, FT-IR, NMR, LC-MS and Mass spectrometry. The structures of
these impurities were identified, names of these impurities designated as impurities-A, B and
C with chemical names given as 1-Phenyl-3,4-dihydroisoquinoline, (1S)-1-Phenyl-1,2,3,4-
tetrahydro isoquinoline and (1S)-3,4-Dihydro-1-phenyl-2-(1H)-isoquinoline carboxylic acid
(3R)-1-aza bicyclo [2.2.2]oct-3-yl ester N-oxide respectively. Simple and precise analytical
RP-HPLC gradient method was developed for the determination of related impurities and to
find out assay of SFS API samples. In the developed HPLC methods no blank interferences
95
Chapter-II-HPLC Determination of Solifenacin Succinate impurities by Stability Indicating HPLC Method
were observed due to diluents or solvent or reagents.The chromatographic separation was
achieved by injecting 10 µl in gradient mode using symmetry shield RP-18, 150 x 4.6 mm, 5
µm column, at oven temperature of 35°C and the components were monitored at 220 nm with
a flow rate of 1.0 ml/min for 40 minutes. The gradient programme for related compounds was
Time/%Mobile phase-B: 0.01/20, 20/40, 30/40 and 32/20 with a post run time of 8 minutes.
Whereas for assay the gradient programme was optimized with shorter run time as
Time/%Mobile phase-B: 0.01/30,7/60 and 10/30 with a post run time of 5 minutes. The
typical retention times for solifenacin, impurity-A, impurity-B and impurity-C were about
16.5, 4.5, 6.2 and 18.5 minutes respectively and the developed method was found to be
specific for solifenacin and its three impurities. RT, RRT and RRF for the impurities A, B and
C were found to be 4.5, 0.27 and 0.26; 6.2, 0.38 and 0.39; 18.5, 1.12 and 1.14 respectively.
LC-MS method also described for the identification of oxidative stress products. ESI mass
spectrum of major impurity formed during the oxidative stress condition at RRT 1.1 in
positive ion mode showed a molecular ion peak at m/z 379 [(mH)+] indicating the molecular
weight of the compound as 378. This molecular ion mass was 16 mass units higher than that
of solifenacin and this indicates that the probability to the formation of N-oxide. The same
impurity was also formed in base degradation, but in smaller quantities.
The specificity and forced degradation of SFS was determined in presence of
its impurities, by the developed RP-HPLC method and no interferences were observed from
blank at the retention times of impurity-A, impurity-B, impurity-C and solifenacin succinate.
The elution order of impurity-A, impurity-B, impurity-C obtained from individual solutions
and impurity blend solutions are in same elution order with same retention times. During the
forced degradation studies, it was observed that, solifenacin sample was not degraded
significantly under the ambient (25+2°C), thermal (105°C for 10 days), photolytic (1.2
million LUX Hrs & 200 Watt-hrs/Sq.mts, humidity), acid (0.1N HCl, 4hrs at 80°C) and base
(0.1N, NaOH, 4hrs at 80°C) hydrolysis. Significant degradation was observed in oxidative
stress condition. The peak purity test was carried out for solifenacin in each stress condition
by using PDA detector. In each stressed condition the single point threshold of SFS was less
than that of peak purity index value. The mass balance data of forced degradation samples of
solifenacin was found to between 100.1 to 101.7%.
Assay studies were carried out for stress samples against qualified reference
standard and the mass balance (%assay+%impurities+%degradation products) was calculated.
Assay was also calculated for bulk sample by spiking all these three impurities at the
96
Chapter-II-HPLC Determination of Solifenacin Succinate impurities by Stability Indicating HPLC Method
specification level (i.e. 0.15% of impurity-A, B and C with respect to analyte concentration,
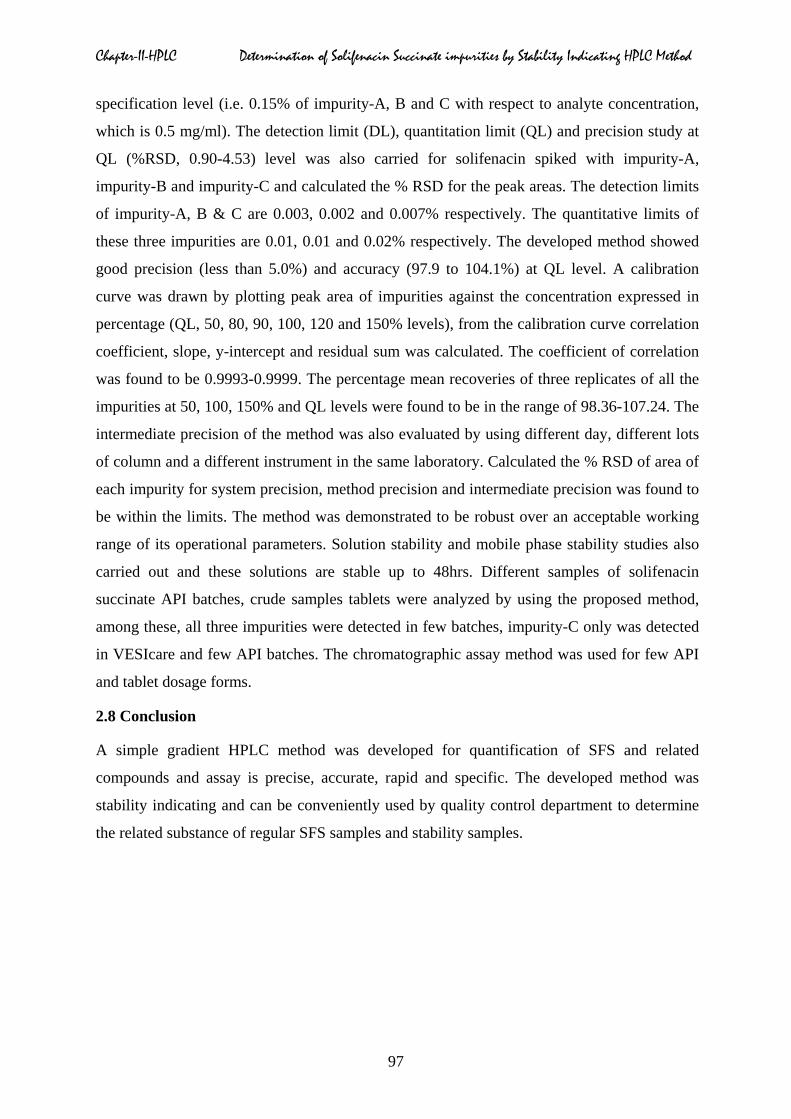
which is 0.5 mg/ml). The detection limit (DL), quantitation limit (QL) and precision study at
QL (%RSD, 0.90-4.53) level was also carried for solifenacin spiked with impurity-A,
impurity-B and impurity-C and calculated the % RSD for the peak areas. The detection limits
of impurity-A, B & C are 0.003, 0.002 and 0.007% respectively. The quantitative limits of
these three impurities are 0.01, 0.01 and 0.02% respectively. The developed method showed
good precision (less than 5.0%) and accuracy (97.9 to 104.1%) at QL level. A calibration
curve was drawn by plotting peak area of impurities against the concentration expressed in
percentage (QL, 50, 80, 90, 100, 120 and 150% levels), from the calibration curve correlation
coefficient, slope, y-intercept and residual sum was calculated. The coefficient of correlation
was found to be 0.9993-0.9999. The percentage mean recoveries of three replicates of all the
impurities at 50, 100, 150% and QL levels were found to be in the range of 98.36-107.24. The
intermediate precision of the method was also evaluated by using different day, different lots
of column and a different instrument in the same laboratory. Calculated the % RSD of area of
each impurity for system precision, method precision and intermediate precision was found to
be within the limits. The method was demonstrated to be robust over an acceptable working
range of its operational parameters. Solution stability and mobile phase stability studies also
carried out and these solutions are stable up to 48hrs. Different samples of solifenacin
succinate API batches, crude samples tablets were analyzed by using the proposed method,
among these, all three impurities were detected in few batches, impurity-C only was detected
in VESIcare and few API batches. The chromatographic assay method was used for few API
and tablet dosage forms.
2.8 Conclusion
A simple gradient HPLC method was developed for quantification of SFS and related
compounds and assay is precise, accurate, rapid and specific. The developed method was
stability indicating and can be conveniently used by quality control department to determine
the related substance of regular SFS samples and stability samples.
97
Chapter-II-HPLC Determination of Solifenacin Succinate impurities by Stability Indicating HPLC Method
Tables:
Table.2.1: UV, FT-IR & NMR structural data of solifenacin succinate impurity-A
UV-absorption data
Wavelength Absorbance Band
204.10nm 0.3485 E1 band of aromatic ring
247.36nm 0.1031 B band of aromatic ring
FT-IR Assignment data
Frequency(cm-1) Assignment
3060 & 3026 =C-H stretching of aromatic ring
2939 & 2839 C-H-stretching of CH2
1607&1566 C=N Stretching
1481 & 1445 C=C stretching in aromatic ring
1317 & 1306 C-H bendings in CH2
1229 C-N stretching
1158,1053 & 1020 In plane bending vibrations of C-H in aromatic ring
761, 744 & 699 Out of plane bending vibrations of C-H in aromatic ring 13C & 1H Assignment data
Proton No. Multiplicity Chemical shifts
(ppm) Carbon No Chemical shift
H-2´,6´(2H) m 7.58-7.61 C-1 166.65
H-3’,4’,5’8(4H) m 7.40-7.42 C-4a, 8a 138.26-138.47
H-5,6,7(3H) m 7.24-7.26 C-1’ 130.16
H-3(2H) m 3.81-3.86 C-4´ 128.78
H-4(2H) t 2.76-2.81 C-2´,6´,6 128.23-128.29
--- --- --- C-8 127.62
--- --- --- C-5 127.35
--- --- --- C-7 126.90
--- --- --- C-3 126.06
--- --- --- C-4 47.12
--- --- --- 25.79
98
Chapter-II-HPLC Determination of Solifenacin Succinate impurities by Stability Indicating HPLC Method
Table.2.2: UV, FT-IR & NMR structural data of solifenacin succinate impurity-B
UV Assignment data
Wavelength Absorbance Band
206.34nm 1.6782 E2 band of aromatic ring
261.50nm 0.0897 β band of aromatic ring
FT-IR Assignment data
Wave Number(cm-1) Assignment
3428 & 3326 NH stretching
3063 & 3043 =C-H stretching of aromatic ring
2966 & 2923 C-H-stretching of CH2
1492 & 1452 C=C stretching in aromatic ring
1366 C-H bendings in CH2
1292 C-N stretching
1125 & 945 In plane bending vibrations of C-H in aromatic ring
749, 737 & 706 Out of plane bending vibrations of C-H in aromatic
ring 13C & 1H Assignment data
Proton No. Multiplicity Chemical shifts
(ppm) Carbon No Chemical shift
H-2´,3´,4´,5´,6´ (5H) m 7.25-7.36 C-8a 144.81
H-6,8(2H) m 7.15-7.16 C-1´ 138.21
H-7(1H) m 7.02-7.07 C-4a 135.35
H-5(1H) d 6.746.77 C-3´5´,5 128.88-128.93
H-1(1H) s 5.11 C-2´,6´ 128.30
H-3e(1H) m 3.24-3.32 C-8 128.00
H-3a,4e(2H) m 3.02-3.15 C-4´ 127.26
H-4a(1H) m 2.80-2.89 C-7 126.14
C-6 125.53
C-1 62.02
C-3 42.20
C-4 29.71
99
Chapter-II-HPLC Determination of Solifenacin Succinate impurities by Stability Indicating HPLC Method
Table.2.3: UV, FT-IR & NMR structural data of solifenacin succinate impurity-C
UV Assignment data
Wavelength Absorbance Band
212.02nm 2.2016 K band of aromatic ring
FT-IR Assignment data
Wave Number(cm-1) Assignment
3060 & 3025 C-H stretching in aromatic ring
2949 C-H stretching in CH2
1684 C=O stretching
1427 C=C stretching in aromatic ring
1348 & 1319 CH2 bending
1228 & 1202 C-N stretching
1121 & 1095 C-O stretching
1031,998 7 933 In plane bending vibrations of C-H in aromatic ring
887, 750 & 697 Out of plane bending vibrations of C-H in aromatic ring 13C & 1H Assignment Data
Proton No. Multiplicity Chemical
shifts(ppm)
Carbon No Chemical shift
H-10,11,12,13,14 (5H) m 7.18-7.20 C-15 153.79 H-5,8(2H) m 6.65 C-8a 141.86 H-6,7(2H) m 6.14-6.38 C-4a,9 134.23-134.55 H-1(1H) s 5.11 C11,13 128.46 H-2’e,3’(2H) m 3.83-3.91 C-10,14 127.94 H-3,2’a, 8’,6’e(6H) m 3.37-3.46 C-5,8 127.18 H-4,6’a(3H) m 2.76-2.97 C-6,7 126.84 H-4’,5’e(2H) m 2.15-2.24 C-12 125.92 H-5’a,7’(3H) m 1.94-2.02 C-2’ 70.08 C-3’ 68.86 C-6’ 61.75 C-8’ 60.84 C-1 57.39-58.23 C-3 45.69-46.67 C-4’ 38.15-38.73 C-4 24.17 C-5’ 22.46 C-7’ 22.38
100
Chapter-II-HPLC Determination of Solifenacin Succinate impurities by Stability Indicating HPLC Method
Table.2.4: Summary of HPLC method development trials of solifenacin succinate
S.No. Mobile phase/Stationary phase Resolution/Critical area
1
Shimpack XRODS-II column and the mobile
phase-A contained 10 mM KH2PO4, pH of the
buffer was adjusted to 7.0 with TEA.
Acetonitrile was used as mobile phase B,
employing a binary-gradient program.
There was no separation between
impurity-A&B and solifenacin and
impurity-C (Fig.2.25).
2
The mobile phase contained buffer 10 mM
KH2PO4 with 0.1% v/v Triethylamine
(pH.3.0) and acetonitrile (60:40, v/v). Analysis
performed on a hypersil C8 (250 mm×4.6 mm
i.d., 5μm)
There was no separation between
impurity-A & B (Fig.2.26).
3
The mobile phase contained 10 mM
ammonium formate, adjusted pH to 3.0 with
formic acid-acetonitrile-methanol in the ratio
of 52.5:37.5:10, (v/v/v).
There was no separation between
impurity-A & B and negative peak
observed at impurity-A (Fig.2.27)
4
Mobile phase-A:0.01M KH2PO4, adjusted pH-
3.5 with H3PO4, mobile phase-B: acetonitrile
and water in the ratio of 90:10, (v/v), Gradient
Programme:time:%B:0.01/10, 15/60,
25/80,30/40, 40/40
Solifenacin succinate and N-Oxide
(impurity-C) eluted closely.
Corresponding chromatogram is
shown in Fig.2.28.
5 Mobile Phase-A:0.01M KH2PO4, adjusted
pH-3.5 with H3PO4, Mobile Phase-B: ACN
and Water in the ratio of 90:10, (v/v) Gradient
Programme :time: %B: 0.01/10, 10/50, 25/60,
40/80, 45/40, 50/40
Solifenacin succinate and N-Oxide
(impurity-C) eluted closely.
Corresponding chromatogram is
shown in Fig.2.29.
6 Mobile phase-A&B: Same as above and
slightly gradient program changed. Gradient
programme: time/%B: 0.01/20, 20/55, 35/80,
45/20, 50/20,
There was no separation between
solifenacin and impurity-C. The
corresponding chromatogram was
shown in Fig.2.30.
101
Chapter-II-HPLC Determination of Solifenacin Succinate impurities by Stability Indicating HPLC Method
Table.2.5: Forced degradation data (related compounds) of solifenacin succinate
Name of the sample
Stressed conditions and
period of exposure
% of imp-A
% of imp-B
% of imp-C
% of MSUI
% of TI
Mother sample (As such) ---- ND ND ND 0.04 0.04
Ambient sample Week days ND ND ND 0.04 0.04
Thermal sample Week days ND ND ND 0.04 0.04
Humidity sample
Week days ND ND ND 0.04 0.04
Photo light 1.2 million LUX Hrs
& 200Watt-hrs/Sq.mts
ND ND ND 0.04 0.04
Water hydrolysis
Heated at 80°C in H2O for 4hrs ND ND ND 0.04 0.04
Acid hydrolysis Heated at 80°C in 2M HCl for 4hrs ND 0.05 ND 0.05 0.10
Base hydrolysis Heated at 80°C in 2M NaOH for 4 hrs. ND 0.02 0.39 0.15 0.79
Oxidation Heated at 80°C in 10% H2O2 for 2hrs. 0.06 ND 8.15 0.42 10.07
Note: ND-Not Detected
102
Chapter-II-HPLC Determination of Solifenacin Succinate impurities by Stability Indicating HPLC Method
Table.2.6: Mass balance (HPLC, Assay) data of solifenacin succinate
Type of sample
Stressed conditions and period of
exposure
Assay % w/w
%Total
impurities
Mass balance
Observations
Mother sample (as such) - 100.0 0.12 100.1 -
Ambient 25°C+ 2°C, 10 days 100.2 0.11 100.3 No significant Degradation
Thermal Heated at 105°C for 10 days 100.0 0.12 100.1 No significant
Degradation
Humidity 90%RH, 10 days 100.0 0.12 100.1 No significant Degradation
Photo light (Photolysis)
1.2million LUX Hrs &
200Watt.Hrs/Sq.mts 100.3 0.11 100.4 No significant
Degradation
Water hydrolysis
Heated at 80°C in H2O for 4 hrs 100.8 0.06 100.9 No significant
Degradation
Acid hydrolysis Heated at 80°C in 0.1N HCl for 4 hrs 100.7 0.10 100.8 No significant
Degradation
Base hydrolysis Heated at 80°C in 0.1N NaOH for 4 hrs
100.9 0.79 101.7 Unknown impurities
are observed.
Oxidation Heated at 80°C in 10% H2O2 for 2 hrs 90.7 10.07 100.8
Impurity-A, C and Unknown impurities are
observed.
Table.2.7: System suitability data of solifenacin succinate
System suitability parameters for related compounds Acceptance criteria Resolution criteria USP resolution
Not Less than 2.0 Between impurity-A & impurity-B 8.53
Between solifenacin & impurity-C 3.62
System suitability parameters for assay compounds
Retention time of solifenacin succinate 6.0minutes Asymmetry 1.32 Not more than 2.0
Theoretical plates 18664 Not less than 5000
103
Chapter-II-HPLC Determination of Solifenacin Succinate impurities by Stability Indicating HPLC Method
Table.2.8: DL & QL S/N ratio data of solifenacin succinate
Component Concentration of DL solution (%)
S/N Ratio Concentration of QL solution (%) S/N Ratio
Impurity-A 0.0034 4.11 0.01 12.33 Impurity-B 0.0025 4.10 0.01 17.31 Impurity-C 0.0068 4.24 0.02 15.36
Solifenacin succinate 0.0064 3.72 0.02 11.10
Table.2.9: QL precision data of solifenacin succinate
Replicates Area of solifenacin Area of impurity-A
Area of impurity-B
Area of impurity-C
1 3943 1934 3329 3614 2 3837 1954 3334 3771 3 3765 1893 3362 3740 4 3928 1896 3338 3426 5 4035 1902 3271 3373 6 3982 1901 3326 3634
Average 3915 1913 3327 3593 % RSD 2.51 1.29 0.90 4.53
Table.2.10: Linearity data of solifenacin succinate impurity-A
Level Concentration in (%)
Area of replicate-1
Area of replicate-2
Area of replicate-3 Average %RSD
Level-1 0.010 1934 1954 1893 1927 1.61 Level-2 0.075 15475 15385 15290 15383 0.60 Level-3 0.120 24381 24421 24372 24391 0.11 Level-4 0.135 28010 28039 28161 28070 0.29 Level-5 0.150 31554 31550 31551 31552 0.01 Level-6 0.180 37173 37345 37440 37319 0.36 Level-7 0.225 46947 47146 47051 47048 0.21 Correlation coefficient 0.9998 Y-intercept (c) -325 %Y-intercept -1.03 Slope(m) 210020
104
Chapter-II-HPLC Determination of Solifenacin Succinate impurities by Stability Indicating HPLC Method
Table.2.11: Residual summary data of solifenacin succinate impurity-A
Table.2.12: Linearity data of solifenacin succinate impurity-B
Level Conc.
(%)
Area of
replicate-1
Area of
replicate-2
Area of
replicate-3 Average %RSD
Level-1 0.010 3329 3334 3362 3342 0.53 Level-2 0.075 25547 25453 25232 25411 0.64 Level-3 0.120 41415 41298 41500 41404 0.24 Level-4 0.135 46891 46856 46702 46816 0.21 Level-5 0.150 52119 51858 52235 52071 0.37 Level-6 0.180 63415 62961 63264 63213 0.37 Level-7 0.225 79159 79341 78854 79118 0.31 Correlation coefficient 0.9999 Y Intercept (c) -711 % of Y Intercept -1.36 Slope(m) 353463
Residual summary Conc. (%)
(with respect to test conc)
Mean response achieved
Response calculated thru trend line
equation
Residual(Response practical-response theoretical)
Residual square
0.010 1927 1775 152 23104
0.075 15383 15427 -44 1936
0.120 24391 24877 -486 236196
0.135 28070 28028 42 1764
0.150 31552 31178 374 139876
0.180 37319 37479 -160 25600
0.225 47048 46930 118 13924
Residual sum of squares 442400
Trend line equation y=210020x-325
Scale of graph -3500 to + 3500
10% of 100% concentration response 3155
105
Chapter-II-HPLC Determination of Solifenacin Succinate impurities by Stability Indicating HPLC Method
Table.2.13: Residual summary data of solifenacin succinate impurity-B
Residual summary Conc. (%) (with respect to test conc)
Mean response achieved
Response calculated thru
trend line equation
Residual (Response
practical-response theoretical)
Residual square
0.010 3342 2824 518 268324
0.075 25411 25799 -388 150544
0.120 41404 41705 -301 90601
0.135 46816 47007 -191 36481
0.150 52071 52308 -237 56169
0.180 63213 62912 301 90601
0.225 79118 78818 300 90000
Residual sum of squares 782720
Trend line equation y=353463x-711
Scale of graph -5207 to+5207
10% of 100% concentration response 5207
Table.2.14: Linearity data of solifenacin succinate impurity-C
Level Conc. (%) Area of replicate-1
Area of replicate-2
Area of replicate-3 Average %RSD
Level-1 0.020 3614 3771 3740 3708 2.24 Level-2 0.075 14182 14303 14322 14269 0.53 Level-3 0.120 23674 23872 23440 23662 0.91 Level-4 0.135 27363 27205 27267 27278 0.29 Level-5 0.150 30294 30600 30190 30361 0.70 Level-6 0.180 35071 35093 34865 35010 0.36 Level-7 0.225 45186 45422 44935 45181 0.54
Correlation coefficient 0.99931 Y Intercept (c) -461 % of Y Intercept -1.52 Slope(m) 201872
106
Chapter-II-HPLC Determination of Solifenacin Succinate impurities by Stability Indicating HPLC Method
Table.2.15: Residual summary data of solifenacin succinate impurity-C
Residual summary Conc. (%)
(with respect to test conc)
Mean response achieved
Response calculated thru
trend line equation
Residual (Response practical-response
theoretical) Residual square
0.020 3708 3576 132 17424
0.075 14269 14679 -410 168100
0.120 23662 23764 -102 10404
0.135 27278 26792 486 236196
0.150 30361 29820 541 292681
0.180 35010 35876 -866 749956
0.225 45181 44960 221 48841
Residual sum of squares 1523602
Trend line equation y=201872x-461
Scale of graph -3000 to +3000
10% of 100% concentration response 3036
Table.2.16: Linearity data of solifenacin succinate
Level Concentration in (%)
Area of replicate-1
Area of replicate-2
Area of replicate-3 Average %RSD
Level-1 0.020 3943 3837 3765 3848 2.33 Level-2 0.050 9954 9845 9847 9882 0.63 Level-3 0.080 16463 16450 16279 16397 0.63 Level-4 0.090 18121 18502 18282 18302 1.05 Level-5 0.100 20749 20632 20671 20684 0.29 Level-6 0.120 24154 24059 24049 24087 0.24 Level-7 0.150 29980 29989 29701 29890 0.55 Correlation coefficient 0.99936 Y Intercept (c) 20 % of Y Intercept 0.10 Slope(m) 201556
107
Chapter-II-HPLC Determination of Solifenacin Succinate impurities by Stability Indicating HPLC Method
Table.2.17: Residual summary data of solifenacin succinate
Residual summary
Conc. (%) (with respect to test conc)
Mean response achieved
Response calculated thru
trend line equation
Residual (Response practical-response
theoretical)
Residual square
0.020 3848 4051 -203 41209
0.050 9882 10098 -216 46656
0.080 16397 16144 253 64009
0.090 18302 18160 142 20164
0.100 20684 20176 508 258064
0.120 24087 24207 -120 14400
0.150 29890 30253 -363 131769
Residual sum of squares 576271
Trend line equation y=201556x+20
Scale of graph -2068 to +2068
10% of 100% concentration response 2068
Table.2.18: Range (lower level) summary data of solifenacin succinate
Replicates Area of solifenacin
Area of impurity-A
Area of impurity-B
Area of impurity-C
1 3943 1934 3329 3614
2 3837 1954 3334 3771
3 3765 1893 3362 3740
4 3928 1896 3338 3426
5 4035 1902 3271 3373
6 3982 1901 3326 3634
Average 3915 1913 3327 3593
STDEV 2.51 24.80 30.12 162.3
% RSD 2.51 1.29 0.90 4.53
108
Chapter-II-HPLC Determination of Solifenacin Succinate impurities by Stability Indicating HPLC Method
Table.2.19: Range (upper level) summary data of solifenacin succinate
Replicates Area of solifenacin
Area of impurity-A
Area of impurity-B
Area of impurity-C
1 29980 46947 79159 45186
2 29989 47146 79341 45422
3 29701 47051 78854 44935
4 29711 46884 78946 45277
5 29711 47063 78899 45176
6 29817 47145 78684 45026
Average 29818 47039 78981 45170
% RSD 0.46 0.22 0.30 0.39
Table.2.20: Accuracy of solifenacin succinate impurity-A, impurity-B and impurity-C
% of Recovery of impurity-A
Level Preparation-01 Preparation-02 Preparation-03 Mean 95% confidence interval of mean
Level-1 98.94 100.00 97.87 98.94 97.73-100.14
Level-2 104.13 102.56 103.70 103.46 102.55-104.38
Level-3 101.42 101.28 99.50 100.73 99.52-101.94
Level-4 102.84 103.41 101.90 102.72 101.85-103.58
% of Recovery of impurity-B
Level-1 100.00 100.00 101.00 100.33 99.68-100.99
Level-2 98.67 97.61 98.80 98.36 97.62-99.10
Level-3 104.92 102.66 100.80 102.79 100.46-105.13
Level-4 100.13 100.67 99.91 100.24 99.79-100.68
% of Recovery of impurity-C
Level-1 104.08 103.06 102.55 103.23 102.35-104.11
Level-2 104.63 104.22 103.81 104.22 103.76-104.68
Level-3 102.59 105.31 103.54 107.24 102.25-105.38
Level-4 103.94 102.80 101.06 102.60 100.96-104.24
%Recovery range of solifenacin in Assay Method
50% level 100% level 150% level
99.6-100.4 100.0-100.1 100.0-100.2
109
Chapter-II-HPLC Determination of Solifenacin Succinate impurities by Stability Indicating HPLC Method
Table.2.21: System precision data of solifenacin, imp-A, imp-B and imp-C
Replicates Area of solifenacin
Area of impurity-A
Area of impurity-B
Area of impurity-C
1 19920 30158 52782 30147
2 19968 30129 52725 30074
3 20082 30067 52745 29909
4 19952 30151 52793 30418
5 19812 30116 52604 29745
6 19902 30053 52778 30069
Average 19939 30112 52738 30060
STDEV 88.68 43.47 70.33 227.17
% RSD 0.44 0.14 0.13 0.76
Table.2.22: Method precision data of solifenacin succinate
Preparations % of impurity-A
% of impurity-B
% of impurity-C
% of MSUI
% of TI
Precision prep’n-01 0.011 0.010 0.019 0.047 0.101
Precision prep’n-02 0.010 0.010 0.020 0.048 0.102
Precision prep’n-03 0.010 0.010 0.021 0.048 0.103
Precision prep’n-04 0.010 0.010 0.024 0.048 0.107
Precision prep’n-05 0.011 0.010 0.020 0.048 0.104
Precision prep’n-06 0.010 0.010 0.021 0.048 0.103
Average 0.010 0.010 0.021 0.048 0.103
STDEV 0.0005 0.0000 0.0017 0.0004 0.0021
% RSD 5.00 0.00 8.10 0.83 2.04
Confidence interval
of mean from 0.010 0.010 0.020 0.048 0.103
Confidence interval
of mean to 0.011 0.010 0.022 0.048 0.105
110
Chapter-II-HPLC Determination of Solifenacin Succinate impurities by Stability Indicating HPLC Method
Table.2.23: Intermediate precision data of solifenacin succinate
Preparations % of impurity-A
% of impurity-B
% of impurity-C
% of MSUI
% of TI
Inter precision prep’n-01 0.012 0.010 0.021 0.047 0.104 Inter precision prep’n-02 0.011 0.011 0.023 0.050 0.110 Inter precision prep’n-03 0.011 0.010 0.022 0.046 0.102 Inter precision prep’n-04 0.011 0.010 0.023 0.046 0.104 Inter precision prep’n-05 0.011 0.011 0.022 0.049 0.108 Inter precision prep’n-06 0.011 0.011 0.018 0.046 0.100 Average 0.011 0.011 0.022 0.047 0.105 STDEV 0.0004 0.0005 0.0019 0.0018 0.0037 % RSD 3.64 4.55 8.64 3.83 3.52 Confidence interval of
mean from 0.011 0.010 0.021 0.047 0.103
Confidence interval of
mean to 0.011 0.011 0.023 0.049 0.108
Table.2.24: Robustness data of solifenacin succinate at flow rate 0.8 ml. min-1
Preparations % of impurity-A
% of impurity-B
% of impurity-C
% of MSUI % of TI
Robustness prep’n-01 0.011 0.010 0.023 0.045 0.103 Robustness prep’n-02 0.012 0.010 0.021 0.045 0.101 Robustness prep’n-03 0.010 0.010 0.019 0.045 0.099 Average 0.011 0.010 0.021 0.045 0.101 STDEV 0.0006 0.0000 0.0020 0.0000 0.0020 % RSD 5.45 0.00 9.52 0.00 1.98
111
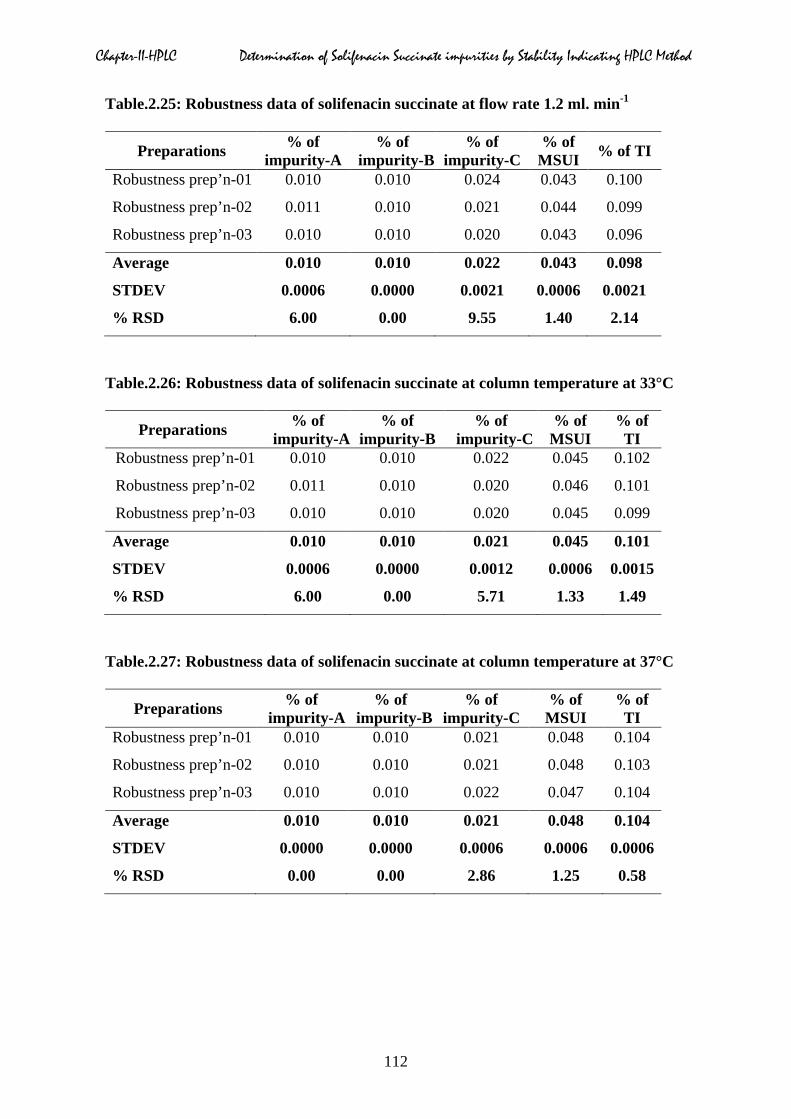
Chapter-II-HPLC Determination of Solifenacin Succinate impurities by Stability Indicating HPLC Method
Table.2.25: Robustness data of solifenacin succinate at flow rate 1.2 ml. min-1
Preparations % of impurity-A
% of impurity-B
% of impurity-C
% of MSUI % of TI
Robustness prep’n-01 0.010 0.010 0.024 0.043 0.100
Robustness prep’n-02 0.011 0.010 0.021 0.044 0.099
Robustness prep’n-03 0.010 0.010 0.020 0.043 0.096
Average 0.010 0.010 0.022 0.043 0.098
STDEV 0.0006 0.0000 0.0021 0.0006 0.0021
% RSD 6.00 0.00 9.55 1.40 2.14
Table.2.26: Robustness data of solifenacin succinate at column temperature at 33°C
Preparations % of impurity-A
% of impurity-B
% of impurity-C
% of MSUI
% of TI
Robustness prep’n-01 0.010 0.010 0.022 0.045 0.102
Robustness prep’n-02 0.011 0.010 0.020 0.046 0.101
Robustness prep’n-03 0.010 0.010 0.020 0.045 0.099
Average 0.010 0.010 0.021 0.045 0.101
STDEV 0.0006 0.0000 0.0012 0.0006 0.0015
% RSD 6.00 0.00 5.71 1.33 1.49
Table.2.27: Robustness data of solifenacin succinate at column temperature at 37°C
Preparations % of impurity-A
% of impurity-B
% of impurity-C
% of MSUI
% of TI
Robustness prep’n-01 0.010 0.010 0.021 0.048 0.104
Robustness prep’n-02 0.010 0.010 0.021 0.048 0.103
Robustness prep’n-03 0.010 0.010 0.022 0.047 0.104
Average 0.010 0.010 0.021 0.048 0.104
STDEV 0.0000 0.0000 0.0006 0.0006 0.0006
% RSD 0.00 0.00 2.86 1.25 0.58
112
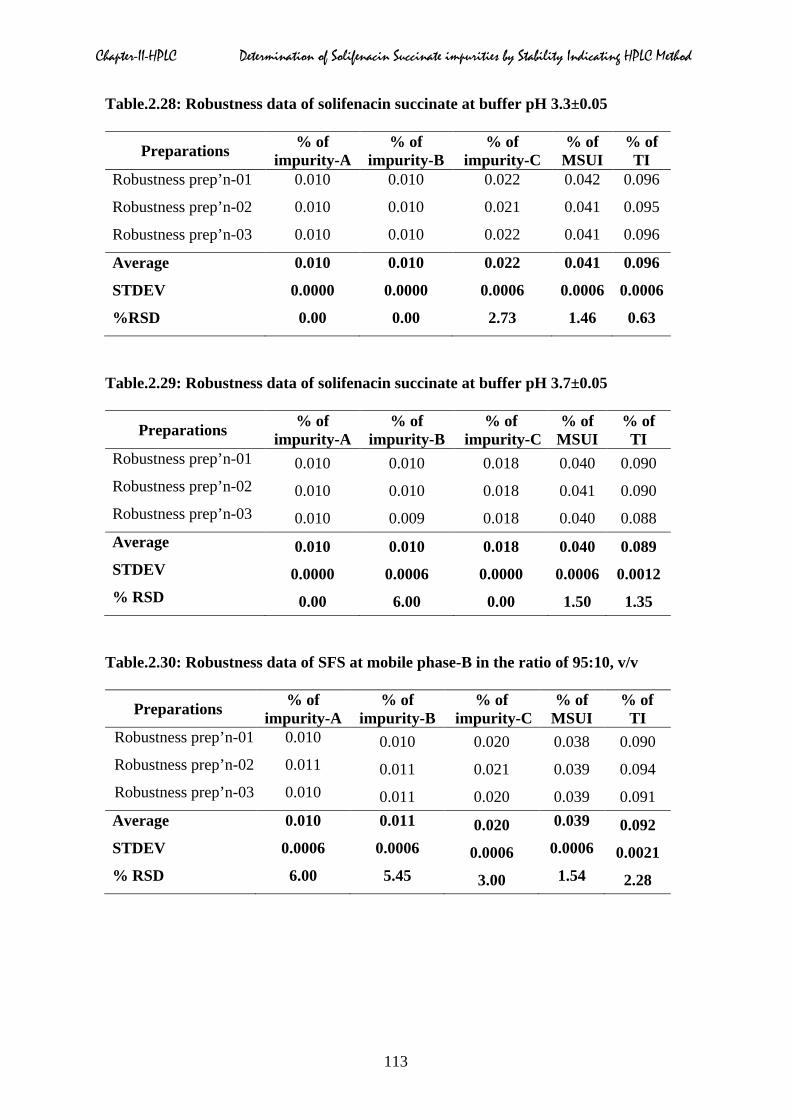
Chapter-II-HPLC Determination of Solifenacin Succinate impurities by Stability Indicating HPLC Method
Table.2.28: Robustness data of solifenacin succinate at buffer pH 3.3±0.05
Preparations % of impurity-A
% of impurity-B
% of impurity-C
% of MSUI
% of TI
Robustness prep’n-01 0.010 0.010 0.022 0.042 0.096
Robustness prep’n-02 0.010 0.010 0.021 0.041 0.095
Robustness prep’n-03 0.010 0.010 0.022 0.041 0.096
Average 0.010 0.010 0.022 0.041 0.096
STDEV 0.0000 0.0000 0.0006 0.0006 0.0006
%RSD 0.00 0.00 2.73 1.46 0.63
Table.2.29: Robustness data of solifenacin succinate at buffer pH 3.7±0.05
Preparations % of impurity-A
% of impurity-B
% of impurity-C
% of MSUI
% of TI
Robustness prep’n-01 0.010 0.010 0.018 0.040 0.090 Robustness prep’n-02 0.010 0.010 0.018 0.041 0.090 Robustness prep’n-03 0.010 0.009 0.018 0.040 0.088 Average 0.010 0.010 0.018 0.040 0.089 STDEV 0.0000 0.0006 0.0000 0.0006 0.0012 % RSD 0.00 6.00 0.00 1.50 1.35
Table.2.30: Robustness data of SFS at mobile phase-B in the ratio of 95:10, v/v
Preparations % of impurity-A
% of impurity-B
% of impurity-C
% of MSUI
% of TI
Robustness prep’n-01 0.010 0.010 0.020 0.038 0.090 Robustness prep’n-02 0.011 0.011 0.021 0.039 0.094 Robustness prep’n-03 0.010 0.011 0.020 0.039 0.091 Average 0.010 0.011 0.020 0.039 0.092 STDEV 0.0006 0.0006 0.0006 0.0006 0.0021 % RSD 6.00 5.45 3.00 1.54 2.28
113
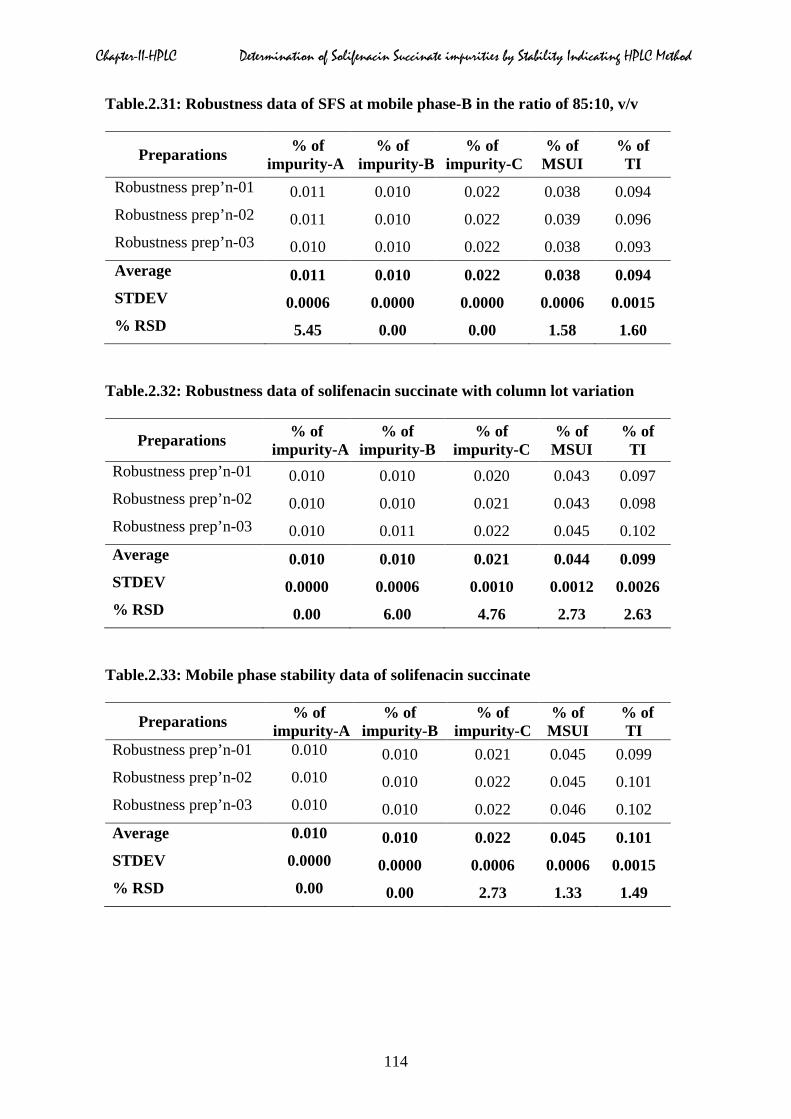
Chapter-II-HPLC Determination of Solifenacin Succinate impurities by Stability Indicating HPLC Method
Table.2.31: Robustness data of SFS at mobile phase-B in the ratio of 85:10, v/v
Preparations % of impurity-A
% of impurity-B
% of impurity-C
% of MSUI
% of TI
Robustness prep’n-01 0.011 0.010 0.022 0.038 0.094 Robustness prep’n-02 0.011 0.010 0.022 0.039 0.096 Robustness prep’n-03 0.010 0.010 0.022 0.038 0.093 Average 0.011 0.010 0.022 0.038 0.094 STDEV 0.0006 0.0000 0.0000 0.0006 0.0015 % RSD 5.45 0.00 0.00 1.58 1.60
Table.2.32: Robustness data of solifenacin succinate with column lot variation
Preparations % of impurity-A
% of impurity-B
% of impurity-C
% of MSUI
% of TI
Robustness prep’n-01 0.010 0.010 0.020 0.043 0.097 Robustness prep’n-02 0.010 0.010 0.021 0.043 0.098 Robustness prep’n-03 0.010 0.011 0.022 0.045 0.102 Average 0.010 0.010 0.021 0.044 0.099 STDEV 0.0000 0.0006 0.0010 0.0012 0.0026 % RSD 0.00 6.00 4.76 2.73 2.63
Table.2.33: Mobile phase stability data of solifenacin succinate
Preparations % of impurity-A
% of impurity-B
% of impurity-C
% of MSUI
% of TI
Robustness prep’n-01 0.010 0.010 0.021 0.045 0.099 Robustness prep’n-02 0.010 0.010 0.022 0.045 0.101 Robustness prep’n-03 0.010 0.010 0.022 0.046 0.102 Average 0.010 0.010 0.022 0.045 0.101 STDEV 0.0000 0.0000 0.0006 0.0006 0.0015 % RSD 0.00 0.00 2.73 1.33 1.49
114
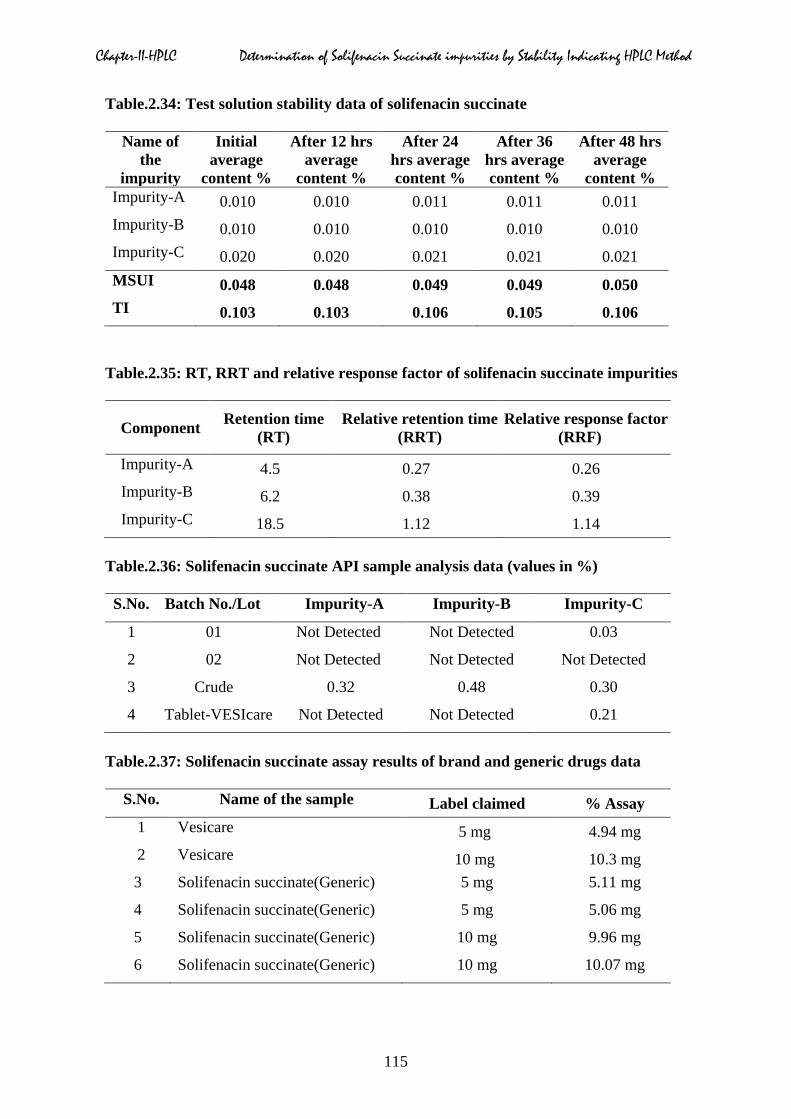
Chapter-II-HPLC Determination of Solifenacin Succinate impurities by Stability Indicating HPLC Method
Table.2.34: Test solution stability data of solifenacin succinate
Name of the
impurity
Initial average
content %
After 12 hrs average
content %
After 24 hrs average content %
After 36 hrs average content %
After 48 hrs average
content % Impurity-A 0.010 0.010 0.011 0.011 0.011 Impurity-B 0.010 0.010 0.010 0.010 0.010 Impurity-C 0.020 0.020 0.021 0.021 0.021 MSUI 0.048 0.048 0.049 0.049 0.050 TI 0.103 0.103 0.106 0.105 0.106
Table.2.35: RT, RRT and relative response factor of solifenacin succinate impurities
Component Retention time (RT)
Relative retention time (RRT)
Relative response factor (RRF)
Impurity-A 4.5 0.27 0.26 Impurity-B 6.2 0.38 0.39 Impurity-C 18.5 1.12 1.14
Table.2.36: Solifenacin succinate API sample analysis data (values in %)
S.No. Batch No./Lot Impurity-A Impurity-B Impurity-C
1 01 Not Detected Not Detected 0.03
2 02 Not Detected Not Detected Not Detected
3 Crude 0.32 0.48 0.30
4 Tablet-VESIcare Not Detected Not Detected 0.21
Table.2.37: Solifenacin succinate assay results of brand and generic drugs data
S.No. Name of the sample Label claimed % Assay 1 Vesicare 5 mg 4.94 mg 2 Vesicare 10 mg 10.3 mg 3 Solifenacin succinate(Generic) 5 mg 5.11 mg
4 Solifenacin succinate(Generic) 5 mg 5.06 mg
5 Solifenacin succinate(Generic) 10 mg 9.96 mg
6 Solifenacin succinate(Generic) 10 mg 10.07 mg
115
Chapter-II-HPLC Determination of Solifenacin Succinate impurities by Stability Indicating HPLC Method
References
[1] A. Ohtake, C. Saitoh, H. Yuyama, M. Ukai, H. Okutsu, Y. Noguchi, T. Hatanaka, M.
Suzuki, S. Sato, M. Sasamata, K. Miyata.; Biological and pharmaceutical bulletin,
2007, 30(1), 54-58.
[2] A.J. Wein.; Expert opinion on investigational drugs, 2001, 10(1), 65-83.
[3] G. Haeusler, H. Leitich, M. Van Trotsenburg, A. Kaider, CB. Tempfer.; Obstetrics and
gynecology, 2002, 100(5 Pt 1), 1003-16.
[4] R. Basra, C. Kelleher.; Journal of therapeutics and clinical risk management, 2008,
4(1), 117-128.
[5] Ken Ikeda, Seiji Kobayashi, Mami Suzuki, Keiji Miyata, Makoto Takeuchi,
Toshimitsu Yamada, Kazuo Honda.; Archives of pharmacology, 2002, 366(2), 97-103.
[6] M.C. Michel, M. Oelke, N. Zinner.; Drug discovery today, therapeutic strategies,
2005, 2(1), 1-6.
[7] S. Budavari.; The Merck Index, 14th ed., Merck & Co. Inc., White house station, NJ.
2006, 1484.
[8] N. Hiren Mistri, G. Arvind G. Jangid, Ashutosh Pudage, M. Dhiraj Rathod, S. Pranav
Shrivastav.; Journal of chromatography B, 876, 236-244.
[9] Jan Macek, Pavel Ptacek, Josef Klima.; Journal of chromatography B, 2010, 878(31),
3327-3330.
[10] T. Yanagihara, T. Aoki, Y. Soeishi, T. Iwatsubo, H. Kamimura.; Journal of
chromatography B, 2007, 859(2), 241-245.
[11] G. Divya Teja, Ch. Deva Dasu, P.Srinivasa Babu, P. Ravisankar.; Journal of chemical
and pharmaceutical sciences, 2013, 6(3), 195-198.
[12] Lokesh Singh, Sanju Nanda.; Pharmaceutical methods, 2011, 2(1), 21-24.
[13] R. Seetharaman, KS. Lakshmi.; International journal of research in pharmaceutical and
biomedical sciences, 2011, 2(3), 1052-1057.
[14] S.B. Wankhede, Kratika Somani, S.S. Chitlange.; International journal of chem tech
research, 2011, 3(4), 2003-2010.
[15] D. Desai, G. Mehta, D. Ruikar, R. Jain, S. Rajput.; Asian journal of pharmaceutical
and biological research, 2011, 1(3), 310-316.
116
Chapter-II-HPLC Determination of Solifenacin Succinate impurities by Stability Indicating HPLC Method
[16] B.S. Landge, A.S. Jadhav, B.S. Dahale, C.N. Niphade, Ch. Lakshmi Narayana, B.V.
Gaikwad, T.V. Mathad.; Chromatography research international, 2011, 1-7.
[17] S. Radha Krishna, B.M. Rao, N. Someswara Rao.; Journal of chromatographic
science, 2010, 48, 807-810.
[18] Nilesh Desai, Syed Sajjad Hussen, S.G. Vasanthraju, A. Karthik, N. Udupa.;
International journal of pharmacy and pharmaceutical sciences, 2011, 3(1), 70-74.
[19] D. Desai, G. Patel, N. Shukla, S. Rajput.; Acta chromatographica, 2012, 24(3), 399-
418.
[20] S.K. Raul1, B.V.V. Ravi Kumar, A.K. Patnaik.; International journal of bioassays,
2012, 01(12), 210-213.
[21] K. Nageswara Rao, S. Ganapaty, A. Lakshmana Rao.; Pharmanest, 2012, 3(5), 366-
374.
[22] ICH Guideline Q7A.; good manufacturing practice guide for active pharmaceutical
ingredients, 2005.
[23] ICH Q2 (R1) validation of analytical procedures:, text and methodology, 2005.
[24] ICH draft guidelines on validation of analytical procedures: definitions and
terminology, federal register, IFPMA, Switzerland, 1995, 11260.
[25] ICH, stability testing of new drugs substances and products (Q1AR), International
conference on harmonization, IFPMA, Geneva, 2000.
[26] ICH Q1A (R2), Stability testing of new drug substances and products, International
conference on harmonization, 2003.
117

![Succinate Dehydrogenase-a Comparative Review · Membrane-bound succinate dehydrogenase [SDH; E.C.1.3.99.1 succinate:(acceptor) oxido-reductase] is present in all aerobic cells. Ever](https://img.pdfslide.us/doc/110x75/5e54371d86904d694572eef0/succinate-dehydrogenase-a-comparative-review-membrane-bound-succinate-dehydrogenase.jpg)