Embed Size (px)
Citation preview
xiv 1
chapter i
mercury-injection capillary-pressure analysis
inTroducTion
mercury-injection capillary-pressure (MICP) evaluation of reservoir lithologies, cap seals, intra-formational seals, and fault seals is con-
ducted at the Australian School of Petroleum (ASP). MICP measurements may be integrated with seismic to microstructural data to provide a robust basis for interpretation of the reservoir potential, sealing capac-ity, and stability and strength of individual strata.
mercury-injecTion cAPillAry-Pressure BAckGround
An understanding of capillary-pressure behavior is vital to accurately determine cap, intra-formational, and fault-sealing capacity. Investigation of the sealing capacity and pore-throat-aperture size distribution for seals and reservoir lithologies is conducted via mercury porosimetry using the latest Micromeritics Autopore-III porosimeter (Figure 1). This state-of-the-art equip-ment is capable of injecting non-wetting phase (mer-cury) in user-defined, step-like pressure increments up to 60,000 psi (~413MPa) into an evacuated, cleaned, and dried core plug or cut sample. Innovative labora-tory processes are used to control injection direction. The volume of mercury injected at each pressure incre-ment is automatically recorded until the maximum analytical pressure, or 100% pore-volume Hg saturation is achieved. Pressure is subsequently plotted against incremental Hg saturation readings to generate the
drainage curve. Processes may be reversed to generate a non-wetting phase imbibition curve. Injection analy-sis can be conducted at reservoir conditions if pressure data are available; however, low reservoir pressures may inhibit total nonwetting phase saturation.
Figure 1. ASP’s state-of-the-art high-pressure porosimeter. Analytical pressure tables are user-defined to ensure equilib-rium at each stage of injection and withdrawal.
Copyright ©2012 by The American Association of Petroleum GeologistsDOI: 10.1306/13241318St60227
34360_FMandCh01_v5.indd 1 6/8/12 12:00:10 PM
2 Richard (Ric) Daniel and John Kaldi
PeTroPhysicAl Theory
Mercury porosimetry is based on the capillary law governing liquid penetration into small pores. Capil-lary forces in the reservoir and seal are functions of surface and interfacial liquid tensions, pore-throat size and shape, and the wetting properties of the rock. This law, in the case of a nonwetting liquid like mercury and assuming cylindrical pores is expressed by the Wash-burn (1921) equation:
Pc = - 2γ cosθ / rc (1)
Where, Pc = capillary pressure (dynes/cm2), γ = surface tension of Hg, θ = the contact angle of mercury in air, and rc = the radius of the pore-throat aperture (µm) for a cylindrical pore.
The surface tension of mercury varies with purity. The interfacial tension for air-mercury is 485 dynes/
cm2. The contact angle (θ) between clean mercury and sample pores varies with specimen composition; how-ever, 140° is generally accepted by industry.
Rearranging the Washburn equation in terms of rc, we get
(2)
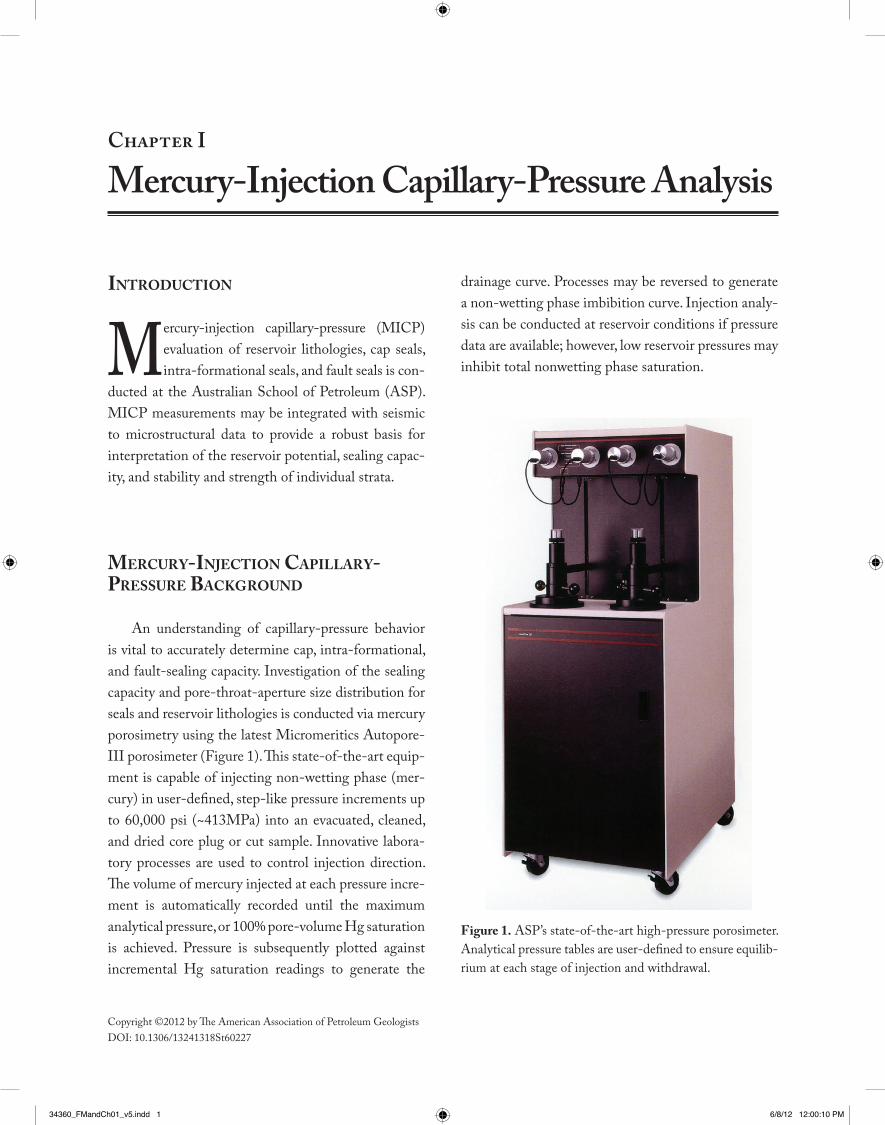
This equation is used to calculate the critical pore-throat size, which is the pore-throat size that maxi-mum intrusion of the nonwetting phase occurs for a relatively minor pressure increase (Figure 2). Critical pore-throat-size values are vital in reservoir character-ization and threshold pressure and permeability iden-tification and prediction.
Entry pressure and threshold pressure are terms referring to the critical points on the mercury-injec-tion curve (Figure 2). The entry pressure on the mer-
107.6rc = [ ] Pc
Figure 2. Pore-throat distribution, injection (drainage), and withdrawal (imbibition) MICP curves, highlighting threshold pressure, pore-throat size distribution and critical pore-throat size. Threshold pressure (Pth) is the pressure at which the mercury forms a continuous filament through the rock.
34360_FMandCh01_v5.indd 2 6/8/12 12:00:15 PM
Mercury-Injection Capillary-Pressure Analysis 3
cury-injection curve is the point on the curve at which mercury initially enters the sample. This point is often indicative of the largest pore aperture size (Robinson, 1966). However, this parameter can be difficult to accurately determine as sample size and surface irregu-larities, relative to total pore-size distribution, create a boundary condition that affects the low-pressure por-tion of the curve. Surface irregularities also affect the low-mercury saturation portion of the MICP curve (Bliefnick and Kaldi, 1996). These irregularities do not follow the Washburn equation relationship and result in a conformance MICP injection error. This factor must be recognized when characterizing a reservoir or seal as conformance can lead to significant errors in calculating both entry and threshold pressures.
The most important factor when evaluating seal potential is determining the pressure required to form a connected filament of nonwetting fluid through the pore space of the sample. As mercury is a nonwetting fluid, pressure must be built up before it displaces the wetting phase. At a sample specific pressure, the per-centage of mercury intruded increases rapidly, which is dependent on the pore-throat size. This point rep-resents the threshold pressure and graphically corre-sponds to an upward convex inflection point on the mercury-injection curve and has been successfully utilized by Dewhurst et al., (2002a) for determining
threshold pressures in seal rocks (Figure 2). The thres-hold pressure point has been experimentally proven by monitoring electrical resistance across a sample and noting the pressures at which continuity occurs (Katz and Thompson 1986, 1987).
Pittman (1992) and H. D. Winland (Amoco Production Company) have attempted to identify a mercury saturation percentile at which the reservoir threshold pressure can be predicted to occur. Three, five, and ten percent of the total mercury saturation are commonly used to predict this threshold pressure. Ten-percent mercury saturation is theoretically defined as the displacement pressure (Schowalter, 1979). Pittman (1992) also suggested that the apex of a peak obtained by plotting capillary pressure divided by the percentage of mercury intruded, against the percentage of mer-cury intrusion serves as an estimate of the threshold pressure. This suggestion is based on analysis of unde-formed sandstones.
This method can be employed to vindicate the chosen threshold pressure apex when no clear thresh-old pressure indicator is present. Commonly, a sample with a large pore-throat distribution displays many minor MICP apexes. These additional apexes relate to distinct pore-throat aperture sizes within the sample created by the grain-size heterogeneity, authigenic cements, and poor sorting.
Table 1. Typical Workflow Spreadsheet for Determining Seal Capacity and Column Height, in this case for Supercritical CO2*.
* Subsurface pressure, temperature, and salinity are required to determine phase densities and interfacial tension.** TVDSS = true vertical depth subsea.
34360_FMandCh01_v5.indd 3 6/8/12 12:00:17 PM
4 Richard (Ric) Daniel and John Kaldi
fAulT-seAl micP AnAlysis
Ideally, separate samples from undeformed reser-voirs and faults should be analyzed to accurately deter-mine the height of the hydrocarbon column that the fault may support relative to the undeformed strata. For specimens where the fault zone is too narrow to cut, an additional sample can be cut with the fault zone, cutting horizontally across the center of the plug with regions of hanging wall and footwall flanking either side. To constrain the pore size of these thin fault rocks, the sample is sealed on all sides except the foot-wall base by coating in an epoxy resin. This procedure ensures directional injection across the fault and also minimizes closure effects during mercury-injection analysis on samples with large external surface areas to volume ratios.
The mercury-injection curves of sealed samples containing faults will display two threshold pressure indicators. The first inflection-point threshold is char-acteristically low and represents the initially intruded host lithology. The second threshold is dominantly at a greater injection pressure and represents the pressure at which the fault-seal zone is breached. This pressure value is employed to calculate the sealing capacity and height of the hydrocarbon column the faults may sup-port.
conversion of Air-mercury dATA To oil-WATer, GAs-WATer, And cArBon dioxide-WATer sysTems
Quantitative application of mercury capillary data to subsurface conditions requires the conversion of mercury capillary pressure values to subsurface hydro-carbon-water and/or gas-water and/or CO2-water capillary pressure values (Vavra et al., 1992). The Hg/air-brine/hydrocarbon (CO2) conversion factor can be expressed as:
(3)
where (Pc)hw = capillary pressure for the hydrocar-bon/CO2-water system, γhw = the interfacial tension of hydrocarbon and water in dynes/cm, θhw = the contact angle of hydrocarbon/CO2 and water, γma =
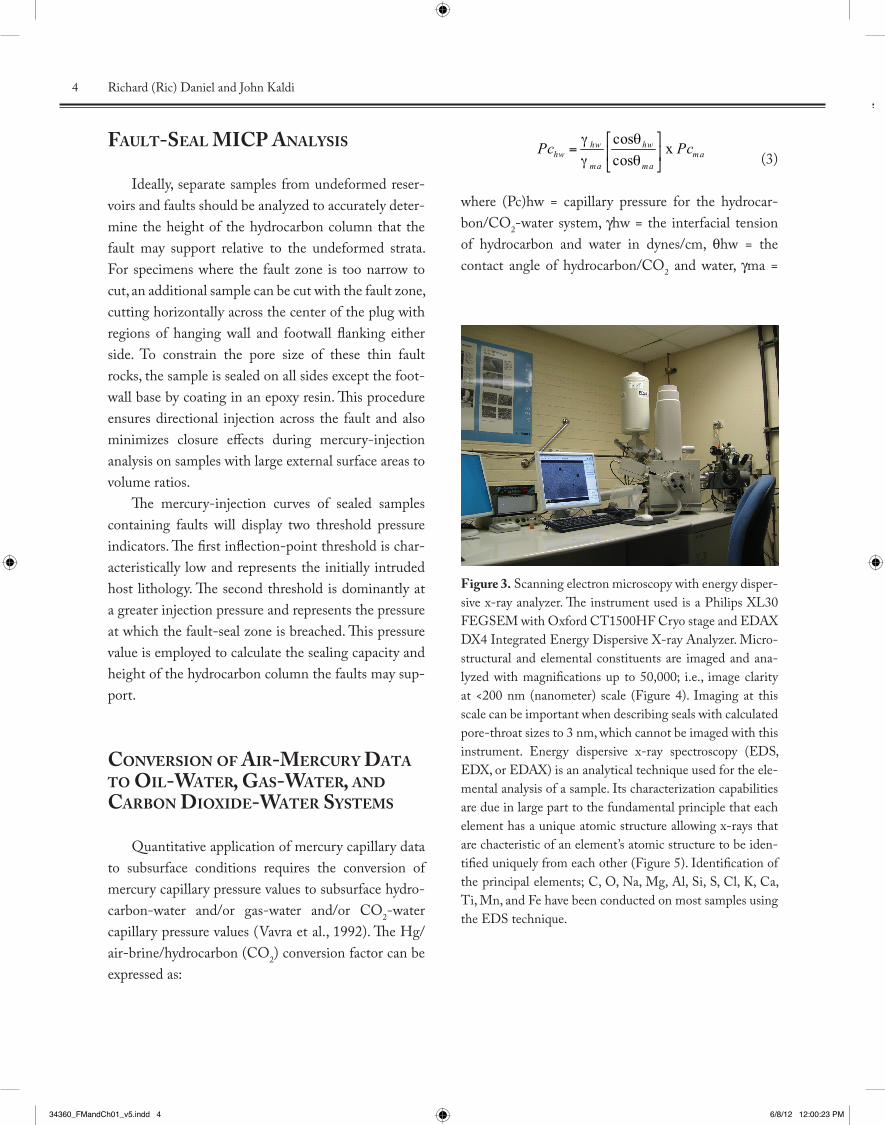
Figure 3. Scanning electron microscopy with energy disper-sive x-ray analyzer. The instrument used is a Philips XL30 FEGSEM with Oxford CT1500HF Cryo stage and EDAX DX4 Integrated Energy Dispersive X-ray Analyzer. Micro-structural and elemental constituents are imaged and ana-lyzed with magnifications up to 50,000; i.e., image clarity at <200 nm (nanometer) scale (Figure 4). Imaging at this scale can be important when describing seals with calculated pore-throat sizes to 3 nm, which cannot be imaged with this instrument. Energy dispersive x-ray spectroscopy (EDS, EDX, or EDAX) is an analytical technique used for the ele-mental analysis of a sample. Its characterization capabilities are due in large part to the fundamental principle that each element has a unique atomic structure allowing x-rays that are chacteristic of an element’s atomic structure to be iden-tified uniquely from each other (Figure 5). Identification of the principal elements; C, O, Na, Mg, Al, Si, S, Cl, K, Ca, Ti, Mn, and Fe have been conducted on most samples using the EDS technique.
γhw cos θhwPchw = [ ] x Pcma γhw cos θhw
34360_FMandCh01_v5.indd 4 6/8/12 12:00:23 PM
Mercury-Injection Capillary-Pressure Analysis 5
the interfacial tension of mercury plus air, and θma = the contact angle of mercury and air against the solid. The interfacial tension of mercury and air is ~480 dynes/cm at laboratory conditions. The contact angle between mercury and solid is 140° (Schowalter, 1979). Subsurface values for hydrocarbon or CO2-water capillary pressures can be calculated by entering the subsurface hydrocarbon or CO2-water interfacial ten-sion value into the above conversion factor equation (Purcell, 1949). The laboratory-derived air-mercury threshold pressure values can be multiplied by this conversion factor to produce subsurface hydrocar-bon/CO2-water capillary pressure values. Subsurface hydrocarbon/CO2-water interfacial tension values for all projects are calculated using specific reservoir temperature, and pressure (salinity) conditions. Note: gas-water interfacial tensions are generally greater than oil-water interfacial tensions for both surface and subsurface conditions with CO2 having interme-diate values. Gas-water threshold pressures are there-fore greater than oil-water displacement pressures for the same rock. Carbon dioxide and water threshold pressures usually fall between hydrocarbon gas and hydrocarbon liquid as the CO2-water contact angle can range between 0 and 130° depending on pressure, temperature, and substrate mineralogy (Daniel and Kaldi, 2008).
meThodoloGies used in The ATlAs
The seal capacity and characteristics of the regional, local, and intraformational seals for each area have been determined in large by mercury-injection capillary-pressure analysis (MICP), scanning electron microscopy (SEM) with an energy dispersive x-ray analyzer (EDS, EDX, or EDAX), x-ray diffraction analysis (XRD), and shale volume (Vsh). Techniques used to a lesser extent are thin-section petrography and grain- and pore-size distribution, coupled with lithofacies identification (see Tables 1 and 2 and Figures 3 to 7).
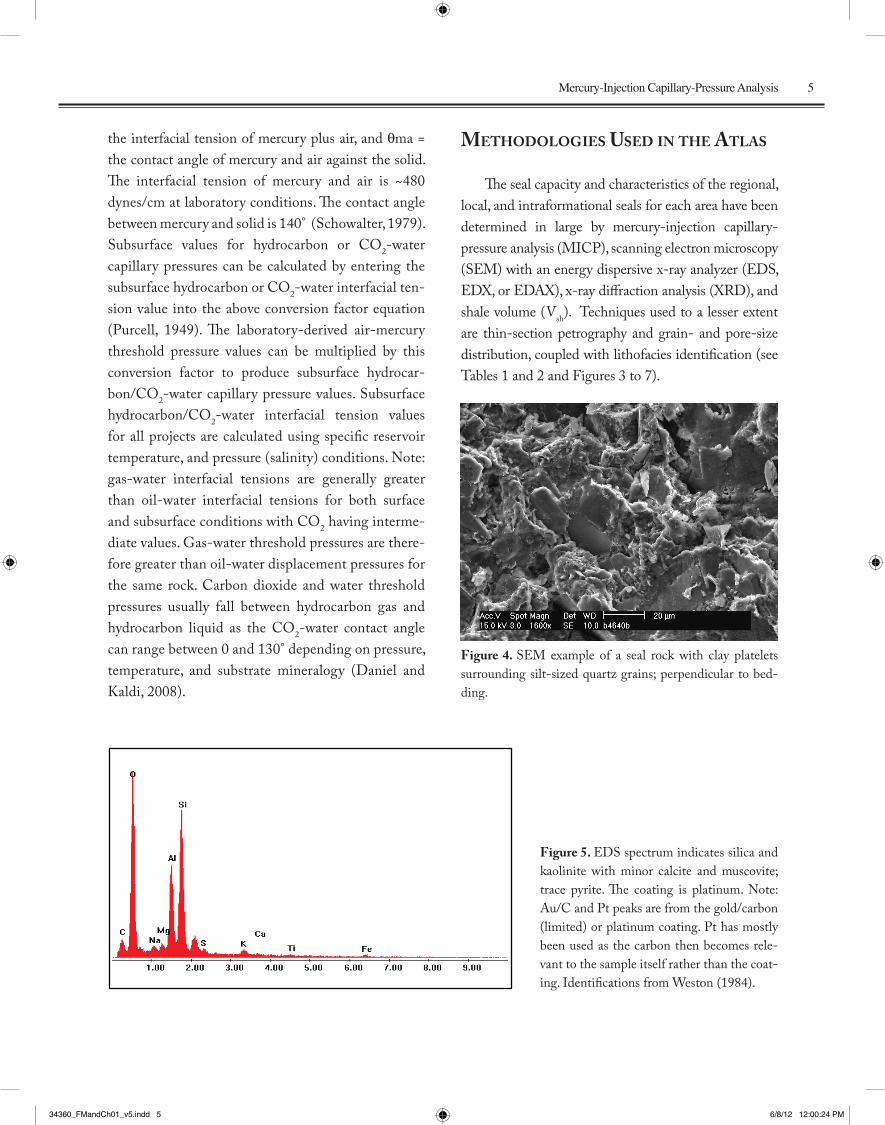
Figure 4. SEM example of a seal rock with clay platelets surrounding silt-sized quartz grains; perpendicular to bed-ding.
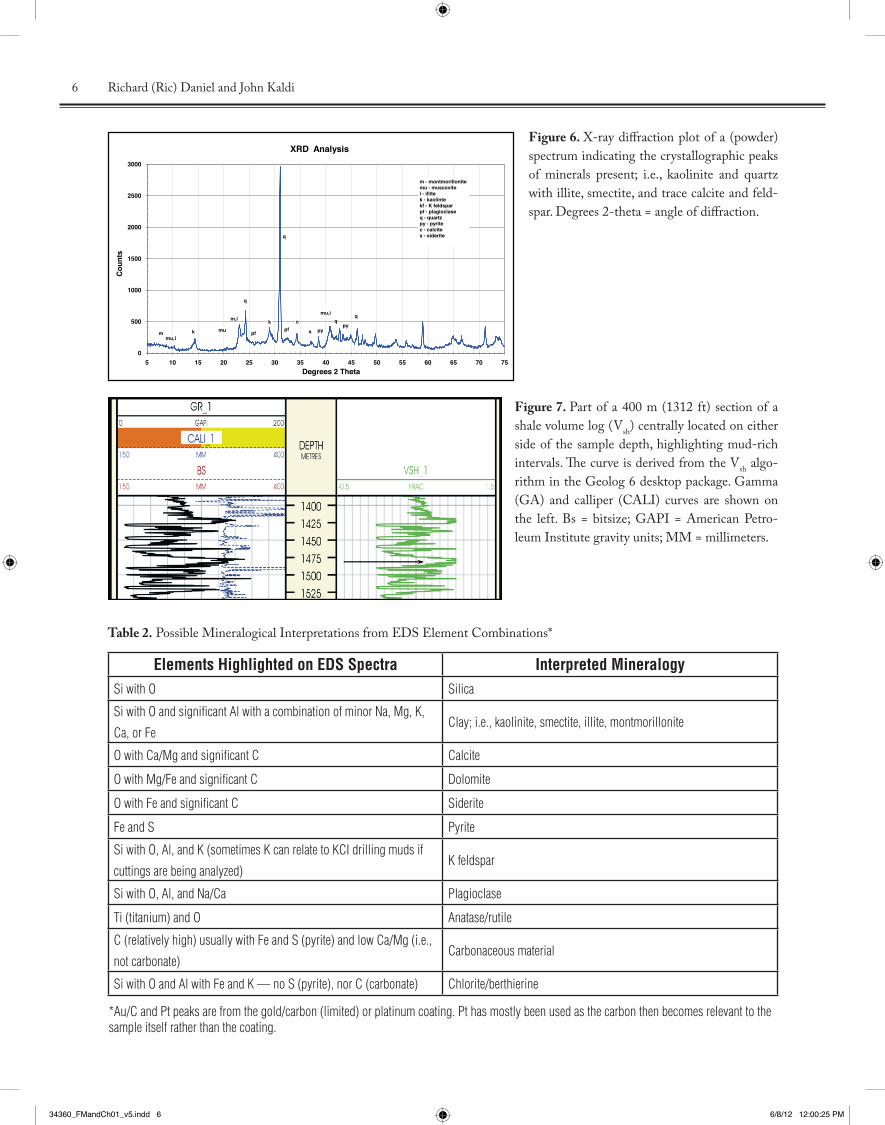
Figure 5. EDS spectrum indicates silica and kaolinite with minor calcite and muscovite; trace pyrite. The coating is platinum. Note: Au/C and Pt peaks are from the gold/carbon (limited) or platinum coating. Pt has mostly been used as the carbon then becomes rele-vant to the sample itself rather than the coat-ing. Identifications from Weston (1984).
34360_FMandCh01_v5.indd 5 6/8/12 12:00:24 PM
6 Richard (Ric) Daniel and John Kaldi
Figure 7. Part of a 400 m (1312 ft) section of a shale volume log (Vsh) centrally located on either side of the sample depth, highlighting mud-rich intervals. The curve is derived from the Vsh algo-rithm in the Geolog 6 desktop package. Gamma (GA) and calliper (CALI) curves are shown on the left. Bs = bitsize; GAPI = American Petro-leum Institute gravity units; MM = millimeters.
Figure 6. X-ray diffraction plot of a (powder) spectrum indicating the crystallographic peaks of minerals present; i.e., kaolinite and quartz with illite, smectite, and trace calcite and feld-spar. Degrees 2-theta = angle of diffraction.
0
500
1000
1500
2000
2500
3000
5 10 15 20 25 30 35 40 45 50 55 60 65 70 75
Coun
ts
Degrees 2 Theta
XRD Analysis
q
q
k
m,i kpy
m - montmorillonitemu - muscovitei - illitek - kaolintekf - K feldsparpf - plagioclaseq - quartzpy - pyritec - calcites - siderite
mu,ipy
mu,i q
mpf
q
pfmuc
s
Elements Highlighted on EDS Spectra Interpreted MineralogySi with O Silica
Si with O and significant Al with a combination of minor Na, Mg, K,
Ca, or FeClay; i.e., kaolinite, smectite, illite, montmorillonite
O with Ca/Mg and significant C Calcite
O with Mg/Fe and significant C Dolomite
O with Fe and significant C Siderite
Fe and S Pyrite
Si with O, Al, and K (sometimes K can relate to KCI drilling muds if
cuttings are being analyzed)K feldspar
Si with O, Al, and Na/Ca Plagioclase
Ti (titanium) and O Anatase/rutile
C (relatively high) usually with Fe and S (pyrite) and low Ca/Mg (i.e.,
not carbonate)Carbonaceous material
Si with O and Al with Fe and K — no S (pyrite), nor C (carbonate) Chlorite/berthierine
Table 2. Possible Mineralogical Interpretations from EDS Element Combinations*
*Au/C and Pt peaks are from the gold/carbon (limited) or platinum coating. Pt has mostly been used as the carbon then becomes relevant to the sample itself rather than the coating.
34360_FMandCh01_v5.indd 6 6/8/12 12:00:25 PM


![Capillary thermostatting in capillary electrophoresis · Capillary thermostatting in capillary electrophoresis ... 75 µm BF 3 Injection: ... 25-µm id BF 5 capillary. Voltage [kV]](https://img.pdfslide.us/doc/110x75/5c176ff509d3f27a578bf33a/capillary-thermostatting-in-capillary-electrophoresis-capillary-thermostatting.jpg)