Embed Size (px)
Citation preview
1
Chapter I
Introduction
The purpose of this chapter is to review literature considering a specific technology--
graphing calculator-based technology--as a tool not only for science and math education but also
as a cultural artifact imbued with political and social meaning and purpose. This inquiry will go
beyond commonly held notions about technology in an effort to broaden the way technology is
considered.
In the first section, approaches to history are discussed and a brief account of several
calculating technologies is provided. The aim is to connect a current technology with its past by
way of its function. In the second part, graphing calculator technology is considered as an
emerging component in current educational reform initiatives. National and state documents are
reviewed in reference to calculators and graphing calculators, in an attempt to explore how
technology is talked about in the dialogue of reform. The last part examines recent math and
science education literature involving graphing calculators, computers, and probeware
technologies particularly pertaining to constructivist learning theory.
A History of Calculating Technology
The historical accounts included in this work were selected based on several assumptions.
First, any historical account is unavoidably biased. People see and interpret the world
subjectively within temporal and social context. To some extent, the current meaning of
graphing calculator technology comes from how individuals and society have come to know
earlier calculating technologies. Secondly, no historical account is necessarily ever complete or
finished. Moreover, historical events and their interpretation can be reconsidered as time and
social conditions change. Graphing calculators will mean something different in another time or
place. Lastly, a historical account has purpose. Historians make value judgments about what
they write about, how they write, and for whom they write.
A popular direction among contemporary historians of technology has been to take a
contextual or sociological approach (Smith & Reber, 1989; Hughes, 1979). Trevor Pinch and
Wiebe Bijker (1984) argued for an integrated social constructivist approach to studies in science
and technology. With this approach, graphing calculator technology can be considered in the
context of larger social, cultural, and political systems where meaning and purpose is socially
negotiated. Pinch and Bijker saw constructivism as an analytic means by which sociology of
2
science and sociology of technology can benefit from each other. They claimed the field of
sociology of technology is underdeveloped when compared to the sociology of scientific
knowledge and "it would be a shame if the advances made in the latter field could not be used to
throw light on the study of technology" (p. 47).
In Electrifying America: Social Meanings of a New Technology (1985), David Nye
examined the interrelationships between the growth of the electric industry and American culture
of the period. Nye's account interpreted the electrification of America not as an external event
that impacted society; rather, it was an internal phenomenon inextricably shaped by its social
context. Electrification was the backdrop against which Nye unraveled its social meaning.
Electrification, according to Nye, reflected and transformed American culture and the American
mind. Nye illuminated a complex web of social, political, technical, and ideological interactions
that were players in the process of electrification. Nye's work reminds us that technology does
not have immutable meaning or determined purpose. Rather, it is people as social actors, who
give technology meaning or purpose.
Historian of technology George Wise defined technology as primarily knowledge about
the man-made world, generated for use and secondarily the community of people that contribute
to this knowledge base" (Wise, 1983). Wise rejected the commonly held notions of technology
being synonymous with "tools" or "engineering" and science as synonymous with knowledge.
Wise regarded the knowledge behind the tools as the essence of technology. Considering
technology as knowledge opens many possibilities. Technology as knowledge connects
technology to the history of human development and cognition. Further, technology as
knowledge affords a broader base to think of technology on its own terms and not just as the tool
of science.
Wise's second definition of technology, "the people who contribute to the knowledge," is
equally provocative. Technology as people, underscores the idea that technology, like science, is
a human endeavor, conceived and constructed by people in a variety of contexts for different
purposes. Indeed, technology is an essential, fundamental characteristic of what it means to be
human. In this view, technology as an objective, unbiased "tool" does not exist; it is rather, a
social construct, deeply imbued with human values, motives, and purposes. Technology as
people does something else. Defining technology as "the people that help to create it" softens the
barriers that keep people separated from technology. Commonly heard phases like "science tells
3
us" or "technology makes our lives easier," personify science and technology. It is as if science
has its own voice and technology its own tools. However, alone, technology does not "make life
easier." Making life easier is but one, albeit important, purpose for technology. Technology is
also used to destroy. John Dewey wrote of technology, "it is always convenient to have a devil
as well as a savior to bear the responsibilities of humanity. In reality, the trouble springs rather
from the ideas and absence of ideas in connection with which technological factors operate"
(Hickman, 1990). In this view, technology does not have an immutable meaning or determined
purpose. Rather, it is people as social actors who ultimately give technology its meaning and
purpose. Likewise, students, educators, parents, and politicians within social context give
graphing calculator technology meaning and purpose.
Other historians of technology have patterned nationalistic interests and politics into their
accounts. In "The Heavens and the Earth…" (1985), Walter McDougall conveyed a detailed
account of the political rivalry between the United States and the Soviet Union centered around
the space race from the period following the Second World War to the 1960s. To describe the
U.S. push for better rockets, McDougall used the term "command technology," to define "a state-
funded and managed technology instituted for state purposes." McDougal's idea of command
technology involved nations, but the idea can also be applied at the state level. In 1998 the
Virginia Department of Education, with the support of Blue Cross/Blue Shield, purchased $16.5
million of graphing calculator technology for schools. The purchase and distribution of a
specific technology on this scope is unprecedented and raises considerable questions. The idea
of command technology can be applied to graphing calculator technology--a state-funded and
distributed technology instituted for state purposes--to make Virginia graduates competitive in
the "economy of the 21st Century."
Calculating History
Calculators have quickly co-evolved with advances in micro-technology and computers.
Hand-held electronic calculators have been in wide use since the 1970's, and graphing calculators
since 1990. Today, many people have several personal calculating devices. Grocery stores have
calculators built into shopping carts. Automobiles are being equipped with computers capable of
calculating anything from how much gas is being used to how long it will take to arrive at a
particular destination. Banking systems are constantly calculating loan amounts, interest rates,
and account balances. However, as a species, humans have been calculating for eons.
4
The definitions supplied for "calculator" in the 1828 and 1913 editions of Webster's
Dictionary were identical; both editions used the definition, "One who computes or reckons: one
who estimates or considers the force and effect of causes, with a view to form a correct estimate
of the effect" (Webster's, 1998). In contrast, the 1996 edition added an entry reflecting a
fundamental social change--"[a] keyboard machine for the automatic performance of
mathematical operations" (p. 101). Between 1913 and 1996 the meaning of calculator was
augmented from being (only) a person to one that could mean a person or a calculating
technology. A similar change in English lexicon occurred with the word "computer," which also
at one time referred to a person. A similar transition is happening to those who use a computer
for writing. Word processing software now does much of the job that once was done by typists
and proofreaders. In the not-too-distant past people engaged in many activities that are now
done by technology.
The first "digital" devices--fingers and toes--were much simpler than those of today. No
doubt, the numbers and mathematical functions used long ago were less complicated. It seems a
historical irony that the Latin word "digit," the first calculator, would form the root of the word
"digital"--the basic language for how modern computers store and communicate data.
In A History of Computing Technology, M. R. Williams (1985) assembled a history
combining calculating devices with in-depth cultural examination. The chapters proceed as the
discussion focuses on significant calculating technologies as they changed over time. The book
begins with a discussion of the significance of numeration in various cultures including
Egyptian, Greek, European, and Asian. For each culture, Williams explained the significance of
numerical symbols, writing characters, and writing implements. By Williams' account, the first
physical objects used for numeration were knotted cords and tally sticks or bones--hence the
phrase "tally up the bill."
The following list touches on some of what Williams considered to be significant
technologies in the history of computing.
1. Finger reckoning. Finger reckoning is the oldest and most enduring form of
computation. In fact, there are cultures that still do computing with their fingers.
Finger reckoning has been used in at least three distinct ways. The first way is in
finger counting which children learn at a very early age. The second way is
analogous to sign language. Various configurations of fingers symbolize certain
5
numbers. The third way is an extension of the first, but allowed for greater arithmetic
functions leading to multiplication.
2. The abacus. What is now considered a child's toy is a deceptively powerful device
for computation. Like finger reckoning, the abacus has an extensive multicultural
history. The origin of the abacus is unknown but likely evolved from stones and lines
on the ground or on paper. At one time, the abacus was built into a table with legs,
but the advent of inexpensive writing paper and the spread of Hindu-Arabic numerals
made the table abacus obsolete. There is some evidence that Native Americans may
have used a counting device similar to the abacus. A skilled abacus operator can
perform the four basic arithmetic functions--addition, subtraction, multiplication, and
division--with speeds, on some problems, that would rival any computational
technology.
3. The sector. The sector first appeared in Europe around the end of the 16th century at
several different places, almost simultaneously. Galileo produced one of the earliest
and most copied versions. With two hinged arms, a sector looked a little like a flat
proportional compass or folding carpenter's rule. Each arm had scaled markings that
could be fashioned by the sector maker to perform a variety of mathematical
functions. One of the principal functions of the sector was in performing quick
calculations for artillery (e.g., barrel diameter, elevation of cannon, and weight of
shot). Before the acceptance of the figure zero, the end of the scale was left blank.
Therefore, when a cannon barrel was tilted at no angle, it fired straight ahead, hence
the expression "point blank." Edmund Gunter, an early proponent of the sector,
produced a description of a logarithmic scale, which led to an early version of the
slide rule. Users of the new device referred to it as the "sliding Gunter."
4. Napier's bones. John Napier, best known as the inventor of logarithms, spent much of
his time devising methods and implements aimed at making computation easier. Also
known as numbering rods or multiplying rulers, the term "bones" came from the
device Napier called his Rabdologia, the more expensive of which were fashioned
from bone or ivory. The idea for the bones originated in ancient India and spread
during the Middle Ages across China, the Middle East, and Europe. The method
involved the use of a matrix-like grid of numbers and diagonal lines. Squares, square
6
roots, and cube roots could quickly be computed using Napier's bones. The method
never became popular because of the complexity and expense involved, but
undoubtedly spawned a multitude of other useful computational devices. Logarithms
became widely used in all areas of society where calculation had to be done. In
Williams' estimation, the significance of logarithms would only be surpassed by the
invention of the modern digital computer.
5. The slide rule. The invention of the slide rule is attributed to William Oughtred, who
only published his idea when he felt another mathematician was getting the credit he
deserved. Oughtred did not want to publish about a computational tool because, as he
saw it, his status would suffer. Like other mathematicians of his time, Oughtred
considered mathematical instruments to be playthings that were not suitable objects
for the true mathematician. His position was:
The true way of Art is not by Instruments…it is a preposterous course of
vulgar Teachers, to begin with Instruments, and not with the Sciences, and
so instead of Artists, to make their scholars only doers of tricks, and as it
were Iuglers (p. 79).
Derisive remarks directed at mathematical tools and those that use them extends back to at least
the Greek Sophists and Plato (Restivo, 1992). This aspect of Greek philosophy John Dewey
rejected sternly. Dewey wrote:
Since they were thinkers, aiming at truth or knowledge, they put art on a lower
plane than science; and the only enjoyment they found worth serious attention
was that of objects of thought. In consequence, they formulated a doctrine in
which the esthetic and the rational are confused on principle, and they bequeathed
the confusion as an intellectual tradition to their successors (Hickman, p.95).
Oughtred and his contemporaries produced slide rules that were typically circular. What
resembles today's slide rule began being produced around 1650 but was not widely used for two
centuries. Amedee Mannheim redesigned the slide rule in 1850 by adding a moving cursor,
which must have been a key innovation because the slide rule became a symbol of technological
progress through more than half of the 20th century.
Perhaps the most dramatic impact in mechanizing calculating technology following the
slide rule came from Charles Babbage. In Glory and Failure (1990), M. Lindgren detailed the
7
story of Babbage, Johann Müller, Edvard Scheutz, and the calculating machine known as the
Difference Engine. Why Babbage called his machine an "engine" no one knows, but it seems
likely that he wanted to connect his machine to the image of Fulton's steam engine as a
successful modern marvel.
In the first part of the book, Lindgren established the need for a more accurate, reliable
computational tool by pointing out the shortcomings of the technology that existed at the time.
For example, original hand-calculated astronomical or logarithmic tables could have errors made
in the many figures they contained. Once the tables were ready for publication, typesetting and
printing errors often occurred. Babbage wanted to produce a machine capable of printing
numbers as well as computing them. Lindgren's description of Babbage clarified what
contributed to Babbage's calculating acumen. First, Babbage was an avid collector of numerical
tables and eventually began producing his own. He became a student in the history of
calculating machines and familiarized himself with design and construction issues. Although
Babbage worked for years on the design and construction of difference engines, he was never
able to get all of the components to work simultaneously. Lindgren argued that historians should
recognize that Johann Müller, not Babbage, deserves the credit for first conceiving the idea of
the difference engine. Although neither Müller nor Babbage were able to produce a fully
working difference engine, Edvard Scheutz would. Although mechanical calculating machines
symbolized progress and modernity, the inexpensive and portable slide rule would survive until
the 1970s and the electronic age of transistors and diodes.
While some worked on the problem of making a portable electronic device for basic
calculations, others focused on building a machine that could do more than calculations.
Advances in microcircuit technology led to the invention of the first handheld calculator in 1967.
Graphing calculators did not appear until the early 1990s and calculator-based probeware,
several years later.
Calculators and Educational Reform
Many education, government, and business institutions are actively promoting the use of
technology in the classroom. Since the mid-1990s, national and state education agencies have
been pushing to get computers in every classroom, school systems have been allocating revenue
for technology at a striking rate. Despite this monumental infusion of technology, computers in
the classroom have yet to fulfill the optimistic predictions many had made. Many school
8
systems have given relatively little attention to the effective use of the technology once it is in
place.
Becoming proficient in the use of technology is being touted as the way to make
Americans more competitive in what is sometimes referred to as "the global economy of the 21st
Century." Increasingly, business and industry are becoming significant players in the dialogue of
educational reform. The National Science Board Commission on Pre-college Education in
Mathematics 1983 report, Educating Americans for the 21st Century, issued this message:
The Nation that dramatically and boldly led the world into the age of technology is
failing to provide its own children with the intellectual tools needed for the 21st century.
Technological know-how is spreading throughout the world--along with the knowledge
that such skills and sophistication are the basic capital of tomorrow's society (p. v).
Following the cultural shock wave from the first orbiting satellite, Sputnik, A Nation at
Risk (1983) initiated the second modern educational reform era. Ensuing national and state
science and math initiatives, such as the National Science Education Standards (1996) and the
Curriculum and Evaluation Standards for School Mathematics (1989), placed strong emphasis on
the use of technology. State offices were quick to follow the lead. According to the Virginia
Standards of Learning (Commonwealth of Virginia Board of Education, 1995):
Graphing utilities…calculators, computers, and other forms of electronic information
technology are now standard tools for mathematical problem solving in science,
engineering, business and industry, government, and practical affairs. Hence, the use of
technology must be an integral part of teaching and learning…technology must be readily
available and used regularly as an integral and ongoing part in the delivery and
assessment of instruction and include instrumentation oriented toward the instruction and
learning of science concepts, skills and processes. Technology, however, should not be
limited to traditional instruments of science…but should also include computers…
graphing calculators…probeware…as well as other emerging technologies (pp. 3, 34).
The Virginia Board of Education sent copies of the state standards to schools, which
distributed the document to children to bring home. On the first page was a picture of then
Governor George Allen and the following statement appeared in his message to Virginia parents:
"Our schoolchildren will be challenged to reach higher and be prepared to compete successfully
in the increasingly competitive international economy of the 21st century" (p. i). In an apparent
9
move to address technology specifically in the Virginia Standards, new Computer/Technology
Standards were included in the fifth and eighth grade levels. Since most school divisions were
not prepared to hire additional educators just to teach technology, the Standards directed
"teachers of all disciplines" (p. 34) to bear the responsibility. Because many teachers were
trained in colleges before the advent of computers, they did not have the technological skills to
integrate these innovations into their classrooms.
A comparison of the National Council of Teachers of Mathematics (NCTM) Standards
from the 1989 version to the current version shows some significant changes in its language
toward calculators and computers. It is worth noting that the 1989 version was before the advent
of graphing calculators. According to the 1989 document, "new technology has made
calculations and graphing easier which changed the nature and method of mathematics" (p. 8).
As such, NCTM recommended:
1. Appropriate calculators should be available to all students at all times.
2. A computer should be available in every classroom for demonstration purposes.
3. Every student should have access to a computer for individual and group work.
4. Students should learn to use the computer as a tool for processing information and
performing calculations to investigate and solve problems (p.8).
These recommendations reflect the generally accepted belief at the time that computers were
going to play a major role in educational reform. However, budget cutbacks, physical plant
constraints, and teacher training issues were not adequately considered at the time. NCTM
issued these cautions about the use of technology:
1. Access to this technology is no guarantee that any student will become
mathematically literate.
2. Calculators and computers are tools that simplify, but do not accomplish the work at
hand.
3. The availability of calculators does not eliminate the need for students to learn
algorithms (p. 8).
NCTM saw the need to clarify when it is appropriate to use calculators and when it is not. The
next paragraph was an attempt to guide educators in making appropriate calculation decisions.
According to NCTM, for numerical problem solving involving calculation, "one should be aware
of the options." Those options, according to NCTM, are to (a) estimate, (b) use mental
10
calculation, (c) use paper-and-pencil calculation, (d) use a calculator, and (e) use a computer
(p. 9).
To address the concern that the use of calculators may usurp the need to learn basic
algorithms, NCTM stated that "there is no evidence to suggest that the availability of calculators
makes students dependent on them for simple calculations" (p. 8). That statement seems to
imply that no empirical research has been found or conducted, but could mean that no research
has been done. Such a broad, sweeping statement in a national document needs to be analyzed in
greater depth. The claim seems to show a lack of understanding of the historical nature of
technology and society. The use of the passive "dependent" can be considered further. In a
recent ethnographic study in a middle school algebra class (Casey, 1999), some students were
found to prefer using calculators to such basic mathematical algorithms as multiplying two single
digit numbers. Students, like anyone else in society, become dependent on the technology they
use on a regular basis. It is becoming more apparent that educators and researchers need to
revisit standards regularly as technology continues to become an ever-increasing part of school
curricula. Technological momentum could be taking society down a path that may be difficult, if
not impossible, to change.
The online draft standards (NCTM, 1998) reflected an even greater emphasis on
technology. It is clear by the language that electronic technology is necessary but is to be used
responsibly. In the "Technology Principal" section, electronic technologies, including
calculators, computers, microcomputer-based laboratories offer students the potential to:
1. Engage students in significant ways with mathematical ideas.
2. Make mathematics and its applications accessible in ways that were heretofore
impossible.
3. Learn more mathematics, more deeply, with appropriate use of technological tools.
4. Explore new mathematical territory with simple technological tools.
5. Collect and analyze real-time data in ways that can make the applications of
mathematics meaningful and relevant.
6. See the shape of graphs quickly and obtain an estimate of the answer empirically.
7. Use graphing and symbol manipulation utilities, making explicit links between
algebraic and graphical representations of functions.
8. Explore how changing the coefficients of a quadratic function affects the shape of the
11
graph (NCTM, 1998).
Along with the potential of these technologies NCTM cautions that:
1. Like any tools, technological tools can be used well or poorly.
2. Technology should not be used as replacements for basic understandings and
intuitions.
3. Flashy, show-and-tell demonstrations may leave students no more knowledgeable
than before.
4. "Black box" computations can leave students in the dark, when they should have
developed intuitions about the objects being computed.
5. Dynamic geometry programs that can test conjectures with ease may leave students
with the impression that proof is no longer necessary, and that empirical confirmation
will guarantee the correctness of a conjecture. The technology should be used to
support conjecture, but teachers need to provide an emphasis on the importance of
proof (NCTM, 1998).
At the very least, society is embroiled in a technological conflict. On the one hand, technology is
promoted to be the remedy to society's ills. The message is that a strong emphasis on technology
is preparing students to compete in the 21st century. At the same time, people are frightened by
an ever-growing dependence on technology. A case in point might be the social insecurity that
swept the country in anticipation of the "Y2K bug." A seemingly innocent omission of early
computer programming threatened to bring society to its knees. Fortunately, the error was
discovered in time for measures to be taken to head off the problem. This society-technology
debacle should at least serve as a reminder of the power of technological momentum and
hopefully stir researchers to study more closely the precarious relationship society has with
technology.
Almost every state now has content standards in one form or another. Of all the state
documents examined, every document addressed the use of calculators. Below are a few
examples of some of the state documents and the language they use regarding calculators. As
indicated, the use of calculators is addressed in a variety of ways.
The Alabama Mathematics Course of Study (Alabama State Department of Education,
1999) explain that calculators are appropriate for exploratory purposes in Grades K-3 and should
be used for problem solving in Grades 4-8. Further, calculators should be used on a regular basis
12
in all courses and assessments in Grades 9-12. The language used here seems to be open to
teacher interpretation while demonstrating consideration of learners' cognitive abilities.
West Virginia's Instructional Goals and Objectives are organized by grade level for
elementary curriculum, and it is specific about the use of calculators. The following are goals
that include calculators in kindergarten and first grade (the letter K symbolizes kindergarten and
the number 1, first grade):
K.3 Recognize patterns of counting by fives and tens, using concrete objects and/or a
calculator.
K.36 Use a calculator to count by fives and tens.
1.20 Analyze, extend, and describe a variety of repeating patterns (e.g., using numbers,
rhythm, shapes, and calculators).
1.25 Use scientific equipment and everyday materials to investigate the world (e.g., hand
lens, balance, thermometer, seeds, rocks, magnets, calculators, and computers).
1.52 Use a calculator to produce repeating number patterns.
1.80 Use a calculator to perform mathematical functions in data analysis (West Virginia
Department of Education, 1999).
Language this specific leaves little doubt about what calculators are to be used for with these
young students.
In Alaska, each elementary school "should have several classroom sets of calculators and
each middle school and high school should have classroom sets of graphing calculators and
accompanying probeware or the equivalent computer-based software and hardware" (State of
Alaska Educational Frameworks, 1999). The language in this document provides no direction as
to how calculators are to be used or acquired, just that schools should have the technology.
In Texas, calculators are not mentioned specifically until sixth grade. The document does
however refer to the use of technology as early as kindergarten (Texas Education Agency, 1999).
The most comprehensive state document regarding calculators and computers is found in
California's standards. The California Standards emphasize that the appropriate role of
technology must be clearly understood. The following statements help define the role of
technology and mathematics:
1. Technology does not replace the need for all students to learn and master basic
mathematics skills.
13
2. All students must be able to add, subtract, multiply, and divide easily without the use
of calculators or other electronic tools.
3. All students need direct work and practice with the concepts and skills underlying the
rigorous content described in the Mathematics Content Standards for California
Public Schools so that they develop an understanding of quantitative concepts and
relationships. The students' use of technology must build on these skills and
understandings; it is not a substitute for them.
4. The focus must be on mathematics content. The focus must be on learning
mathematics, using technology as a tool rather than as an end in itself.
5. Technological tools cannot be used effectively without an understanding of
mathematical skills, concepts, and relationships.
6. As students learn to use electronic tools, they must also develop the quantitative
reasoning necessary to make full use of those tools.
7. The challenge for educators, parents, and policymakers is to ensure that technology
supports, but is not a substitute for, the development of quantitative reasoning and
problem-solving skills (California Department of Education, 1999).
The introduction of the Virginia Standards is similar in tone to other states and in line
with the NCTM standards. Each grade level's standards, K through 8, comes with this statement:
While learning mathematics, students will be actively engaged, using concrete
materials and appropriate technologies such as calculators and computers.
However, facility in the use of technology shall not be regarded as a substitute for
a student's understanding of quantitative concepts and relationships or for
proficiency in basic computations.
However, in the Algebra I standards, calculators have a substantially increased role. The term
"graphing calculator" is mentioned eight times in the body of the Algebra I text and seven out of
nineteen of the standards contain specific tasks students are to perform using a graphing
calculator. The Algebra I standard #12 states:
A.12 The student will factor completely first- and second-degree binomials and
trinomials in one or two variables. The graphing calculator will be used as both a
primary tool for factoring and for confirming an algebraic factorization (p. 19).
In comparison, a California standard for a similar Algebra objective states:
14
11.0 Students apply basic factoring techniques to second- and simple third-degree
polynomials. These techniques include finding a common factor for all terms in a
polynomial, recognizing the difference of two squares, and recognizing perfect squares of
binomials (California Department of Education, 1999).
By contrast, the Virginia Math Eight Standards, typically taken by a majority of eighth graders,
do not require the use of graphing calculators. In some school districts, students taking Algebra I
are assigned graphing calculators at the beginning of the year, similar to the way textbooks are
handled. State policy allows school divisions to choose how their calculators are distributed and
the district decides what autonomy schools have. Other divisions distribute their calculators to
the teachers to use as a classroom set; students only use the calculators while they are in class.
While this practice limits a student's exposure to the technology, all students have equal access to
the technology. Students from more affluent families often buy their own graphing calculators.
The state plan to purchase graphing calculator-based technologies first appeared in a
State Superintendent's memo June 6, 1997:
The standards are rigorous and require the use of technology…The use of graphing
calculators is a required component of the state mathematics standards…Governor Allen
proposed, and the General Assembly approved, using approximately $20 million for
graphing calculators and scientific probes for Virginia Schools…The standards for these
[math] courses require students to use scientific probe kits with the graphing
calculators…These calculators and graphing softwares are also used in science
instruction…The percentages of enrollment for students to receive scientific probe kits
and graphing calculators are 100 for each of the 9th and 10th grades, and 54 for the 8th
grade…The number of probe kits and calculators to be procured will be based upon a 1:4
probe kit-to-calculator ratio…Surveys and the Outcome Accountability Project report
indicate that approximately 30 percent of students take Algebra I by the end of grade 8.
(La Pointe, 1997a).
Three months later (Superintendent's Memo. NO. 71, October 10, 1997):
A total of $16.5 million is available for this initiative which permits the graphing
calculator requirements of the Standards of Learning to be fully met…The distribution
model used Fall 1996 student enrollments in grades eight, nine, and ten as an estimate of
the number of students in those grades in the 1997-98 school year. Each division will
15
receive the number of graphing calculators equivalent to approximately 100 percent of
the number of ninth and tenth grade students and 40 percent of the number of eighth
grade students. Scientific probe kits will be distributed to divisions using a probe kit to
calculator ratio of approximately one probe kit for every thirty calculators. (La Pointe,
1997b)
Subsequent memos gave no explanation for why the total amount available had dropped by $3.5
million; or why the eighth grade percentage fell from 54 percent to 40; or why the ratio of probe
kits-to-calculator went from 1:4 to 1:30. The technologies were purchased and distributed to
school divisions throughout the state in the winter of 1997-1998, two years after the Standards of
Learning were adopted.
A state policy that requires the use of graphing calculators may well support the math
standards and to some degree science, but what of the other content areas that the Board of
Education proclaims to support--English, and social studies? If the state policy is to provide
more resources for math and science, the message is that these areas need or warrant more
support. Moreover, Governor Allen claimed that electives such as music, art, band, and
vocational courses "will not be affected by these academic standards." Other content areas may
not be affected in the sense that they have no content standards, but providing additional
resources for some areas inherently favors certain subjects over others. With this agenda
enacted, resources are disproportionately distributed--math and science invariably come away
with greater support than other disciplines.
Graphing Calculators, Computers, Probeware, and Constructivist Learning Theory
Most of the scholarly research on calculators and graphing calculators can be found in
mathematics education publications. As yet, there are a very few articles pertaining to the use of
graphing calculators in science education particularly with the associated interface and
probeware, and what there is mainly in teacher magazines such as the National Science Teachers
Association's Science Teacher. Most of the research on electronic graphing technology pertains
to microcomputer-based laboratory (MBL) technology and can be found in abundance in both
mathematics and science education literature. The following discussion reflects the relative
abundance in the literature.
16
Graphing Calculators and Probeware
Graphing calculators serve a dual purpose. Primarily they are used as a scientific
calculator capable of displaying numerous lines of mathematical symbols, functions, and
graphical information. In addition, a calculator can be connected to a data collection interface
device (calculator-based laboratory, or CBL, as the popular Texas Instruments device is known)
which handles the data from the probes and the relatively simple programs from the calculator.
Both technologies are battery-powered and designed to be hand-held and portable. The term
"probeware" will be used to refer to the electronic probes, interface boxes, and the software
needed to use with a graphing calculator or microcomputer. Probeware is used to investigate
such things as temperature, motion, force, pH, sound, light, and pressure.
Electronic probes or sensors began to appear soon after the arrival of the microcomputer.
The first probes were difficult to learn to use and equally difficult to maintain. The
accompanying software often required modifications or calibration. As software systems and
computers improved, so did the ease of using probes.
As mentioned earlier, there are few academic studies in science education on graphing
calculators and probeware. There is an increasing number of articles in teacher publications on
graphing calculator probeware (e.g., Albrecht and Firedrake, 1998), mainly dealing with
pedagogy and methodology, however new studies are beginning to appear. Saurino, Bouma, and
Gunnoe (1999) looked at how middle school classroom management is affected by the use of
graphing calculator technology. The researchers found that:
1. Students were able to complete higher level work with understanding and without the
frustration.
2. Students enjoyed the use of technology in the science classroom, which made
classroom management easier.
3. The use of an overhead projector, which can show the screen of the connected
calculator, made instruction easier.
4. The technology's relatively small size, ease of portability, and lower cost than
computers made the systems more accessible to students and teachers while providing
the convenience of remaining in the regular classroom where students were
accustomed to a certain standard of behavior.
Saurino, et al, stressed the importance of teachers' pre-instruction trials using the technology and
17
planning as essential to successful instruction.
Wetzel and Varella (1999) explored how preservice teachers' concerns over the use of
graphing calculator technology changed from the instruction they received during the course of
their internship experience. Wetzel and Varella found that as teachers' technical ability and
procedural knowledge grew, their confidence level increased. The increase in confidence,
Wetzel and Varella speculated, may help them integrate graphing calculator technology into their
science classrooms once they become teachers.
Casey (1999) studied how an interdisciplinary team of an Algebra teacher and physical
science teacher used graphing calculator technology in their classrooms. Casey reported that the
use of graphing calculator technology can (a) save time compared to traditional laboratory
procedures, (b) help to energize and motivate students, (c) provide more opportunities for rich
explorations involving higher level thinking skills, (d) promote group interaction and cooperative
learning experiences, and (e) provide content experiences not possible with traditional lab
equipment.
An unexpected outcome of the research Casey conducted came from observing students
working in small groups. In some cases students performed with team-like efficiency and
cooperation as they performed their investigations. Group members assumed roles within the
group based on interest or expertise. One group member might operate the probes while another
handled the graphing calculator. Jonathan Tudge (1990) reported on two studies involving peer
collaboration and Lev Vygotsky's Zone of Proximal Development (ZPD). ZPD refers to the
phase or step in the learning process in which a student needs the assistance of an adult or more
advanced peer to continue to learn (Vygotsky, 1978). Vygotsky believed learning takes place
through social interaction. Accordingly, knowledge is built on what individuals in society
construct together. Vygotsky was especially interested in the dialogue between individuals in a
group--how they conversed, questioned, explained, and negotiated meaning (Fosnot, 1996).
Tudge argued that placing students in groups solely based on differing competencies or ZPD did
not necessarily result in improved achievement. Tudge contended that many factors need to be
considered in constructing groups.
According to Tudge, some of factors that can effect group interaction include (a)
confidence levels of collaborators, (b) the nature and quality of feedback of collaborators, (c) age
of collaborators, (d) verbal skills of collaborators, (e) degree of equality and mutual involvement
18
of collaborators, (f) motivation of collaborators, and (g) ability of collaborators to engage in
"social coordination." While Casey observed small groups of students working with probeware,
teachers seemed to give little attention to how the students interacted.
Computers and Probeware
Microcomputer-based laboratory (MBL) technology is similar to graphing calculator
technology in that a computer can be connected by way of an interface device to probes and
sensors. However, MBL technology has advantages to graphing calculator technology. Faster
data processing and a dramatic difference in memory capacity lead a long list of MBL benefits.
The biggest practical drawbacks of MBL technology are the cost and space requirements in a
typical science classroom. Pre-computer science classroom designs often seriously limit the
amount of student exposure to the technology.
Studies have found that computers and probeware can help facilitate students'
construction of science concepts (Linn, Songer, Lewis & Sterm, 1991). Mokros and Tinker
(1987) found that MBL technology (a) uses multiple modalities, (b) connects, in real time, events
with their symbolic graphical representations, (c) provides authentic scientific experiences, and
(d) eliminates the drudgery of graph production (p. 369).
MBL technology is capable of instantaneously transforming data into a graphical
representation. In practice, traditional laboratory methods--collecting data by hand and plotting
points--creates temporal gaps between the event and its representation. MBL technology can
decrease or eliminate procedural gaps, thereby bringing the learner closer to the actual event,
which can lead to deeper understanding. Students can watch a graph being plotted as they are
conducting the experiment. Even slight delays in graph production can hinder students' concept
development (Brasell, 1987).
When students are freed from the mundane tasks of graph production, they have more
time to modify and repeat experimental conditions with immediate results. With quicker
feedback from MBL technology, students can spend more time focusing on analyzing graphs and
constructing conceptual understanding. Increasing the available time for evaluating and
interpreting data affords more opportunities for problem solving, critical thinking, and reflection.
Tinker & Papert (1989) found MBL technology provides opportunities for experiences
that are more authentic for students. Using current technology, gathering real data, exploring
phenomena, sharing results and ideas, all contribute to learning in an active, genuine, scientific
19
environment.
However, regardless of technology, the teacher plays a critical role in making MBL
technology work effectively in the science classroom. The findings of Krajcik, Layman, Starr
and Magnusson (1991) emphasized that the overall effectiveness of MBL technology hinges
upon (a) the teachers' confidence and understanding of the technology, (b) their knowledge of the
science concepts involved, and (c) their ability to help students connect experiences with the
concepts. A study performed by Tobin, Kahle, and Fraser (1990) found that most science
teachers tend to rely on lecture and discussion strategies, often placing more value on right
answer responses than on hypothesizing, making predictions, and collecting and analyzing data.
When there is little room for student-initiated questions or independent thought, the goal of the
learner is to regurgitate the accepted explanation or methodology expostulated by the teacher
(Caprio, 1994). Studies conducted by Linn and Songer (1988) and Thornton and Sokoloff
(1990) indicate that engaging students in making predictions before the MBL activity can
enhance conceptual understanding.
One of the most powerful uses of probeware is its ability to produce graphical
representations or inscriptions. Inscriptions are signs that are materially embodied in some
medium, such as paper, a computer monitor, or the display screen of a graphing calculator. The
graphs, tables, lists, and equations produced are examples of inscriptions. The graphs students
produce during an activity can be the source of rich cognitive explorations. From a social
constructivist perspective, Wolff-Michael Roth (1992, 1995, and 1994) conducted research
involving the significance of conscription devices, such as computer or calculator displays, and
the inscriptions they produce. Inscriptions, according to Roth, have added power for cognitive
development. Inscriptions can be used for many things in science learning including (a) the
exploration of ideas, (b) as a tool for teachers to evaluate student conceptual understanding, and
(c) as a mediating tool to assist students and teachers in making sense of each other's
understandings.
Further, Roth argued the focus of studies involving inscriptions should shift from
representing as a mental activity to representing as a social activity. The meaning students make
from the inscriptions they produce, Roth insisted, is unavoidably socially constructed and
mediated. Inscription-making as a social activity poses a fundamental shift in theoretical
framework, which could have considerable implications for designing instructional materials and
20
organizing classroom activities with graphing calculator technology.
Conclusion
Calculating as a human activity has a long, rich history. Calculating technologies have
grown in response to social conditions, which require faster, more refined computations. Much
of what is presented in the media is a confined, internalistic perspective. The assumption is that
technology is inherently beneficial and that with a few minor adjustments society will progress.
The focus becomes the technology itself and how to manage it. This approach can establish an
autonomous technological system that perpetuates itself, precluding individual and societal
choice. Such a force can establish a pattern of learned helplessness as technologies and their
systems change. Consequently, technology becomes accepted as a neutral tool, applicable to
whatever task it is put to. On the other hand, technology need not ever be considered a neutral
tool. The way any tool is designed favors certain uses while preventing others. Technologies
may be flexible to some extent but they are invariably designed to meet certain ends. Those ends
are often social ends for political and economic reasons.
Technological design originates within social context. What social values are present at
the time a technology is produced becomes a functioning part of the technology producing a
socio-cultural artifact. Viewing a technology as an artifact can empower the user to consider its
broader social connections. Considering an artifact's social associations will help to re-evaluate
existing technologies and their systems.
In any society, some individuals or groups have more power and are capable of deciding
what technologies are adopted and how they are used. In education, understanding a technology
as an artifact may help to demystify the rhetoric and untangle the social and political systems that
are involved far beyond the classroom.
Graphing calculator-based technology is entwined in the fabric of social systems.
Educators have a responsibility and should have the choice of what they perceive as the best
means to achieve their objectives. State-driven, high-stakes accountability measures have
preempted many choices from school systems and teachers.
21
Chapter II
Introduction
The terms "researcher" and "participant" are used for convenience but are somewhat
misleading. By the nature of ethnographic inquiry, when an individual engages in fieldwork,
that individual becomes a participant in the culture and should consider his participation as a
fundamental part of the research process.
Recognizing personal ties to a study is necessary for qualitative research and can provide
the researcher with a valuable source of insight, theory, and data about the phenomena (Maxwell,
1996). Having taught secondary science for twelve years, the researcher had many experiences
to draw on for this study. Soon after computer-based probeware became available, he began
using a computer-based temperature probe in his classroom as a means to collect a continuous
stream of data over the course of a day. When graphed, this data were used to illustrate
meaningful patterns in temperature change. The classroom discussions that followed involved
such concepts as insolation (incoming solar radiation) and re-radiation, the effects of clouds and
storms, and the effect of changing day lengths. Before having probeware, there would have been
no practical way to collect the data.
Since that time, the researcher returned to graduate school and instructed pre-service
science teachers in science methods courses on integrating probeware technology in science
content and pedagogy. In addition, the researcher was involved in conducting technology
workshops for in-service science and math teachers. In so doing, the researcher provided
assistance and support for educators in their efforts to include technology appropriately and
effectively in their classroom practices. The results of this study can provide added insight and
understanding for educators and policy makers as to the increasing role of technology in
classroom pedagogy.
Research Purposes
Graphing calculators, computers, and probeware are new technological artifacts in the
culture of science classrooms. How a science classroom culture functions, including the artifacts
it uses and produces, formed the focus of this study. However, any artifact is but one
consideration of a culture. Therefore, probeware per se, was not the focus of the study; the
culture of a science classroom (which included probeware) was. At first, this might seem like an
insignificant distinction, but it does demarcate this study from prior studies that have focused, in
22
many cases, on the technology to the exclusion of broader educational and social implications.
By questioning established conceptions of science and technology, the researcher was in a
position to examine probeware technology not just as a technical tool for learning science, but
rather as a cultural artifact, imbued with social and cultural bearing and consequence.
Goals
The overarching goals of the study were:
1. To interpret what goes on in a science classroom where probeware technology is
used.
2. To understand better how probeware can be used as an instructional technology in
teaching and learning science.
3. To offer alternative perspectives regarding the culture of the science classroom and
the role of technology.
Rationale for an Ethnographic Approach
Studying the science classroom with in-depth, qualitative field techniques provided
experiences to make rich interpretations of the events and activities that took place. Reflective
fieldwork illuminated the significance and meaning of the language and behaviors of the
participants. This approach afforded opportunities for the researcher to explore various physical
and theoretical contexts in which the participants acted. In this way, the researcher was able to
explore the influence of context on the participants. A qualitative approach allowed the
researcher the opportunity to identify and consider unexpected phenomena and generate
emergent theory as the study progressed.
Conceptual Context
Theoretical Framework
A researcher goes into a study with a set of assumptions, theories, and beliefs that
informs and guides his study. Aptly termed "lens," a framework serves the purpose of directing
and focusing the researcher. The framework for this study is not just a review or critique of
pertinent literature. Rather, it involves spotlighting important concepts and theories that have
contributed in a significant way to the researcher's paradigm. Numerous experiences and ideas
have contributed to the researcher's framework. Moreover, the selection of those studies and
theories by the researcher is a personal matter. An objective or positivist perspective might call
this process "researcher bias," but qualitative researchers believe that all research involves
23
personal decisions and perspectives. Teaching science, leading technology workshops, and
attending graduate school have all provided the researcher with unique experiences that had
bearing on the research. Even if it were possible for a researcher to divorce himself from
experiences and beliefs, a substantial source of knowledge that informs a study would be lost.
For the goals and purposes of this study, the researcher employed a social constructivist
framework. Epistemologically, a social constructivist perspective differs markedly from the
tenets of empiricism, positivism, or scientific realism. Empiricists hold that senses are the tools
that are relied upon to gain knowledge. From this perspective, senses serve as objective tools to
experience and gain knowledge of the world. The objects and events that make up the world
exist with innate properties and only empirical studies can reveal their true nature. Scientific
realism is rooted in traditional accounts in the history of science. Realists claim that theories and
explanations refer to real, existing features of the world, and that objective inquiry can reveal
how the world really is (Schwandt, 1997).
On the other hand, social constructivists argue that knowledge of the world is mediated
through social structures. Social constructivists focus on social processes and interactions. They
seek to understand how people as social actors recognize, generate, and reproduce social actions
and how they come to share an intersubjective understanding of specific life circumstances
(Berger & Luckmann, 1996; Gergen, 1994; Shotter, 1993). Social constructivists hold that
knowledge of the world "is not a simple reflection of what there is, but a set of social artifacts; a
reflection of what we make of what there is" (Schwandt, 1997, p. 20). From this view,
knowledge can be seen as socially mediated and constructed. Further, knowledge does not
represent "what there is" a priori. Rather, knowledge is social and contextual in nature.
Social constructivism has also had an impact in social studies of science, notably in
laboratory studies that examine the ways scientific knowledge is constructed and produced
(Golinski, 1998). The groundbreaking work of social scientists Bruno Latour and Steve Woolgar
(1986), Karin Knorr-Cetina (1981), and Michael Lynch (1984) serves as a demarcation point of a
reconceptualization of what scientists do to produce scientific knowledge, which had
traditionally been unrealistically portrayed by historians of science. In addition, their work has
served to reposition the idea of "culture" in a more analytic seat rather than its tradition based on
description. In this way, culture can be used to define a particular group by its ideational (a
system of knowledge or concepts), discursive (language expressed by communication), or
24
material (physical artifacts or technologies) attributes (Schwandt, 1997, pp. 26, 31). Golinski's
historical account interpreted the science laboratory as a place of science production in which the
actors (scientists) engage in such activities as the use of tools and technologies, writing or talking
about nature, and creating representations or inscriptions.
A recent educational study employing a sociological perspective contributed to the frame
of this study. Jan Nespor (2000) explained how the concept of school as having clear, well-
defined borders is problematic:
I use the metaphor of the school as an intersection, a section of circuitry, a knot in a web
of strands that stretch out into complex systems beginning and ending outside the school
itself. What this metaphor does is allow us to look at things that we've learned to treat as
having clear boundaries, well-defined borders, stable beginnings and endings, and
identifiable contents, as being extensive in space and time, fluid in form and content; not
just networks, but nodes in networks as well.
As Nespor's metaphor suggests, a researcher approaching a study of a school (or classroom)
should (a) consider broader social and institutional systems such as local or state policy makers;
and (b) question accepted notions of how concepts such as school and classroom have come to
be defined.
Prior Studies
One sociolinguistic study (Lemke, 1995), looked at the dynamics of elementary students
engaged in a collaborative activity. Lemke discussed a fundamental difference between humans
and machines--while humans are capable of creating self-organizing systems that set their own
goals and produce order without having external order imposed on them, machines are only
capable of performing functions. As actions occur, Lemke contended, humans change the
possibilities for further action, and goals change along the way. An example of this process was
offered: grade 4-5 students in a science class were videotaped as they attempted to build a tower
out of plastic soda straws and pins. There was no problem to be solved, only the vagueness of
the activity; no agenda of problem solving, until a problem was created by the joint actions of the
participants, including the inanimate objects. Though at the outset the problem was vague,
"build-a-tower" problems and goals became more specific as the activity progressed into the
specific activities of construction. Lemke explained the course of collaborative activity is not
predictable; at each moment the probabilities for various subsequent happenings can only be
25
imagined or estimated. However, as they happen and create the conditions of possibilities and
likelihood for what follows, in turn, new orders or agendas, are created in the developing system.
The paper concluded that consideration of emergent agendas in collaborative activity may prove
fruitful for new and useful analyses.
David Johnson and Roger Johnson's pioneering work support the effectiveness of
cooperative learning in the classroom. Johnson, Johnson, and Mary Beth Stanne (2000)
presented a comprehensive meta-analysis, in which they compiled and examined 158 studies
grouped into eight cooperative learning methods as defined by the respective authors. While
there are various types of cooperative learning, this classroom approach generally involves
students socially interacting in small groups toward common learning objectives. Of particular
interest in this case, the studies cited included the effectiveness of cooperative learning for
students (a) with special educational needs, (b) at different achievement levels, and (c) from
diverse socio-cultural backgrounds. According to the analysis, when compared to individualistic
or competitive learning, all types of cooperative learning invariably showed a significant positive
impact on student achievement.
Like cooperative learning, educational technology can have positive effects on learning
for students with special educational needs. In another meta-analysis, 133 studies were
evaluated and the results indicated that educational technology has a significant positive impact
on achievement in regular classrooms as well as those for students with special needs
(Mehlinger, 1996). Further, Mehlinger found that technology encourages cooperative learning
and stimulates student-teacher interaction. Mehlinger cautioned that the student population, how
students are grouped, and the levels of student access to technology influence the degree of
effectiveness. Moreover, positive changes in the learning environment do not occur quickly but
rather evolve over time.
Judy Zorfass (1998), conducted action research on the use of technology in science
classrooms having students with disabilities and found that integrating technology into
curriculum served to ensure access to instructional activities not otherwise available.
Technology, according to Zorfass, allows all students to participate more fully as inquirers in
challenging, inquiry-based learning experiences.
Several studies have identified students' difficulties making connections among graphs,
physical concepts and the real world, and they sometimes perceive graphs as just a picture (Linn,
26
Layman, & Nachmias, 1987; McDermott, Rosenquist, & van Zee, 1987). These findings
highlight the need to design better instructional experiences to help students improve visual
representation, interpretation, and understanding.
Since the introduction of probeware technology in science instruction (in the late
eighties) many studies have been conducted aimed mainly at the introduction of technology and
how learning is affected (Friedler, Nachmias, & Linn, 1990; Mokros & Tinker, 1987; Adams &
Shrum, 1990; Nakhleh & Krajcik, 1992; Brassell, 1987). These studies are instrumental in
establishing probeware as an effective instructional technology in science pedagogy, but were
conducted using fundamentally different research approaches and methodologies. For instance,
Brassell's study of high school physics students on graphing achievement with probeware used a
standard, deductive, experimental design. Students were given a pretest, the treatment (and a
control group), and a posttest. Brassell's discussion included little attention to social factors in
learning. For Brassell, it seems students have but to interact with this powerful learning
technology to come away with higher graphing achievement. Mokros and Tinker studied middle
school students' graphing misconceptions and "the ease with which [probeware technology]
removes these problems" (p. 369). Studies focused so narrowly on the positive cognitive effects
of a technology can oversimplify the complex learning processes that take place in a classroom.
This perspective runs the risk of making students and the social and cultural systems they inhabit
virtually transparent. In a cultural study, a technology is but one artifact--one expression of
meaning to that culture.
More recently, Michael Roth and Michelle McGinn (1999) studied a group of university
ecology students and their development of graph interpretation. Roth and McGinn found that
students "did not appear to develop any general interpretive skills for graphs, but learned instead
to apply the professor's interpretation" (p. 1020). This finding is significant in considering
social learning structures and how factors such as authority and motivation need to be considered
in the classroom learning environment.
Pilot Study
The researcher conducted a pilot study in the spring of 1999 (Casey, 1999). The purpose
of the study was to investigate how an interdisciplinary team consisting of one physical science
teacher and one eighth grade math teacher used graphing calculators and probeware. The
researcher found that the teachers' use of technology was an extension of their collaborative work
27
together connecting math and science in a middle school that encouraged interdisciplinary
teaching. The teachers enhanced their relationship by attending teacher workshops together
during the summer and after school. Both teachers consider technology to be an important part
of learning.
Casey illuminated some of the social aspects of this technology. One interesting social
phenomenon of graphing calculators for students was how they were being used as electronic
gaming toys. Since graphing calculators can store programs in memory, albeit small memory by
computer standards, students entertained themselves and shared programs with other students by
way of a linking cable--a similar technology to Nintendo's Game Boy. Some students learned to
modify and write their own programs.
As a side effect, it seemed that as students used calculators more, they no longer called
on the arithmetic knowledge they learned in elementary school. Simple multiplication and
division algorithms, once performed mentally, were now being performed on calculators. This
phenomenon presents something of a paradox for teachers who value the use of technology but
see students becoming dependent on it.
Many concerns arose during the course of the study especially in regard to how
technology was disseminated. Requiring the use of graphing calculators to meet state standards
marks a distinct direction in state policy where instructional technology is concerned. The
manner in which the technologies were distributed created some disparities. Differences in
eighth grade math and algebra standards have created tension between middle school values and
state standards. While the Virginia Algebra I Standards specifically refer to the use of graphing
calculators eight times, graphing calculators are not mentioned in the Seventh or Eighth Grade
Math Standards. However, central to Middle School philosophy is the de-emphasis of ability
grouping and the notion that technology should be used by all students.
Eighth grade students used older graphing calculators only in the classroom, while their
peers in Algebra I were assigned newer models that they could use whenever they wanted all
year. Since approximately 40 percent of the students in the eighth grade received calculators, 60
percent were not assigned calculators. By policy, students used graphing calculators on an
unequal basis. As students learn to use graphing calculators, they develop new math skills, but
they also learn to communicate with specialized language expressions that have shared
meanings, understood almost exclusively with other individuals in their group. Students who are
28
assigned the calculator at the beginning of the year will have many more opportunities to use
them, thereby becoming more proficient. The increased exposure to the technology makes it
likely that Algebra students will become even more adept and confident--ever widening the gap
between Algebra students and Math 8 students.
Math 8 students have been systematically removed from the state-supported impetus of
technology and the educational opportunities that might follow. National reform documents
(NCTM, 1989) suggest that instead of sorting students into ability and achievement levels,
middle school mathematics should engage all students in a varied curriculum. Central to this
perspective is the notion that equity and access in mathematics need to be placed prominently at
the forefront of educational reform.
Further, with less access to technology and the educational and social benefits that
follow, Math 8 students reside on a lower social level than Algebra I students. This systemic
stratification translates into more access to resources for Algebra I students resulting in increased
social capital. As the term implies, social capital has its roots in economic sociology. Alejandro
Portes defined social capital as "the capacity of individuals to command scarce resources by
virtue of their membership in networks, or broader social structures..." (Portes, 1995). In this
case, because of the connection to state standards, Algebra I students, by virtue of their academic
membership, possess a higher capacity to "cash in" on graphing calculator technology
academically and socially.
Assumptions
Based on existing research and personal experience, the researcher entered the study with
the belief that graphing calculator-based technology has been shown to be an effective
instructional tool. Further, graphing calculator and probeware technology can promote more
authentic learning experiences with real scientific tools while offering a substantial cost and
space efficient alternative to computer-based laboratory equipment.
The researcher has found that students are generally engaged and motivated while using
probeware technology (Casey, 1999). Students can become involved in authentic science
processes, such as gathering, manipulating, synthesizing, interpreting, analyzing, and applying
experiential data. However, like any instructional technology, much depends on the teacher's
ability to use the technology in appropriate and meaningful ways. However, for various reasons,
many science teachers are not including graphing calculator technology in their classrooms.
29
Inscription making is a fundamental activity in science laboratories (Latour & Woolgar,
1986) and in science classrooms (Roth, 1998). Inscriptions can provide dynamic visual
representations of important scientific concepts. Graphing calculator technology can serve as an
inscription device to construct and represent shared social meaning. Technology capable of
producing inscriptions can help learners negotiate and present ideas in ways not possible with
traditional materials.
Probeware technology supports an interactive classroom environment and provides
accurate information quickly, making it possible to free up more classroom time, thereby
promoting extended, deeper explorations and the potential for higher levels of conceptual
understanding (Saurino, Bouma, & Gunnoe, 1999).
Some populations of students may stand to gain more from a technology, and there are
equity issues related to the use of technology (Casey, 1999). School divisions, schools, and
teachers have different ways of handling the distribution and use of technology that can have
considerable social bearing.
A classroom interacts with outside social systems, which can have considerable bearing
on the culture of a classroom (Nespor, 2000). Meaning and purpose of a technology can be
considered beyond the generally accepted notions and definitions (Nye, 1990; Trevor and Bijker,
1984).
Research Questions
Considering the increasing presence of technology in the classroom and with such a
substantial outlay of capital for one specific technology, the researcher was driven to investigate
how a science classroom functions with the addition of graphing calculator-based technology.
This study was aimed at interpreting the culture of a science classroom--how teachers and
students talk about science; how technology is used; what inscriptions are produced as a result of
using graphing calculator-based technology; how those inscriptions are used; and, what students
make of the inscriptions. The researcher wanted to understand how inscriptions are produced
and used in science classrooms by studying graphing calculator produced inscriptions and the
discourse of teachers and students using technology as an artifact in the culture of a science
classroom.
This study was designed to address the following questions and sub-questions:
1. What goes on in this science classroom?
30
• What does the teacher do?
• What do the students do?
• What kinds of activities take place?
• What kinds of interactions take place?
• How do the participants behave?
2. How do teachers and students use graphing calculator-based technology?
• What science content and pedagogy is involved?
• How do activities take place?
• How is probeware a part of what goes on?
3. How do teachers and students talk while using graphing calculator-based technology?
• What do they talk about?
• How do they talk?
• How is science talked about?
4. What is the nature and form of inscriptions produced as a result of using graphing
calculator-based technology?
• What do the participants make of the inscriptions?
• What meanings are connected to inscriptions?
• How do teachers and students use inscriptions?
5. How do social interactions occur when students work with graphing calculator-based
technology?
• How is socially constructed understanding reflected in inscriptions?
• What motivates students to negotiate social meaning?
6. What social meaning does graphing calculator technology have within the culture of
the classroom?
Methods
Using ethnographic methods, a case study of one secondary, team-taught,
Environmental/Physical Science (EPS) classroom was conducted. EPS is generally considered an
alternative science class for eleventh and twelfth grade students needing another science credit to
graduate but not having the academic success for Advanced Biology, Chemistry, or Physics.
The class had an enrollment of 23 students (fifteen boys and eight girls), mainly from middle
31
class and suburban or semi-rural backgrounds. The class had one minority student (African-
American) and all of the students were English-speaking with English as their primary language.
At the time of the study, ten students were classified as students with disabilities with Individual
Educational Plans. The instructional team consisted of a science teacher (Ms. Marshall) and a
special education teacher (Ms. Turner).
Data Collection
Spending time in a setting was essential for the goals of this study to familiarize the
researcher with the setting and to get to know the participants. Considering the research
questions and theoretical framework, the researcher set out to gather data primarily from
observations, interviews, videotape recordings, and documents.
Observations and field notes. The researcher approached fieldwork with the following
assumptions:
1. Field notes interpret what the researcher observes and experiences but are not
regarded as fact or reality.
2. There is no one "true" or "correct" way to write about what is observed.
3. Any observation involves the selection of certain interactions over others; therefore, a
complete picture is never obtained.
4. The researcher interprets "social life and social discourse…which are products of and
reflect conventions for transforming witnessed events, persons, and places into words
on paper " (Emerson, Fretz, and Shaw, p. 8).
5. Interpretations reduce and present the meanings and understandings the researcher
gains from experiencing an event.
6. The nature and form interpretations take reflects the researcher's basic philosophical
assumptions.
Regular, ongoing classroom observation was the main activity in the field. Fieldwork
was conducted in the classroom for two or three class periods per week from March to June
2000. The researcher took detailed field notes directly into a laptop computer whenever
possible. When graphic representations or quick interactions precluded being electronically
rendered, the researcher relied on handwritten notes, sketches, and memos in a field notebook.
Interviews. Altogether, eleven formal, taped interviews were conducted. Five students
participated in brief (10 - 15 minutes) interviews before class or during non-instructional time.
32
Each cooperating teacher was interviewed twice and the science department chair was
interviewed for information regarding larger school and department policies. Another EPS
teacher at the school was interviewed as a means to deepen the understanding and for validating
other information regarding EPS as a culture. The science content supervisor of the school
division was interviewed regarding larger policy issues and her experience with technology. An
approach adapted from Briggs (1986) was used for designing interview questions. Some
questions were aimed at gaining important factual information, but more often, open-ended
questions were asked to promote a more meaningful, richer discussion. The researcher tape
recorded and took notes during interviews. The researcher used an approach adapted from
Briggs (1986) for interviews. The researcher was mindful that interviews are interactive
discursive events that have many meanings and interpretations.
Videotaping. The researcher made four videotape recordings in the classroom. Taping
was mainly focused on small group or whole class activities involving graphing calculators and
probeware. Videotaping assisted the researcher in studying the complexity of social discourse
and meaning negotiation and how those processes relate to the culture of the classroom. Because
videotaping inherently focuses on certain activities in the classroom, other activities are omitted.
Therefore, the researcher took field notes to augment videotaping. The researcher transcribed
videotapes verbatim and coded the documents soon after taping.
Documentation. Documents such as completed lab reports, including graphs and tables,
produced by students, quizzes and tests administered by the teachers were collected and
examined during the course of the study. Documents were analyzed as inscriptions, rich with
socially negotiated ideas and concepts explored during specific learning events involving
graphing calculators and probeware. Also collected were students' unit organizers and their
portfolio folders.
Researcher's Relationship with Participants
Upon entering the field work portion of the study, the following assumptions were made:
1. The researcher rejects any notion of being a neutral, detached observer.
2. The researcher must be immersed fully yet "naturally" in the lives of the participants
in order "to grasp what they experience as meaningful and important" (Emerson,
Fretz, and Shaw, p.2).
33
3. The researcher's presence will invariably have some impact on what takes place since
some interaction with participants is unavoidable. However, this impact should not
be seen as "contaminating the environment."
4. The researcher experiences the social terms and grounds as members of the culture do
while in the classroom. In this way, the researcher can see what participants see; feel
what participants feel; and learn as participants learn.
5. Active participation can heighten a researcher's understanding and interpretation.
The researcher offered technical and pedagogical assistance to the teacher(s) as a way to
reciprocate the teacher for agreeing to be involved in the study, although was called upon only
infrequently. As part of the validation process, the researcher also offered to share perspectives,
ideas, and preliminary findings developed during the research process.
Site Selection and Sampling
The researcher performed a purposeful sampling of one secondary science teacher who
agreed to participate. The cooperating school division's science supervisor recognized this
teacher as a regular user of graphing calculator technology. All Environmental/Physical Science
students of the selected teacher were involved in the study in the sense that they were in the
classroom with the researcher at the same time. However, only student participants who signed
(along with parent signatures) and returned student assent and parent consent forms (Appendixes
G and H) were videotaped or participated in other parts of the research such as interviews. All
students signed assent forms and about half of the students returned parent consent forms.
Data Analysis
Data were analyzed as a reflective process with an ongoing, interactive approach
throughout the study. Audio and video tape recordings, and field notes were transcribed into a
word processing program. After data were transcribed into separate files, lines of text were
numbered for reference. Each document was carefully scrutinized and sections of text that
pertained to the research goals, questions, and emerging ideas were highlighted. Analytic
memos or notes synopsizing the text accompanied each highlighted section of a document.
Preceding each document, an index of memos, notes, and corresponding sections of text was
created for quick reference. Subsequently, a conceptual diagram was designed to connect the
indexed sections to the main research questions and emergent themes (see Figure 1). Finally, a
master outline was created organizing the research design including the central themes that was
34
used in constructing the body of the discussion.
The next chapter presents and analyzes data gathered while in the field. After a
description of the study site and participants, three vignettes depict life in the classroom as
students and teachers use graphing calculator technology. The subsequent discussion includes
portions of interviews with students and teachers to give the reader a deeper sense of the
participants' views and to elucidate the researcher's interpretations.
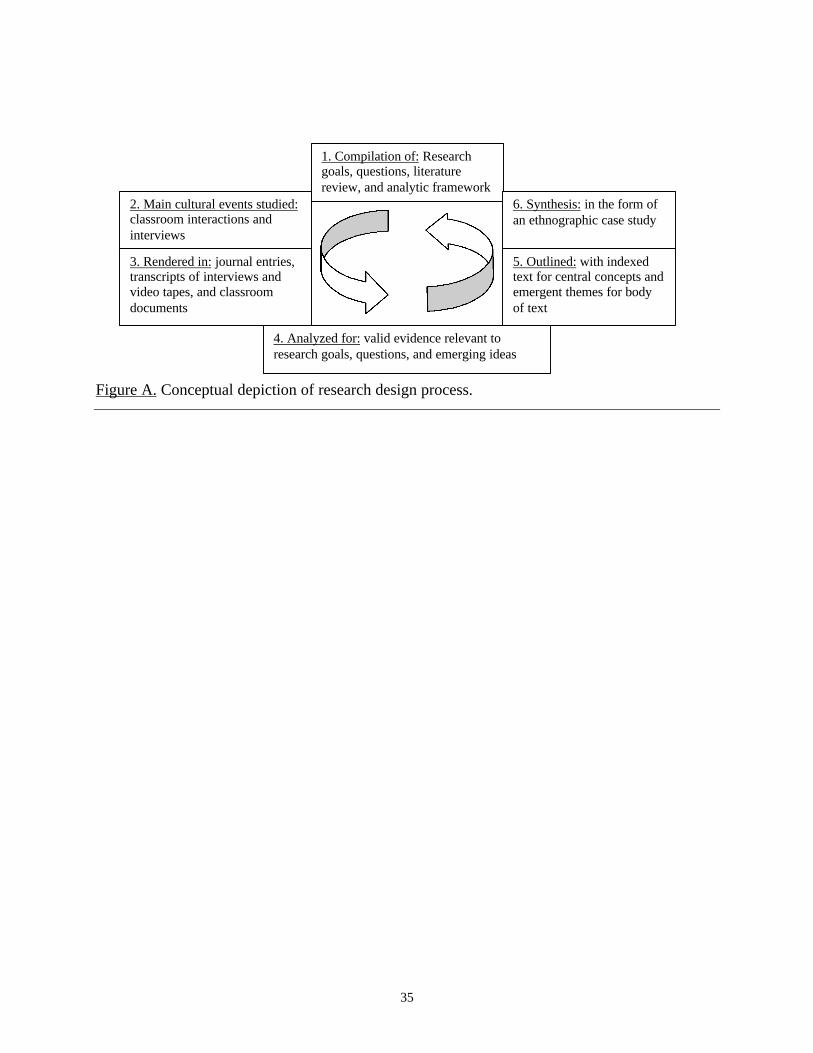
35
Figure A. Conceptual depiction of research design process.
2. Main cultural events studied:classroom interactions andinterviews
3. Rendered in: journal entries,transcripts of interviews andvideo tapes, and classroomdocuments
4. Analyzed for: valid evidence relevant toresearch goals, questions, and emerging ideas
1. Compilation of: Researchgoals, questions, literaturereview, and analytic framework
5. Outlined: with indexedtext for central concepts andemergent themes for bodyof text
6. Synthesis: in the form ofan ethnographic case study
36
Validity
The researcher followed the suggestions of Hammersley and Atkinson (1995) and
Maxwell (1998) which included respondent validation and triangulation of data sources. In
addition to responding to the researcher's interpretations and judgments, participants provided
additional knowledge that added detail to the context and interpretation, otherwise unknown to
the researcher. However, information from participants was not regarded as the "truth," rather as
one source of data, so the researcher also used triangulation of other data sources. Video and
audio tape recordings, documents, and detailed field notes allowed the researcher to check for
interpretive accuracy and consistency across sources. The researcher compared data relating to
the same idea from different stages in fieldwork or from the accounts of different participants.
As part of a reflexive ethnography, the researcher considered plausible alternative explanations
while the study progressed and at the conclusion of fieldwork.
Having been a high school science teacher for twelve years, the researcher was acutely
aware that classroom life would seem familiar and could lead to assumptions and the potential
for omissions. Details of social life, fundamental in ethnography, must be included in a
comprehensive interpretation.
Because the researcher felt that the participants should have the opportunity for access to
information, students and teachers were provided uncompromising information regarding the
scope and intent of the study. Participants were informed that even if they participated initially,
they had the option to withdraw from the study at any time. In addition, participants had
opportunities to give input regarding the data gathered throughout the research process. Since
there may be some political aspects to consider if the information received or reproduced in
misinterpreted or revealed without consent, the researcher made every effort to protect those
involved to the fullest extent.
Ethical Considerations
The researcher proceeded with the study on the basis of the following:
1. While observing the classroom and the procedures and interactions that occur there,
teachers and students may feel some reaction to the researcher's presence.
2. Regardless of what a researcher says or does, some teachers or students may see the
researcher as having some power or influence.
37
3. Clear, direct, non-technical language in written and verbal communications will be
very important.
4. It will be very important to be professional and maintain good rapport with educators
and students with whom the researcher has contact.
The researcher cooperated with those in the study by considering such things as policies,
schedules, planning, and communication. Whenever possible, the researcher tried to adequately
plan for events and attempt to anticipate possible problems before they occur. The researcher
worked from the American Anthropological Association ethics guidelines that state,
"Anthropologists' first responsibility is to those lives and cultures they study. Should conflicts of
interest arise, the interests of these people take precedence securely over other considerations"
(AAA, 2000).
Although it never came up, in instances where information is revealed that indicates
abuse, impending danger, or otherwise harm to persons or property, the researcher's
responsibility was to reveal this information even though it could compromise the confidentiality
of the research participants. Students' and teachers' identities were the highest concern since they
were the primary participants in the study. The collected data were held in anonymized form and
kept confidential. Above all, the researcher made every effort to avoid causing any harm or
embarrassment.
Summary
A researcher has experiences and beliefs that greatly influence the approach,
implementation, and interpretation of a study. What the researcher learned as a classroom
teacher and in graduate school impacted how this study was conducted. While looking at the
functioning of a science classroom, the researcher considered technology as a cultural artifact--
replete with social significance and meaning.
The researcher employed a social constructivist framework for the goals and purposes of
this study. As such, the researcher considered the processes and interactions that occurred as
social in both nature and function.
The prior studies were selected based on research questions that were designed to
examine social processes such as the use of technology, language, and representations in a
science classroom. The questions were open-ended in nature, and summoned the researcher to
make in-depth, detailed descriptions and interpretations of classroom life.
38
The data collection methods assembled a spectrum of information in different modes,
situations, and times during the course of the study. While in the field, the researcher made
regular, conscious efforts to be reflective of the researcher-participant relationship.
Data were analyzed by carefully examining classroom documents, the researcher's daily
journal, and transcribed observations and interviews. The researcher collected and indexed
pertinent data to address the study's main goals, research questions, and emerging themes.
Finally, the results were organized and presented in Chapters III and IV.
Research validity and ethical considerations were discussed at the end of the chapter.
Validity was ensured by collecting data from different sources at different times during the
study. In addition, information was subject to both participant and peer review and validation.
Lastly, the researcher was guided by American Anthropological Association's guidelines for
ethical research. As explained, every effort was made to ensure a confidential and ethical study.
39
Chapter III
Introduction
The Site: Andrew Flood High School
Andrew Flood High School is a public school with an enrollment just over one thousand
students in grades nine through twelve. Flood is one of four high schools in suburban school
district in southwestern Virginia. Most of the students that come to Flood High School come
from adjoining Andrew Flood Middle School. The minority enrollment for Flood in 1999 was
4.4 percent. Flood has a long history in the community dating back to 1924 when it originally
opened. At that time, the school was at a different location and was named after the town in
which it was located. In 1933, it was renamed Andrew Flood High School and remained until it
was moved to its current location in 1969. The school is departmentalized into: Business,
English, Math, Science, Social Studies, Health & Physical Education, and Special Education
classes and has eighty-five faculty members teaching over one hundred classes. Science classes
meet every day during the 180-day school year.
Environmental/Physical Science (EPS)
All science classes have curricula mandated by the William County Public School Board.
The curriculum for EPS, as with other secondary science classes, is developed primarily by
content area teachers under the guidance of the science supervisor and is approved by the school
board. According to the course description, EPS has no prerequisites for enrollment and is a
survey course in which basic principles of ecology, earth science, biology, physics, and
chemistry are taught with an emphasis on technology and environmental issues. Altogether,
there are three EPS classes at Flood. One of the classes is team-taught--the class chosen for the
study--but the other two classes are not.
At Flood, science classes are typically organized into heterogeneous groups such as
Advanced Earth Science, College-bound Biology, and Advanced Chemistry, especially those
that are considered to be academically challenging. Like many school systems, students are
tracked into grouped classes considering such things as past academic performance, standardized
test scores, and career interest. EPS typically has students who score at or below average in
science and math ability. EPS students will usually either enter the work force or attend a
community college or trade school upon completion of high school. Most students in the school
division take Earth Science in ninth grade and Biology in tenth grade. To get a standard
40
diploma, students must have three laboratory science classes. Consequently, most EPS students
have already had two science courses, usually Earth Science and Biology. Typically, these
students enroll in EPS as a third laboratory course rather than Chemistry, Physics, or Anatomy
and Physiology for their other course to meet graduation requirements.
At the state level, the Virginia Science Standards of Learning have sections for the
traditional offerings of Earth Science, Biology, Chemistry, and Physics but not for "alternative"
secondary science curricula such as EPS. As such, there is no end-of-the-course state testing for
EPS either. As a result, EPS teachers have greater latitude in determining the organization,
content, resources, and forms of assessment for their classes. Appendix A summarizes the scope,
content, and sequence of the course while the study took place.
An evolving curriculum. Over the last decade, Flood has offered a series of alternative
science courses aimed at a similar population of students. Available for the last three years,
Environmental/Physical Science was preceded by Applied Physical Science (APS) which was
also offered for three years. General Science preceded APS and had been offered for as long as
anyone at Flood could remember. Like its successors, General Science was interdisciplinary in
nature and broad in scope. The General Science curriculum consisted of a quarter of Biology, a
quarter of Physics, a quarter of Chemistry, and a quarter of Earth Science. APS was similar to
General Science, but was more focused on the physical sciences (Chemistry and Physics) and
less on the natural sciences (Biology and Earth Science). EPS marked a shift back toward the
natural sciences, a trend that continued the year following the study when EPS was be replaced
by Ecology.
These rapid changes in EPS are not isolated events. At the root of these changes are
broader educational issues that have surfaced within the school system recently in regard to
special labels given to classes. Classes that once were referred to as "Special Materials,"
"Applied," and even "General" were sometimes thought of as "watered-down" versions of other,
more demanding, academic courses. Applied Physical Science suffered from several
confounding connotations. Physical Science is a course typically taught in the eighth grade, and
Physics was for a relatively few number of high school juniors or seniors that had successfully
completed Chemistry. The terms "Applied" or "General" in a course title mean a certain social
stratification, not just for the course but also for the students and teachers involved. Applied
science is associated with a vocational track--for students going into a trade or two-year college
41
upon graduation. Changing the name (and curriculum) from Environmental/Physical Science to
Ecology is the latest stage in the evolution of an alternative science class for students less
academically oriented.
Participants
Teachers
The study involved two teachers in a team-taught, inclusive classroom. A team-taught
class combines a regular education teacher, Ms. Marshall, and a special education teacher, Ms.
Turner. Briefly put, inclusion means placing students with disabilities in a general education
classroom.
Ms. Lynn Marshall. Ms. Marshall has short, red hair and is about five feet eight inches in
height. Her posture is erect and rarely was she seen sitting in the classroom. Whether she is
addressing the entire class or conversing with a seated student, it is her voice that will likely be
heard. It is apparent that she has the most influence on what goes on in the classroom. She said
she has been teaching at Flood for 28 years.
Ms. Betsy Turner. Ms. Turner said she started teaching in 1980. She explained her
degree is in special education and her first job was in a nearby county working with mildly
retarded students. She explained that over time the population "seemed to change" and so she
began working with students with learning disabilities (LD). She said she enjoyed working with
that population of students. She started working at Flood in the late eighties and shortly after
began team teaching with Ms. Marshall.
Students
A total of 23 students in grades 10, 11, and 12, (ages 16 through 18) were enrolled in the
EPS class that was studied. Most of the students were from middle-class families in an area that
is, as Ms. Marshall explained, more rural and less affluent than other schools in the county.
In-class behavior. In an interview, Ms. Turner explained how the students in this class
were easier to work with compared to the previous year. She described last year's class as
having students that were angry at times and if they did not like something they might "just blow
up." She said there were students who were constantly trying "to dominate" the class. She said
students complained about things and made comments like "I don't understand this," "I can't do
this," "This is stupid," and "Why do we have to do this?" She described this year's class as "a
really nice class." She said the students are "well-behaved" and "able to work independently."
42
Having a group of students perceived as being "really nice," "well behaved," capable of working
independently, and "passive", made it easier for Ms. Turner and Ms. Marshall to engender trust
and respect on a consistent basis.
Attendance. Ms. Marshall and Ms. Turner said there were attendance problems in this
class. One student, Ms. Marshall explained, has been "in and out of correctional institutions
during the school year and misses classes occasionally to meet with his parole officer." Another
student has a two-year old child. One had ear surgery after missing 42 days of school the first
semester for illness.
Typically, one or two students would arrive after the bell, an offense Ms. Marshall chose
to handle in a way different from school policy. School policy states that after receiving a
warning for the first offense, a student is to be assigned before or after school detention period,
but as Ms. Marshall explained:
Normally anybody who's tardy, I have to write 'em up for being tardy and assign 'em a
detention. Well, I would spend my whole morning writing detention slips. So I choose
to give them an attendance grade. And every time they're unexcused tardy, they lose a
point. Every time they have an unexcused absence, they have two points off. And at the
end of the nine weeks, I count up their unexcused absences and tardies and subtract it
from a hundred and that's the grade they get averaged with everything else.
Ms. Marshall felt it was unjust to assign a half-hour detention for a two-minute tardy. On the
other hand, she didn't feel that ignoring a student's tardiness was effective either. She felt that
assigning an attendance grade was less time-consuming for her and could serve as a reward for
those students who "come to class everyday and are on time" with a grade that could improve or
strengthen their overall nine-week average. In this way, Ms. Marshall minimizes punishment
and has found a reward system to be more effective at handling what she considers a minor
offense.
Special needs and individual educational plans (IEPs). Ms. Marshall said that ten of the
students were receiving special education services. One student was functionally deaf. His
teachers wear a battery-powered microphone interfaced with his hearing aid. Another student
has been placed on homebound instruction because of severe asthma. This student missed 22
classes the first nine-weeks because the breathing treatments that enabled him to function at
school often took place during science class. Two other students have learning disabilities that
43
"make it very difficult for them to read and interpret graphical representations or written
material." Ms. Marshall explained that whenever possible, they were "encouraged to complete
written assignments on the computers that are provided in the classroom." Ms. Marshall said she
had several other students with learning disabilities but that their disabilities were "relatively
minor." She said she felt it was a good idea to vary how content is presented and to try to
incorporate multi-sensory experiences, if possible.
Another concern Ms. Marshall identified was with "emotionally needy students who
demand constant attention." Some of the other issues she and Ms. Turner mentioned were short
attention spans, trouble processing new words, and understanding abstract ideas. Nevertheless,
these students required the teacher to adjust the time for the completion of assignments as well as
extra instruction on class assignments.
The researcher talked to Ms. Turner about several of IEPs for the students that receive
services from the Special Education department at Flood. If a student has been identified and is
determined to be eligible for special education services, an eligibility team decides what special
education and related services are needed and what the educational program will be. IEPs
typically include these four basic components:
1. Present level of educational performance
2. Annual goal(s)
3. Short-term objectives
4. Evaluation
For confidentiality reasons, Ms. Turner asked that these students not be identified even
by pseudonym. Of the ten identified, most were labeled with a specific learning disability
(SLD). One student's disability was labeled as emotional disturbance (ED). This student's IEP
elaborated that she suffered academically due to "negative social interaction" and should receive
special education services 42 percent of the time. Another student with a specific learning
disability "has difficulty preparing for tests and getting assignments done accurately, completely,
and on time." A third student, also receiving 42 percent services, had a specific learning
disability that "affected perceptual organization, non-verbal skills and processing."
Having students with such a wide range of disabilities in one classroom requires many
considerations and accommodations in planning and designing instruction. While Ms. Marshall
has had the benefit of teaming with an experienced special education teacher, such as Ms.
44
Turner, the amount of time they are given together to plan and assess instruction has not been
consistent. This year they had no common planning period. As such, Ms. Marshall and Ms.
Turner are forced to find other times in their busy schedules to communicate. Since they have
been working together for years, they have learned many ways to collaborate and have
developed what Ms. Marshall called "a strong working relationship" without the benefit of being
given professional time together.
Vignettes
To illustrate what went on in the classroom while students used graphing calculators and
other technology, three descriptive vignettes of classroom interactions are presented below.
Each vignette includes a description of the actions and dialogue that took place as students and
teachers went about applying technology to the content of the course. Following each vignette is
an analysis of what happened and how it relates to the study.
The chosen vignettes detail the use of graphing calculator technology and the complex
interactions that occurred in the classroom as students and teachers performed content activities.
While the selected vignettes specifically address research questions two through five, they
should also give the reader a deeper sense of classroom life. The raw data for each vignette
came from videotapes and field notes.
Vignette One was chosen primarily because it was the only instance when probeware was
used with graphing calculators. Students had used probeware earlier in the year, but it was
before the researcher began this study. Vignette Two and Vignette Three involved participants
using graphing calculators independent of probeware. In this way, the use of technology could
be considered at different times, in different venues, for different purposes.
Vignette One: Passive Solar Homes
This vignette comes from activities that took place over three days (March 20 - 22, 2000)
while the class prepared, performed, and concluded a laboratory investigation involving the
concept of passive solar energy. Since class periods are fifty minutes in length, it is often
necessary to extend activities over several days.
Day one: Preparation. Day one takes place during the last fifteen minutes of a period. In
this segment, the main instructional event is an introduction to the upcoming lab activity. Ms.
Marshall briefly goes over the procedure, shows students the lab equipment they will be using,
45
and demonstrates how to set up a graphing calculator, an interface device (CBL), and a
temperature probe.
Ms. Marshall first asks students to look at the introduction to the lab and reminds them to
keep the definition of active solar in mind and to think about how passive solar compares to
active solar. She then reads aloud the definition of passive solar structures followed by the main
purpose of the activity: "Students will examine six different passive solar homes and determine
which design is the most effective in stabilizing the indoor temperature." It is assumed that the
students understand what "most effective in stabilizing the temperature" means and there is no
further discussion of the concept prior to the lab. However, it will prove to be a point of some
confusion later.
With the solar home models in front of the room, Ms. Marshall asks students to predict
and record which "solar home that is able to stabilize the temperature the best is (blank)
because…." She is expecting students to fill in the blank (see Appendix B) and to explain their
answers. Ms. Marshall then puts the homes in a line so the students can see them and begins to
talk about the features of each. She explains that there are some experimental constants between
the houses, "these little homes are just made out of the same board as the science fair projects.
And they cut them with those Exacto knives and made the triangular, prism-shaped houses with a
piece of transparent tape over the front."
She then asks students what they "know about the colors" used in the first house. One
student responds, "that they're white," to which Ms. Marshall responds, "…white floor and a
white ceiling…." The second house, as Ms. Marshall points out, has a black floor and white
ceiling. And she reminds them, "you're thinking which one is going to stabilize the temperature
the same the best." She then alludes to an instance in which they discussed "why black absorbs."
The third house has white surfaces inside but has small vials of water on the floor. Ms. Marshall
introduces the term "heat sink," which in this case, is water. Ms. Marshall elaborates, "the water
here acts to absorb the heat that comes in." The fourth house, Ms. Marshall explains, "is black
but you have a thermal mass. You have a big piece of black metal in there." The fifth house has
a black floor with a reflector in it. The sixth has a sponge-like material on the floor and on the
roof that Ms. Marshall refers to as insulation.
Ms. Marshall again asks the students to hypothesize--to choose a house that they think is
going to "stabilize the temperature the most…and then tell why you think that one is going to

46
stabilize the temperature the best." She then suggests that they "do not have to put down the
same thing as the people at your table. As a matter of fact, it would be better if you put down
something different. So, don't even look at theirs. Just write down what you think." The room
becomes quiet as students appear to be thinking and writing. Ms. Marshall slowly moves around
the room, going from desk to desk, stopping to read what students are writing or to answer
questions. She asks, "why did you choose insulation? Tell me why, not just because it was
insulation." She then emphasizes that, "This is just a guess. It's not something that you have to
be correct at." She is trying to direct students away from trying to guess the correct answer and
encourage them to make a justifiable prediction.
Ms. Marshall then announces that she is going to show them "the setup that we're going
to use, so that tomorrow when you're working with the equipment, there won't be any problems."
She reassures them that since they have used graphing calculators all year, their familiarity
should preclude having any problems. Ms. Marshall holds up a CBL and explains that "CBL"
stands for "calculator based lab." She tilts the CBL (see Figure B) forward to expose the
openings on the front and side and explains that probes "measure certain environmental
conditions." She pauses for a moment and asks Richard and Edward to get their heads up off
their table. "I wish you wouldn't do that right now," she implores. Edward and Richard both
raise their heads and she responds, "thank you" and continues.
Ms. Marshall explains that they are going to be using a temperature probe. She hands out
probes to nearby students and asks what probe each of them has. Each probe is labeled for
identification. Ms. Marshall explains that inside the CBL case will be three probes and that a
"little black tip" on the end can identify the temperature probe. She explains that they should
plug the probe into "Channel One. And there's only one way it will go." Ms. Marshall
demonstrates how to plug the probe into the CBL and how the CBL connects to a graphing
calculator by way of the linking cable. Once connected, she adds, "this will do the graph for
you. All you have to do is set it up, cut it on, punch a button, and it'll go."
Ms. Marshall warns students about what trouble other students have had with the linking
cable. She explains, "one mistake that students sometimes make is when they push them in, they
don't push them in hard enough and then your connections aren't made."
Ms. Marshall refers students to the step-by-step directions written for them on the second
page of the lab report and continues with a demonstration showing students how to put the probe
47
in the house and where to position it "so that it's measuring the inside temperature." She
suggests using a "little bit of tape to adjust this so that it hangs and doesn't hit the front or hit the
back but is measuring the air inside." She tells the students that the lamp has a 200-watt light
bulb and asks, "What would the light of that 200 watts represent?" A student responds, "the sun"
and Ms. Marshall repeats, "The sun. And you want to put it 25 centimeters from the surface."
She then demonstrates the procedure of turning the lamp on and starting the graphing calculator.
She explains that they will have a stopwatch to collect the data for sixteen minutes with the lights
on and then sixteen minutes with the light out "to see how heating up and cooling down is taken
care of in the houses." Finally, Ms. Marshall tells the class that each group's graph will be
combined to make one graph and they will look again at their hypotheses.
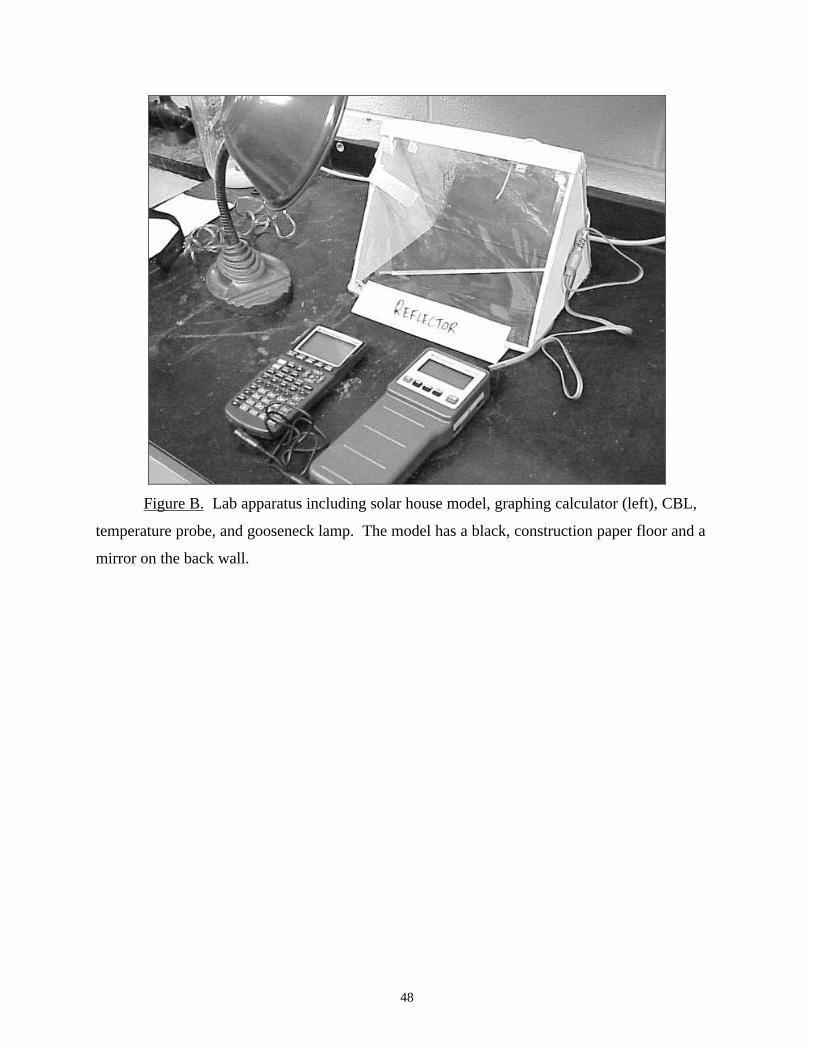
48
Figure B. Lab apparatus including solar house model, graphing calculator (left), CBL,
temperature probe, and gooseneck lamp. The model has a black, construction paper floor and a
mirror on the back wall.
49
DAY ONE ANALYSIS
In a sense, the instructional design of Day one acts as an advance organizer for Day two.
In a reassuring tone, Ms. Marshall explains to the students that since they have been using
graphing calculators "all year" (previously learned material), the unfamiliar technology of a CBL
and probe (new material) should be "no problem." Similarly, students' knowledge of active solar
design is invoked in introducing passive solar design. Active solar differs from passive solar in
that active uses a mechanical means of heat distribution whereas passive uses a natural means.
Previously learned material or prior knowledge is required to perform many of the tasks Ms.
Marshall expects of her students. The designs of the solar homes involve knowledge of how
colors (white and black) and materials (insulation and metal) can affect temperature.
Several scientific processes and concepts are introduced on Day one. Students are
engaged in the process of hypothesizing by asking them to make and explain a prediction (see
Appendix B). They examine six structures (process of observing) and are to determine which
structure (comparing) would have the desired outcome (cause and effect). Students treat the
unique design features of each house as independent variables and the common construction
features as constants. Students are expected to defend their hypotheses and findings. The houses
and their features serve as models for real-life materials and ideas. The 200-watt lamp is
analogous to the sun. Ms. Marshall stresses speculative rather than "correct answer" thinking.
Day two: Performing the activity. On Day two, students have one class period (50
minutes) to perform an activity that requires a minimum of 32 minutes to collect data. As such,
the main instructional activity that takes place involves students collecting data with graphing
calculator-based technology. The class begins with Ms. Marshall in front of the room giving
directions to the students. The classroom layout has been modified with pairs of tables to make a
"L" shaped arrangement (see Figure C). She said she thought the arrangement would "better
facilitate the space available" and she wanted them to use the technology "to work together in
cooperative groups." The class was split into five groups but due to the number of interactions
taking place in the room simultaneously, the students in one group (and the teachers) are the
main subjects. As in Day one, dialogue is intermingled with actions in an attempt to make a rich
descriptive interpretation of the event while students are using the technology.
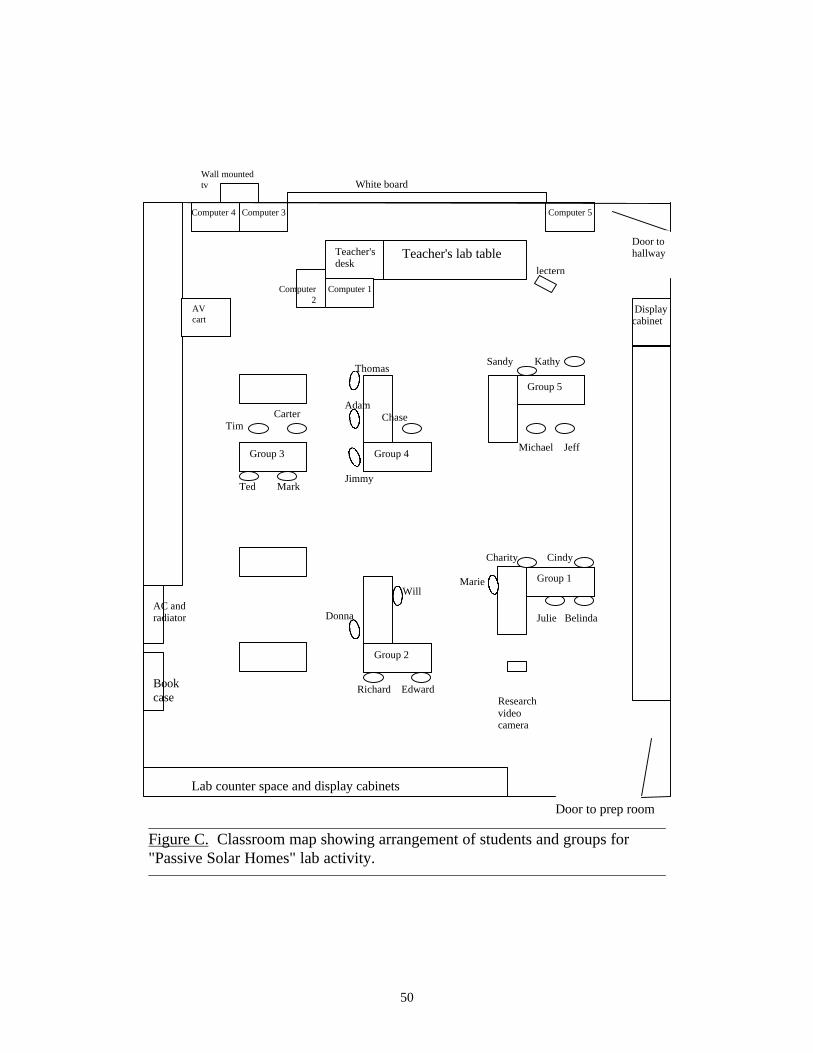
50
Door to prep room
Door tohallwayTeacher's lab table
Displaycabinet
Lab counter space and display cabinets
White board
Computer 1
Computer 3Computer 4 Computer 5
Computer2
AVcart
Teacher'sdesk
Bookcase
AC andradiator
Wall mountedtv
Researchvideocamera
Group 1
Group 2
Group 5
Group 4Group 3
lectern
Charity Cindy
Marie
Julie Belinda
Will
Donna
Richard Edward
Carter Tim
Ted Mark
Thomas
Adam Chase
Jimmy
Sandy Kathy
Michael Jeff
Figure C. Classroom map showing arrangement of students and groups for"Passive Solar Homes" lab activity.
51
Ms. Marshall explains that since she only has five lamps they need to make five groups
rather than six. She asks four or five students to move to other tables to make small groups. She
then asks them to decide in their groups which solar house they want to test based on their
hypotheses.
After a moment, Ms. Marshall directs students to go and get their equipment and warns,
"be careful with the houses that have something in 'em that could slide around." Students begin
to get up and move to the places in the room where lab materials have been placed. Ms.
Marshall moves around the room handing out a stopwatch to each group and announces, "I'm
bringing around the stopwatches. When it comes to plugging in the lamps, you're gonna get an
extension cord." Ms. Marshall then reminds those students without CBLs to get one and briefly
goes back over how to set them up as described in the lab handout: "It's gonna be in channel one.
Here's the calculators."
Group 2 (see Figure C) consists of three boys and one girl--Will, Edward, Richard, and
Donna. Edward and Richard sit at the same table customarily and share certain characteristics.
Both are relatively quiet and withdrawn. They seldom volunteer to answer questions and when
called upon, sometimes seem lethargic or unsure of how to respond. Ms. Turner said that once
seated, they "didn't like to get up out of their seats." Neither of them got up to get lab equipment,
instead they remained seated as Will and Donna gathered the needed materials. Even though
Will and Donna gathered the materials, Richard and Edward did take an active part in operating
the calculator and the CBL. At times Richard puts his head down on his desk. Will and Donna
seem to be comfortable in social situations, often talking or otherwise interacting with other
students and teachers.
As Will is watching Donna, who is looking at some personal photographs she had gotten
from her purse, Edward is positioning the house and Richard is pushing the buttons and looking
at the stopwatch. Ms. Marshall says to Group 2, "I'll give you a ruler. You all don't have a CBL.
You want me to get a CBL?" Ms. Marshall places a graphing calculator on the table in front of
Donna, and speaks to Will, "Will get that…(Ms. Marshall laughs) that thing, whatever it's
called…There should be another extension cord over there." Will gets a CBL, brings it back to
the table, and unpacks the probes and CBL from the case. Ms. Marshall asks everyone to get a
calculator. Donna then picks up the graphing calculator, slides the cover off, and slips the cover
52
in the groove on the bottom of the calculator in one smooth motion. Will is closely examining
the CBL while Donna examines the probes. Donna unwinds the temperature probe. Donna
passes the temperature probe to Edward and says, "that needs to go inside the house."
Donna tries to stretch the probe cable from where she's sitting to the solar house but the
cable is too short, so she passes the CBL to Richard and says, "here, give this to him." Donna
places the CBL in front of Richard on his book bag. Donna then picks up the graphing calculator
and begins to inspect the linking cable and the connecting port. Edward is placing the probe
inside the house through an opening in the top. Richard picks up the connecting end of the probe
and looks for the place to plug the probe into the CBL. He tries several places. Donna connects
the linking cable to the graphing calculator, picks up the other end of the cable, hands it to
Richard and says, "plug that in." Richard momentarily stops looking to connect the CBL and
probe and begins to look for a way to connect the linking cable to the CBL. He connects the
cable to the CBL and then continues to connect the probe to the CBL. Richard looks over to
Edward as if to ask for his input. Will directs Richard, "into channel one." Richard finds
channel one and tries to make the connection. Edward reaches across Richard's side of the table
and picks up the stopwatch. Richard twists the lamp toward the house. Edward picks up the
CBL and pushes the buttons on the front and looks at the data window as if to see if there is a
response. Richard asks Edward, "do you know what you're doing?"
Donna hands the calculator to Richard. Edward turns the light on. Ms. Marshall
approaches and says, "Well, let's follow the second page directions…. It'll tell you exactly how
to set it up. Okay?" Ms. Marshall then uses a ruler to check the distance from the light source to
the house and moves the house slightly and says to the group, "you might angle that down just a
little bit." Will is reading the directions from the lab sheet (see Appendix B) and says, "start
the…" but suddenly stops, stands up, and moves his chair around the inside of the table as if to
make it easier to read the directions while Richard and Edward operate the equipment. Will
reads the directions in short sentences, "press enter. Then press enter again." Richard listens as
Will continues to read. Donna watches the two of them while Edward appears to be looking at
the stopwatch. Richard is apparently getting a "Link Error" message on the graphing calculator.
Will picks up the calculator and explains to Ms. Turner, "it says 'link error.'"
Ms. Turner says "okay" and takes the calculator from Will. She tries to push the cable in
on the graphing calculator and says, "check your--make sure everything is tight." Will picks up
53
the CBL and he and Richard, in turn, try plugging it in and checking the connection manually.
Ms. Turner reads the error message aloud and hits the "Halt" button on the CBL and checks the
connection to the graphing calculator again.
Ms. Marshall approaches the table and asks, "where are you all on the set up?" Ms.
Turner replies, "we had a link error." Ms. Marshall points to the bottom of the CBL and
declares, "it wasn't in tight enough." Ms. Turner responds, "I hope that we've taken care of it."
Ms. Turner continues by restarting the program--rereading the directions to herself as she works.
She gets to the portion of the program where the type of probe is to be selected and hands the
calculator to Will and says, "Okay, now you're ready to select 'temperature.'" She moves away
from Group 2. Will reads the directions aloud while operating the calculator. Richard is looking
around the room. Will raises his hand. Ms. Marshall approaches Will, looks at the calculator
and says, "Right, uh-huh", nods and adds, "That's right. You're doin' fine, just follow those
steps…So when you're to calculate data, cut your light on, start the stopwatch, and you're ready
to go." Ms. Marshall announces to the class that while the experiment is running for the first
sixteen minutes, they should answer the questions in the lab report that have to do with passive
solar house design.
Will initiates his group to start the experiment, "On your mark. Get set. Go."
Edward turns on the light and Will hits the calculator button almost simultaneously. Richard,
seeking Ms. Marshall's approval regarding the positioning of the temperature probe asks, "Is ours
centered pretty good?" Ms. Marshall responds indirectly but affirmatively, "Sixteen minutes and
then cut your light off. While you're waiting, do these questions." Ms. Marshall flips Richard's
lab sheets to the page with questions (see Appendix B) and points to the questions and says,
"Look at these designs for solar homes, and see how you would answer that question right there.
The extension questions." She then walks away and warns the class, "Don't get burned on these
lamps."
Will and Donna are looking at the lab sheets. Edward points to the graphing calculator
and asks Richard, "Is that thing graphing?" Richard shrugs his shoulders. Will asks Ms.
Marshall an inaudible question to which Ms. Marshall replies, "You need the last page though.
I'll get you one."
Will corrects her, "No I have a copy of the sheet. I just need to copy it", and Ms.
Marshall offers, "You can get that from somebody in the group." She then points to the
54
calculator and asks the group, "You all have a graph going though? Yeah. See the first point.
Okay." They crane their necks to look at the calculator before Ms. Marshall puts it down on the
table. Edward picks up the calculator and examines the calculator window for a moment and
then puts it down. Richard puts the end of his pencil on the lamp. Richard comments about
what would happen to the bulb if you put water on it. Will looks again at the lab sheets and
Donna asks, "Has anybody got any Whiteout? Charity, you got any Whiteout?" Richard opens
his backpack and pulls out a bottle of Whiteout and hands it to Donna.
Ms. Marshall asks Group 2, "You got your design features? Do you? You know what
you're looking at to get them? Yeah, look at those houses." Richard thumbs through the lab
sheets, looks at the illustrations of the houses for a few seconds then closes the lab report, looks
up and does not answer the question. Ms. Marshall asks Will, "What's your graph doin' now?"
and Will responds, "It's still workin'…."
Students in Group 2 are conversing quietly but freely. Will is reading a question aloud
and Richard writes briefly and then stops. While Donna uses the Whiteout, Will appears to have
assumed her role as recorder.
Richard asks Ms. Marshall if he can go to the restroom. Ms. Marshall notices Donna
waving her paper to dry the Whiteout and asks, "What did you do, Donna?" Donna smiles and
says, "I had to Whiteout the paper right there." Richard gets up and exits the room. Ms.
Marshall asks Donna, "What did you put down that was wrong?" Donna responds, "I don't even
know. I think I put down--I didn't have enough room. Ms. Marshall says, "Okay."
Ms. Marshall asks Group 2, "Do you all have four features? Did you all finish your
comparisons and contrasts yesterday? Your circles for passive and active?" Donna flips through
the lab report. Ms. Marshall asks them, "You're just waitin' to collect your data, right?" Richard
has a lab report or some other paper that he and Donna are sharing to answer a question. Donna
tells Richard, "I think I wrote the notes on the back." Edward picks up the graphing calculator
and looks into the graphing calculator window.
Ms. Marshall asks the class, "Are your temperatures still climbin'? Any of 'em stable?"
She then moves toward Group 2, points at the graphing calculator window with a ruler and says,
"That's pretty good."
Ms. Marshall announces to class, "I'm gonna bring you a piece of tape. I want you to
write on your calculator which house you have, in case, so we can save our data for analysis for
55
tomorrow." Richard returns and sits down. He looks over to the papers Donna and Will have
been working on. He appears to be having trouble reading what is written on the paper, which is
positioned at a right angle from him, so he and Donna turn the paper to make it easier to read.
Ms. Marshall tells Group 2, "On the case on your calculator, write that you all had the
insulation one" and hands Edward a piece of tape. Richard looks at Donna's report and appears
to be copying an answer.
Will asks Edward, "How much longer we got, man? This thing's givin' me a headache.
How much longer we got?" Edward looks at the stopwatch and responds, "…five minutes."
Students in Group 2 appear to be waiting for the time to be up for the first part of the experiment.
They are mostly out of the frame and engaged in quiet conversations. Donna discusses the
questions on the lab with Will. Edward is monitoring the stopwatch and the graphing calculator.
The CBL is facing Richard. Edward picks up the graphing calculator. Edward stops the
stopwatch and Richard turns the light off. Richard reads the numbers in the CBL display
window aloud, "Forty nine point three."
Will challenges, "Somebody touch that [light bulb]. It's only two hundred watts."
Edward puts his right hand on the front plastic film covering the box. The lamp is turned off and
the students begin behaving as if the experiment is over. One student is talking about going on a
date with another student. Donna yawns and announces, "This is boring. Now that we're
finished, what do we do?" Will responds, "Wait until the teacher says." Will looks over into
house and then feels the surface of the plastic film window. Edward feels the surface of the
window.
Although the calculator program is still running and Ms. Marshall went over the
directions, there is confusion about what to do next. Will looks over at the calculator and asks
Edward, "Hey, why is it still sampling, man? Why's it still samplin'"? Edward responds, "It's
still going down." Will apparently thinks the experiment is over and says, "You're supposed to
push enter, man." Edward is not sure what to do either and responds, "Oh, are we?" Will
reasserts, "Yeah, push enter." Donna, seeing the need for direction, asks Ms. Marshall, "What do
we do when we're done?" Ms. Marshall points to lab report on the table and responds, "Well,
what did you put down for passive?" Will repeats the question, "Is it supposed to still be
sampling?" Ms. Marshall responds, "Yeah, 'cause it's set up to go for thirty two minutes. So, it'll
sample with sixteen with the light off and sixteen with the light on." Will responds, "Oooh."
56
Ms. Marshall continues, referring to the questions on the lab sheet, "We want to see how
much time it takes to cool off. You know it's supposed to climb. The question is how much.
Okay what else you got here? Richard, is there a heat exchanger in there? No. Is there anything
in there to circulate water? No, okay. Is there a collector in there?" Richard answers, "Yeah."
Ms. Marshall inquires, "Show me a collector." Edward points to the inside of the box. Ms.
Marshall corrects Edward explaining, "That's insulation. That's not a collector. A collector was,
remember that thing I showed you the other day that had tubes runnin' through it?" Will and
Donna write in their lab report. Richard and Edward are not writing. Edward raises his hand.
Will passes his paper to Donna. Richard begins to look over to Donna's desk to the paper Will
just passed her.
Ms. Marshall announces to the class, "I'm gonna get the lamps out of the way before the
next class comes in. Most of you are finished…"
Will, referring to a question on the lab sheet asks the others in his group, "What else do
they have in common guys? Donna responds to Will's question, "You didn't even get the first
one." Will looks at Edward and asks, "What else is another similarity?" Will gets no response.
Ms. Marshall reminds Group 2, "You all need to be sure you write down on this what
your house setup is so you can put it on the back of the calculator and use our data tomorrow."
Will asks Ms. Marshall, "It's, ah, insulated?" Ms. Marshall responds immediately,
"Insulated." Ms. Turner repeats, "Just write insulated." Richard begins to pack his book bag.
Will hands a piece of tape to Edward and says, "Here put this on the back of the calculator."
Ms. Marshall tells Group 2, "If yours is not quite finished let it run and I'll get my next period
class to stop 'em."
Ms. Marshall praises the class, "Folks, I'm really proud of you. You did a nice job of
following those directions and getting your lab set up. Pat yourself on the back. You did a nice
job today." Around the room, students are putting their papers in their book bags, standing up,
putting the equipment away, and putting their chairs back under the lab tables.
Ms. Marshall begins talking louder now to get students' attention, "Folks tomorrow we're
gonna look at our graphs. Compare all five graphs and see how your hypothesis turned out.
Were you pleased with your results?" One student responds, "Yes."
Ms. Marshall comes over to Group 2 and says, "It's done. Look. There's your graph.
See it? (see Figure D) It's done. So you can cut this off now." The bell rings to end the period

57
and students exit the room. Ms. Marshall and Ms. Turner collect calculators as students pass by
on their way out. During her planning period, Ms. Marshall downloads the data from each of the
calculators to a classroom computer with a graphing software program.
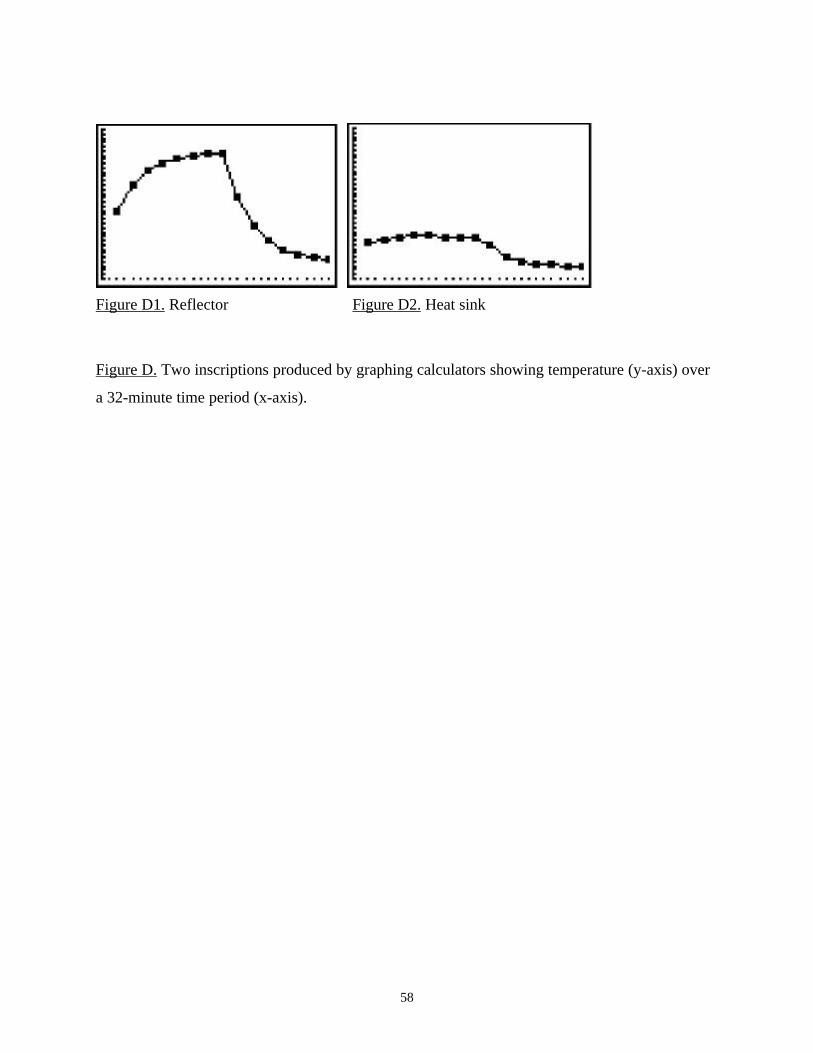
58
Figure D1. Reflector Figure D2. Heat sink
Figure D. Two inscriptions produced by graphing calculators showing temperature (y-axis) over
a 32-minute time period (x-axis).
59
DAY TWO ANALYSIS
Student groups are arranged based on what would be the most convenient for students.
Although most of the tables had been rearranged, students in Groups 2 through 5 moved very
little from their typical position in class. Later during an interview, Ms. Marshall said she
wanted students to work "in cooperative groups," but any specific considerations toward that end
were not made apparent. However, the students in each group appeared to be cooperative and,
for the most part, engaged at some level. Ms. Marshall said that because she only had five lamps
and two students were absent, she asked three students to move to make up other groups. Donna
sat next to Will in Group 2 and Charity and Marie joined Group 1. Donna often sits with Will,
particularly when Larry is not in class which was the case fairly often. Group 1 ended up with
five girls, which for this activity, may have been one student too many. There were times when
one or two of them seemed to have no role in the function of the group. Since the lab was
designed for six models to be used and there were only five groups, Ms. Marshall said she
performed the sixth experiment after school that day for the other EPS teachers. Since Ms.
Marshall has more experience with alternative students and as a teacher, she sometimes helps
newer EPS teachers with content or technology.
Although typically withdrawn, Edward and Richard assumed active roles in the
functioning of Group 2, particularly when it came operating the graphing calculator technology.
Graphing calculator technology did several things in the performance of this activity. First of all,
it takes precise, periodic temperature measurements for the students, which meant members of
Group 2 did not need to know or even be aware of the temperature--what it was or how it
changed--during the activity. In fact, the temperature display on the CBL was noticed and read
aloud only one time. Secondly, since the calculator stores the measurements it takes, group
members did not need to record any data. Although students were given questions to answer
during the 32 minute time period the program was running, there were times when students
seemed disengaged, or were not sure what to do, or needed prompting to do anything. And,
since the calculator takes the data and creates an inscription, students had only to look and make
sense of what was produced. Unfortunately, the inscriptions produced were not labeled (see
Figure D) with units or numbers. Many students, due to the size of the screen, position of the
calculator, or role within a group, had a limited exposure to the inscription. In addition, due to
the length of the activity and the class period, some students had to leave before their data
60
collection was complete. About the only technical problem that occurred was with the
connection between the graphing calculator and the CBL. That has been an issue as long as the
technology has been on the market.
In listening to students and teachers talk, there seemed to be reluctance at times, to use
certain words. There seemed to be instances when using a non-technical term or even
misnaming something was preferable. For instance, Ms. Marshall, when asking Will to retrieve
a CBL, referred to it as "that thing, whatever it's called." Richard, referring to the calculator
asked Edward, "Is that thing graphing?" Ms. Marshall referred to the probe as "that temperature
thing."
For the most part, students assumed roles within the group--Donna and Will gathered the
materials, Richard and Edward were relegated to handle the calculator and CBL, Will read
directions, and Donna wrote things down. Whatever the task, very little discussion went on in
this group. They got things done and the group members communicated well enough to perform
their tasks. Edward and Richard do not typically talk a great deal anyway, the fact that they
manipulated the equipment while Will and Donna handled textual and verbal roles seems fitted
to their respective inclinations. The problem with that arrangement is that since Richard and
Edward are not inclined to talk or write during the activity, they tend to want to copy whatever
Donna or Will have written with little, if any, discussion. At least twice, Will tried
unsuccessfully to get them to discuss some of the questions on the lab. On several occasions
Donna or Will communicated with students in nearby Group 1 to find out how they answered a
certain question. They would then write down an answer to the question and once they finished
writing, hand their paper to someone else in their group to be copied. Occasionally, Edward or
Richard would ask, "What does this say?" but never did either of them ask, "What does this
mean?" or disagree or offer their own opinion of what had been written. Transferring copied
answers was an essential social function of Group 2.
Even though they have written directions in front of them and have been exposed to the
procedure the previous day by Ms. Marshall, they have trouble doing what comes next. Both
Ms. Marshall and Ms. Turner commented on the need to repeat things several times "before it
sinks in." During the time period (32 minutes) required for the technology to collect the data,
Ms. Marshall had to repeatedly prod students to work on answering the questions.
61
Day three: The composite graph inscription. Following the data collection portion of the
Passive Solar Homes lab, Ms. Marshall and Ms. Turner lead a classroom discussion of portions
of the activity. But before they do, they allow students about ten minutes to finish answering the
analysis questions (see Table A) or any other part that they were not able to finish on Day one.
Ms. Marshall said she rarely, if ever, gives EPS students homework.
Ms. Marshall produced the inscription (see Figure E) by downloading the data from each
of the graphing calculators using a linking cable, a computer, and a graph analysis computer
program. Each line on the inscription corresponds to each solar home and comes from data
collected the previous day. Each student was given a copy of the inscription and Ms. Marshall
made an overhead transparency to use in front of the class. Prior to today, the students had not
seen the inscription, only the single graph produced by the graphing calculator during the data
collection phase of the activity.
Ms. Marshall asks the class to get their labs out. She explains that they are going to look
at the graph and "draw some conclusions about the passive solar homes." Once a sufficient
number of students have produced their lab reports, Ms. Marshall asks them to look at the
accompanying analysis questions (see Table A) and asks, "Can you look at the graph and answer
the questions?" Kathy immediately responds, "No." Ms. Marshall acknowledging Kathy's reply
responds, "Okay. We'll discuss this in a few minutes but you should come up with your answers
before that. So, I'll call on you and you'll be able to answer." She pauses momentarily as
students quietly read the analysis questions.
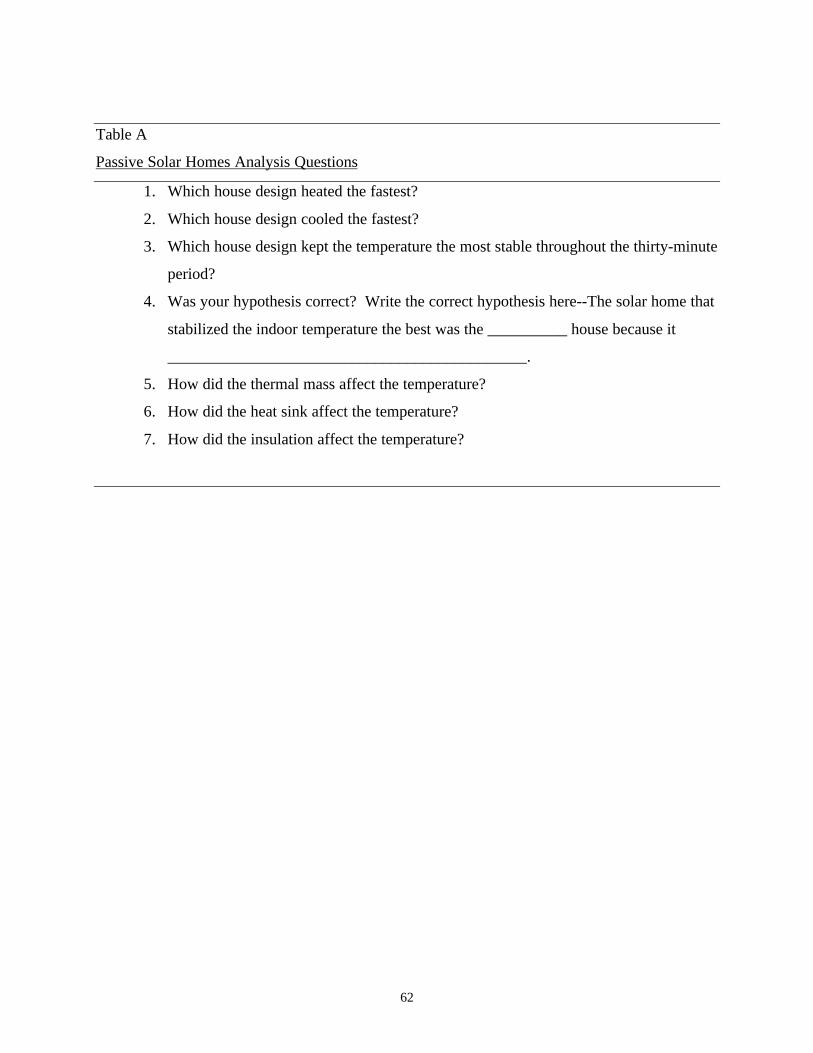
62
Table A
Passive Solar Homes Analysis Questions
1. Which house design heated the fastest?
2. Which house design cooled the fastest?
3. Which house design kept the temperature the most stable throughout the thirty-minute
period?
4. Was your hypothesis correct? Write the correct hypothesis here--The solar home that
stabilized the indoor temperature the best was the __________ house because it
_____________________________________________.
5. How did the thermal mass affect the temperature?
6. How did the heat sink affect the temperature?
7. How did the insulation affect the temperature?
63
One student breaks the silence and asks, "Does that mean which one is the hottest or
which one gets hot the fastest?" Ms. Marshall responds to the student by reading the question
aloud, "Which design heated the fastest, so got hot quickest? Some of these are very close."
While some students are quietly engaged in small group discussions, others re-read the
questions or look at each other or around the room. Ms. Turner is writing at the front teacher's
lab table while Ms. Marshall moves around the room as a means to keep them on task and to
check their work and respond to questions. The way she responds during this portion is by not
giving them "right" answers at this point, but to encourage them to think for themselves or to
discuss possible answers with their lab partners. Nevertheless, the students keep asking her
questions, apparently in need of more direction or explanation.
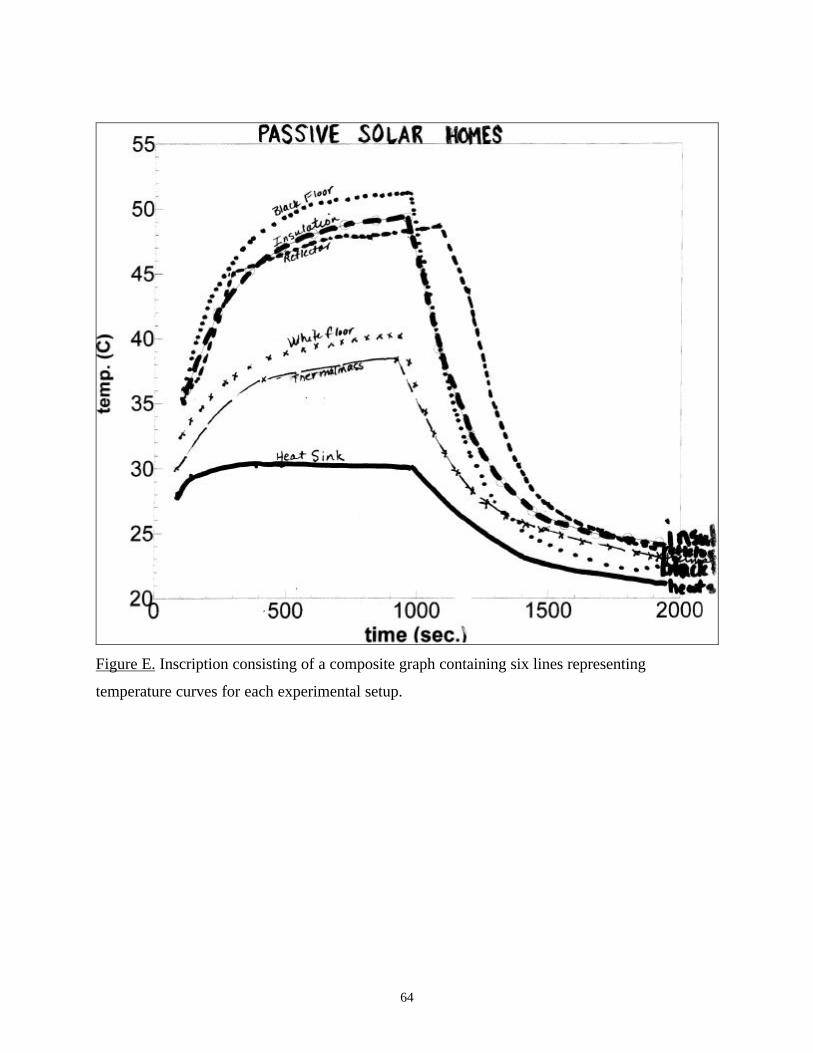
64
Figure E. Inscription consisting of a composite graph containing six lines representing
temperature curves for each experimental setup.
65
Will asks Ms. Marshall as she approaches his table, "Would this be the answer to number
three?" Ms. Marshall responds, "Does that mean that it's stabler? I'm not disagreeing with you.
I just want you to…" and she moves away. She then explains her position to the class, "Don't
ask me if you're right or wrong. Put down what you think and discuss it. Trust your analysis.
Okay. Trust your ability to analyze these things. You're looking at slope in a lot of these."
Kathy asks Ms. Marshall as she approaches, "Would that one be…" but before Kathy
finishes her question Ms. Marshall insists, "Well you all have to decide. Trust yourself." She
pats the desk decisively with her hand outstretched and the rings she is wearing hit the desk with
a certain cadence that adds emphasis as she speaks. She then makes the point again to the whole
class, "But don't ask me if your answers are right," and then walks in a different direction.
Robert raises his hand and Ms. Marshall responds as she moves toward him. "Don't ask
me if your answers are right," she warns. "No," Robert returns, "I'm just sayin' like--." "Thermal
mass," Ms. Marshall interjects, "is the one I collected that you didn't see that had a piece of black
metal at the bottom of it."
As Ms. Marshall passes Group 3 she asks, "You got 'em all answered?" One student
responds, "All of 'em I can do." Ms. Marshall returns, "Well, what's the problem?" The student
says he does not "know what to put down." Ms. Marshall explains, "You should be able to see
how the thermal mass affected it." The student inquires, "Thermal mass?" Ms. Marshall
responds, "Well, where's the thermal mass? You have to look at the graph. Find the thermal
mass graph." The student still seems confused and asks, "Where it heated up and cooled down?"
Ms. Marshall tries to clarify by asking, "Compared to the others, how did the thermal mass affect
it?" Trying to determine where the misunderstanding is she asks the class, "You all are
understanding the graphs?" Several students respond simultaneously, "I understand the graph."
Ms. Marshall, assuming students are having trouble understanding the intent of the question,
explains, "The thermal mass was a piece of black metal okay. Now, knowing what black does
and what metal can do, how did it influence ability to retain heat and to give it off? Compared to
the others, what did it do?" One student still seems befuddled and returns, "Compared to what
others? All of these others. You're gonna compare this one to the other five," Ms. Marshall
explains as she points to the inscription on the projector.
66
Another student seems confused and asks, "The heat sink?" and Ms. Marshall responds,
"No, you're talkin' about thermal mass in this question." Ms. Marshall then walks away and
suggests to the class, "Go ahead with [questions] five, six, and seven."
Ms. Marshall passes quickly by Group 3 and asks, "You all through?" She then moves to
Group 4, "You all finished? No, you haven't put your answers to five, six, and seven." One of
the Group 4 students says they are not sure what to write. Ms. Marshall replies, "Well, then
guess. Look at this, based on this analysis…what a thermal mass is." The student explains that
her group did not have the thermal mass but Ms. Marshall insists, "It doesn't matter if you did
them or not. You know what they were. If you don't tell me…okay, the heat sink was the bottle
of water that acted as a collector."
Ms. Marshall asks the class, "Folks, on these graphs, is higher always better?"
A student calls out, "No." Ms. Marshall repeats, "No" and she puts her hand gently on Belinda's
shoulder to communicate her desire to have Belinda's attention. Belinda is talking but stops at
Ms. Marshall's cue. Ms. Marshall continues, "What would be the better, what are we looking for
here to indicate better?" A student responds humorously, "Real steady." At the same time
another student offers, "Straight." Ms. Marshall emphasizes, "Steady line. Flat line. The one
that has the flat line is the one that has the best response."
Ms. Marshall approaches Group 1 and asks, "You all can't answer these?" Belinda
responds, "No." Ms. Marshall asks Belinda while pointing to a copy of the inscription on her
desk, "Well, where's thermal mass on here?" Belinda answers, "Right here" and points to a line
on the graph. Ms. Marshall corrects Belinda by pointing to the correct line and says, "No, here's
thermal mass. All right, so what does that tell about what thermal mass is? The house with
thermal mass did what?" A nearby student answers, "It dropped slower." Ms. Marshall points to
the inscription and adds, "Compared to the others. So it's second best, right? Okay. The only
one that's better is the heat sink. Well, it's stabler or shows less of a change."
Ms. Marshall looks around the room at students, walks over to Group 5 and asks, "Are
we looking for an increase or are we looking for a steady? Steady. Okay, so thermal mass."
TEACHER-LED CLASSROOM DISCUSSION
In the next part of class, Ms. Marshall goes over the questions by calling on individual
students. To get more students involved in the discussion, she calls on one student to read the
67
question and another student to answer. In an attempt to focus on the dialogue, short interactions
are included directly from the transcription.
Ms. Marshall: Okay. Looking at this [nodding to Figure E on the overhead projector],
which type of house heated the fastest? Mike, what did you say?
Mike: Uh, the black floor.
Ms. Marshall: Okay, he said the black floor heated the fastest. The black floor is here
[pointing to the graph]. Um, do you agree that it had the steepest slope? Chase, what do
you say?
Chase: The reflector.
Ms. Marshall: He said the reflector had the steepest slope. Which one do you all think is
the correct answer, the black floor or the reflector?
Student (?): The black floor.
Ms. Marshall: All right, raise your hand if you think it's the black floor--four, five, six,
seven, eight, nine, ten, eleven. Okay, you're gonna be swayed by the opinion. Alright,
how many think it's the reflector? Three, four, five, six, seven. Okay, the people that are
answering the reflector are correct because you've got more of a slope. So, the answer to
the first one is reflector. The one with the reflector heated up the quickest. And we could
actually measure the slope by taking what, rise over run, is that what you all do in math
class?
Student (?): Yes.
Ms. Marshall: The reflector has the higher slope.
Despite attempts to discourage "right answer" thinking in favor of a more inquiry-based
approach, students were told they were correct if they answered "reflector." If slope had been
determined mathematically, the black floor would have shown a greater slope. Two of the lines
(black floor and reflector) are very close--but their slopes vary during the 32-minute period and
that seems to be what causes confusion. Because the slope of the line for reflector rose quickly
for the first five minutes, Ms. Marshall and some of the students interpret a faster heating rate.
However, Ms. Marshall ultimately determines what is right, the eleven students who had the
correct answer acquiesce to her interpretation and change their answers. Ms. Marshall calls on
Todd to read question two (Which house design cooled the fastest?) and Will to answer the
question.
68
Will: I put the black floor.
Ms. Marshall: Okay he put black floor. It goes from here and notice it drops right to
there. Okay black floor. And, it seems to be almost a straight line from here down.
Ms. Marshall: Did anyone have another answer? Cindy or Charity did you all have
another answer for number two? Okay, are we all in agreement on black floor? Raise
your hand, all of you agree on black floor. So the black floor tends to give up heat the
easiest.
The cooling line for black floor was a lot easier to interpret and therefore less confusing to
interpret. There was almost complete agreement about that answer. Ms. Marshall calls on
Charity to read question three (Which house design kept the temperature the most stable
throughout the thirty-minute period?) and Jeff to answer.
Jeff: Heat sink.
Ms. Marshall: Heat sink. Anybody disagree with heat sink? Okay, the heat sink is the
one on the bottom. Notice that there is less change in the heat sink than any others. We
have already said while you all were doin' the analysis that the least change meant more
stable. Okay. Would anyone care to express a reason why those tubes of water would
have made the overall temperature less change and more stable?
Chase: Because it like sucks up all the heat and makes the water hot and then makes the
surroundings hot.
Ms. Marshall: Okay, you're exactly right. Did everyone hear what Chase said? He said
that the water sucked up the heat. And so the water was absorbing the heat not the
surroundings. And that's exactly what a heat sink does. It sucked up is a term that means
the same thing as absorbing the heat.
Least change is equated with stability and the concept of heat sink is introduced by Chase's
answer. The heat sink discussion spurred Adam to add his knowledge, "It takes a long time for
water to heat up." Ms. Marshall asked what in nature works as "the biggest heat sink on planet
earth?" In so doing, she asks students to apply the concept of heat sink to the natural world.
Chase responds, "the ocean," and Ms. Marshall extends the concept further to the biosphere and
how the ocean affects heat distribution, stability, and ultimately life on the earth. She then asks
students about their hypotheses. Since no one had a correct hypothesis, Ms. Marshall asked them
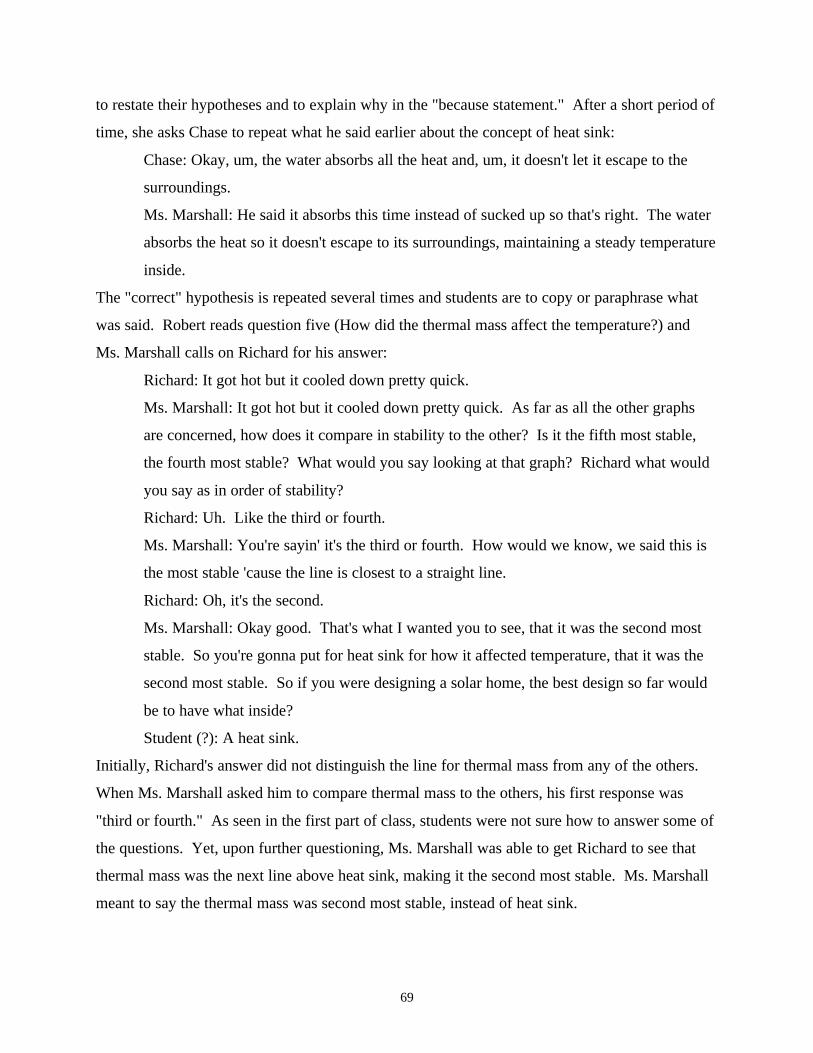
69
to restate their hypotheses and to explain why in the "because statement." After a short period of
time, she asks Chase to repeat what he said earlier about the concept of heat sink:
Chase: Okay, um, the water absorbs all the heat and, um, it doesn't let it escape to the
surroundings.
Ms. Marshall: He said it absorbs this time instead of sucked up so that's right. The water
absorbs the heat so it doesn't escape to its surroundings, maintaining a steady temperature
inside.
The "correct" hypothesis is repeated several times and students are to copy or paraphrase what
was said. Robert reads question five (How did the thermal mass affect the temperature?) and
Ms. Marshall calls on Richard for his answer:
Richard: It got hot but it cooled down pretty quick.
Ms. Marshall: It got hot but it cooled down pretty quick. As far as all the other graphs
are concerned, how does it compare in stability to the other? Is it the fifth most stable,
the fourth most stable? What would you say looking at that graph? Richard what would
you say as in order of stability?
Richard: Uh. Like the third or fourth.
Ms. Marshall: You're sayin' it's the third or fourth. How would we know, we said this is
the most stable 'cause the line is closest to a straight line.
Richard: Oh, it's the second.
Ms. Marshall: Okay good. That's what I wanted you to see, that it was the second most
stable. So you're gonna put for heat sink for how it affected temperature, that it was the
second most stable. So if you were designing a solar home, the best design so far would
be to have what inside?
Student (?): A heat sink.
Initially, Richard's answer did not distinguish the line for thermal mass from any of the others.
When Ms. Marshall asked him to compare thermal mass to the others, his first response was
"third or fourth." As seen in the first part of class, students were not sure how to answer some of
the questions. Yet, upon further questioning, Ms. Marshall was able to get Richard to see that
thermal mass was the next line above heat sink, making it the second most stable. Ms. Marshall
meant to say the thermal mass was second most stable, instead of heat sink.
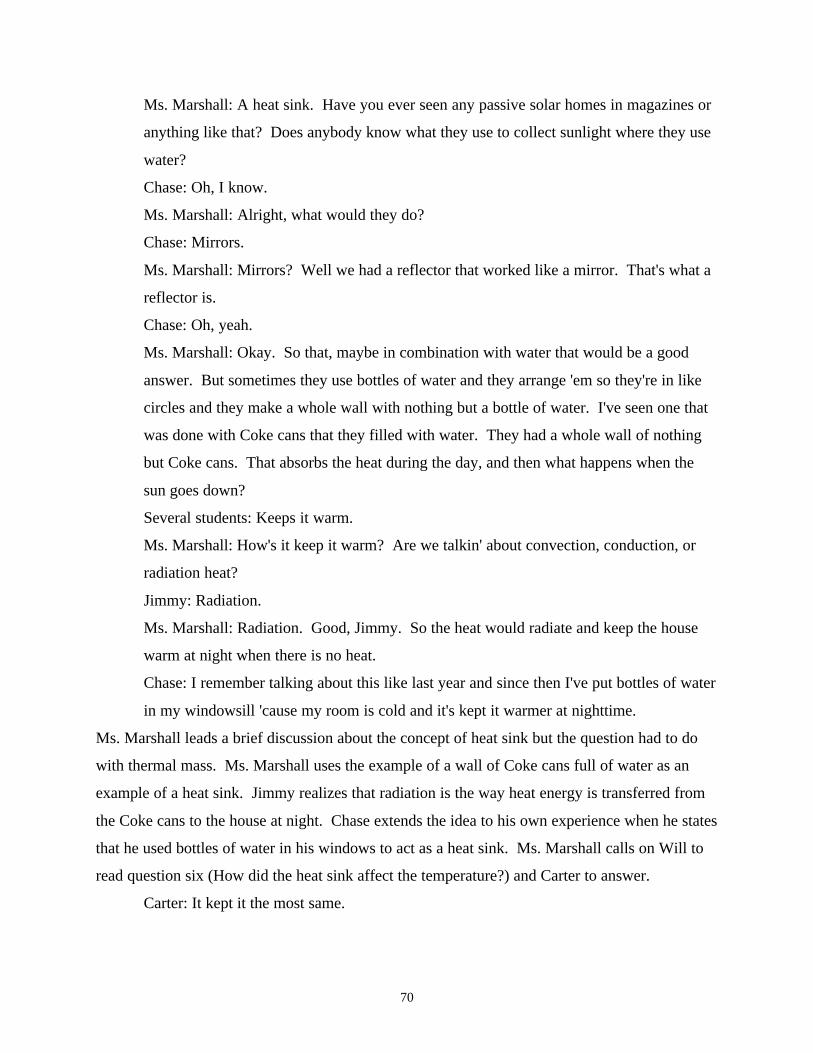
70
Ms. Marshall: A heat sink. Have you ever seen any passive solar homes in magazines or
anything like that? Does anybody know what they use to collect sunlight where they use
water?
Chase: Oh, I know.
Ms. Marshall: Alright, what would they do?
Chase: Mirrors.
Ms. Marshall: Mirrors? Well we had a reflector that worked like a mirror. That's what a
reflector is.
Chase: Oh, yeah.
Ms. Marshall: Okay. So that, maybe in combination with water that would be a good
answer. But sometimes they use bottles of water and they arrange 'em so they're in like
circles and they make a whole wall with nothing but a bottle of water. I've seen one that
was done with Coke cans that they filled with water. They had a whole wall of nothing
but Coke cans. That absorbs the heat during the day, and then what happens when the
sun goes down?
Several students: Keeps it warm.
Ms. Marshall: How's it keep it warm? Are we talkin' about convection, conduction, or
radiation heat?
Jimmy: Radiation.
Ms. Marshall: Radiation. Good, Jimmy. So the heat would radiate and keep the house
warm at night when there is no heat.
Chase: I remember talking about this like last year and since then I've put bottles of water
in my windowsill 'cause my room is cold and it's kept it warmer at nighttime.
Ms. Marshall leads a brief discussion about the concept of heat sink but the question had to do
with thermal mass. Ms. Marshall uses the example of a wall of Coke cans full of water as an
example of a heat sink. Jimmy realizes that radiation is the way heat energy is transferred from
the Coke cans to the house at night. Chase extends the idea to his own experience when he states
that he used bottles of water in his windows to act as a heat sink. Ms. Marshall calls on Will to
read question six (How did the heat sink affect the temperature?) and Carter to answer.
Carter: It kept it the most same.
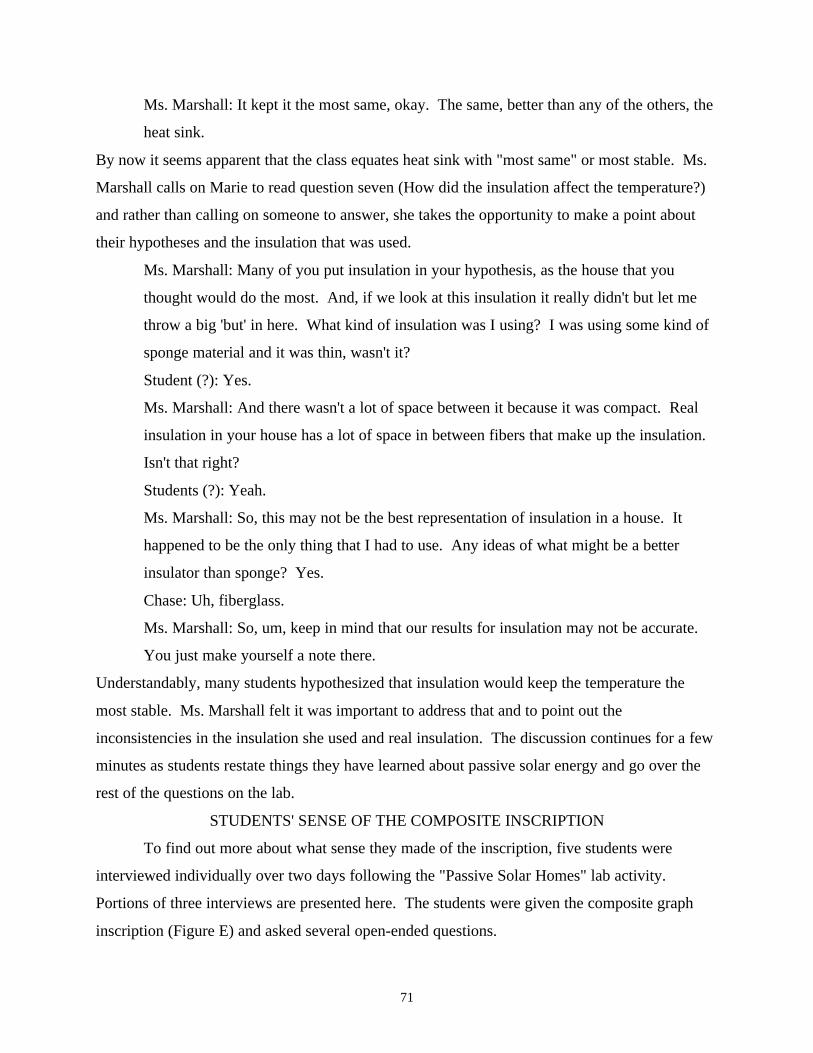
71
Ms. Marshall: It kept it the most same, okay. The same, better than any of the others, the
heat sink.
By now it seems apparent that the class equates heat sink with "most same" or most stable. Ms.
Marshall calls on Marie to read question seven (How did the insulation affect the temperature?)
and rather than calling on someone to answer, she takes the opportunity to make a point about
their hypotheses and the insulation that was used.
Ms. Marshall: Many of you put insulation in your hypothesis, as the house that you
thought would do the most. And, if we look at this insulation it really didn't but let me
throw a big 'but' in here. What kind of insulation was I using? I was using some kind of
sponge material and it was thin, wasn't it?
Student (?): Yes.
Ms. Marshall: And there wasn't a lot of space between it because it was compact. Real
insulation in your house has a lot of space in between fibers that make up the insulation.
Isn't that right?
Students (?): Yeah.
Ms. Marshall: So, this may not be the best representation of insulation in a house. It
happened to be the only thing that I had to use. Any ideas of what might be a better
insulator than sponge? Yes.
Chase: Uh, fiberglass.
Ms. Marshall: So, um, keep in mind that our results for insulation may not be accurate.
You just make yourself a note there.
Understandably, many students hypothesized that insulation would keep the temperature the
most stable. Ms. Marshall felt it was important to address that and to point out the
inconsistencies in the insulation she used and real insulation. The discussion continues for a few
minutes as students restate things they have learned about passive solar energy and go over the
rest of the questions on the lab.
STUDENTS' SENSE OF THE COMPOSITE INSCRIPTION
To find out more about what sense they made of the inscription, five students were
interviewed individually over two days following the "Passive Solar Homes" lab activity.
Portions of three interviews are presented here. The students were given the composite graph
inscription (Figure E) and asked several open-ended questions.
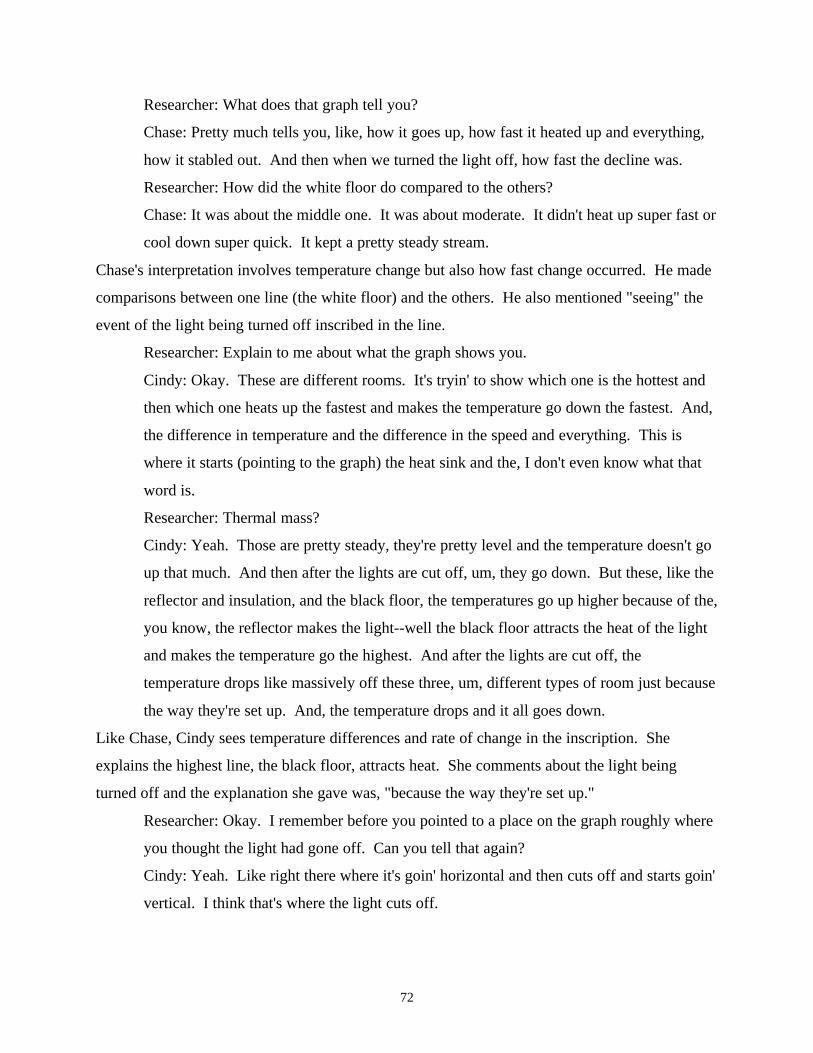
72
Researcher: What does that graph tell you?
Chase: Pretty much tells you, like, how it goes up, how fast it heated up and everything,
how it stabled out. And then when we turned the light off, how fast the decline was.
Researcher: How did the white floor do compared to the others?
Chase: It was about the middle one. It was about moderate. It didn't heat up super fast or
cool down super quick. It kept a pretty steady stream.
Chase's interpretation involves temperature change but also how fast change occurred. He made
comparisons between one line (the white floor) and the others. He also mentioned "seeing" the
event of the light being turned off inscribed in the line.
Researcher: Explain to me about what the graph shows you.
Cindy: Okay. These are different rooms. It's tryin' to show which one is the hottest and
then which one heats up the fastest and makes the temperature go down the fastest. And,
the difference in temperature and the difference in the speed and everything. This is
where it starts (pointing to the graph) the heat sink and the, I don't even know what that
word is.
Researcher: Thermal mass?
Cindy: Yeah. Those are pretty steady, they're pretty level and the temperature doesn't go
up that much. And then after the lights are cut off, um, they go down. But these, like the
reflector and insulation, and the black floor, the temperatures go up higher because of the,
you know, the reflector makes the light--well the black floor attracts the heat of the light
and makes the temperature go the highest. And after the lights are cut off, the
temperature drops like massively off these three, um, different types of room just because
the way they're set up. And, the temperature drops and it all goes down.
Like Chase, Cindy sees temperature differences and rate of change in the inscription. She
explains the highest line, the black floor, attracts heat. She comments about the light being
turned off and the explanation she gave was, "because the way they're set up."
Researcher: Okay. I remember before you pointed to a place on the graph roughly where
you thought the light had gone off. Can you tell that again?
Cindy: Yeah. Like right there where it's goin' horizontal and then cuts off and starts goin'
vertical. I think that's where the light cuts off.
73
Researcher: I think before you were sayin' it was somewhere down in here (pointing to
the flat area on the line clearly before the line drops). Did you think about that more?
Cindy: At first, yeah, at first I thought it cut off right there (pointing to the flat area on the
line clearly before the drop, where I had pointed), because, the light, at first that was what
I was thinkin'. But then I was thinkin' maybe the light cut off somewhere right here and
then the heat had time to cool down and then that was when it, when the heat was just all
gone and the temperature dropped. After the light was turned off. So, I don't know
(laughs) if the light turned off somewhere around here (pointing to point where the line is
at its peak before it drops dramatically) or if it turned off right there but after I think
about it again now, it probably turned off somewhere around there (pointing to the flat
area on the line clearly before the drop) because it has to have time to cool down.
When queried deeper, Cindy remained unsure of where the light being turned off was inscribed
in the line. Cindy thought that temperature continued to rise after the light was turned off
"because it has to have time to cool down." It is unknown why she might think this but there are
instances in nature where this occurs and this knowledge, if she possesses it, could have
influenced her interpretation. For example, the hottest part of the day is not when the sun is
directly overhead it is later when the Earth has re-radiated heat back to the atmosphere.
Likewise, the hottest time of the year is not around Summer Solstice, it takes place later in the
Summer, after the Earth has re-radiated heat back into the atmosphere.
Researcher: Can you just tell me like what the graph shows?
Julie: Where they heat up more. And, the quicker it went up the hotter it got.
Researcher: From reading the graph, what do you think about having six different graphs
on one thing?
Julie: I think it put it all together so you could see how all the different ones did
compared to one another.
Researcher: What do the graphs tell you when you have all six of them there?
Julie: It shows you what would be the better source of heat.
Researcher: And so which one is the better source of heat?
Julie: The one that's more consistent.
Researcher: How can you tell that it stayed more consistent?
Julie: It's not much of a variation.
74
Julie's explanation was similar to the previous two involving temperature change and rate of
change. Julie's definition of "better source of heat" was consistent with one of the main learning
objectives for the lab activity--effective passive solar designs should keep temperature fairly
constant.
DAY THREE ANALYSIS
Although students are not using any technology on Day three, they are interpreting an
inscription produced from the data they gathered the day before using graphing calculator
technology. In the first part of the period, students see the composite graph inscription for the
first time and try to answer the analysis questions. As the period ended the day before, most
groups had just finished the 32-minute data collection part of the procedure but few students had
much time to examine the graph or discuss what it meant. As Day three begins they are given
the composite graph inscription and with very little explanation from Ms. Marshall or Ms. Turner
and they attempt to make sense of the inscription and answer the questions. Students are asked
to get back into their groups and to discuss their results and the questions. Ms. Marshall tries to
get students to think for themselves by fending off "right answer" questions and by encouraging
them to "trust" their "ability to analyze these things." Various difficulties surface as students
grapple with the inscription and the questions. Ms. Marshall wants students to have discussions
in their groups, but many students are not sure how to interpret the inscription and how to answer
the questions. Kathy's initial response of "No" to the question Ms. Marshall posed, "Can you
look at the graph and answer the questions?" encapsulates much of the subsequent discussion.
One student wanted to know if the first question was asking about "fastest" or "hottest."
In the meantime, Ms. Marshall moves around the room prodding students and
encouraging them to try to come up with their own answers while Ms. Turner is at the teacher's
table in the front doing some administrative paperwork. This goes on for about ten minutes with
quite a few students having various difficulties with their task.
The first three questions (in Table A) require the student to look at the inscription,
compare lines, and determine which design met each superlative--heated fastest, cooled fastest,
and was the most stable. Given that every group collected data for the same period of time and
assuming they all had the same starting temperature, the house that heated the fastest should be
the one that had the highest temperature at the end of 16 minutes. But it was difficult for
students and Ms. Marshall to determine which house heated the fastest because three of the lines
75
were close in slope and came within three degrees after 16 minutes. Eleven students raised their
hands to indicate that they felt the house with the black floor heated the fastest, and seven
thought it was the house with the reflector. Ms. Marshall sided with the reflector, saying it had,
"more of a slope." She explains that they could actually measure the slope by taking "rise over
run" but does not perform that algorithm. Instead, Ms. Marshall determines that the reflector
house is the correct answer and they move to the next question. If someone had performed the
math, they would have found the black floor heated the fastest. When they took the test on this
material at the end of the unit, this question resurfaces as a trouble spot. The "Alternative
Energy" test had an exact copy of the composite graph inscription and three accompanying
questions.
Overall, students had very little trouble answering "Which solar house was the coolest?"
and "Which solar house had the most stable temperature overall?", but over half of the class (12
students) missed the question, "Which solar house absorbed heat the quickest?" Almost all of
them answered "black floor," which was counted wrong. According to Ms. Marshall, the correct
answer was "reflector." Having the verb "absorbed" in the question may have been confusing
since the question on the lab activity had simply asked which one had "heated the fastest." But it
is also likely the students looked at the graph and interpreted "black floor," since it has a higher
line, as the correct response--which is the correct answer. In the time between going over the lab
activity and taking the test, it seems the students have either forgotten, or chose to ignore, Ms.
Marshall's answer--the reflector.
The next ten minutes consisted mainly of Ms. Marshall going over the lab activity with
students. To increase involvement, she would call on one student to read a question, then call on
another to respond. By the end of the discussion almost every student had been involved in some
way.
In the discussion about the concept of heat sink, Chase used the phrase "sucks up all the
heat" and Ms. Marshall accepted the response, but added that it means the same as "absorbing
the heat." Ms. Marshall extends the idea to nature by relating heat sink to the Earth's oceans.
Subsequently, Chase recounted his use of bottles in a windowsill in his room. Ms. Marshall
often repeats students' answers--a pedagogical practice that can reassure the responding student
and can assist the class in knowledge acquisition.
76
The first three questions (Table A) are close-ended and require only a one or two word
response. The last three questions begin with "How" and answers were confined to brief
descriptions of how the temperature was affected by house design in three of the houses over
time. Ms. Marshall then led the class in a discussion in which students applied some of the
concepts involving energy transfer from the lab activity to passive home design.
When interviewed individually, students were generally able to interpret temperature
change and rate of change and were able to make comparisons between designs. One student
had difficulty interpreting when the event of the lamp being turned off was inscribed.
Vignette One analysis. Over the course of three days, Vignette One depicts students
performing an activity using graphing calculators and temperature probes to investigate the
thermal properties of different building materials. Using five solar house models, students work
with technology to measure and record temperature change over time. The use of technology in
this case, adds to the experience by the use of authentic, scientific tools to gather and analyze
real-time data.
In Day one, Ms. Marshall uses the last part of a class period for several pedagogical
purposes. Firstly, she prepares students for the activity by demonstrating the proper set-up and
functioning of the apparatus. She then leads a discussion of the scientific concepts involved by
connecting prior knowledge with new terminology. Finally, she reminds students of several
experimental steps and suggests that the activity they are about to perform is applicable to real-
world issues involving solar heating and energy conservation.
In Day two, students prepare begin the activity after a brief recap. Ten desks have been
pushed together to make five tables and Ms. Marshall asks students to work in groups based on
where they normally sit in class. Once Ms. Marshall determines the class is ready to begin, she
releases students to gather the necessary lab equipment which is organized in several locations
around the room. At this point, students begin to negotiate what tasks need to be done, the roles
group members will assume, and how to proceed. Student groups formulate internal rules of
social behavior. Some groups are more explicit in communication and decision-making, while
others operate more discreetly.
Because of the length of time the experiment requires, and the length of the class period,
students must accomplish several tasks in a relatively short time period. Since the calculators
were programmed before class, the first technological task for students is (a) to connect the
77
components together, (b) activate the electronic equipment, (c) initiate the calculator program,
and (d) monitor the functioning of the calculator.
Since graphing calculator technology senses, times, collects, and records data, students
have few traditional laboratory functions to perform. At times, once the calculator program was
running, students are not sure what to do. To fill the time gap, Ms. Marshall suggests students
work on the discussion questions. But, students run into difficulty because some of the
discussion questions refer to the results of the experiment which they are still performing. Some
group members sat idly, while others assumed the role of gathering and recording answers
supplied by nearby group members--an apparently proven and acceptable method for answering
questions.
As Day three begins, Ms. Marshall puts the composite inscription on the overhead
projector (Figure E.) and asks students to finish answering the discussion questions from the
previous day. Having never seen the image now being displayed to them, students are hesitant
and seem unsure of how to make sense of it. After some inquiry, Ms. Marshall decides to
discuss the inscription with the class. Despite her attempts to encourage students to come up
with their own interpretations and explanations, the student-teacher repartee reinforces a teacher-
directed authority and dissuades social dialogue.
Vignette Two: Using Graphing Calculators to Graph Resource Depletion
Vignette Two takes place the day after students have performed the first part of the lab
activity entitled "Resource Depletion" (see Appendix C). As part of the unit entitled Mineral
Resources, this activity is designed to illustrate how the use of a resource changes over time.
Students are exposed to the concepts of exponential growth and exponential decline as the
availability and consumption of a resource changes over time. Yesterday they collected data and
today they are taking the data and producing graphical inscriptions depicting how the production
of a resource increases, then decreases, over time. The data came from an activity in which
students simulated the removal of "ore" from other Earth materials in a given volume over time.
The purpose for using graphing calculators is to make a "preview" graph inscription before
making a pencil and paper graph that they will interpret and then turn in with their lab report.
The class begins with Ms. Marshall and Ms. Turner passing out graphing calculators to
each student. Once it is determined all of the students have calculators, Ms. Marshall begins
giving the class instructions, and Ms. Turner moves around the room helping students as needed.
78
Ms. Marshall explains to students how to find out if the calculator has anything stored in
memory that needs to be cleared before they can begin the activity. She says, "Push the 'Stat'
button, after you turn 'em on."
Sandy cannot get her calculator to come on. Ms. Marshall says, "Okay," and replaces her
calculator with another. Ms. Marshall then asks the class, "Anybody else's not comin' on?"
Belinda says, "Mine's not. I don't think so." Belinda tries again and Ms. Marshall confirms,
"Okay. Still not getting anything? It could be there's no batteries in it," and she moves to the
front of the room and gets another calculator, opens the back battery panel to make sure it has
batteries, and gives the calculator to Belinda.
Ms. Marshall instructs the class, "Okay, then push 'Enter' and that should show you
whether there's anything in the list or not." She repeats, "Push 'Stat' and then 'Enter.'" While
giving mainly technical instructions, Ms. Marshall and Ms. Turner move around the room from
table to table quickly scanning students' progress and helping students as needed.
Ms. Marshall directs, "If you have information in the list, push 'Stat'—'Enter', what you
need to do is push the 'Up arrow' until the region above the first list is highlighted and then push
'Clear,' 'Enter.'" She then moves to a nearby table to help a student. She then turns to the class
and continues, "If you have no data in there…" and pauses to respond to a student. She then
continues, "Anybody need help to clear their list? Once you get one list cleared, arrow over to
the next list." Most of the students are using their graphing calculators, but some of them are
quietly talking instead.
Ms. Marshall makes another technical comment, "If your screen is light, push the '2nd'
button, and hold down the 'Up arrow' until the screen gets as dark as you like it." Ms. Marshall
moves toward the blackboard and asks the class, "'L1' is usually our independent variable. So in
the graph of what you collected yesterday, what actually were the two variables that we worked
with?" Chase responds, "peas and corn." Ms. Marshall returns, "Something about the peas and
what else?" Chase repeats, "Corn." Ms. Marshall continues, "The peas, which represented the
mineral itself was one thing that you counted and recorded. What was the other? You didn't
count; it was done for you. What was our other variable?" Chase responds, "time." Ms.
Marshall immediately repeats "time. Good for you" and writes "peas" and "time" on the board.
She continues, "and so time, in this case, represented years of mining" and writes "years of
mining" in parentheses.
79
Ms. Marshall asks the class to identify the independent variable. Realizing the students
might need to be reminded, she offers, "The independent variable is the one that you manipulate
to get some kind of results." The dependent variable, she explains, "Depends on what you did."
She then asks, "Which data is the independent variable, it always goes on the 'x axis'? Which
one do you put on the bottom of the graph or in your 'L1' column—time or number of peas?"
Michael, unsure of which is correct, answers, "time--peas" and Ms. Marshall returns, "Which
one?" and Michael chooses, "Time." Ms. Marshall informs him, "You were right the first time.
You put in time. So would you all enter in the 'L1' column your independent variable which is
going to be time." Tim announces, "I can't get to mine." Ms. Turner immediately moves to help
Tim, and Ms. Marshall reassures him, "Okay, if you can't get to it and have a problem, let me
know." Tim asks, "It's on 'A,' is that right?" Ms. Marshall corrects him, "No you're supposed to
hit '2nd,' 'Stat,' instead of just 'Stat.' So just go back and hit 'Stat.'"
Ms. Marshall moves to Michael and Jeff's table and says, "And I don't know how many
generations you all put in. Looks like this group had, ten. So you're gonna put one, two,
three…" she continues until she reaches ten.
Ms. Marshall moves to the table with Belinda, Julie, and Cindy and asks, "How many
generations did you all have? You had four, right?" Belinda answers, "Right." Ms. Marshall
notices Belinda seems to be having difficulty with her calculator and asks, "Did I give you all
another one with no batteries? Sorry. It won't come on? It's coming on. What's wrong with it?"
Belinda replies, "Oh, I cut it on and…" and Ms. Marshall interrupts, "Okay, hit 'Stat.'" Belinda
pushes a button and looks at the screen. Ms. Marshall surmises that she hit the wrong button,
"You hit 'Y ='. Hit 'Stat.'" After Belinda pushes the 'Stat' button, Ms. Marshall says, "Okay now
hit 'Return.' Okay, now you wanna make that a little darker so you can see it?" Belinda
responds, "I can see it."
Ms. Marshall instructs Belinda's table, "Now I want you to put your generations on" and
she moves away, looking quickly around the room as she moves. Ms. Turner hands Ms.
Marshall a calculator as Belinda, Julie, and Cindy discuss how to enter their 'L1' data into the
calculator. Ms. Marshall calls back across the room, "We just made it 'L1' and 'L2.' Ted, it's
okay."
Ms. Marshall turns around and asks Will, "Have you got your data in? Do you have your
data? It looks like yours is not complete." Will responds, "I've got part of it." Ms. Marshall
80
directs a question to Richard and Edward, who are sitting behind Will, "Who's got all the data?
Cause he doesn't have it." Ms. Marshall turns back, looks down at Will's activity report and
says, "Does Will have all the data?"
Ms. Marshall responds to a question from another table, "Time in years is what you're
gonna enter. How many years did you all mine?" She then further directs the class, "What your
'L2' data is the number of peas you got each year." Tim asks Ms. Marshall, "How do we enter
it?" Ms. Marshall responds, "You just enter the number and press 'Enter.' "Oh," Tim replies.
Ms. Marshall reminds the class to be sure to have values in both 'L1' and 'L2.' She says,
"You all remember how to graph this when you're through? Once you get all your data in, be
sure you have a 'L2' value for every 'L1' value so it won't give you a 'Dimension mismatch.'" She
moves back to Cindy's table as Cindy asks for her help. Cindy seems confused about how to
enter the values. Cindy explains, "I put in four." Ms. Marshall responds, "No, what you do is
you don't put the total you put each one individually—one, two, three, four. So your first 'L1'
value is gonna be one—one and a two and a three and a four."
Ms. Turner is across the room at Charity and Marie's table and calls Ms. Marshall's name,
but Ms. Marshall is still helping Belinda and doesn't respond right away. Belinda asks, "Now
what do I put in 'L2'"? Ms. Marshall, pointing to her paper, replies, "No, the 'L2' is gonna be this
data." Ms. Turner repeats her call to Ms. Marshall, "Are we entering 'L3'"? Ms. Marshall
responds, "We're not entering 'L3' at this point at all." Several conversations begin around the
room as students try to enter data into "L1" and "L2."
Ms. Marshall directs the class, "You want a line graph, so you're gonna arrow on down to
'Type' and arrow over to 'Line graph' and then you enter. Be sure it says 'L1,' 'L2' at the bottom.
If it doesn't, let me know." Belinda calls to Ms. Marshall, "Hey, Ms. Marshall," as her hand goes
up. Ms. Marshall moves to the blackboard and explains to the class, "Once you have your data
in, hit 'Zoom 9'" and she writes 'Zoom 9' on the board.
Ms. Marshall announces to the class, "Okay, let me give you some graph paper and I
want you to graph in the regular way with years on the bottom and peas on the side." She picks
up a stack of graph paper, which she begins to pass out to students as she passes. She then
moves to the table Kathy, Michael, and Jeff are at and repeats the directions she gave for the
class about entering 'Zoom 9.' Ms. Marshall moves to the table Belinda is at and Belinda says,
"Ms. Marshall, this thing's messed up." Ms. Turner hears Belinda's comment and moves toward
81
her table. Ms. Marshall responds, "Okay well I'll see if I can help." Ms. Turner and Ms.
Marshall are there for a moment and Cindy announces, "Okay I got it."
A boy from across the room announces, "I have no graph." Ms. Marshall moves to the
front of the room and asks the class, "Remember, if you want to see what the line is, what do you
hit after you've got it on the screen?" Ms. Turner stays for a moment helping Cindy, Belinda,
and Julie with their lists of data.
Ms. Marshall begins distributing graph paper again. Jimmy comments to Ms. Marshall,
"My graph looks weird." She responds, "Well, that's because you chose not to line graph, but to
do a dot graph. Graph them regular using the graphics calculator as a guide. Use one block at
the bottom per year; don't skip two, three or four. That will make the questions easier."
Ms. Marshall stops at Will and Donna's table and says, "Hit 'Zoom 9.'" Ms. Turner
continues to help Julie. Ms. Marshall asks Richard and Edward, "Did y'all get a graph? Okay."
Ms. Marshall tells Edward and Richard to put "One, two, three, four, five in 'L1.'"
Ms. Marshall passes graph paper to Cindy, Julie and Belinda and reminds them not to put
anything in 'L3.' Cindy asks Ms. Marshall, "How do you clear that out?" Ms Marshall replies,
"Okay, hit 'Clear.'" Cindy says, "It won't clear." Ms. Marshall replies, "It's gotta be at the top,
okay, now hit 'Clear.' Okay, now just go to 'Y=.' Okay, hit 'Enter.' Hit 'Enter' again. For 'Type
of graph,' choose 'Line graph.' And then hit 'Zoom 9.'" Belinda follows Ms. Marshall's
directions and Cindy watches Belinda as she enters the commands. Ms. Marshall moves to a
position overlooking Cindy's shoulder and comments, "Okay, now just hit 'Zoom 9.'"
Ms. Marshall passes some of the graph paper to Ms. Turner and announces, "You all can
use the graph as a guide, but you want to graph it the other way." Belinda informs Ms. Marshall
that she only gave them two pieces of graph paper, so Ms. Marshall asks Ms. Turner for another
piece of graph paper.
Ms. Marshall begins to give students instructions, "Just number off like you would for
any other graph." She makes her way through the aisles between lab tables to the front of the
room and asks, "Time in years, the independent variable, would go on which axis? What you all
have to decide on the left-hand side of your regular graph, is how you're going to get to those big
numbers that some you all got to. She announces, "Will's group got six twenty five." She then
explains, "What you're going to mark off is going to accommodate for some real small numbers
to begin with, twelve, twenty-four, something like that, and yet, six twenty five all the way up
82
here." She then says, "If you go by fifties, will that work? The dependent variables are going to
be peas. Now, you can adjust that accordingly if your highest number is not very large. If your
highest number is in the two hundred range, I'd go up twenties maybe."
Ms. Marshall announces to the class, "You all have to count how much of your mineral.
This is a critical graph." Several minutes go by and Ms. Turner and Ms. Marshall continue to
move around the room, helping students as they make graphs.
As some students seem to be completing the graph Ms. Marshall asks the class, "Do you
have your graphs done? Okay, once you've got your graph done, what you have to do now is to
estimate how much mineral you actually withdrew from the mine shoebox."
Apparently just arriving at school, Kathy enters and gives an admission slip to Ms.
Turner who is standing by her table. Ms. Marshall continues, "You have to count the number of
blocks that are under your curve." Ms. Marshall goes to the blackboard and draws an inscription
in the shape of a pyramid, and says, " Alright, let's say this is what your graph looks like. It may
or may not look like that, so how are you going to count the blocks that are under the curve?
What you do, folks." At the same time, Ms. Turner notices some students are talking, crosses the
room and admonishes, "Y'all listen to what she is going to tell you because it will save you a lot
of time if you do it right the first time." Marie raises her hand and Ms. Turner moves toward her
to respond. Ms. Marshall draws horizontal lines on the graph she created on the blackboard,
followed by vertical lines. She explains, "I'm going to pretend like I have blocks on my graph
paper."
Donna has moved to Charity and Marie's table and is kneeling on the floor. Ms. Marshall
continues, "and you're going to count the full blocks, one, two, three…" numbering full blocks
under the curve as she counts aloud. She ends up with twenty-three full blocks under the curve
and then demonstrates how to count portions of blocks. She explains as she writes on the board,
"And then I'm going to count like if I did this one and this one, that would give me twenty-four."
Ms. Marshall continues to explain how she wants students to add portions of blocks together to
get whole blocks (see Appendix C). She then turns around and asks, "See what I am doing?
Okay, I want to know exactly how many blocks are under here."
Ms. Marshall has moved to Cindy, Julie, and Belinda's table and Ms. Turner is at Richard
and Edward's table. They are both guiding students in the procedure for counting blocks.
83
Students are generally engaged in the activity while several quiet conversations take place
around the room.
After helping students at their tables for several minutes, Ms. Marshall asks the class,
"Folks, why are we counting the blocks under our graph? What does that tell us? You all look at
the front page of your lab. What did you write, Ted, on the front page of your lab and the area
under the curve?" Ted responds, "Resources." Ms. Marshall returns, "How many resources
available?" Ted replies, "I don't know." "It just says resources available?" asks Ms. Marshall.
At that moment, Larry enters the class wearing a backpack and hands Ms. Marshall a
yellow admission slip. Ms. Marshall then moves to the blackboard and draws another line
adjacent to the graph she created and explains, "So you should have 'total resources available'
written on the front of your lab." She draws a line in the shape of a bell curve and explains, "If
the area under the curve represents the total resources available, you should be able to count the
number of blocks multiplied by what each block represents and get a number that should be close
to the calculated value." The calculated value is given on the third page of the lab activity. Ms.
Marshall challenges the students by telling them to see how close they can "come to that figure."
Charity raises her hand and quietly says, "Ms. Marshall" Ms. Marshall notices Charity's
hand, but continues, "Count the blocks, multiply by how much each block represented…." Ms.
Turner responds to Charity by going to the table and sitting in the chair next to her. Ms.
Marshall continues, "…some of you went up by fifties, some went up by tens, some by twenties,
whatever you marked, whatever that number is, should equal the last number in the third column
of your results which was the resources withdrawn. Let's see if we can get that figure calculated
for everybody before we leave today. You have ten minutes to get that number calculated."
Ms. Turner and Ms. Marshall continue to move around the room from table to table
assisting students as needed. Ms. Marshall moves in front of Adam and Thomas, looks at their
work and comments, "Oooh, that was very close. You all did a good job. That is REAL close."
After helping Tim and Carter at their table, Ms. Marshall turns to the class and announces, "So
far" she gestures to Adam and Thomas, "this group has the best results." As the bell rings to end
the period, Ms. Marshall reminds students to be sure to bring their lab reports the following day.
Vignette Two analysis. Although the students have used graphing calculators and
performed similar algorithms repeatedly, they still need to be instructed on basic functions and
commands. This vignette illustrates how much time, patience, and technical knowledge is
84
involved for a teacher to successfully guide students through the process. The students have
some knowledge of the technology and Ms. Turner assists with many issues that arise, but Ms.
Marshall's expertise really comes to bear in the myriad of technical issues that occur.
Vignette Two underscores the need for advance planning. Ms. Marshall has back-up
calculators and charged batteries and can easily access either if needed. She is very familiar with
basic calculator functions such as clearing old data, adjusting screen contrast, and entering data--
all key operations in this activity. She repeats calculator instructions several times and writes
key commands on the board. She models how to use a calculator at the beginning of class and
later shows students how to make a paper and pencil graph.
By using calculators as a means to preview the graph they produce by hand, students
produce a model that will provide a mental image of what their paper and pencil graph should
look like. In effect, they produce two inscriptions--the first serves as an advance organizer for
the second. Again, the teachers employ the learning concepts of repetition and varying the
media to help students gain knowledge.
Students participated in several learning experiences involving scientific and
mathematical concepts. First, they performed an activity with dried peas and corn, simulated
recovering a mineral resource (peas) from its surrounding waste rock (corn). The data they
gathered were then used to produce two graphical inscriptions. The first inscription was derived
from using a calculator and the second, from paper and pencil. The graphs simulated what
happens to the quantity of a resource over time as recovery first increases exponentially, then
decreases exponentially. By counting blocks under the line of the graph, students were
estimating the concept of area under a curve--a rudimentary form of calculus. Finally, in
reviewing the scientific concepts of independent and dependent variables, Ms. Marshall
broadened the description of the data that went into 'L1' and 'L2.'
The inscriptions produced by students using graphing calculators and then by paper and
pencil showed a characteristic bell shaped curve, indicating four distinct periods of consumption
of a nonrenewable resource. At first, as resource discovery and recovery begins, consumption
increases at a slow rate but as time goes on, the market exploits new uses for the resource and
production increases at an exponential rate of consumption until it peaks. As supplies become
harder to find and recover, consumption decreases exponentially until the resource is no longer
85
economic to recover. Using their graphs, students answered several questions aimed at
determining when certain quantities of the resource had been depleted.
The inscription produced by the graphing calculator was effective at showing the general
shape of the curve, but students had little time to look at the graph before they went into making
a paper and pencil graph. Instructionally, it was intended to give students an idea of what their
paper and pencil graph was to look like. However, due to the differences in scale between the
graphing calculator display window and the paper and pencil graph, the graphs were quite
different in shape. The display window of the calculator (see Figure D) is 96 pixels (horizontal)
by 64 (vertical) pixels; the paper and pencil graph was produced on standard eight and a half
inches by eleven inches. Therefore, the paper and pencil graph (see Appendix C) was
proportionally distorted compared to the graphing calculator graph.
Vignette Three: Exploration of Data Using Graphing Calculators
Vignette Three takes place on "Extra Help Day" at Flood. Typically on Wednesdays,
Extra Help Day has an added interval of time between first and second periods. As the name
implies, Extra Help Day was originally designed for students to have the opportunity to get extra
help from teachers or to make up missed assignments or tests. To make time in the schedule,
each morning period is shortened by ten minutes. Before class starts, Adam and Thomas are
playing a computer game on the computer in the front of the room. Around the room, students
are carrying on quiet conversations. The previous day students began the lab activity "Resource
Depletion" (see Vignette Two). Vignette Three also involves the Resource Depletion activity
but graphing calculators are used in a different way.
Ms. Marshall moves to the front of the room and asks, "You all remember with the
graphics calculator what button gives you your list that you're going to put data in?" A student
answers, "'Stat.'" Ms. Marshall turns to the board and writes while continuing, "So you hit the
'Stat' button and 'Edit' and that will give you your list." She reassuringly tells the class that they
know how to put data into lists.
The data students use come from a table included in the lab activity listing U. S.
petroleum production from 1925 to 1988. Students are to enter the data, produce graphs, and
compare their graphs to an accompanying graph, which shows actual oil production from 1860 to
the 1960's, and a projection of the next hundred years. Comparing the two graphs will allow
students to "see what actually happened." The data table, Ms. Marshall explains, "has actual
86
figures in billions of barrels of oil removed or used from 1925 on." "So," she asks, "what's
gonna go in your 'L1' list? The date or the billions of barrels of oil?" A student replies, "The
date," and Ms. Marshall responds, "Good, the date. The date will be our 'L1.'"
Ms. Marshall continues, "Then your 'L2' list will be the billions of barrels of oil. How do
you get your graph now? What were the buttons that you pushed on the calculator to call up
your plots?" A student calls out "'Stat'" and Ms Marshall responds, "No, 'Stat' gave you the lists.
It was the 'Yellow 2nd' and the 'Y=' directly above it." She then explains how to get a plot and
asks, "How many plots will you need for this data?" A student answers, "Two" and Ms. Marshall
replies, "No just one, 'cause you just have 'L1' and 'L2.' So you just need to turn your first plot on.
How do you get it to graph once you have your plot on?" A student calls, "'Zoom 9'" and Ms.
Marshall repeats, "'Zoom 9', good deal. So if you can remember that then you'll know how to do
the graph with the graphics calculator."
Ms. Marshall asks the class, "How many of you want to use the graphics calculator and
I'll give you a calculator?" For this activity, the use of a graphing calculator is optional. She
picks up the box with the graphing calculators as several hands go up around the room. Some
students reply with a "yes" or a nod while others make no indication either way.
Ms. Marshall reminds the students, "Check these, I just put them back in order. Make
sure that, I'm not sure this box has the ones that work." Ms. Marshall goes around the room,
distributing calculators to those students that have indicated they wanted to use them. She then
asks the remaining students, "Do the rest of you all want to use the old method of graphing, or do
you want to use a graphing calculator?" Tim indicates that he is undecided so Ms Marshall asks,
"You don't know which one you want? The old method is to graph it by hand." Tim
immediately replies emphatically, "Oh no." Ms. Marshall repeats his reply twice, "Oh no," and
smiles. All of the students opted to use calculators.
She then asks the class if anyone has a calculator that has a dim screen display. She
explains, "We used them a lot yesterday so the batteries may be a little low. So if I need to
switch 'em, I'll be glad to."
Ms. Marshall asks Steven if he has a graphing calculator while Cindy comments that
something is wrong with her calculator. Cindy angles her calculator so Ms. Marshall can see the
screen and pushes the buttons. Ms. Marshall says, "That's right, hit 'Stat' 'Edit.' Oh, this has an
87
'L5' in it instead of an 'L1.' Let me give you another one so we don't have to fool with that."
Belinda is having the same trouble with her calculator, except instead of an 'L5,' she has an 'L7.'
Ms. Marshall stops and talks to Jimmy and Chase for a moment before getting two
replacement calculators from the front of the room. On her way back with the calculators, she
stops for a moment to help Steven. She checks the first calculator before handing it to Cindy and
says, "I believe that one will work." Cindy thanks Ms. Marshall and Ms. Marshall tells her she is
welcome.
Ms. Marshall announces to the class, "Once you have a graph, you can answer the
question. Remember to hit 'Trace' if you want to see the numbers." Ms. Marshall goes over to
Carter's table and helps him find numbers using the 'Trace' command. Jimmy hands a calculator
to Ms. Marshall and tries to use Chase's calculator. Michael raises his hand to get help. As Ms.
Turner approaches, Michael says something that she cannot understand. He repeats, "Where are
the numbers?" Ms. Turner shows Michael the table with the numbers and Michael responds,
"Oh, okay." Ms. Turner reminds Michael not to ignore the numbers on the right side of the
column.
Ms. Turner explains to Marie and Sandy the procedure for graphing the data and reminds
them of the option of doing it with paper and pencil or with a calculator, and Marie immediately
picks up a calculator. Michael and Marie are entering numbers into their calculators. Sandy tells
Jeff that she "can't get the numbers out" and points the screen toward Jeff for him to see. Jeff
suggests hitting the 'Clear' button, so Sandy tries that several times. That must have worked
because she is now entering data into the calculator.
Sandy and Marie position their calculators adjacent to the data table and use their left
index fingers to follow the numbers in the table while pushing buttons on the calculator with
their right hand fingers. Michael alternates between holding the calculator above his desk and
resting it on his leg. Michael's hand goes up again and Ms. Marshall comes over to help. She
brings a graphing calculator with her, places it next to Michael's calculator and compares the
data. She then moves to Will's table and reminds the class to answer the questions once they
have a graph.
Ms. Marshall asks Richard and Edward if they have made their graphs yet. She sits on
the corner of the desk in front of Richard and asks them if they know what to do to get their data
into the calculator. In the meantime, Jimmy hands his calculator back to her and says, "It keeps
88
saying 'Undefined.'" She looks at his calculator, quickly pushing some buttons and says, "I know
what it is, you have two plots on instead of one." She tells him to turn that plot off and hands the
calculator back to him. She then turns back to Richard and Edward and asks them, "Where's the
data you're going to graph?" Edward shows her where the chart is and they discuss briefly how
to enter the data into the calculator. Ms. Marshall continues to help Richard and Marie's hand
goes up.
Ms. Turner, who has been helping Julie and Belinda, moves to respond to Marie. Ms.
Marshall stops by Chase's table and asks, "You all don't have questions answered?" Several
boys from that part of the room respond, "No." Ms. Marshall asks, "Why not?" She then moves
quickly from Jimmy, by Mark and Ted, and stops to help Tim. Ms. Turner helps Michael briefly
and then goes to collect the calculator Adam was using.
Ms. Marshall moves back to Cindy, Steven, Belinda and Julie's table and asks, "How are
you all doing with the questions?" Belinda replies, "We're done." Cindy follows, "I don't
understand this question." Ms. Marshall leans on the table with her elbows and explains, "Well,
he made a prediction, so if the area under the curve is one hundred percent, where is ninety
percent?" Belinda answers, "We put two thousand." Ms. Marshall responds by asking, "How
does that compare with what you got for two thousand?" Cindy replies, "I don't know, because I
don't know this, what you're talking about." Ms. Marshall uses money as an analogy to help
explain the concept of percentage to Cindy.
Ms. Turner announces to the class that there are only two minutes remaining before the
bell rings to end class. She reminds students to clear the lists on their calculators. Ms. Marshall
asks students to finish their questions before class is over. She then directs students to go to the
first question on the back of the activity sheet, she reads the question, and explains how to
answer the question. The bell rings and Ms. Turner asks students to please bring their calculators
to her before they leave and says, "Have a nice Easter. See you on Tuesday." Tim puts his
calculator back in the box. Sandy and Mark hand their calculators to Ms. Turner as they pass
her, as does Ted.
When students return from Spring Break, they go over "Resource Depletion" lab activity
and take a short, ten-question quiz (see Appendix D). For the quiz, students are allowed to use
their lab reports. A survey was administered at the end of the quiz. The questions were written
on an overhead transparency as the last two questions of the quiz (see Table B). Students were
89
instructed by Ms. Marshall to complete the questions on a separate sheet of notebook paper and
turn them in.
It was emphasized to the students that their responses would not be graded and that they
had the option of writing or not writing their names. Eighteen students turned in their responses
and ten of them identified themselves. The purpose for giving them the option of writing their
name was to provide anonymity with the intent of promoting openness. The questions were
designed to be open-ended with the intent of gaining a sense of how they felt about using
graphing calculators--what they liked about it and what they didn't.
A "?" in the student column indicates students that opted not to identify themselves.
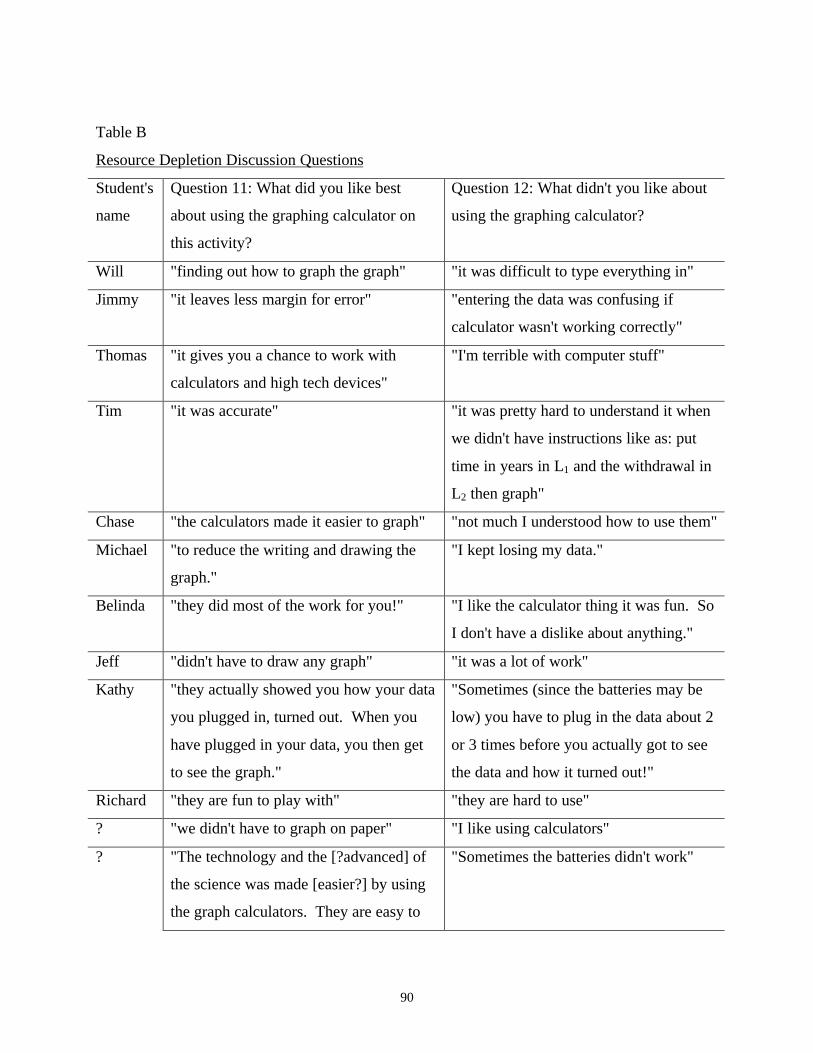
90
Table B
Resource Depletion Discussion Questions
Student's
name
Question 11: What did you like best
about using the graphing calculator on
this activity?
Question 12: What didn't you like about
using the graphing calculator?
Will "finding out how to graph the graph" "it was difficult to type everything in"
Jimmy "it leaves less margin for error" "entering the data was confusing if
calculator wasn't working correctly"
Thomas "it gives you a chance to work with
calculators and high tech devices"
"I'm terrible with computer stuff"
Tim "it was accurate" "it was pretty hard to understand it when
we didn't have instructions like as: put
time in years in L1 and the withdrawal in
L2 then graph"
Chase "the calculators made it easier to graph" "not much I understood how to use them"
Michael "to reduce the writing and drawing the
graph."
"I kept losing my data."
Belinda "they did most of the work for you!" "I like the calculator thing it was fun. So
I don't have a dislike about anything."
Jeff "didn't have to draw any graph" "it was a lot of work"
Kathy "they actually showed you how your data
you plugged in, turned out. When you
have plugged in your data, you then get
to see the graph."
"Sometimes (since the batteries may be
low) you have to plug in the data about 2
or 3 times before you actually got to see
the data and how it turned out!"
Richard "they are fun to play with" "they are hard to use"
? "we didn't have to graph on paper" "I like using calculators"
? "The technology and the [?advanced] of
the science was made [easier?] by using
the graph calculators. They are easy to
"Sometimes the batteries didn't work"
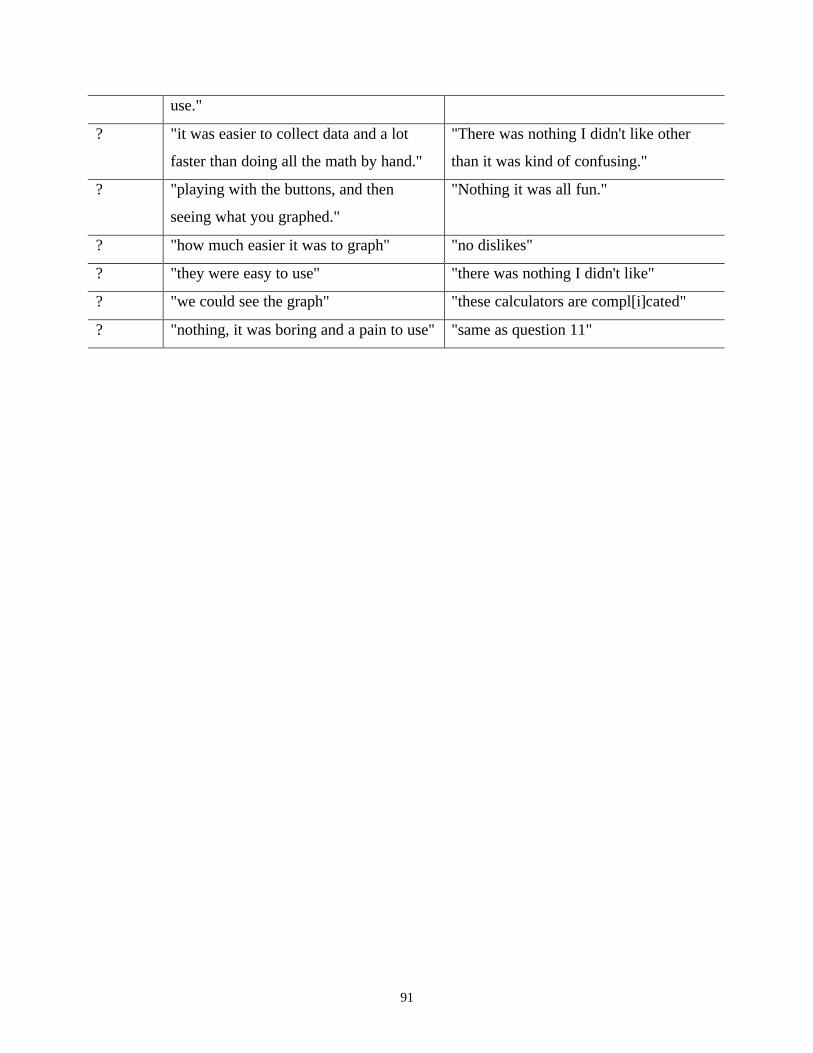
91
use."
? "it was easier to collect data and a lot
faster than doing all the math by hand."
"There was nothing I didn't like other
than it was kind of confusing."
? "playing with the buttons, and then
seeing what you graphed."
"Nothing it was all fun."
? "how much easier it was to graph" "no dislikes"
? "they were easy to use" "there was nothing I didn't like"
? "we could see the graph" "these calculators are compl[i]cated"
? "nothing, it was boring and a pain to use" "same as question 11"
92
Vignette Three analysis. Perhaps since students had used graphing calculators the
previous day, they seemed to need less instruction and had fewer technical difficulties. The
activities for both days required students to enter data into 'L1' and 'L2' and to produce graphical
inscriptions for interpretation. Most students were able to produce an inscription, but due to the
shortened period, many students did not finish answering the lab activity questions by the time
the bell rang to end the period. They did complete the activity and took a lab activity quiz the
first day they were back in school.
The shape of the line in the inscription (Appendix C) was to illustrate the concepts of
exponential growth and exponential decline in the production of a resource over time.
Exponential change, as pointed out by Ms. Marshall, is a key concept in EPS. Earlier in the year,
human population growth was explored using graphing calculators and the concept of
exponential growth.
Given the option of using a graphing calculator or producing a graphical inscription with
paper and pencil, every student chose the calculator. From the comments they made on the quiz
questions, many of them hold the opinion that calculators make graphing easier. Five responses
used the terms "easy" or "easier" and four other responses were similar in meaning.
Students handle and position their calculators in different ways. Some students
positioned the calculator adjacent to the data table and entered numbers in the calculator on one
hand while keeping track of the rows of data with the other. One student put the calculator in his
lap and while entering data he held the calculator with both hands, pushing buttons with his
thumbs.
As with many other events, Richard and Edward needed prodding to get started. They
seemed to understand what to do and were able to operate the calculator, they just needed Ms.
Marshall to come to their table and get them started.
Overall, the survey responses indicated that graphing calculators made the task of
creating a graph easier. Even the second question (see Table B), five students responded with
positive comments about using the graphing calculator rather than something they did not like.
Jeff's comments were paradoxical. On the one hand he liked that he "didn't have to draw a
graph", yet, "it was a lot of work." Three students mentioned it being "confusing" or
"complicated." Three students made technical comments such as "I kept losing data," "it was
difficult typing everything in," and, "sometimes the batteries didn't work." One student's
93
comment, "it was difficult to understand when we didn't have instructions like as: put time in
years in L1 and the withdrawal in L2 then graph," underscores the need for clear, concise
directions for operating the calculator.
Teachers' Reflections and Perspectives
During the course of the study, it became apparent that much of what transpired in
classroom was greatly influenced by how the teachers' personal and professional experiences
impacted their teaching philosophy and pedagogy. As such, the following section summarizes
the key ideas that emerged.
Teaching Alternative Students
"The slower students". Every teacher agreed that including hands-on activities and
utilizing technology was a good way to involve EPS students, yet many times these things are
not included in the classes they take. The reason for this, as explained by first year EPS teacher
Ms. Jenkins, was due to a commonly held perception of these students. She said,
I know a misconception that I've heard from a lot of teachers is that this was looked at as
the alternative class…the slower students…I think that they've kinda been put in the track
through many of the classes that they've taken. And maybe because of their attendance
record, or because of their behavior record, they've been looked at as the dumb students,
the students who can't do these activities. 'You don't want to give this group a lab to do
because they'll just break your materials,' or, 'they won't do it.' 'You don't want to put
them on the computer because they won't pay attention.'
Both Ms. Jenkins and Ms. Marshall spoke of a common perception among teachers of
EPS students. According to them, they are seen as irresponsible and therefore should be
restricted or otherwise denied the use of equipment. If a teacher perceives students as being
irresponsible, they are less likely to include opportunities that involve handling breakable,
delicate materials such as laboratory and electronic equipment. The assumption is that these
students are not capable of functioning as well as other students. Labeling students as
irresponsible can have a serious negative impact on their educational experiences. As Ms.
Marshall and Ms. Turner's class demonstrates, when EPS students are shown respect and trust,
they are responsible, appreciative, and more motivated to participate and learn.
94
The "red-haired stepchild" of all the other science courses. Given a choice, most science
teachers at Flood would not teach EPS. Ms. Marshall explained her perception during an
interview:
It started out being the red-haired step-child of all the other science courses…it's not
purely in their curriculum area and also you get the students that aren't real motivated to
perform in science…Plus you also have special ed[ucation] students in high numbers and
those high ratios. A lot of the pure science trained teachers, I think, they find it difficult
to work with special education students with the special needs they have and some of the
adjustments they need to make in their teaching styles in order to address the needs of
these special students. It's harder and it also adds to their preps.
Besides Ms. Marshall, two other teachers teach EPS. Both teachers mainly teach Earth
Science and are relatively new to Flood. Ms. Jenkins, who teaches four sections of Earth
Science, explained how she came to teach EPS this year:
Well, they needed somebody to teach it and I was willing to take it on…It was more like,
[the department chairperson] said, 'we have these classes that I need someone to teach
'em. Can you teach 'em?' And two, my circumstances, last year I was a first year teacher.
I was the one that was untenured. I was the one that was on the yearly contract that wants
to be back next year. So, I would have taught underwater basket weaving had I needed to
teach underwater basket weaving.
Although she said she had enjoyed her EPS class, she felt pressured to teach EPS since she was
asked directly by the department chair and she was untenured. Being willing to teach EPS made
her continued employment more likely and her position at Flood more secure. At Flood,
teachers in the science department, with the approval of the department chair, make the decision
of who will teach EPS. For years, Ms. Marshall has taught EPS and its precursors because, as
she said:
I like these kids. I think schools as a whole tend to recognize and do things for the
advanced kids or the ones that are very low but they leave out the middle of the road kids.
I enjoy working with 'em. I think they have a lot that they can do. They perform well for
me because I like them and I like the course…And given the choice of teaching Biology
which I have taught for many, many years or EPS, I chose the EPS. Most of the teachers
here thought I was nuts but I think it's worked very well for me.
95
When Ms. Marshall speaks about teaching EPS and the students that take the class, she
speaks with enthusiasm and personal conviction. She likes the course and she likes the students.
She believes in her students' abilities and feels they deserve to have a good learning experience.
She feels educational opportunities have been systematically denied to these students and she
wants to do what she can to change that. During the course of the study, two aspects of Ms.
Marshall's pedagogy were essential in understanding her role in the classroom--her approach to
classroom management and her use of technology. In each case, Ms. Marshall cited workshops
or professional conferences as being significant in the development of her pedagogy. In addition
to her professional experiences, it became obvious that Ms. Marshall had developed pedagogical
skills in teaching students with disabilities in a regular classroom.
Ms. Marshall's personal experiences, both as a teacher and as a parent, are critical factors
in her philosophical and pedagogical approach to teaching EPS. She said she thought her
daughters had negative feelings toward school because some of their classroom experiences were
discouraging. By Ms. Marshall's account, these experiences made a strong impact on her
feelings about students that are placed in regular classes and the teachers that teach them:
Well I think because they are not the advanced students, that sometimes they are in
classes where they have the weaker teachers. They have teachers that are new to the
system that don't know all the classroom management techniques. And, sometimes they
get these lesser level classes and I think the kids suffer from it. Then they have poor
experiences in school and it doesn't make them like school any better.
What is implied is that advanced classes have "stronger," more experienced teachers and general
or inclusive classes have "weaker," newer teachers. Students in academically lesser classes
receive a lesser education. As a result, given these experiences, students' overall impression of
school suffers and their motivation to learn decreases.
"Disciplining with dignity" and "the red chicken." Ms. Marshall's approach to classroom
management has several essential facets. She is assertive but respectful and she tries to foresee
potential problems by adjusting her proximity and accessibility to students.
Ms. Marshall recalled a video that illustrates her commitment to being assertive in the
classroom matters:
One of the best things…is a video called "The Behavior of Chickens." What it shows is
that in a social group, you have a structure from the top chicken to the one that gets
96
picked on all the time…. Showing the social behavior of chickens and talkin' about how
the teacher had better be the red chicken in this classroom because if they're not, then one
of the students is gonna assume that role and they're going to take over. They're gonna
determine what goes on and how the whole class is run all year.
As the reference to the video suggests, Ms. Marshall sees the classroom as a social system with
one person in control. The teacher should be in control, or a student (or students) may assume
that role.
When she interacts with students, she is generally direct but she often has comments that
are reassuring or encouraging in tone. With most activities, she moves around the room often
and she touches or pats students on their backs as she listens to them. When asked to describe
how she developed her approach to classroom management she said she practices what she
called, "disciplining with dignity." Ms. Marshall's approach was greatly influenced by a
conference she and a fellow Flood teacher attended years before. The technique, championed by
Lee Canter (1976, 1978, 1986) called assertive discipline, included many ideas she agreed with
but with one exception. She felt the practice of writing a misbehaving student's name on a
clipboard and keeping a tally of their infractions was demeaning--it did not jibe with her
philosophy. The experience motivated her to define her own technique. Discipline with dignity,
according to Ms. Marshall, is based on mutual respect between a teacher and student. If a
teacher has a problem with a student she should avoid a verbal confrontation in class. Instead,
Ms. Marshall explained, she should "take them aside or outside and discuss things with them."
In this way the teacher could address the problem in a constructive, direct way but at the same
time, allow the student to "save face" in the eyes of his peers. She thought it was effective
because the teacher could invoke discipline yet avoid the incident becoming a classroom
disturbance which might escalate tempers or degrade the student.
The researcher never observed an instance when Ms. Marshall took a student outside of
the classroom but it seemed she embodied that philosophical approach in dealing with students
on a daily basis. She appeared to show respect in the things she said to them and her tone and
there seemed to be an unspoken understanding that she expected the same from them. The few
times the researcher heard her address a student for behavior, she directly addressed the student's
behavior and asked the student not to do it again.
97
She often included "please" in her behavioral requests such as "please stop hitting," and
"listen please." She also often thanked students for being compliant or for their appropriate
behavior. Following one of the lab activities, she told the class, "Folks, I'm really proud of you.
You did a nice job following directions and getting your lab set up. Pat yourself on the back.
You did a nice job today." On another occasion a student came into class and walked to her seat
during the Pledge of Allegiance and Ms. Marshall said, "You don't keep walking during the
Pledge." The student responded apologetically, "I'm sorry."
Ms. Marshall would sometimes include her own feelings when she talked to a student
about behavior. On one occasion, a male student who had been in juvenile detention during the
year, took a bottle of perfume from a female student and was spraying it in the air. Ms. Marshall
was either unaware or ignoring the incident until she heard the student comment about wanting
to "test the flammability of the perfume." She finally interceded in a calm, matter-of-fact manner
saying, "No, don't spray any more of that stuff, it gives me a headache." Shortly after she said
that, he gave the perfume back. She reasoned that explaining her feelings to a student would
promote open communication and help students to understand her expectations.
Another important part of her classroom management technique involves moving around
the room and being in close proximity to students. Moving around the room was not just a
technique to preclude inappropriate behavior--she used it to keep in touch with students and what
is going on in the classroom. When Ms. Marshall moved through the maze of book bags, tables,
and students, she encouraged, guided, modeled, and molded students by her attention, her touch,
and the things she said. In an interview she explained her reasoning:
I think teachers that are up on their feet and walking around have a whole lot better
behaved classes than those that the teacher sits behind the desk in the front of the room or
the back of the room or wherever and doesn't get up during the day or during the class
period. Because then you always know what's going on in your classroom. And you
know who's doing what and you know whether they're on task or whether they're not.
But it also gives you a chance then to pat somebody on the back and say 'hey that's a
good job, I like the way you've done this' to give a little boost.
By her account, being in close proximity to students asserts her influence more directly but
allows her to be encouraging and supportive and has significantly decreased the number of
administrative misconduct reports. She explained:
98
You anticipate problems and deal with them before they take place just by being
present…I venture to say that I probably have written misconduct reports maybe twice
this whole year for all ninety-some students that I have which I think is exceptional. So
there are other ways to deal with disruptions besides writing misconduct reports.
Ms. Marshall spoke with pride about the number of discipline reports she had filled out during
the year. She was convinced that discipline reports had to be used in some cases but are
generally not the way to effectively deal with classroom management. Rather, effective
classroom management depended on her ability to foster the social values of mutual respect and
shared responsibility within the classroom. Ms. Marshall wanted students to know that success--
social and academic--was not only possible, it was expected. Success can lead to improved self-
concept and foster self-discipline. Therefore, discipline was not so much a reaction to
misbehavior as it was a natural outcome of promoting a respectful, responsible classroom. If
students perceive that they are expected to succeed and are treated with respect, they are more
likely to want to perform better.
Using Technology with Alternative Students
Technology: A tool for many purposes. A significant event that helped to motivate Ms.
Marshall to include more technology in her practice was a conference she attended the year
before. As she explained, the experience provided her with many new ideas and boosted her
confidence. The conference, she said, "was one the most helpful things I did. Because there
were probably two hundred choices of things to attend at all different levels." She was also
pleased at the organization of the sessions by technology experience level. She said it gave her
the confidence to try things that otherwise would have been too difficult. A teacher must feel a
certain level of confidence in order to be able to use a technology in class. Students expect
teachers to be able to use technology competently and that puts added pressure on a teacher
learning a technology. It is important for a teacher to believe a technology is the best
instructional tool but she must also be confident enough to risk the attempt. As with any
instructional tool, if the teacher becomes proficient and confident, the tool can become a medium
for many learning possibilities.
Technology, for Ms. Marshall, is more than a tool for learning science. From her
perspective, technology serves multiple purposes. By including technology, it demonstrated trust
and respect to students that are often denied these social benefits. Unlike their peers taking
99
Chemistry or Physics, most EPS students do not own graphing calculators--only two students in
Ms. Marshall's class. So, any other opportunities to use graphing calculators would be limited to
Algebra I. For EPS students, she explained, including technology in classroom activities sends
an empowering message. She elaborated:
I think it means that I think they're smart enough to handle it. I think some of 'em have
been told subtly for too long that they're not smart enough to do things. When the
teacher's expectations are high, they follow those expectations. I think they do
exceptionally well with the technology.
By putting technology in the hands of her EPS students, she gives her students the message that
they are intelligent, capable, and that she believes in their abilities. In providing her students
with the opportunity to handle technology, she sees their confidence increase and their pleasure
of school improve as they gain more knowledge and self-assurance.
In addition, exposing students to technology prepares them for a growing technological
world. During an interview, Ms. Marshall said she thought it was her job to purposefully include
technology in EPS. She explained:
I think we ought to take advantage of every bit of technology we can get our hands on.
Because I think we are becoming a highly technological society…. Whether they are the
cash registers that are all computerized these days or…[i]f they're workin' in the
automotive industry, cars are computerized and they have to know what the readout says
and they have to know what data to plug in or how to hook the parts together…. I hate to
see students graduate with no plans, with no specialty area, or nothing they can do
well…at least this would give them a few more tools that they can use.
By Ms. Marshall's account, the world is technological and by including technology in the school
experience, she is helping students be better prepared to live and work in society.
Graphing calculator as an assistive technology. Like other science courses, EPS has
many opportunities for activities that require students to produce graphs from data they gather
themselves or from the teacher. Ms. Turner explained trying to get many EPS students to graph,
especially large amounts of data, could be frustrating and self-defeating. She elaborated:
Some kids have a really hard time with graphs--they don't understand 'em. There've been
years when we didn't really use the graphing calculators and they actually had to make a
graph themselves. That was a nightmare. There are some kids that could no more count
100
over five and up two and plot a point and do all those kinds of things. They couldn't set
the graph up to start with and then to actually plot points there's all that spatial and
moving and all that kind of thing that's really difficult for them.
She explained that many students have specific learning disabilities related to "spatial
relationships" or hand-eye coordination. Furthermore, some of them have trouble with
numerical sequences and patterns. She recalled trying to explain to a student how to number a
graph and counting aloud, "five, ten, fifteen" and the student responded, "twenty-five."
Ms. Turner sees graphing calculators as assisting students to mediate their disabilities.
She explained:
Well, with a graphing calculator all you have to do is put in the numbers and it makes a
graph for you so that they're able to see what the graph is supposed to look like correctly.
And they haven't had to knock themselves out to draw the graph…you've cut down on the
frustration level with some of the kids and so they're able to complete it and feel better
about what they've done.
The Individuals with Disabilities Education Act (IDEA) defines an assistive technology as 'any
item, piece of equipment, or product system, whether acquired commercially off the shelf,
modified, or customized, that is used to increase, maintain, or improve functional capabilities of
a child with a disability" (IDEA, 2001). Although they are not typically listed as an assistive
technology in special education teacher training texts, the IDEA definition would not preclude
calculators. Several students' IEPs suggest the use of a computer for some tasks. Graphing
calculators, as Ms. Turner and Ms. Marshall demonstrate, can serve as an assistive technology
for both regular and special education students.
In summary, the use of calculator technology supports the culture of the classroom both
instructionally and socially. To be effective in utilizing an instructional technology, a teacher
needs an adequate level of confidence. For Ms. Marshall, she said she has "always been
interested in new gadgets," but reinforcing her interest were workshops and conferences she
sought out to gain more knowledge and experience.
Since EPS students are sometimes thought of as being irresponsible, including
technology was a tangible means to engender gratitude, trust, and respect. Many EPS students
will be entering the workforce soon, exposure to technology would help them gain valuable
experience and build confidence for life after graduation.

101
EPS classes typically have a high number of students with learning disabilities. As such,
calculator technology can help mediate some disabilities, increasing the likelihood that students
will experience success. In general, these students thought calculators made their tasks easier
and more enjoyable, both indicators of the place technology has in EPS culture.
102
Chapter IV
Introduction
An ethnographic approach afforded a detailed case study of a classroom with technology
meaningfully situated in cultural context. The following discussion summarizes the major
findings of the study related to the research questions, previous studies, and emergent theory. In
this context, emergent theory refers to analytic conjectures generated from the themes that came
to light during fieldwork and analysis. In each case (there were four), the researcher was
unaware, before the onset of fieldwork, that these themes would surface. One example of an
emergent theme was the emphasis the participating teachers put on making the classroom a
"regular," as opposed to an "inclusive," classroom. After reviewing additional literature, this
idea seemed congruent with some of the key tenets of the Regular Education Initiative. Another
emergent theme came from analyzing interviews and conversations with teachers when they
talked about EPS and EPS students. In this case, the idea of social capital came from a book
(McQuillen, 1998) the researcher had read for a class, the year before. Other emergent themes
came from how the teacher handled classroom discipline and how personal experience impacted
her teaching philosophy. The chapter concludes with a discussion on educational implications
followed by recommendations.
The research questions were:
1. What goes on in this science classroom?
2. How do teachers and students use graphing calculator-based technology?
3. How do teachers and students talk while using graphing calculator-based technology?
4. What is the nature and form of inscriptions produced as a result of using graphing
calculator-based technology?
5. How do social interactions occur when students work with graphing calculator-based
technology?
6. What social meaning does graphing calculator-based technology have within the culture
of the classroom?
Discussion
The Setting
From inclusion to regular education. Systemic changes in Flood's alternative science
offerings are representative of national special education and regular education reform initiatives.
103
Concepts such as mainstreaming, inclusion, and integration have become buzzwords in the
reform dialogue. Although there are many interpretations and applications of these ideas, they
all share the goal of including students with disabilities with their non-disabled peers in regular
classrooms. One such effort, the Regular Education Initiative, varies somewhat from special
education initiatives in that it is not solely about the question of whether special education
services should be delivered in separate or integrated settings. Though setting is the primary
issue, REI includes many related issues such as labeling, testing, and the roles of regular and
special educators (Lloyd & Gambatese, 1990). EPS at Flood operates with many of the same
goals and concerns of REI. Putting the philosophy of REI into action requires many cultural
considerations beyond the guiding goal of inclusion. Labeling was an issue Ms. Turner was
especially sensitive to in her role in the classroom. To her, she was there to teach all students,
not just the ones that had been labeled as students with disabilities. When offering the option of
having a test read aloud, an accommodation in several individualized education plans, it was
offered to all students, not just those with disabilities. And, although their cooperative planning
time had decreased, Ms. Marshall and Ms. Turner found time in their schedules to discuss, plan,
and reflect on their respective roles within the classroom.
Ms. Marshall and Ms. Turner incorporate a number of instructional strategies that could
be applied in any classroom but are particularly recommended in literature for an inclusive class
(Learner, 1993; Smith, et al, 1998; Keel, et al, 1999). Cooperative learning (as described
previously), organizational schemes, technology mediated instruction, and alternative forms of
assessment are four such pedagogical considerations. For example, when introducing a new unit,
Ms. Marshall and Ms. Turner used advance organizers to help students create schema to connect
prior knowledge to new concepts and ideas. Also, students kept a portfolio with samples of their
work, which was turned in at least once every nine-week grading period for a significant part of
their grade.
Students repeatedly commented that using calculators made their tasks easier. The use of
technology as a tool to mediate difficult, intensive tasks is especially important with students
with learning disabilities. In this role, calculators act as an assistive technology, making it
possible to achieve more, and to go into greater depth in a shorter period of time than what
would have otherwise been possible. Students with learning disabilities often get frustrated or
otherwise have difficulty with extended, tedious tasks such as graphing data.
104
Discipline with dignity. Ms. Marshall uses several key pedagogical components in her
classroom practice. First, she employs an adaptation of Canter's (1989) behavioral model termed
Assertive Discipline. She holds that responsible behavior can be fostered by maintaining a
respectful atmosphere--respect for the teacher(s), respect for other students, and respect for the
rules. When possible, she avoids getting into a verbal battle with a student. Rather, she prefers
to address the issue outside the classroom or after class where she can express her concerns away
from the distraction and influence of other students. According to Ms. Marshall, the issue is
confronted but in such a way that it allows the student to save face. Her assumption is that
students benefit from the structure afforded by rules and limits applied fairly and sensibly.
Congruent with Canter, Ms. Marshall believes students and teachers have educational rights in
the classroom and that it is up to the teacher to establish and maintain an environment that
sustains those rights. She differs with Canter's model in that she does not record a student's
violations on the board or on a tally sheet. She said she felt these actions were demeaning. She
called her approach "discipline with dignity." Students seemed to respond well to her treatment
and exhibited generally responsible, respectful affectations. Discipline, according to Ms.
Marshall, must be asserted but must also be tempered with dignity.
Teacher professional and personal experience. The professional conferences and
workshops Ms. Marshall has attended have been a critical factor in her pedagogy as has her
personal experiences as a parent. Personal experience can also have a profound affect on a
teacher's pedagogy (Nespor, 1987). Ms. Marshall's daughters, whom she described as "average
students," had negative experiences in general education classes taught by inexperienced or
uninspired teachers with ineffective classroom management techniques. She felt these
experiences contributed to their overall negative opinion of school. Ms. Marshall tries to make
EPS a structured yet enjoyable experience for her students--one that might influence, in a
positive way, how they feel about science, school, and education in general. In this way, Ms.
Marshall hopes students will transfer what happens in her class to other areas of their lives.
The Use of Graphing Calculator-based Technology
A learning tool. Like MBL technology, graphing calculator (and CBL) technology can
be an effective learning tool. Just as Mokros and Tinker (1987) found with MBL technology,
CBL technology connects events with their symbolic graphical representations. In interviews
105
following the Passive Solar Homes lab activity, most students were able to interpret Figure E to
determine when significant events and processes occurred.
In addition to its use with probeware, graphing calculators can be used independently as
an effective means to enter and store data. Tables can be created and graphs produced by
performing a relatively simple series of programming commands. However, as illustrated in
Vignettes Two and Three, these functions are not easily memorized by these students. Even with
the directions on the blackboard, the teachers had to repeatedly go over the instructions. By
contrast, when a graphing calculator is connected to probeware (Vignette One), very few
algorithms need be performed. Students typically find the program to run in the calculator's
memory, initiate the program, and wait for the program to end.
The traditional graphing method of collecting data by hand and plotting points can be a
particularly frustrating task for students with certain learning disabilities. By instantaneously
producing graphical representations, graphing calculator technology eliminates the chore of
graph production by hand.
Regardless of what task is before a classroom of students, the teacher is a critical factor in
determining its success. As the work of Krajcik, Layman, Starr and Magnusson (1991) showed,
the overall effectiveness of a technology hinges upon the teachers' confidence and understanding
of the technology. Ms. Marshall was confident and knowledgeable, so graphing calculators were
successful. In contrast, Ms. Jenkins, new to EPS and unfamiliar with the technology, in her own
words, "felt less confident." Consequently, after trying an activity with graphing calculators
which "turned out to be a disaster," she reverted to traditional paper and pencil graphing.
As in the studies conducted by Linn and Songer (1988), and Thornton and Sokoloff (1990)
showed, engaging students in making predictions before an activity using MBL technology can
enhance concept understanding. Ms. Marshall found this to be an effective strategy with CBL
technology. On the first day of the "Passive Solar Homes" activity, students were asked to
predict which solar house design they thought would keep temperature the most stable. After
analyzing their results, students had to revisit their predictions and restate their hypotheses.
Though sometimes "confusing" or "complicated," EPS students generally spoke
affirmatively about using graphing calculator technology and preferred using graphing
calculators to the traditional method of paper and pencil graphing. Behaviorally, EPS students
responded favorably while using technology. Overall, they handled the equipment responsibly,
106
and in most cases, seemed to genuinely appreciate being given the opportunity to use the
technology.
Technology as a social artifact. As David Nye (1995) explained, the perception of
technology as an autonomous object with immutable, value-free functions is inaccurate. Rather,
technology is part of a social world imprinted by visible and invisible social actors and social
forces. Further, physical objects, according to Howard Becker (1998), do not have inherent
objective properties. The meaning of an object comes from how the object is understood which
is imbedded in how it is used and talked about. Both Nye and Becker rejected the notion of
technology as value-free or neutral. For many of the participants in this study, graphing
calculator technology had pragmatic import--it made the otherwise arduous task of graphing
easier and more engaging. But technology also had a broader, social meaning. By facilitating
the use of technology, Ms. Marshall and Ms. Turner provided a tangible means of empowerment
for their students. Students typically regarded as academically unsuccessful were given
opportunities to explore sophisticated scientific concepts using technologies usually reserved for
more academically and socially adept students.
Unlike their peers in Advanced Placement Biology, Chemistry, or Physics, most EPS
students do not own their own graphing calculators. In addition, since they do not typically take
math courses beyond Algebra I or Geometry, they have considerably less experience with the
technology. Of the 270 graphing calculators in the science department at Flood, many of them
were seldom used. The department chair said they could do with "a hundred or so." Each
teacher was assigned 30 calculators at the beginning of the year and how they are used is
determined by the teacher. When science teachers did use graphing calculators, most of the time
it was to perform simple mathematical four-function algorithms that could have been performed
on a much simpler (and less expensive) calculator.
The Virginia Department of Education provided enough calculators so students would
not have to buy them, but what happened within the William County school division was
unforeseen. Students with the means bought their own calculators and other students depended
on their teachers to incorporate the technology into their classes--classes, in many cases, with
teachers who were unable, unwilling, or chose not, to use the technology. Consequently, the
science department has many calculators stored on shelves, used only occasionally to perform
computations that could be done on four-function calculators at a fraction of the cost. Ms.
107
Marshall and Ms. Turner's use of technology was not typical of the science instruction with
graphing calculator technology practiced at Flood.
Classroom Talk
The language of EPS. Karen Gallas offered this window into her early experience with
science:
I never talked about science as a child. In fact, no one I ever knew ever talked about
science. It was a field that had nothing to do with my life; it employed a language in my
native tongue that I could not speak fluently. As a result, I, along with many other
children, came to the conclusion that I wasn't good at science. (Gallas, 1995, p. 2)
Gallas' poignant account underscores the power language can have in alienating a child from
science.
In analyzing classroom dialogue, it became clear that EPS students often opted not to use
technical or scientific terms. In fact, not once during the "Passive Solar Homes" lab activity did
the researcher hear students call any piece of technology by its technical name. Ms. Marshall,
taking the cue from her students, also avoided some words. A culture uses a native language
with rules of discourse, which have social meaning. Difficult or awkward expressions are
socially mediated or rejected. Attempting to use culturally unacceptable language can distance
members from a culture and create obstacles to communication and participation. As discussed
in Vignette One, Day two, Donna referred to the temperature probe as "give this to him" and
"plug that in." Richard, referring to the temperature probe said, "you might angle that down a
bit" and later referring to the graphing calculator said, "Is that thing graphing?" Ms. Marshall
referred to a CBL as "that thing, whatever it's called" and the temperature probe as "that
temperature thing." In so doing, Ms. Marshall employed a rhetorical device for social purposes.
Primarily, it establishes acceptance and validity for the use of a wide range of responses--not just
the scientifically accurate. If students feel what they say will be accepted, terminology
notwithstanding, then they are more likely to participate. Moreover, this approach fits better into
Ms. Marshall's teaching philosophy. She believes in treating students with dignity; therefore, she
carefully mediates situations when a student might feel singled out or attacked.
Gallas (1995, p. 2) said that the language of science, "has become more narrowly defined
and more exclusive." If that is accurate, considering the recent reform standard proclaiming
108
"science for all" (AAAS, 1993), science teachers face a formidable task in making science
literacy possible without excluding certain populations of students.
Inscriptions
Social practice. Inscriptions produced by students using graphing calculators were
typically line graphs showing the relationship between two variables (i.e., change over time).
Although it is possible to label axes on graphs produced by graphing calculators, this function
was never used. The inscriptions students produced consisted of three lines--one for the x-axis,
one for the y-axis, and one line displaying data in graphical form. The y and x axes lines had
small marks--one for each entry in the data table ('L1' and 'L2'). No instructional activities ever
included those marks--students were not asked questions either in lab reports or in discussion so
it is not known what, if anything, it meant to them. Classroom discussions of these inscriptions
usually involved the concepts of time (the x-axis), increases and decreases (the y-axis), and slope
(the character of the inscribed line). These inscriptions were mainly used to graph teacher-given
or student-collected data or to assess understanding on a test.
Producing the composite inscription (see Figure E) in the Passive Solar Homes lab
activity had a powerful impact on discussion and learning. The composite inscription produced
what Roth and Bowen (1994) called a cascade of inscriptions. The inscription each group had
produced, with all of its associated meaning, was easily combined (with the help of a computer
graphing program), with other inscriptions to produce one, layered inscription. The six-layered
inscription was used to embark on a series of discussions and interpretations making it possible
to delve into a variety of scientific processes, concepts, and applications. By placing the six
inscriptions on one geometric grid system, students were no longer looking at just a graph of
their data. Group data had undergone a transformation into class data.
First of all, the composite inscription had labeled axes (time and temperature) with
accompanying, scaled numbers. This made it possible to compare lines produced by each group
on one standard measurement system that was critical in making comparisons. Putting the
graphs together placed them in context of greater meaning and greater possibilities for
interpretation and application. The effect a heat sink solar design has on temperature has limited
meaning if it is not compared to other design variables. On the question of which design heated
the fastest (see Table A), many students were correct in their interpretation only to be told they
were incorrect by the teacher. While they did not argue for their interpretation, they did not
109
accept (or remember) the teacher's either, because most of them missed a similar question on the
test.
Social Interactions and Graphing Calculator-based Technology
Student group interactions. As with Vygotsky's (1978, 1986) commitment to learning
through social interaction, EPS students learned best when social situations were provided for
them to interact and collaborate. With an activity such as "Passive Solar Homes," there were
many tasks for groups to accomplish in a relatively short time period. Within any group, there
will likely be some common functions such as communication, negotiation, and assumption of
responsibility. The roles students assume in a group happen differently among groups and once
assumed, roles do not necessarily remain static throughout an activity. Further, once a group
begins to function collectively, it still interacts with the "outside world"--teachers, other students,
and other groups.
The cultural activity of working in small groups, established before the study began, was
essentially based on students' physical proximity in the classroom. Although students liked
working together and Ms. Marshall believed in the concept of cooperative grouping, little
attention was given to students' learning development and group dynamics. The main purpose
for this arrangement seemed to be to minimize the amount of moving students had to do. As
Tudge (1990) recommended, many factors need to be considered in constructing cooperative
learning groups. In this study, group interactions, such as collaborators' verbal skills, motivation,
and nature and quality of feedback may have had significant import for group construction in
light of the quality of group interactions that were observed.
When students worked together they were generally cooperative and task-oriented;
however, a closer look at their interactions revealed several deficiencies in terms of group
dynamics and learning outcomes. Three groups seemed to function effectively in terms of
participation and task completion, but two groups clearly had more difficulty. One group, given
the technology and the associated group roles, had too many students so some members were not
actively involved. Another group had two students capable and eager to manipulate technology;
however, neither contributed much verbally to the group. As a result, meaningful discussion was
impaired as collaborators got answers from others in the class and then shared those answers
with their partners, who often did little more than copy information.
110
As the classroom discussion (as described in Vignette One, Day three) demonstrated,
EPS students had difficulty applying the practical knowledge they gained from the lab activity
and the subsequent inscriptions to real-life situations. This reinforces the findings of Linn, et al,
(1987) and underscores the need for a better bridge between the learning that takes place during a
lab activity, the graphical inscriptions that are produced, and the application of knowledge to real
world situations. The students were frustrated at the confluence of what they learned from the
lab activity and the plethora of information and knowledge that was required to answer the
accompanying questions. Ms. Marshall, too, became frustrated when she had to spend so much
time guiding students to acceptable responses.
Social Meaning of Graphing Calculator-based Technology
Low social and cultural capital. EPS is the latest in a succession of high school science
courses offered as an alternative to Biology II, Chemistry, and Physics to traditionally non-
academic students needing an additional science credit for graduation. First termed General
Science, then Applied Physical Science, EPS is a historical, linguistic artifact situated in larger
political and social systems. Next year, the course will become Ecology. As with most
subcultures, the meaning of EPS is defined primarily by the larger culture(s). From that meaning
comes the basis for many social assumptions and circumscriptions.
EPS suffers from what James McQuillan (1998) termed "low social and cultural capital."
Although McQuillan's research involved at-risk, disadvantaged, urban students, several ideas are
applicable to this population of students and teachers. According to McQuillan, social and
cultural capital is the degree to which an individual possesses "the resources, knowledge, skills,
attitudes, and social ties that are valued and linked with success and influence in society" (p. 55).
Cultural capital in school can depend on how well a student can adapt to the norms of the
dominant social groups. Exacerbating low academic achievement, many EPS students have
learning disabilities, which can further deplete their cultural capital. A study by the National
Science Foundation (Changing America, 1989), concluded that "the single most significant
barrier faced by individuals with disabilities are negative attitudes on the part of faculty and
employers."
Social capital comes from the "social networks and relationships between adults and
children…within the family but also in the community…that are of value for the child's growing
up" (McQuillen, p. 55). Social capital can come from parents, ministers, counselors, and
111
teachers with whom the student comes in contact. Both Ms. Marshall and Ms. Jenkins felt EPS
students have received messages from their social contacts that they are "slow," "stupid," and
"incapable." Traditionally, schools have lower expectations for these students. Teachers often
spend more time teaching "the basics" and less time with meaningful, engaged learning.
However, Hixson and Tinzman (1990), found that rigid instructional strategies, narrow curricula,
and tracking hinder the performance of disadvantaged or at-risk students.
Because EPS is seen as an alternative science course, with academically marginal
students and a high number of special education students, experienced, more academically
oriented teachers generally do not teach it. Experienced teachers tend to have more of a voice in
their course assignments--an implicit perk of seniority. And once established, teachers that teach
a certain subject and level will likely remain in that track, thereby becoming, an Advanced
Biology teacher. Over time, social capital increases, as an Advanced Biology teacher becomes
synonymous with being an advanced teacher. The assumption is that better teachers should
teach better students who are naturally found in more academically challenging courses. As
found by Sinclair and Ghory (1987), many educators have become satisfied with not reaching
certain students. They note that, in response to calls for excellence for all students, some
educators exhibit a "curious resentment, as if they were trying to protect those students who can
learn under current conditions from those who can't or won't."
EPS tends to be taught by teachers that are new to the school system. Two out of three
EPS teachers at Flood were relatively new teachers. One of those teachers, Ms. Jenkins, claimed
she felt compelled to teach EPS from pressure in the department and because she was relatively
new to the school. For various professional and personal reasons, Ms. Marshall, a science
teacher of 28 years, chose to teach EPS.
As mentioned earlier, EPS students generally take few math classes with Standards of
Learning that require the use of graphing calculators and typically do not own their own
graphing calculators (only two students reported having graphing calculators). Therefore, over
the course of middle and high school, the time they use the technology is considerably less than
academic students. Through state policy, resources are systematically controlled and those with
lower social capital have less access to technology. However, emerging studies indicate that
technology used in classrooms can be especially advantageous for at-risk students. Means and
Olson (1995) found that access to educational technology at school can give students from low-
112
income homes, where there is little or no access to technology, an "edge to compete with
children coming from more affluent homes, where technology is commonplace" (p. 103).
With considerable inherent challenges and low social capital, EPS has students that few
want to teach and teachers that are seen as having similar social capital as their students. As a
result, educational opportunities for EPS students suffer as human and material resources are
diverted to more socially viable courses and students.
Educational Implications and Recommendations
EPS occupies a low place in the stratified social system of public school. The students who
enroll are generally considered to be non-academic, so by the accepted purpose of school, are
thereby antithetical. Many students have disabilities, which exacerbate low social capital. At a
time when the market principles of standardization and accountability dominate educational
reform, competition dominates the tenor of educational systems and as a result, those with less
capital suffer.
For various reasons, many teachers are unable or unwilling to include new technologies in
their classrooms. Classrooms with lower socioeconomic status or students with learning
disabilities can be even more formidable. However, pressure from state and federal reform
documents challenge science teachers to meet the needs of all students. The National Science
Education Standards state, "All students, regardless of age, sex, cultural or ethnic background,
disabilities, aspirations, or interest and motivation in science, should have the opportunity to attain
high levels of scientific literacy" (p. 221). Further, social and systematic pressures work on
teachers to learn and implement technology without having input as to the application, nature, and
purpose of that technology. As Ms. Marshall has done, teachers should face the challenges of
these mandates and find ways to strengthen their professional acumen. State, regional, and local
workshops are available for teachers to gain confidence with technology and new techniques for
working with students with disabilities. Within school systems, teachers may be able to find
special education teachers for support and teaming. The process of seeking National Board
Certification can help teachers become more reflective and empowered to grow professionally.
School science department faculty should earnestly examine how teachers are selected to
teach classes; ask what systemic mechanisms determine who teaches alternative students; and how
those mechanisms play out in terms of students' educational opportunities.
113
Classroom Environment and Cooperative Learning
Based on numerous observations, cooperative group activities were successful at involving
EPS students in more enjoyable and richer learning experiences. For the most part, students
participated in ways that seemed natural in helping their group to function and, at times seemed to
promote a sense of self-efficacy for group members. However, certain activities revealed group
weaknesses in such areas as communication, academic performance, and shared responsibility.
One area that might improve these qualities would be to consider some of characteristics of the
individual students that make up the groups. Based on research championed by Howard Gardner
(1993, 1995), "multiple intelligence" is the concept that intelligence is a multi-faceted construct
that comes to bear in the way people approach problems. Considering students' intelligences in
group construction might help teachers tap into students' natural abilities and provide a means to
experiment with group construction based on complimentary problem solving strategies. Further,
considering some of Jonathan Tudge's recommendations (1990), such as collaborators' verbal
skills, motivation, and nature and quality of feedback might be particularly helpful.
In the study classroom, the researcher observed no formal activities that would assist
students in working together cooperatively; therefore, group members relied on their own
interpersonal skills. Yet, according to Baker and Piburn, the most important part of establishing
cooperative learning groups is the "specific instructions that students receive about how to work
together" (1997, p. 354).
While observing students working in groups, the researcher noticed that some group
members assumed roles while others did not. One of the most common practices in cooperative
learning models is having group members take on specific, assigned roles. Because of the nature
of the experimental setup, usually with one graphing calculator per group, having roles for
students would be beneficial. Robert Slavin (1983) reported that differentiating tasks in
cooperative groups increases the energy of the students as students become the "expert" in some
area and are responsible for conveying their knowledge to others. In a later study, Slavin looked
at group composition and found that heterogeneous grouping can have positive effects on student
self-esteem, intergroup relations, acceptance of students with academic and physical limitations,
ability to work cooperatively, and attitudes toward school (Slavin, 1991).
Cooperative group size is another consideration, especially for certain tasks. For example,
during the Passive Solar Homes activity, given the technology and the tasks involved, a group of
114
four seemed to be the optimum number--five was probably too many. Even with the optimum
number of students, while technology gathers data, students are free to do other things. Teachers
should make sure students have specific directions and assignments during that time. If students
are not sure what they are supposed to be doing, they may turn to socialization. If students are to
have an active function within a group, then there should be roles for students to assume to
participate in a meaningful way. Along with roles, activities might be designed so that every
student is expected to contribute in a meaningful way. Also, the teacher might develop checklists
and procedures to monitor and assess individual and group performances.
For the most part, Ms. Marshall's classroom operates by her direction and authority. As
such, students are seldom involved in the management of the classroom or the assessment process.
Involving students in assessment might improve their cooperative skills, improve their sense of
responsibility to the group, and promote self-awareness and group interactions.
In introducing new science content, Ms. Marshall or Ms. Turner often proceed into a
didactic forum involving term or concept introduction with little or no engagement on the part of
the students. The main purpose for this practice, beyond providing information, is as a tool for
classroom management. Once the projector goes on and the teacher begins to talk, students stop
socializing and begin to settle into the routine. Ms. Marshall would stop at points during the
process and ask students about their knowledge, but as far as learning new content, most students
seemed to get little from the event. While didactic instruction is still a dominant pedagogical
mode, the National Science Education Standards point to the need students have to be motivated or
otherwise engaged before meaningful learning can take place. One suggestion is to use a "learning
cycle" model for the lesson in which didactic information is provided only after students are
engaged fully in the learning process. Baker and Piburn (1997) called for the traditional sequence
of instruction to be changed so that students are exposed to an exploratory activity or discrepant
event to get students engaged in the lesson before terms are introduced.
Students' (and teachers') use of unscientific language to describe scientific processes or
terms is the likely outcome of a lack of confidence or low self-esteem which might be the result of
years of exclusion from dominant cultural interactions. Teachers should continue to explore ways
to increase alternative students' self-confidence and self-concept. Ms. Marshall made a concerted
effort to encourage and praise her students, but in order for students to develop their own sense of
self-worth, they need to find motivation and satisfaction internally. Again, getting students more
115
involved in the assessment process, particularly self-assessment, could make them more aware of
their strengths and weaknesses. From there, a teacher might design scaffolded learning
experiences based on a child's zone of proximal development, aimed at building knowledge and
gaining confidence.
Technical
From comments made by students and teachers, having succinct, clear directions can help
students overcome the confusion of trying to operate a complex technology such as a graphing
calculator. Ms. Marshall would typically give directions verbally several times and sometimes
write simple, stepped directions on the board. It might be helpful to write easy to follow, step-by-
step directions on index cards the first time students use a graphing calculator and have that card
(or a modified version) available to students each time they use the technology.
When introducing a new technology to students, teachers will likely need to model its use
and to practice a considerable amount of patience and perseverance. Most technologies--graphing
calculators included--do not work as planned all of the time. Furthermore, there will undoubtedly
be instances when many different problems arise simultaneously. Advanced planning and
preparation can head off many problems and sometimes salvage an otherwise disastrous
experience. After just one bad experience with technology, a teacher can take a long time to regain
the confidence needed to try again.
Many times when the data linking cable is attached between the calculator and another
calculator or the CBL unit, a "link error" message occurs on the graphing calculator. The problem
can usually be remedied by making sure the cable plugs are firmly pushed in or restarting one or
both of the connected devices. Also, when planning cooperative group activities, the teacher
should keep the relatively small size of the screen in mind and what that might mean for group
learning and instructional design.
Graphing calculator batteries that came with the state purchase are rechargeable. However,
they typically only last a few years and must be replaced. In addition, normal deterioration and
replacement of broken calculators need to be considered. Most of the calculators purchased by the
state were TI-83s. The manufacturer (Texas Instruments) is marketing a new calculator (the TI-83
Plus) and TI-83s are no longer easily obtainable. The new graphing calculators have more
memory and an improved linking cable, however, how this technological transition will be funded
is not yet clear. So far, school divisions have had to assume the cost for replacement batteries and
116
calculators. Currently, renewable batteries cost $1 to $1.50 each and TI-83 calculators are about
$90 (TI-83 Plus is about $10 more than TI-83).
School Division Policy
Ms. Carter, the science supervisor for William County, is a strong advocate of the use of
probeware. She arranges opportunities for teachers to be trained through workshops during the
school year and during the summer. She said she encountered teachers who were hesitant about
probeware technology and some were concerned about the time required and the demands for
Virginia Standards of Learning test preparation. Nevertheless, it was Ms. Carter's opinion that
many teachers felt insecure about the technology and teacher confidence needed to be improved.
School divisions need to offer any support possible for teachers in their efforts to get
professional training, not only in technology, but also in areas such as special education and
classroom management. In a time when division and state monies are tightly budgeted and the
public is calling for accountability, it might be easy for administrators and policy makers to
forget about the seemingly transparent activity of professional development. The science
department chair at Flood commented one day that she thought it would be useful for teachers to
have more time to develop more activities using graphing calculator technology. She said she
felt teachers' technological preferences were not considered when the state purchased so many
calculators.
How calculators are distributed and used within a school system, statewide, or nationally
has the potential to be a meaningful future study. The distribution of technology can have
considerable implications regarding access and equity. Seeing the need to address this issue, the
National Academy of Sciences and the National Academy of Engineering proclaimed,
"Technology deployed in education can help remove inequities…Technology can become the
force that equalizes the educational opportunity for all students in all schools" (National
Academy of Science, 1995).
In talking to educators from William County and in two nearby school divisions, two of
the policies were very similar, but one was markedly different. William County's policy was to
distribute calculators to teachers to make a classroom set of thirty, to be used in the classroom at
the teacher's discretion. One district assigned calculators, like many districts assign textbooks, to
students at the beginning of the year and students returned them at the end. Under this policy,
students could use their calculators whenever they wanted, for whatever they wanted, and were
117
responsible for their calculator's condition at the end of the year. This added access to
technology could work toward leveling the playing field between non-academic students and
their more technologically and socially adept peers. School division policy should have a plan to
consider the needs of at-risk students to ensure equitable access to technology and the resources
and means to monitor and assess their efforts.
Conclusion
It is the researcher's hope that by encouraging discussion on the cultural meaning of a
technology, educators and policy makers will be better equipped to consider and evaluate a
technology's potential and limitations for all students. Looking in-depth at how technology is used
in a culture often reveals deeper social meaning, as it was in this case.
Understanding science better is but one reason Ms. Marshall uses technology. She uses it
because it keeps her students interested. It allows them to do some things otherwise not possible
with traditional methods. But perhaps more importantly, Ms. Marshall sees technology as a tool
that helps foster respect, builds trust, and provides encouragement for this culture--those intangible
qualities that good teachers engender--students, subject, and technology notwithstanding.
EPS students are a group of students low in social capital. These students have been
systematically overlooked by the state-supported impetus of technology and the educational
opportunities that might follow. National reform documents suggest that instead of sorting
students into ability and achievement levels, all students should be engaged in a varied
curriculum. Central to this perspective is the notion that equity and access need to be placed
prominently at the forefront of educational reform.
In recent years, technology has come to occupy a significant place in society and, so too,
in the classroom. With the advent of national and state standards and the call for schools to
better prepare students for employment, educational systems have become more responsive to
the needs of business and industry. Consequently, many of the tools that have come into the
classroom are largely a response to prepare students more for the workplace. State standards that
require the use of a specific technology take on added significance and many social forces are
acting to prepare students for the technological demands of life in the 21st Century.
As with any initiatives that require resources, some social groups benefit more from
technology than others. State-mandated technology meant to support high school math students
has been introduced into school divisions with apparently little planning for larger social issues,
118
particularly those of access and equity. The state's proclaimed purpose for the technology was to
support the Standards of Learning, primarily Algebra I and Algebra II, but emphasizing one
technology as a curricular technology inherently creates disparity. Students must be enrolled in
these courses to use the technology and EPS students seldom get beyond Algebra I or Geometry.
Like the previous decade's mass introduction of computers, the relatively sudden impetus
of graphing calculators, distributed statewide in the 1990s, put classroom teachers in a familiar
position. To use the technology in the classroom, teachers first had to learn to use it themselves.
Moreover, like the technological infusion of computers, many graphing calculators are not being
used, for many of the same reasons computers were not used. The public educational system
seems to be caught in a technological revolving door. The assumption seems to be that for
teachers to use technology, they have but to get technology. Getting the technology seems to be
the main objective--whether it is actually used, how it is used, and who uses it, remains unclear.
As the National Science Education Standards (1996) point out, "Technological solutions have
intended benefits and unintended consequences. Some consequences can be predicted, others
cannot" (p. 166).
Typically, due to low social status, not much is expected from EPS students
academically. The existing education system provides neither the quality of instruction nor the
support for technology that other social groups of higher status expect. In this study, two
teachers learned how to use technology in socially meaningful ways, students' limited access to
the technology notwithstanding. However, despite what values Ms. Marshall and Ms. Turner are
able to imbue within the walls of their classrooms, a larger, more powerful system is at work
with its own agenda. In this system, there is a distinct disparity in the distribution of technology
between academic students and the EPS students--a mirrored image of society, where policy
technology is introduced and justified in the name of "higher academic standards." The results
and consequences of a state-driven technology policy cannot be predicted or foreseen.
Therefore, citizens and educators need to carefully and thoroughly assess how education is
affected as a result of such a policy. To do that, educators should try to distance themselves from
the notion that a new technology is necessarily beneficial for all students; rather, educators need
to look at graphing calculator technologies with new perspectives and with new questions.