Embed Size (px)
Citation preview
1
CHAPTER – I
INTRODUCTION
1.1 Background With over one billion people in India, there is a need to increase food production to
meet the demand of the burgeoning population. As rice is the staple food in most
parts of India and there is a need to increase production of rice and productivity of
land under rice cultivation. India has the largest acreage under rice at 43.97 million
hectare with a production of 104.32 million tones and yield of 2372 kg/ha
(Government of India, 2012).
In fact the rice research programme in India over the past 50 years has largely
centred on shifting the yield frontier which contributed substantially to achieving
food security through increased rice supplies (CRRI, 1996). Several studies indicated
high payoffs to rice research in India (Evenson & McKinsey, 1991); Evenson, 1993;
Kumar & Rosegranht, 1994; Pingali et.al, 1997; Jha & Kumar, 1998 as quoted in Pingali &
Hossain, 1999). The rice output growth was 2.80 per cent per annum during 1966-99
with the highest rate of growth (4.00% per year) achieved during the 1980s. Yield
improvement in rice were major sources of strong output growth, largely due to
widespread adoption of modern rice varieties in favourable irrigated environments
(Baker & Herdt, 1985; David & Outsuka, 1994; Hossain, 1996; Pingali et.al 1997).
However, the sense of complacency in the demand-supply balance began
disappearing in early 1990s, when it was observed that yield advances in rice
drastically slowed down for the irrigated rice systems in India as well as in other
Asian countries. The intensive rice growing states of Andhra Pradesh, Tamil Nadu,
Punjab & Haryana, which performed significantly in terms of yield improvements
until the 1980s, have been witnessing either a plateau or negative yield growth
during the 1990s. The economically exploitable yield of existing High Yield Varieties
(HYVs) of rice has almost reached the technical optimum in irrigated rice systems
with the universal adoption of HYVs.
2
Among various approaches and options available policymakers and research
managers considered development and use of hybrid rice technology in the late
1980s as a readily available option to shift upward and yield frontier in the irrigated
environments in India. Further, the miraculous success of hybrid rice technology in
China, which greatly contributed to the growth of rice production in that country
(Lin, 1994; Virmani et.al 1998), triggered an interest in strengthening research efforts
in some tropical countries in Asia including India in early 1990s.
Several international agencies like UNDP, FAO, ADB and International Rice
Research Institute (IRRI) have generously supported the hybrid rice research and
development at many national research institutions in tropical Asia including India
in the early 1990s. India received nearly US $ 8 million in financial support from
these external agencies between 1990 & 2000 for activities under the hybrid rice
programme initiated in 1989 at the Directorate of Rice Research, Hyderabad. An
additional to external funding with the Central Government through the ICAR and
State Governments have invested huge capital and human resources for the
development and supply of suitable hybrid rice technology for Indian farmers. The
private sector participated in hybrid rice research programme and seed production
in a big way in the early 1990s, expecting a huge seed business and a guaranteed
seed market in view of rice being a widely cultivated crop in the country and the
farmer not being able to keep hybrid seed from his/her own produce. Among about
130 private seed companies engaged in rice business across the country, 15 larger
companies participated in hybrid rice seed production and distribution in early
1990s. After four years of rigorous research (1989-93), the first hybrid rice was
released in Andhra Pradesh in 1993-94 rabi season. Subsequently, as a result of
concerted efforts over a period of two decades since the inception of the National
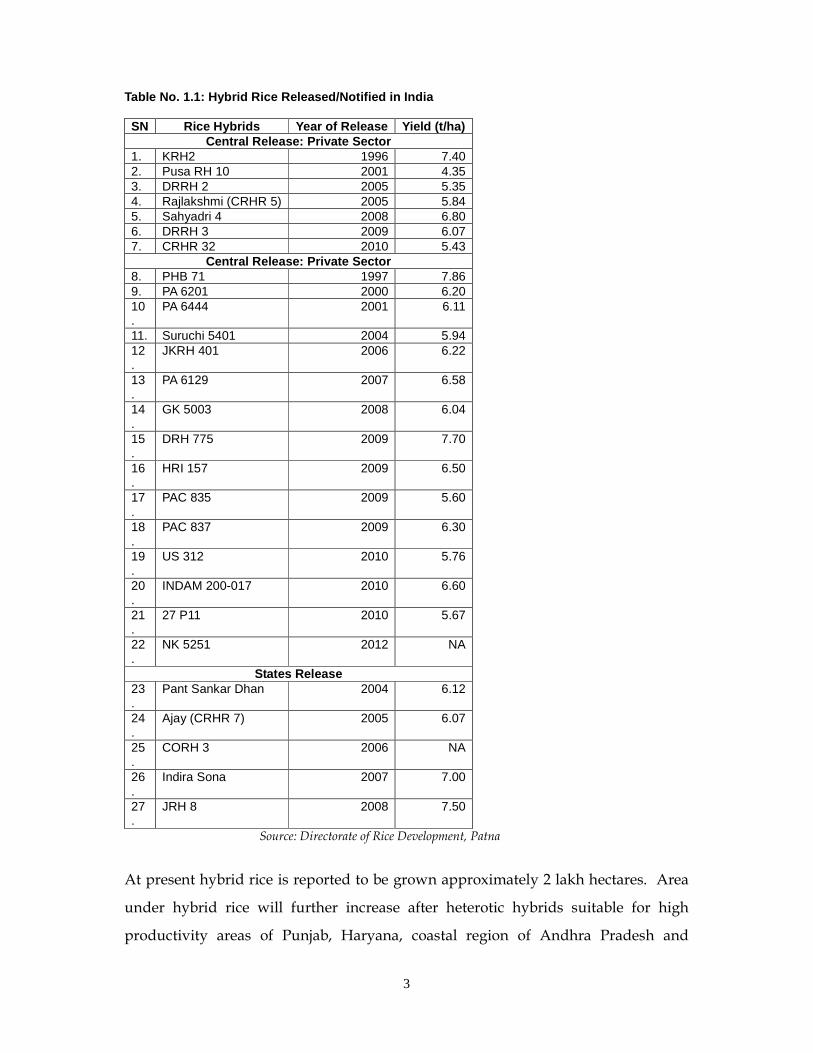
Programme on Hybrid Rice (1989), a total of 43 rice hybrids have been released for
commercial cultivation in the country of which 27 as indicated in table No. 1.1 were
developed by public sector institutions and 16 were developed by private sector
(Shoba Rani et. Al., 2010, p. 36). In contrast, in China the initial phase of development
of hybrid rice was solely a public sector affair.
3
Table No. 1.1: Hybrid Rice Released/Notified in Ind ia SN Rice Hybrids Year of Release Yield (t/ha)
Central Release: Private Sector 1. KRH2 1996 7.40 2. Pusa RH 10 2001 4.35 3. DRRH 2 2005 5.35 4. Rajlakshmi (CRHR 5) 2005 5.84 5. Sahyadri 4 2008 6.80 6. DRRH 3 2009 6.07 7. CRHR 32 2010 5.43
Central Release: Private Sector 8. PHB 71 1997 7.86 9. PA 6201 2000 6.20 10.
PA 6444 2001 6.11
11. Suruchi 5401 2004 5.94 12.
JKRH 401 2006 6.22
13.
PA 6129 2007 6.58
14.
GK 5003 2008 6.04
15.
DRH 775 2009 7.70
16.
HRI 157 2009 6.50
17.
PAC 835 2009 5.60
18.
PAC 837 2009 6.30
19.
US 312 2010 5.76
20.
INDAM 200-017 2010 6.60
21.
27 P11 2010 5.67
22.
NK 5251 2012 NA
States Release 23.
Pant Sankar Dhan 2004 6.12
24.
Ajay (CRHR 7) 2005 6.07
25.
CORH 3 2006 NA
26.
Indira Sona 2007 7.00
27.
JRH 8 2008 7.50
Source: Directorate of Rice Development, Patna
At present hybrid rice is reported to be grown approximately 2 lakh hectares. Area
under hybrid rice will further increase after heterotic hybrids suitable for high
productivity areas of Punjab, Haryana, coastal region of Andhra Pradesh and
4
shallow low land areas are identified and an effective transfer of technology is taken
up vigorously in the target states (Viraktamat, 2010). Based on the quantity of
hybrid seed sold in 2008, it is estimated that hybrid rice was cultivated on 0.15 m ha.
The National Food Security Mission (NFSM) launched in 2007 envisioned an
increase of 10 m. tons by the end of 11th Five Year Plan (2012). Of this hybrid rice is
expected to contribute 3.4 MT if grown in 3.4 m ha (@ on tone advantage). The
ultimate goal of the mission is to extend 20.00 per cent of the total rice area planted
with hybrid rice. In an effort to enhance rice productivity, the present government
has, in a policy shift, decided to encourage the cultivation of hybrid varieties by
offering subsidies even in those cases where the seeds are not certified, but are
truthfully labeled and notified. Under the NFSM, the approach is to bridge the yield
gap in respect of rice through dissemination of improved technology and farm
management practices. Added emphasis is being given for adoption of hybrid rice
under the special scheme namely; “Bringing Green Revolution to Eastern India
(BGREI).” The programme covers traditional rice growing areas such as Uttar
Pradesh, Bihar, Jharkhand, West Bengal, Madhya Pradesh, Chattisgarh & Assam and
these states account for 80.00 per cent of adoption. It is to be pointed out here that
adoption of rice hybrids developed in India did not take place in the in green
revolution areas where productivity plateau. The extent of adoption of hybrid rice
in South India is very low (5.00%) and North-West India (Punjab, Haryana &
Maharashtra account for 15.00 Per cent.
Moreover, Janaiah (2002) argues that in spite of huge capital and human resources
invested over the past decade to develop and supply hybrid rice technology for
Indian farmers, there has not been a noticeable impact on the sector. India has tried
to emulate China’s success story in the area of hybrid rice research and
development, but Indian farmers have not readily accepted hybrid rice technology.
If one looks at adoption of hybrid rice in different states the adoption, empirical
results found that the farmers have not adopted hybrid rice for various reasons. In
spite of attempts over a decade to popularize hybrid rice in states like Andhra
Pradesh, Tamil Nadu & Karnataka in south the adoption is very low (Janaiah; 2003;
5
Chengappa et.al; 2003 & Ramasamy et.al, 2003). The reasons for resistance to adopt
hybrid rice in India are (a) shortage of hybrid rice in terms of quantity and quality,
(b) poor hybrid rice grain formation, (c) yield, biotic stresses like bacterial and pest
attack, (d) lack of market for hybrid rice because of consumer’s preferences
regarding grain quality, shape, colour and cooking quality, and; (e) high cost of
hybrid seed. In fact, recently the Bihar Government paid Rs. 61 crore to farmers who
cultivated hybrid rice because the grain formation did not occur in the seed and
hence farmers incurred losses. Despite all above, a number of varieties, as staged in
table No. 1.1, have been released by the Central Government and states as well to
meet the demand of the farmers; the spread of these new varieties in place of
traditional ones has not been examined adequately. In fact, there is no
comprehensive study to record farm level experiences of hybrid rice, thus, the
Ministry of Agriculture, Government of India has decided to assign the study
entitled “Spread of New Varieties of Hybrid Rice and their I mpact on the Overall Production
and Productivity” to its Agro-Economic Research Centres in their respective states.
Accordingly, this Centre has been undertaken the study in Bihar.
1.2 Need of the Study After realizing the great potential of hybrid rice, the Government of India has
notified newer varieties with a view to break the yield constraints that usually found
in traditional varieties. A number of steps have come into effect to popularize these
newer varieties. These are mainly demonstrations, supply of minikits, trainings
deployment of extension workers etc. for the farmers. But there are no perfect
information to see the exact status of these strategies, which have caused the policy
managers in fix. Therefore, it is high time to conduct the study for assessing the
actual spreading of these newer varieties in terms of area, production and
productivity. This will help the Ministry of Agriculture, Government of India to
sketch a plan for augmenting the spread of new varieties of Hybrid rice in place of
the old ones. Besides, it will also provide feed back to the concerned state
governments to see the performance of the hybridization process in their states for
future interventions and so there is need of the study.
6
1.3 Objectives of the Study i. To indicate the extent of adoption and the level of participation by the different
categories of farmers in the cultivation of hybrid rice.
ii. To assess the overall impact on rice production and productivity of hybrid rice
cultivation.
iii. To study the economics of cultivation of hybrid rice varieties vis-à-vis inbred
varieties.
iv. To identify factors determining the adoption of hybrid rice varieties.
v. To address various constraints and outline the prospects for increasing hybrid rice
cultivation and finally
vi. To suggests policy measures for expansion of hybrid rice cultivation.
1.4 Data Base, Sampling Design, Methodology and Coverage
This study is based on both secondary and primary data. Secondary data relating to
area, production and yield of rice crop were collected from the Directorate of
Agriculture, Government of Bihar. Secondary data were also obtained from the
publications of Government of Bihar and Government of India. These are mainly
Economic Survey of Bihar, Statistical Handbook of Bihar, Agricultural Statistics--- At
a Glance: 2012 etc. To arrive at the conclusion regarding trends in APY of rice
secondary data were collected for the years from 1984-85 to 2009-10. These periods
were divided into three sub-periods viz., Period – I, (1984-85 to 1993-94), Period – II,
(1994-95 to 2003-04) & Period – III, (2004-05 to 2009-10) with a view to have glimpse
over the pre and post introduction of hybrid rice across the periods respectively.
Primary data is confined to the National Food Security Mission (NFSM) paddy
districts (18 districts) of Bihar. Out of these 18 NFSM paddy districts, two (02)
districts namely; Muzaffarpur and Gaya were selected on the basis of having higher
concentration of hybrid seeds cultivation. From Muzaffarpur districts, two
representative blocks namely; Minapur, Motipur & from Gaya district Aamas &
Dumaria blocks were chosen following same criteria. Thereafter from each of the
selected blocks, two villages namely; Shital Sema & Minapur from Minapur Block
and Morsandi and Tajpur from Motipur Block and Mahua and Bazitpur from Aamas
Block and Karhani and Bokaha from Dumaria Block were selected for in-depth
enquiry. From each of the selected villages, lists of cultivating households growing
hybrid rice varieties and inbred varieties were prepared separately and stratified
7
according to farm size groups such as marginal (< 1 ha), small (1 to 2 ha), semi-
medium (2 to 4 ha), medium (4 to10 ha) and large (10 ha & above). Due attention
was given in the sample to accommodate the social composition of the villages. As
regards the sample size is concerned, 40 hybrid rice growers from the list of hybrid
rice growers and 10 inbred rice growers from the list of inbred rice growers were
randomly chosen, making a total of 50 paddy growers from each of the sample
district were selected. This way the total size of the sample is 100 paddy growers,
equally spread over in two selected districts from the state (Bihar).
The reference period of primary data was 2009-10 and 2010-11. Primary data was
obtained by administering a duly structured schedule.
The details of sample distribution by size classes, districts, blocks and villages may
be seen in table 1.2 below:
Table No. 1.2: Distribution of Sample Households. SN
Districts Marginal
Small Semi-Medium
Medium Large
Total
1. Muzaffarpur 23 15 8 4 --- 50 2. Gaya 22 16 8 4 --- 50 Total 45 31 16 8 --- 100
1.5 Organization of the Report The present report is divided into eight chapters. Chapter one deals with the
introduction which spells out background, need of the study, objectives and research
methodology. Status of rice in Bihar has been presented in chapter two. Chapter
three is focused on status of adoption of hybrid rice at the farm level. Impact of
hybrid rice cultivation on overall production of rice has been examined in chapter
four. Chapter five analyses the comparative economics of hybrid rice and inbred
rice cultivation. Grain quality considerations and the aspect of marketing have been
analyzed in chapter six. Chapter seven pertains to problems and prospects of hybrid
rice cultivation and finally chapter eight provides summary and policy suggestions
emerged from the study.
8
CHAPTER – II
STATUS OF RICE IN BIHAR
This chapter is pertained to status of rice in the state during 1984-85 to 2009-10 in
respect of area, production and yield. Compound Growth Rate (CGR) and Co-
efficient of Variation (CV) of rice production and yield of HYV rice and total rice for
three specified periods i.e., 1983-84 to 1993-94, 1994-95 to 2003-2004 and 2004-05 to
2009-10 for all the three seasons have been analyzed since there is no availability of
secondary data relating to hybrid rice area, production and yield in the state, so it
could not be analyzed in this chapter. The following sections deals with above facts
and figures:
2.1 Status of Rice in Bihar Bihar is endowed with fertile Gangetic alluvial soil with abundant water resources,
particularly groundwater. With varied soil categories associated with different agro-
climatic zones, the farmers grow a variety of crops. Apart from food grains, the state
produce oilseeds, fibre crops, sugarcane, fruits, vegetables and other minor food
crops. The first agricultural roadmap (2007-12) has ensured productivity steadily
rise in the fields. This is corroborated by the fact that the state has reached the
productivity of 2240 kg/ha for paddy in recent years. Because of the use of new
‘SRI’ technique and use of newer agricultural implements, there was enormous rise
9
in rice production. The level of rice production prior to 2010-11 was not consistent
and there was much variation in the production level over the years. The average
production figure was around 50 lakh tones during the period from 2007-08 to 2010-
11. The efforts taken under NFSM (Rice) and BGREI and adoption of SRI technology
resulted to significant increase in yield/productivity of rice crop in the state. One
can observe the comparative productivity levels by the percentage change between
the two trienniums viz., 2002-03 and 2009-12. It is 8.00 per cent in case of rice
productivity. In fact the state government is putting in a strong agricultural
monitoring system so that nothing is left to chance. Support services in irrigation,
seeds, fertilizer, farm mechanization, agricultural credit and awareness programmes
are being stressed to make agricultural more viable. The state government has
formed an ‘Agriculture Cabinet,’ first of its kind in India, consisted of 18 related
departments of agricultural operations so that a comprehensive focus on agricultural
development could be made. Being enthused by the overwhelming response at all
the levels, the prospects of rice production in the state is such that the state has
targeted to achieve the production of 98 lakh metric tones of rice during the year
2013-14. However, the state has achieved the production level of 80 lakh MT in the
year 2012-13.
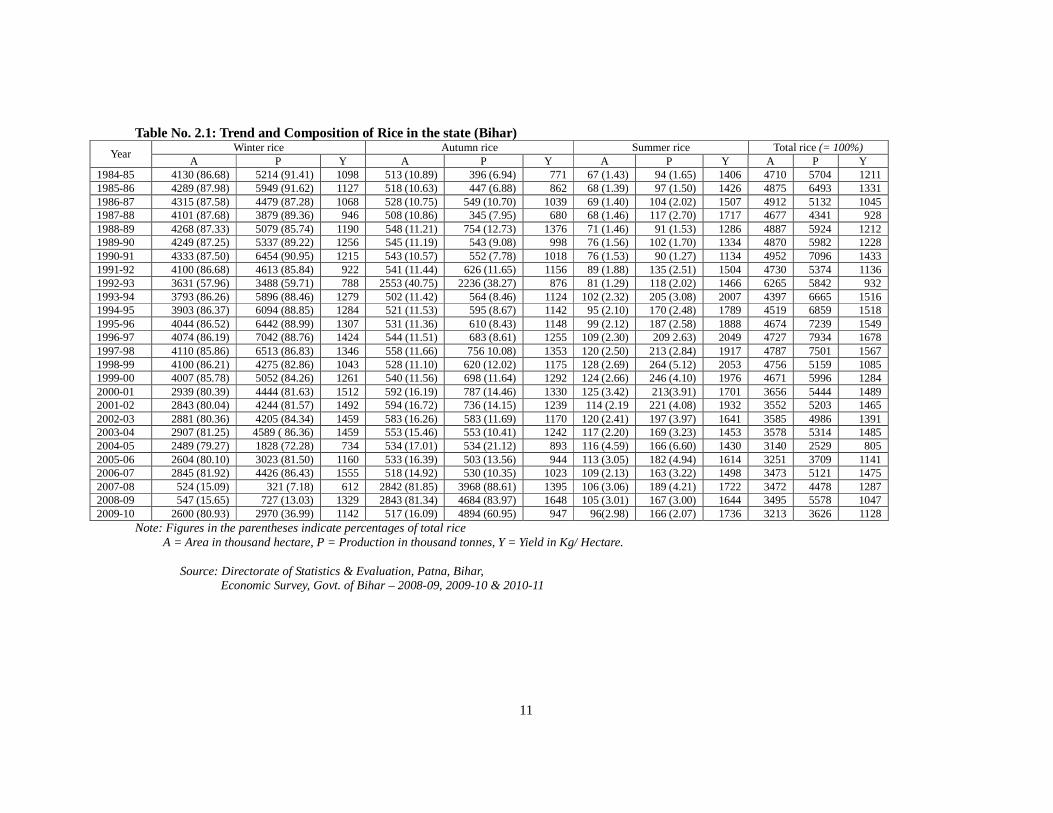
2.2 Trend and Composition of Rice in the State Rice is one of the important crops in Bihar. There are three seasons of rice as such
Autumn (Bhadai), Winter (Aghani) and Boro (Summer). The trend and composition
of rice in the state according to seasons and year wise is imposed in table No. 2.1.
Analysis of this table reveals that winter (Aghani) rice is the most important season
out of the three rice growing seasons in Bihar in terms of area sown and production.
In 2009-10 winter rice accounted for 36.99 per cent of total output and 80.93 per cent
of total area cultivated under rice. The importance of winter rice output in total
production has fallen from 91.41 per cent in 1984-85 to 36.99 per cent in 2009-10
while that of Boro rice has risen from 1.65 per cent in 1984-85 to 2.07 per cent in 2009-
10 except a few years. Increase in the share of output in case of autumn rice (Bhadai)
is due to increased in area from 6.94 per cent in 1984-85 to 88.61 per cent in 2007-08.
However, it declined to 60.95 per cent in 2009-10. For summer rice, increased share
in production is attributable to increase in both area and production. The relative
importance of winter rice has also sharply fallen in terms of acreage planted and
production. It is noted that average rice yield in Bihar increased to 1475 kg per
10
hectare in 2006-07 except 2008-09 & 2009-10. These were 928 kg per hectare in 1987-
88 and 1211 kg per ha in 1984-85, the period when rice crop of the state was yet to
switch over to the hybrid technology. In case of summer rice, yield rate increased
from 1406 kg per ha in 1984-85 to 2053 kg per ha in 1998-99, which again increased to
1736 kg per ha in 2009-10. For winter rice, yield level increased from 1098 kg per ha
in 1984-85 to 1142 kg per ha in 2009-10 through 1555 kg per ha in 2006-07 whereas
autumn rice recorded yield levels of 947 kg per ha in 2009-10 which was 1648 kg per
ha in 2008-09 against 771 kg per ha in 1984-85. Above analysis showed that there has
been overall increase in rice production during the period under study 1984-85 to
2009-10.
11
Table No. 2.1: Trend and Composition of Rice in the state (Bihar) Winter rice Autumn rice Summer rice Total rice (= 100%)
Year A P Y A P Y A P Y A P Y
1984-85 4130 (86.68) 5214 (91.41) 1098 513 (10.89) 396 (6.94) 771 67 (1.43) 94 (1.65) 1406 4710 5704 1211 1985-86 4289 (87.98) 5949 (91.62) 1127 518 (10.63) 447 (6.88) 862 68 (1.39) 97 (1.50) 1426 4875 6493 1331 1986-87 4315 (87.58) 4479 (87.28) 1068 528 (10.75) 549 (10.70) 1039 69 (1.40) 104 (2.02) 1507 4912 5132 1045 1987-88 4101 (87.68) 3879 (89.36) 946 508 (10.86) 345 (7.95) 680 68 (1.46) 117 (2.70) 1717 4677 4341 928 1988-89 4268 (87.33) 5079 (85.74) 1190 548 (11.21) 754 (12.73) 1376 71 (1.46) 91 (1.53) 1286 4887 5924 1212 1989-90 4249 (87.25) 5337 (89.22) 1256 545 (11.19) 543 (9.08) 998 76 (1.56) 102 (1.70) 1334 4870 5982 1228 1990-91 4333 (87.50) 6454 (90.95) 1215 543 (10.57) 552 (7.78) 1018 76 (1.53) 90 (1.27) 1134 4952 7096 1433 1991-92 4100 (86.68) 4613 (85.84) 922 541 (11.44) 626 (11.65) 1156 89 (1.88) 135 (2.51) 1504 4730 5374 1136 1992-93 3631 (57.96) 3488 (59.71) 788 2553 (40.75) 2236 (38.27) 876 81 (1.29) 118 (2.02) 1466 6265 5842 932 1993-94 3793 (86.26) 5896 (88.46) 1279 502 (11.42) 564 (8.46) 1124 102 (2.32) 205 (3.08) 2007 4397 6665 1516 1994-95 3903 (86.37) 6094 (88.85) 1284 521 (11.53) 595 (8.67) 1142 95 (2.10) 170 (2.48) 1789 4519 6859 1518 1995-96 4044 (86.52) 6442 (88.99) 1307 531 (11.36) 610 (8.43) 1148 99 (2.12) 187 (2.58) 1888 4674 7239 1549 1996-97 4074 (86.19) 7042 (88.76) 1424 544 (11.51) 683 (8.61) 1255 109 (2.30) 209 2.63) 2049 4727 7934 1678 1997-98 4110 (85.86) 6513 (86.83) 1346 558 (11.66) 756 10.08) 1353 120 (2.50) 213 (2.84) 1917 4787 7501 1567 1998-99 4100 (86.21) 4275 (82.86) 1043 528 (11.10) 620 (12.02) 1175 128 (2.69) 264 (5.12) 2053 4756 5159 1085 1999-00 4007 (85.78) 5052 (84.26) 1261 540 (11.56) 698 (11.64) 1292 124 (2.66) 246 (4.10) 1976 4671 5996 1284 2000-01 2939 (80.39) 4444 (81.63) 1512 592 (16.19) 787 (14.46) 1330 125 (3.42) 213(3.91) 1701 3656 5444 1489 2001-02 2843 (80.04) 4244 (81.57) 1492 594 (16.72) 736 (14.15) 1239 114 (2.19 221 (4.08) 1932 3552 5203 1465 2002-03 2881 (80.36) 4205 (84.34) 1459 583 (16.26) 583 (11.69) 1170 120 (2.41) 197 (3.97) 1641 3585 4986 1391 2003-04 2907 (81.25) 4589 ( 86.36) 1459 553 (15.46) 553 (10.41) 1242 117 (2.20) 169 (3.23) 1453 3578 5314 1485 2004-05 2489 (79.27) 1828 (72.28) 734 534 (17.01) 534 (21.12) 893 116 (4.59) 166 (6.60) 1430 3140 2529 805 2005-06 2604 (80.10) 3023 (81.50) 1160 533 (16.39) 503 (13.56) 944 113 (3.05) 182 (4.94) 1614 3251 3709 1141 2006-07 2845 (81.92) 4426 (86.43) 1555 518 (14.92) 530 (10.35) 1023 109 (2.13) 163 (3.22) 1498 3473 5121 1475 2007-08 524 (15.09) 321 (7.18) 612 2842 (81.85) 3968 (88.61) 1395 106 (3.06) 189 (4.21) 1722 3472 4478 1287 2008-09 547 (15.65) 727 (13.03) 1329 2843 (81.34) 4684 (83.97) 1648 105 (3.01) 167 (3.00) 1644 3495 5578 1047 2009-10 2600 (80.93) 2970 (36.99) 1142 517 (16.09) 4894 (60.95) 947 96(2.98) 166 (2.07) 1736 3213 3626 1128
Note: Figures in the parentheses indicate percentages of total rice A = Area in thousand hectare, P = Production in thousand tonnes, Y = Yield in Kg/ Hectare. Source: Directorate of Statistics & Evaluation, Patna, Bihar,
Economic Survey, Govt. of Bihar – 2008-09, 2009-10 & 2010-11
12
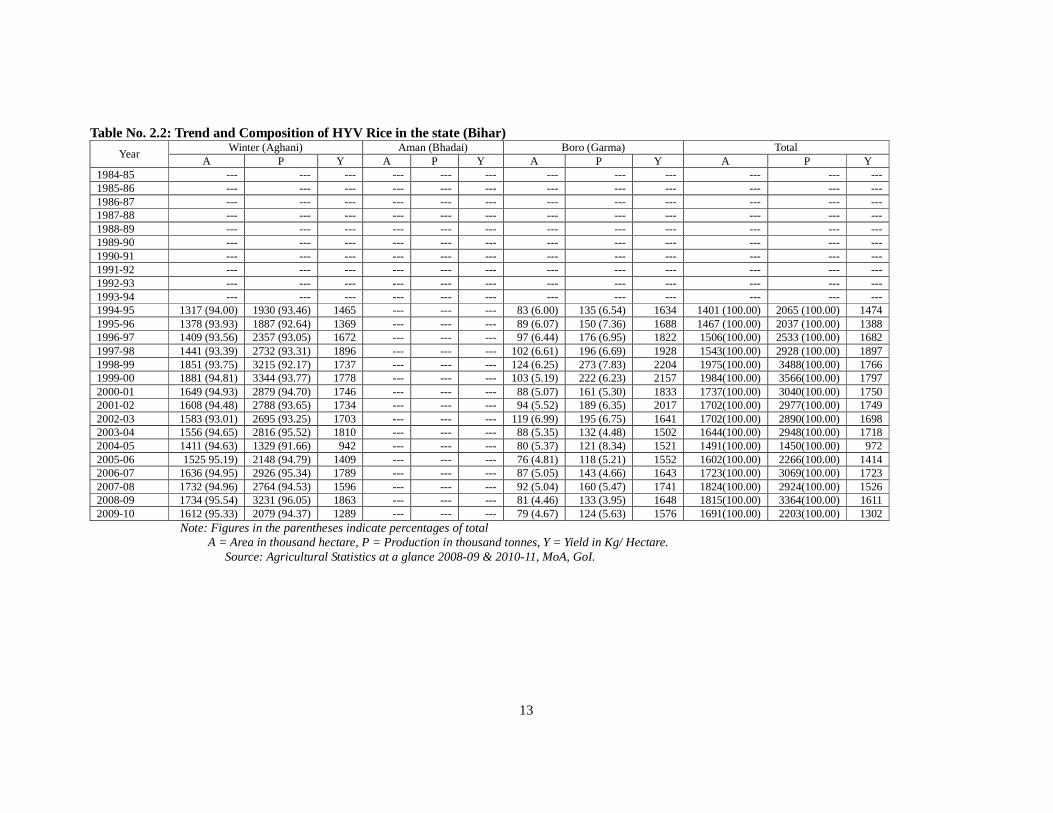
2.2.1 Trend and Composition of HYV Rice in the State The season and year wise trend and composition of HYV rice in the state is
presented in table 2.2. Analysis of this table showed that the total area under HYV
rice has increased from 1401 thousand ha in 1994-95 to a peak of 1984 thousand ha in
1999-2K but it has fallen in subsequent years and reached to the level of 1691
thousand ha in 2009-10. But it has increased from 1401 thousand ha in 1994-95 to
1691 thousand ha in 2009-10, registering an increase of 20.70 per cent in area. In case
of production almost similar pattern was observed. It increased from 2065 thousand
MT in 1994-95 to 2203 thousand MT in 2009-10, accounting for an increase in
production by 6.69 per cent during the period. The yield level has also increased
from 1474 kg per ha in 1994-95 to 1611 kg per ha in 2008-09 but it has fallen in 2009-
10 and touched to second lowest i.e, 1302 kg per ha during 1994-95 to 2009-10. Of
the total HYV rice area in the state, the share of autumn and boro rice was nearly
94.00 per cent and 6.00 per cent respectively in 1994-95, which have marginally
increased in autumn rice (95.33%) in 2009-10 and fallen in case of boro rice (4.67%) in
2009-10. It further reveals that the absolute area under HYV rice has increased in
case of autumn HYV rice only. It may be due to less or poor irrigational facilities in
growing HYV rice in summer season. Almost similar trend has been found in case
of production of HYV rice in the state. It increased from 1930 thousand MT in 1994-
95 to 2079 thousand MT in 2009-10 for autumn rice and in case of boro rice it has
fallen from 135 thousand MT in 1994-95 to 124 thousand MT in 20098-10, registering
an increase by 7.72 per cent in case of autumn HYV rice and a fall of 8.14 per cent in
case of boro HYV rice. The yield rate has fallen in both the seasons by 12.01 per cent
in case of autumn HYV rice and 3.55 per cent in case of boro HYV rice in 2009-10
over 1994-95. Thus, it can be concluded that the cultivation of HYV rice in the state
is significantly picking up in autumn season only but its yield level is yet to be
picked up in a significant manner.
13
Table No. 2.2: Trend and Composition of HYV Rice in the state (Bihar) Winter (Aghani) Aman (Bhadai) Boro (Garma) Total
Year A P Y A P Y A P Y A P Y
1984-85 --- --- --- --- --- --- --- --- --- --- --- --- 1985-86 --- --- --- --- --- --- --- --- --- --- --- --- 1986-87 --- --- --- --- --- --- --- --- --- --- --- --- 1987-88 --- --- --- --- --- --- --- --- --- --- --- --- 1988-89 --- --- --- --- --- --- --- --- --- --- --- --- 1989-90 --- --- --- --- --- --- --- --- --- --- --- --- 1990-91 --- --- --- --- --- --- --- --- --- --- --- --- 1991-92 --- --- --- --- --- --- --- --- --- --- --- --- 1992-93 --- --- --- --- --- --- --- --- --- --- --- --- 1993-94 --- --- --- --- --- --- --- --- --- --- --- --- 1994-95 1317 (94.00) 1930 (93.46) 1465 --- --- --- 83 (6.00) 135 (6.54) 1634 1401 (100.00) 2065 (100.00) 1474 1995-96 1378 (93.93) 1887 (92.64) 1369 --- --- --- 89 (6.07) 150 (7.36) 1688 1467 (100.00) 2037 (100.00) 1388 1996-97 1409 (93.56) 2357 (93.05) 1672 --- --- --- 97 (6.44) 176 (6.95) 1822 1506(100.00) 2533 (100.00) 1682 1997-98 1441 (93.39) 2732 (93.31) 1896 --- --- --- 102 (6.61) 196 (6.69) 1928 1543(100.00) 2928 (100.00) 1897 1998-99 1851 (93.75) 3215 (92.17) 1737 --- --- --- 124 (6.25) 273 (7.83) 2204 1975(100.00) 3488(100.00) 1766 1999-00 1881 (94.81) 3344 (93.77) 1778 --- --- --- 103 (5.19) 222 (6.23) 2157 1984(100.00) 3566(100.00) 1797 2000-01 1649 (94.93) 2879 (94.70) 1746 --- --- --- 88 (5.07) 161 (5.30) 1833 1737(100.00) 3040(100.00) 1750 2001-02 1608 (94.48) 2788 (93.65) 1734 --- --- --- 94 (5.52) 189 (6.35) 2017 1702(100.00) 2977(100.00) 1749 2002-03 1583 (93.01) 2695 (93.25) 1703 --- --- --- 119 (6.99) 195 (6.75) 1641 1702(100.00) 2890(100.00) 1698 2003-04 1556 (94.65) 2816 (95.52) 1810 --- --- --- 88 (5.35) 132 (4.48) 1502 1644(100.00) 2948(100.00) 1718 2004-05 1411 (94.63) 1329 (91.66) 942 --- --- --- 80 (5.37) 121 (8.34) 1521 1491(100.00) 1450(100.00) 972 2005-06 1525 95.19) 2148 (94.79) 1409 --- --- --- 76 (4.81) 118 (5.21) 1552 1602(100.00) 2266(100.00) 1414 2006-07 1636 (94.95) 2926 (95.34) 1789 --- --- --- 87 (5.05) 143 (4.66) 1643 1723(100.00) 3069(100.00) 1723 2007-08 1732 (94.96) 2764 (94.53) 1596 --- --- --- 92 (5.04) 160 (5.47) 1741 1824(100.00) 2924(100.00) 1526 2008-09 1734 (95.54) 3231 (96.05) 1863 --- --- --- 81 (4.46) 133 (3.95) 1648 1815(100.00) 3364(100.00) 1611 2009-10 1612 (95.33) 2079 (94.37) 1289 --- --- --- 79 (4.67) 124 (5.63) 1576 1691(100.00) 2203(100.00) 1302
Note: Figures in the parentheses indicate percentages of total A = Area in thousand hectare, P = Production in thousand tonnes, Y = Yield in Kg/ Hectare. Source: Agricultural Statistics at a glance 2008-09 & 2010-11, MoA, GoI.
14
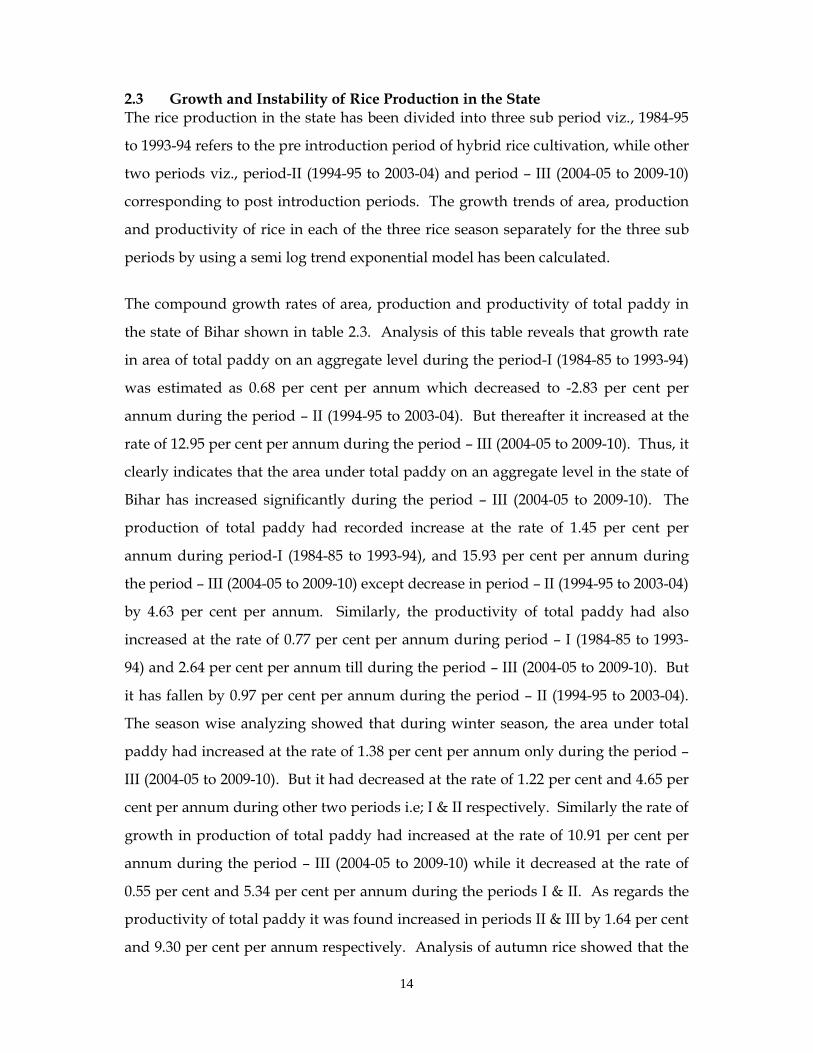
2.3 Growth and Instability of Rice Production in the State The rice production in the state has been divided into three sub period viz., 1984-95
to 1993-94 refers to the pre introduction period of hybrid rice cultivation, while other
two periods viz., period-II (1994-95 to 2003-04) and period – III (2004-05 to 2009-10)
corresponding to post introduction periods. The growth trends of area, production
and productivity of rice in each of the three rice season separately for the three sub
periods by using a semi log trend exponential model has been calculated.
The compound growth rates of area, production and productivity of total paddy in
the state of Bihar shown in table 2.3. Analysis of this table reveals that growth rate
in area of total paddy on an aggregate level during the period-I (1984-85 to 1993-94)
was estimated as 0.68 per cent per annum which decreased to -2.83 per cent per
annum during the period – II (1994-95 to 2003-04). But thereafter it increased at the
rate of 12.95 per cent per annum during the period – III (2004-05 to 2009-10). Thus, it
clearly indicates that the area under total paddy on an aggregate level in the state of
Bihar has increased significantly during the period – III (2004-05 to 2009-10). The
production of total paddy had recorded increase at the rate of 1.45 per cent per
annum during period-I (1984-85 to 1993-94), and 15.93 per cent per annum during
the period – III (2004-05 to 2009-10) except decrease in period – II (1994-95 to 2003-04)
by 4.63 per cent per annum. Similarly, the productivity of total paddy had also
increased at the rate of 0.77 per cent per annum during period – I (1984-85 to 1993-
94) and 2.64 per cent per annum till during the period – III (2004-05 to 2009-10). But
it has fallen by 0.97 per cent per annum during the period – II (1994-95 to 2003-04).
The season wise analyzing showed that during winter season, the area under total
paddy had increased at the rate of 1.38 per cent per annum only during the period –
III (2004-05 to 2009-10). But it had decreased at the rate of 1.22 per cent and 4.65 per
cent per annum during other two periods i.e; I & II respectively. Similarly the rate of
growth in production of total paddy had increased at the rate of 10.91 per cent per
annum during the period – III (2004-05 to 2009-10) while it decreased at the rate of
0.55 per cent and 5.34 per cent per annum during the periods I & II. As regards the
productivity of total paddy it was found increased in periods II & III by 1.64 per cent
and 9.30 per cent per annum respectively. Analysis of autumn rice showed that the
15
area under total paddy increased from 7.08 per cent per annum during 1984-85 to
1993-94 to 140.44 per cent per annum till the period of 2004-05 to 2009-10. The
production of autumn had increased from the rate of 10.31 per cent per annum
during the period – I (1984-85 to 1993-94) and 75.89 per cent per annum during the
period – III (2004-05 to 2009-10) but it fell by 0.22 per cent per annum during the
period – II (1994-95 to 2003-04). The yield had increased from 3.03 per cent per
annum in 1984-85 to 1993-94 to 3.57 per cent per annum in 2004-05 to 2009-10
whereas analysis of summer rice revealed that area under total rice decreased from
4.13 per cent per annum in 1984-85 to 1993-94 to 2.17 per cent per annum during
1994-95 to 2003-04. But it decreased by 3.50 per cent per annum during the period –
III (2004-05 to 2009-10).
Similarly the CGR of production of summer season showed an increase at the rate of
5.62 per cent per annum in 1984-85 to 1993-94 but its growth retarded at 0.31 per cent
per annum during the period – II (1994-95 to 2003-04). Further it fell by 0.31 per cent
per annum during the period – III (2004-05 to 2009-10). The yield of summer season
increased at the rate of 1.33 per cent per annum during the period of 1984-85 to 1993-
94 and 3.38 per cent per annum during the period of 2004-05 to 2009-10. But it fell by
2.13 per cent per annum during the period of 1994-95 to 2003-04.
Table No. 2.3: Compound Growth Rates of Area, Production and Productivity of Rice in the
state (Bihar) (Per cent per
annum) Winter rice Autumn rice Summer rice Total rice
Period A P Y A P Y A P Y A P Y
1984-85 – 1993-94
-1.22 -0.55 -0.64 7.08 10.31 3.03 4.13 5.62 1.33 0.68 1.45 0.77
1994-95 --2003-04
-4.65 -5.34 1.64 1.12 -0.22 0.53 2.17 0.32 -2.13 -2.83 -4.63 -0.97
2004-05 —2009 - 10
1.38 10.91 9.30 140.44 75.89 3.57 -3.50 -0.31 3.38 12.95 15.93 2.64
2.3.1 Growth of High Yielding Varieties in the State The compound growth rates of area, production and productivity of HYV paddy in
the state of Bihar is presented in table 2.4. An analysis of this table showed that the
growth rate in area of total HYV paddy was estimated as 2.11 per cent per annum
during the period of 1994-95 to 2003-04 which increased to 3.08 per cent per annum
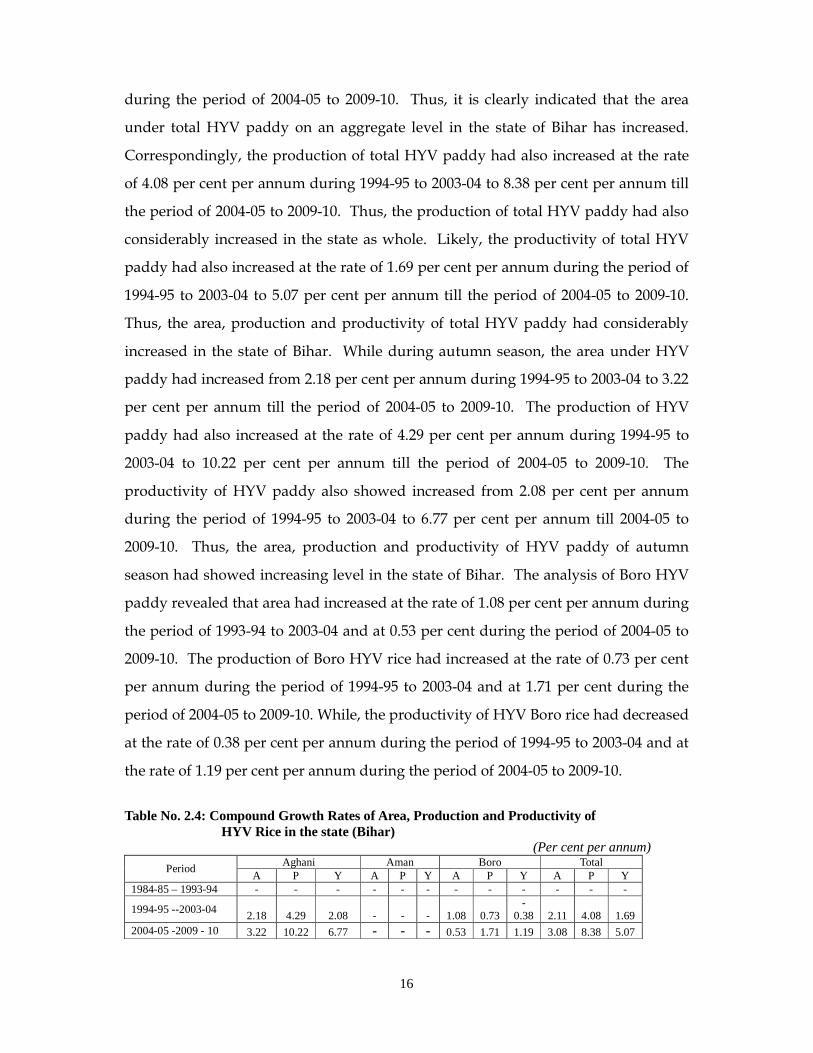
16
during the period of 2004-05 to 2009-10. Thus, it is clearly indicated that the area
under total HYV paddy on an aggregate level in the state of Bihar has increased.
Correspondingly, the production of total HYV paddy had also increased at the rate
of 4.08 per cent per annum during 1994-95 to 2003-04 to 8.38 per cent per annum till
the period of 2004-05 to 2009-10. Thus, the production of total HYV paddy had also
considerably increased in the state as whole. Likely, the productivity of total HYV
paddy had also increased at the rate of 1.69 per cent per annum during the period of
1994-95 to 2003-04 to 5.07 per cent per annum till the period of 2004-05 to 2009-10.
Thus, the area, production and productivity of total HYV paddy had considerably
increased in the state of Bihar. While during autumn season, the area under HYV
paddy had increased from 2.18 per cent per annum during 1994-95 to 2003-04 to 3.22
per cent per annum till the period of 2004-05 to 2009-10. The production of HYV
paddy had also increased at the rate of 4.29 per cent per annum during 1994-95 to
2003-04 to 10.22 per cent per annum till the period of 2004-05 to 2009-10. The
productivity of HYV paddy also showed increased from 2.08 per cent per annum
during the period of 1994-95 to 2003-04 to 6.77 per cent per annum till 2004-05 to
2009-10. Thus, the area, production and productivity of HYV paddy of autumn
season had showed increasing level in the state of Bihar. The analysis of Boro HYV
paddy revealed that area had increased at the rate of 1.08 per cent per annum during
the period of 1993-94 to 2003-04 and at 0.53 per cent during the period of 2004-05 to
2009-10. The production of Boro HYV rice had increased at the rate of 0.73 per cent
per annum during the period of 1994-95 to 2003-04 and at 1.71 per cent during the
period of 2004-05 to 2009-10. While, the productivity of HYV Boro rice had decreased
at the rate of 0.38 per cent per annum during the period of 1994-95 to 2003-04 and at
the rate of 1.19 per cent per annum during the period of 2004-05 to 2009-10.
Table No. 2.4: Compound Growth Rates of Area, Production and Productivity of
HYV Rice in the state (Bihar) (Per cent per annum)
Aghani Aman Boro Total Period
A P Y A P Y A P Y A P Y 1984-85 – 1993-94 - - - - - - - - - - - -
1994-95 --2003-04 2.18 4.29 2.08 - - - 1.08 0.73
-0.38 2.11 4.08 1.69
2004-05 -2009 - 10 3.22 10.22 6.77 - - - 0.53 1.71 1.19 3.08 8.38 5.07
17
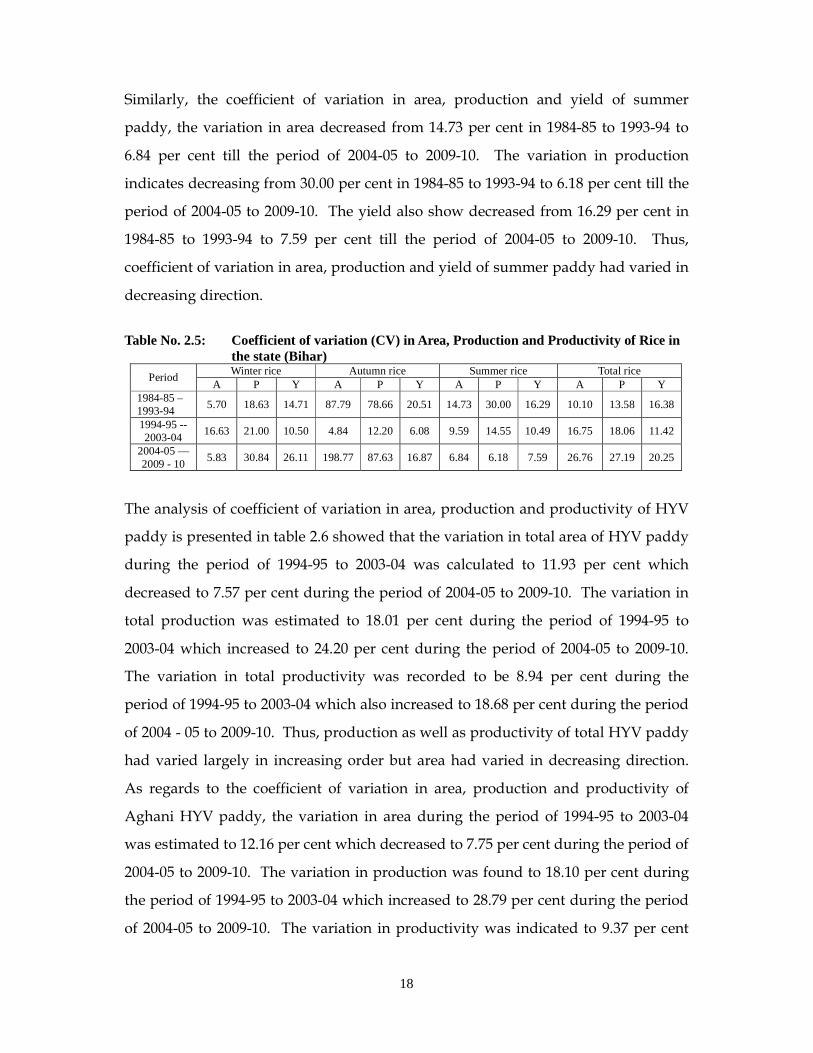
2.3.2 Instability of Rice Production The coefficient of variation (CV) in area, production and productivity of total paddy
in the state of Bihar is presented in table 2.5. an analysis of this table indicates that
coefficient of variation on an aggregate in the area of total paddy was estimated to
10.10 per cent during the period of 1984-85 to 1993-94 which varied to 26.76 per cent
till the period of 2004-05 to 2009-10. While, the coefficient of variation in production
of total paddy had varied in increasing direction from 13.58 per cent in the period of
1984-85 to 1993-94 to 27.19 per cent till the period of 2004-05 to 2009-10. But the
coefficient of variation in yield of total paddy was recorded to 16.38 per cent during
1984-85 to 1993-94, which increased to 20.25 per cent till the period of 2004-05 to
2009-10. Thus, area, production and yield of total paddy had varied significantly in
increasing order.
As regards to the coefficient of variation in area, production and productivity of
winter paddy, the variation in area had been recorded a little increased from 5.70 per
cent in the period of 1984-85 to 1993-94 to 5.83 per cent till the period of 2004-05 to
2009-10. The variation in production shows increased from 18.63 per cent in 1984-85
to 1993-94 to 30.84 per cent till the period of 2004-05 to 2009-10 whereas, the
variation in yield indicate an increased from 14.71 per cent in 1984-85 to 1993-94 to
26.11 per cent till the period of 2004-05 to 2009-10. Thus, coefficient of variation in
area, production and yield of total winter paddy had varied in either constant or
increasing rate.
As responses to the coefficient of variation in area, production and yield of autumn
paddy, the variation in area increased from 87.79 per cent in 1984-85 to 1993-94 to
198.77 per cent in 2004-05 to 2009-10. The variation in production showed also
increased from 78.66 per cent in 1984-85 to 1993-94 to 87.63 per cent during the
period of 2004-05 to 2009-10. While, the variation in yield decreased from 20.51 per
cent in 1984-85 to 1993-94 to 16.87 per cent till the period of 2004-05 to 2009-10. Thus,
coefficient of variation in area and production of autumn rice had varied with
increasing rate.
18
Similarly, the coefficient of variation in area, production and yield of summer
paddy, the variation in area decreased from 14.73 per cent in 1984-85 to 1993-94 to
6.84 per cent till the period of 2004-05 to 2009-10. The variation in production
indicates decreasing from 30.00 per cent in 1984-85 to 1993-94 to 6.18 per cent till the
period of 2004-05 to 2009-10. The yield also show decreased from 16.29 per cent in
1984-85 to 1993-94 to 7.59 per cent till the period of 2004-05 to 2009-10. Thus,
coefficient of variation in area, production and yield of summer paddy had varied in
decreasing direction.
Table No. 2.5: Coefficient of variation (CV) in Area, Production and Productivity of Rice in
the state (Bihar) Winter rice Autumn rice Summer rice Total rice
Period A P Y A P Y A P Y A P Y
1984-85 – 1993-94
5.70 18.63 14.71 87.79 78.66 20.51 14.73 30.00 16.29 10.10 13.58 16.38
1994-95 --2003-04
16.63 21.00 10.50 4.84 12.20 6.08 9.59 14.55 10.49 16.75 18.06 11.42
2004-05 —2009 - 10
5.83 30.84 26.11 198.77 87.63 16.87 6.84 6.18 7.59 26.76 27.19 20.25
The analysis of coefficient of variation in area, production and productivity of HYV
paddy is presented in table 2.6 showed that the variation in total area of HYV paddy
during the period of 1994-95 to 2003-04 was calculated to 11.93 per cent which
decreased to 7.57 per cent during the period of 2004-05 to 2009-10. The variation in
total production was estimated to 18.01 per cent during the period of 1994-95 to
2003-04 which increased to 24.20 per cent during the period of 2004-05 to 2009-10.
The variation in total productivity was recorded to be 8.94 per cent during the
period of 1994-95 to 2003-04 which also increased to 18.68 per cent during the period
of 2004 - 05 to 2009-10. Thus, production as well as productivity of total HYV paddy
had varied largely in increasing order but area had varied in decreasing direction.
As regards to the coefficient of variation in area, production and productivity of
Aghani HYV paddy, the variation in area during the period of 1994-95 to 2003-04
was estimated to 12.16 per cent which decreased to 7.75 per cent during the period of
2004-05 to 2009-10. The variation in production was found to 18.10 per cent during
the period of 1994-95 to 2003-04 which increased to 28.79 per cent during the period
of 2004-05 to 2009-10. The variation in productivity was indicated to 9.37 per cent
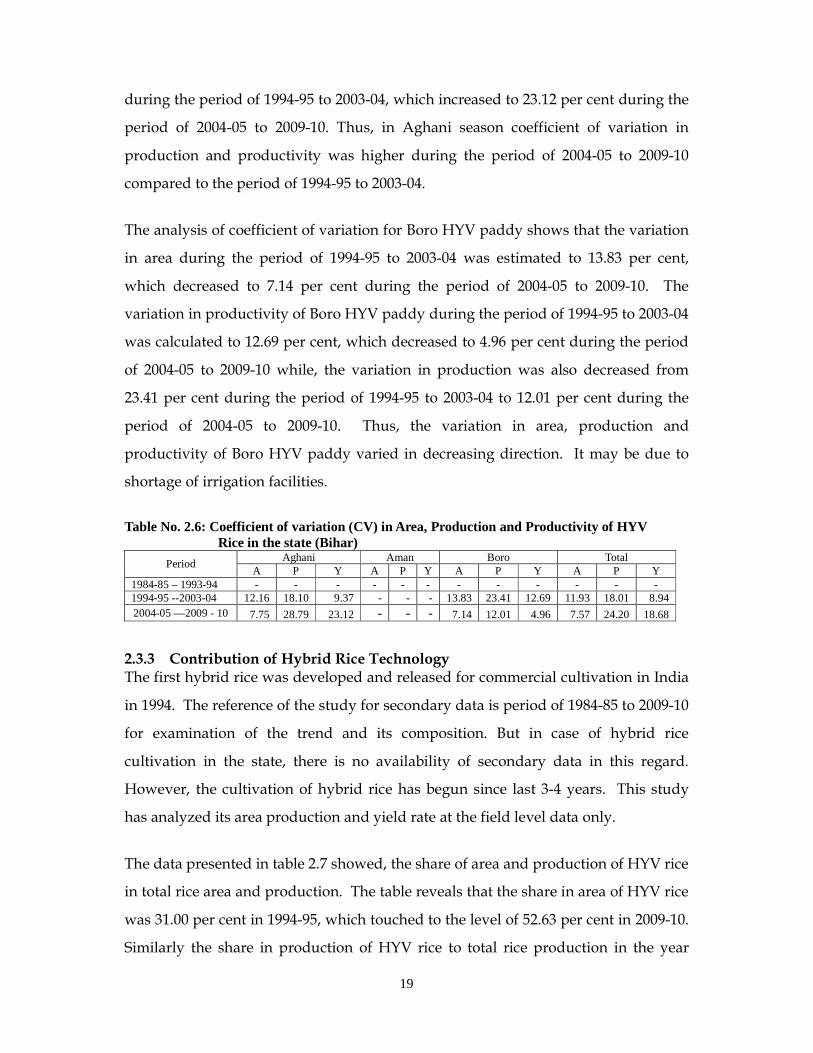
19
during the period of 1994-95 to 2003-04, which increased to 23.12 per cent during the
period of 2004-05 to 2009-10. Thus, in Aghani season coefficient of variation in
production and productivity was higher during the period of 2004-05 to 2009-10
compared to the period of 1994-95 to 2003-04.
The analysis of coefficient of variation for Boro HYV paddy shows that the variation
in area during the period of 1994-95 to 2003-04 was estimated to 13.83 per cent,
which decreased to 7.14 per cent during the period of 2004-05 to 2009-10. The
variation in productivity of Boro HYV paddy during the period of 1994-95 to 2003-04
was calculated to 12.69 per cent, which decreased to 4.96 per cent during the period
of 2004-05 to 2009-10 while, the variation in production was also decreased from
23.41 per cent during the period of 1994-95 to 2003-04 to 12.01 per cent during the
period of 2004-05 to 2009-10. Thus, the variation in area, production and
productivity of Boro HYV paddy varied in decreasing direction. It may be due to
shortage of irrigation facilities.
Table No. 2.6: Coefficient of variation (CV) in Area, Production and Productivity of HYV
Rice in the state (Bihar) Aghani Aman Boro Total
Period A P Y A P Y A P Y A P Y
1984-85 – 1993-94 - - - - - - - - - - - - 1994-95 --2003-04 12.16 18.10 9.37 - - - 13.83 23.41 12.69 11.93 18.01 8.94 2004-05 —2009 - 10 7.75 28.79 23.12 - - - 7.14 12.01 4.96 7.57 24.20 18.68
2.3.3 Contribution of Hybrid Rice Technology The first hybrid rice was developed and released for commercial cultivation in India
in 1994. The reference of the study for secondary data is period of 1984-85 to 2009-10
for examination of the trend and its composition. But in case of hybrid rice
cultivation in the state, there is no availability of secondary data in this regard.
However, the cultivation of hybrid rice has begun since last 3-4 years. This study
has analyzed its area production and yield rate at the field level data only.
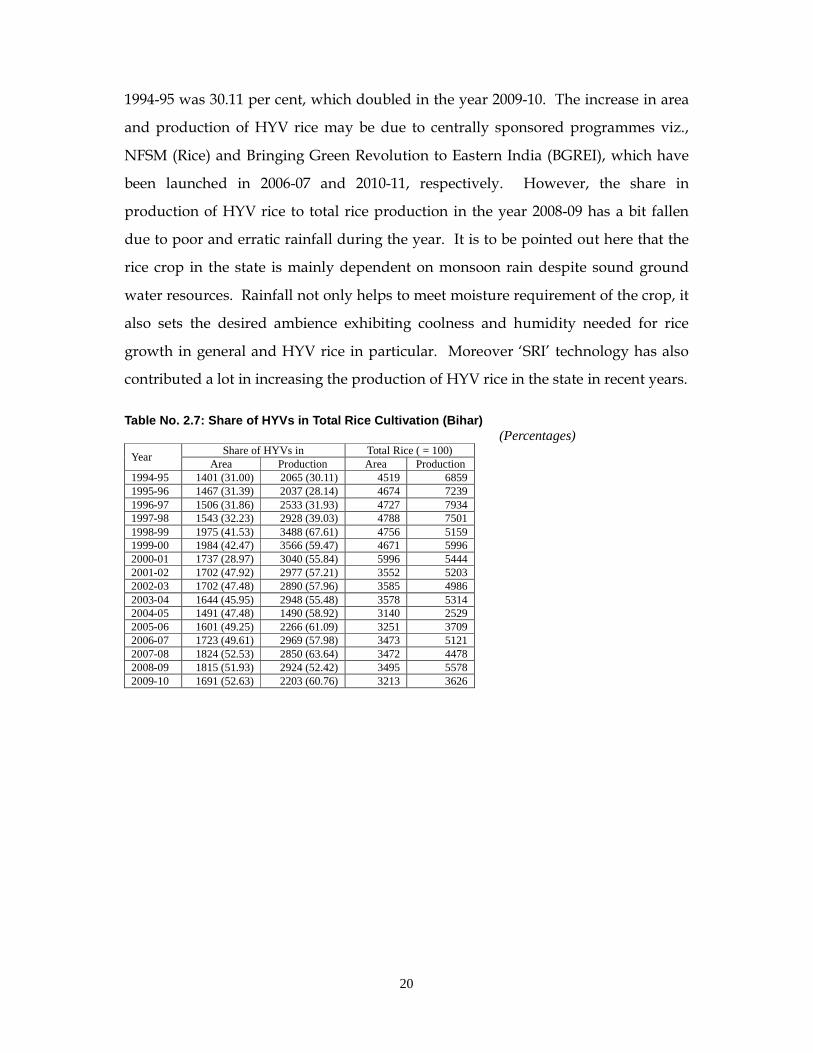
The data presented in table 2.7 showed, the share of area and production of HYV rice
in total rice area and production. The table reveals that the share in area of HYV rice
was 31.00 per cent in 1994-95, which touched to the level of 52.63 per cent in 2009-10.
Similarly the share in production of HYV rice to total rice production in the year
20
1994-95 was 30.11 per cent, which doubled in the year 2009-10. The increase in area
and production of HYV rice may be due to centrally sponsored programmes viz.,
NFSM (Rice) and Bringing Green Revolution to Eastern India (BGREI), which have
been launched in 2006-07 and 2010-11, respectively. However, the share in
production of HYV rice to total rice production in the year 2008-09 has a bit fallen
due to poor and erratic rainfall during the year. It is to be pointed out here that the
rice crop in the state is mainly dependent on monsoon rain despite sound ground
water resources. Rainfall not only helps to meet moisture requirement of the crop, it
also sets the desired ambience exhibiting coolness and humidity needed for rice
growth in general and HYV rice in particular. Moreover ‘SRI’ technology has also
contributed a lot in increasing the production of HYV rice in the state in recent years.
Table No. 2.7: Share of HYVs in Total Rice Cultivat ion (Bihar) (Percentages)
Share of HYVs in Total Rice ( = 100) Year
Area Production Area Production 1994-95 1401 (31.00) 2065 (30.11) 4519 6859 1995-96 1467 (31.39) 2037 (28.14) 4674 7239 1996-97 1506 (31.86) 2533 (31.93) 4727 7934 1997-98 1543 (32.23) 2928 (39.03) 4788 7501 1998-99 1975 (41.53) 3488 (67.61) 4756 5159 1999-00 1984 (42.47) 3566 (59.47) 4671 5996 2000-01 1737 (28.97) 3040 (55.84) 5996 5444 2001-02 1702 (47.92) 2977 (57.21) 3552 5203 2002-03 1702 (47.48) 2890 (57.96) 3585 4986 2003-04 1644 (45.95) 2948 (55.48) 3578 5314 2004-05 1491 (47.48) 1490 (58.92) 3140 2529 2005-06 1601 (49.25) 2266 (61.09) 3251 3709 2006-07 1723 (49.61) 2969 (57.98) 3473 5121 2007-08 1824 (52.53) 2850 (63.64) 3472 4478 2008-09 1815 (51.93) 2924 (52.42) 3495 5578 2009-10 1691 (52.63) 2203 (60.76) 3213 3626
21
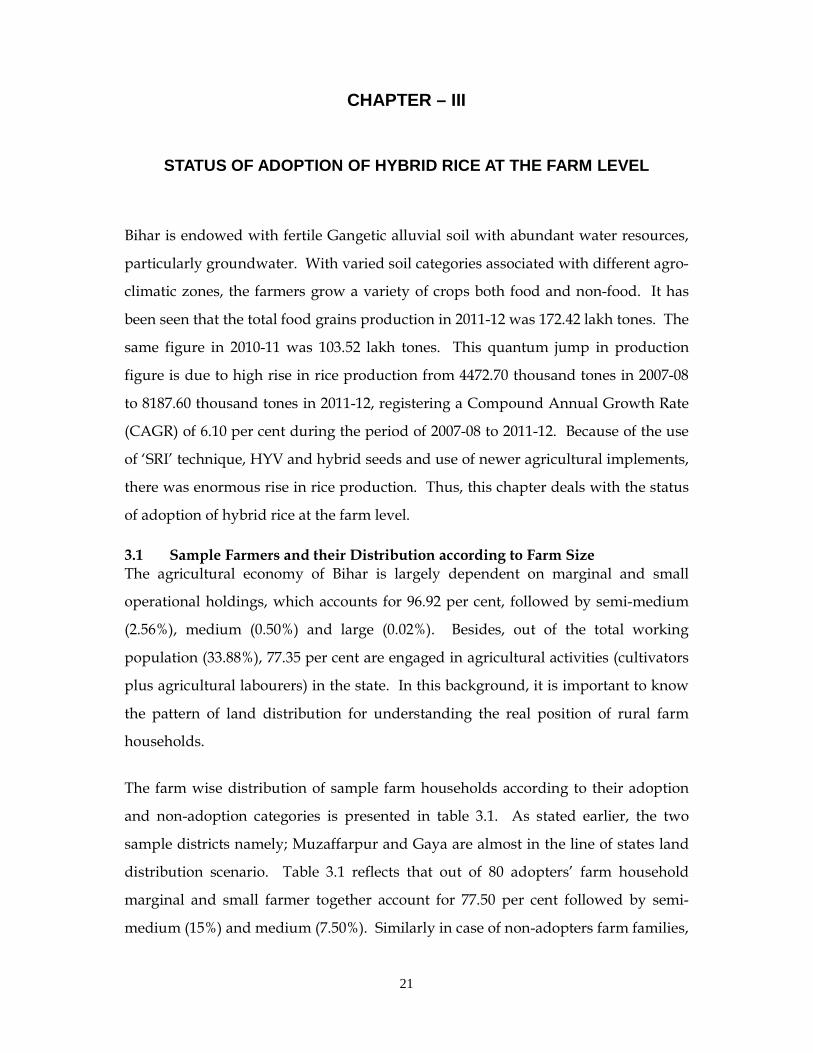
CHAPTER – III
STATUS OF ADOPTION OF HYBRID RICE AT THE FARM LEVEL
Bihar is endowed with fertile Gangetic alluvial soil with abundant water resources,
particularly groundwater. With varied soil categories associated with different agro-
climatic zones, the farmers grow a variety of crops both food and non-food. It has
been seen that the total food grains production in 2011-12 was 172.42 lakh tones. The
same figure in 2010-11 was 103.52 lakh tones. This quantum jump in production
figure is due to high rise in rice production from 4472.70 thousand tones in 2007-08
to 8187.60 thousand tones in 2011-12, registering a Compound Annual Growth Rate
(CAGR) of 6.10 per cent during the period of 2007-08 to 2011-12. Because of the use
of ‘SRI’ technique, HYV and hybrid seeds and use of newer agricultural implements,
there was enormous rise in rice production. Thus, this chapter deals with the status
of adoption of hybrid rice at the farm level.
3.1 Sample Farmers and their Distribution according to Farm Size The agricultural economy of Bihar is largely dependent on marginal and small
operational holdings, which accounts for 96.92 per cent, followed by semi-medium
(2.56%), medium (0.50%) and large (0.02%). Besides, out of the total working
population (33.88%), 77.35 per cent are engaged in agricultural activities (cultivators
plus agricultural labourers) in the state. In this background, it is important to know
the pattern of land distribution for understanding the real position of rural farm
households.
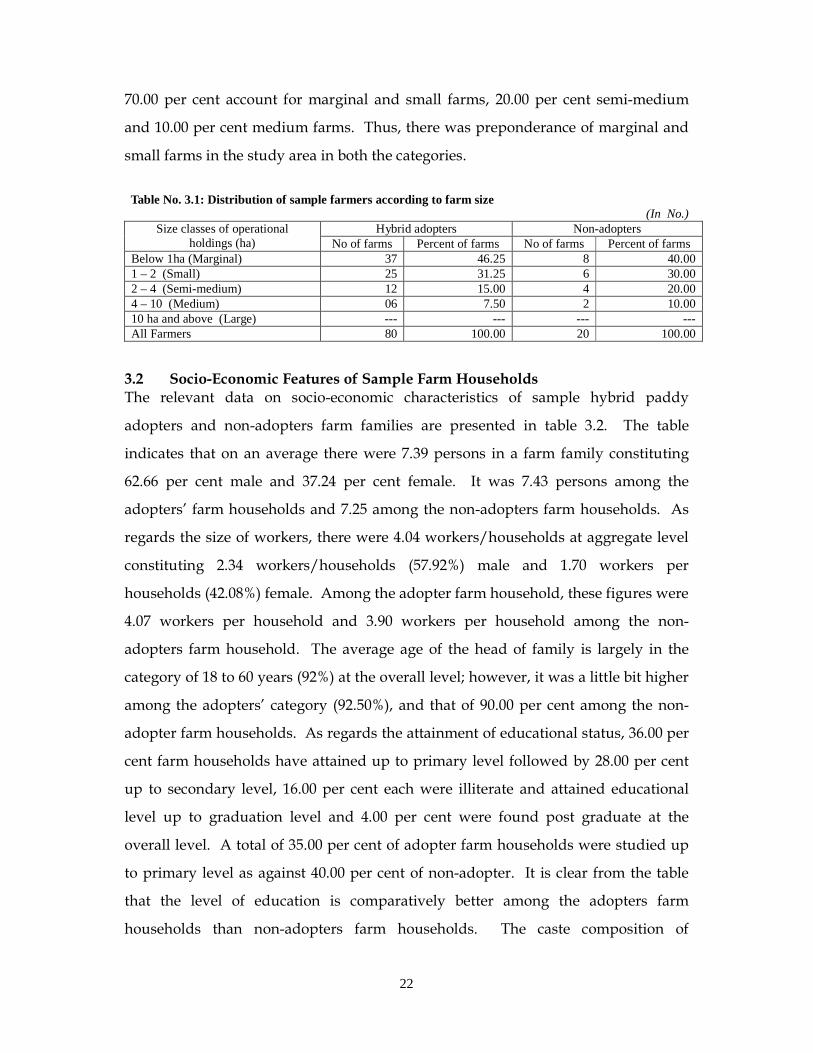
The farm wise distribution of sample farm households according to their adoption
and non-adoption categories is presented in table 3.1. As stated earlier, the two
sample districts namely; Muzaffarpur and Gaya are almost in the line of states land
distribution scenario. Table 3.1 reflects that out of 80 adopters’ farm household
marginal and small farmer together account for 77.50 per cent followed by semi-
medium (15%) and medium (7.50%). Similarly in case of non-adopters farm families,
22
70.00 per cent account for marginal and small farms, 20.00 per cent semi-medium
and 10.00 per cent medium farms. Thus, there was preponderance of marginal and
small farms in the study area in both the categories.
Table No. 3.1: Distribution of sample farmers according to farm size
(In No.) Hybrid adopters Non-adopters Size classes of operational
holdings (ha) No of farms Percent of farms No of farms Percent of farms Below 1ha (Marginal) 37 46.25 8 40.00 1 – 2 (Small) 25 31.25 6 30.00 2 – 4 (Semi-medium) 12 15.00 4 20.00 4 – 10 (Medium) 06 7.50 2 10.00 10 ha and above (Large) --- --- --- --- All Farmers 80 100.00 20 100.00
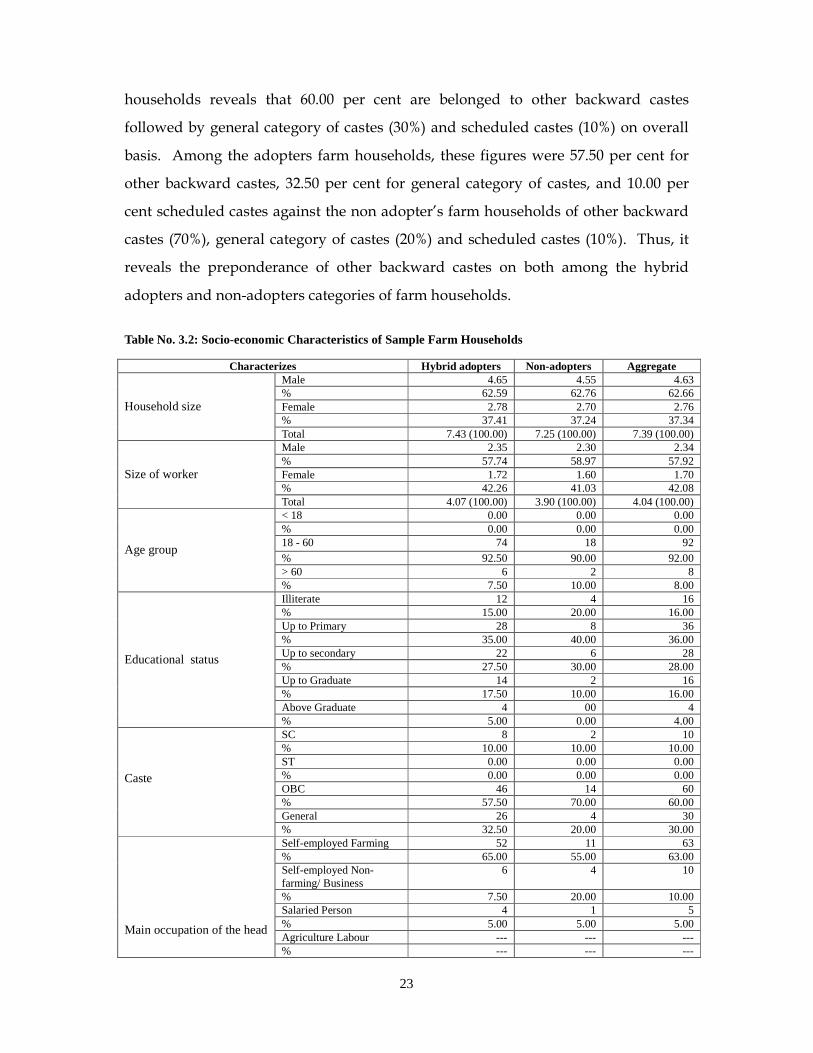
3.2 Socio-Economic Features of Sample Farm Households The relevant data on socio-economic characteristics of sample hybrid paddy
adopters and non-adopters farm families are presented in table 3.2. The table
indicates that on an average there were 7.39 persons in a farm family constituting
62.66 per cent male and 37.24 per cent female. It was 7.43 persons among the
adopters’ farm households and 7.25 among the non-adopters farm households. As
regards the size of workers, there were 4.04 workers/households at aggregate level
constituting 2.34 workers/households (57.92%) male and 1.70 workers per
households (42.08%) female. Among the adopter farm household, these figures were
4.07 workers per household and 3.90 workers per household among the non-
adopters farm household. The average age of the head of family is largely in the
category of 18 to 60 years (92%) at the overall level; however, it was a little bit higher
among the adopters’ category (92.50%), and that of 90.00 per cent among the non-
adopter farm households. As regards the attainment of educational status, 36.00 per
cent farm households have attained up to primary level followed by 28.00 per cent
up to secondary level, 16.00 per cent each were illiterate and attained educational
level up to graduation level and 4.00 per cent were found post graduate at the
overall level. A total of 35.00 per cent of adopter farm households were studied up
to primary level as against 40.00 per cent of non-adopter. It is clear from the table
that the level of education is comparatively better among the adopters farm
households than non-adopters farm households. The caste composition of
23
households reveals that 60.00 per cent are belonged to other backward castes
followed by general category of castes (30%) and scheduled castes (10%) on overall
basis. Among the adopters farm households, these figures were 57.50 per cent for
other backward castes, 32.50 per cent for general category of castes, and 10.00 per
cent scheduled castes against the non adopter’s farm households of other backward
castes (70%), general category of castes (20%) and scheduled castes (10%). Thus, it
reveals the preponderance of other backward castes on both among the hybrid
adopters and non-adopters categories of farm households.
Table No. 3.2: Socio-economic Characteristics of Sample Farm Households
Characterizes Hybrid adopters Non-adopters Aggregate Male 4.65 4.55 4.63 % 62.59 62.76 62.66 Female 2.78 2.70 2.76 % 37.41 37.24 37.34
Household size
Total 7.43 (100.00) 7.25 (100.00) 7.39 (100.00) Male 2.35 2.30 2.34 % 57.74 58.97 57.92 Female 1.72 1.60 1.70 % 42.26 41.03 42.08
Size of worker
Total 4.07 (100.00) 3.90 (100.00) 4.04 (100.00) < 18 0.00 0.00 0.00 % 0.00 0.00 0.00 18 - 60 74 18 92 % 92.50 90.00 92.00 > 60 6 2 8
Age group
% 7.50 10.00 8.00 Illiterate 12 4 16 % 15.00 20.00 16.00 Up to Primary 28 8 36 % 35.00 40.00 36.00 Up to secondary 22 6 28 % 27.50 30.00 28.00 Up to Graduate 14 2 16 % 17.50 10.00 16.00 Above Graduate 4 00 4
Educational status
% 5.00 0.00 4.00 SC 8 2 10 % 10.00 10.00 10.00 ST 0.00 0.00 0.00 % 0.00 0.00 0.00 OBC 46 14 60 % 57.50 70.00 60.00 General 26 4 30
Caste
% 32.50 20.00 30.00 Self-employed Farming 52 11 63 % 65.00 55.00 63.00 Self-employed Non-farming/ Business
6 4 10
% 7.50 20.00 10.00 Salaried Person 4 1 5 % 5.00 5.00 5.00 Agriculture Labour --- --- ---
Main occupation of the head
% --- --- ---
24
Non-agricultural Labour 2 2 4 % 2.50 10.00 4.00 Pensioner, 2 --- 2 % 2.50 --- 2.00 Household Work 14 2 16 % 17.50 10.00 16.00 Student --- --- --- % --- --- --- Others (specify) --- --- --- % --- --- ---
Average size of holding (ha) Ownership holdings 1.31 1.28 1.30 Operational holdings 1.25 1.22 1.24 Average size of irrigated land (ha)
Kharif 0.80 0.79 0.79
% 64.52 62.20 63.20 Rabi 0.44 0.48 0.46 % 35.48 37.80 36.80 Summer --- --- --- % --- --- --- Total 1.24 1.27 1.25 % 100.00 100.00 100.00
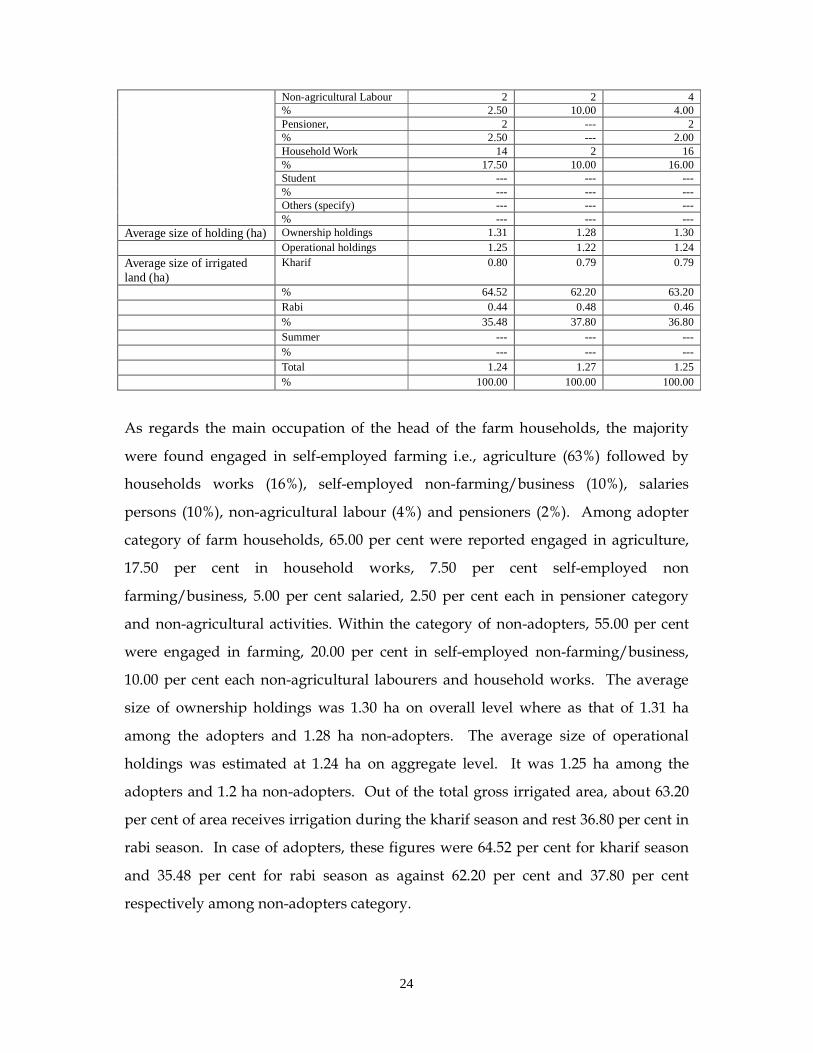
As regards the main occupation of the head of the farm households, the majority
were found engaged in self-employed farming i.e., agriculture (63%) followed by
households works (16%), self-employed non-farming/business (10%), salaries
persons (10%), non-agricultural labour (4%) and pensioners (2%). Among adopter
category of farm households, 65.00 per cent were reported engaged in agriculture,
17.50 per cent in household works, 7.50 per cent self-employed non
farming/business, 5.00 per cent salaried, 2.50 per cent each in pensioner category
and non-agricultural activities. Within the category of non-adopters, 55.00 per cent
were engaged in farming, 20.00 per cent in self-employed non-farming/business,
10.00 per cent each non-agricultural labourers and household works. The average
size of ownership holdings was 1.30 ha on overall level where as that of 1.31 ha
among the adopters and 1.28 ha non-adopters. The average size of operational
holdings was estimated at 1.24 ha on aggregate level. It was 1.25 ha among the
adopters and 1.2 ha non-adopters. Out of the total gross irrigated area, about 63.20
per cent of area receives irrigation during the kharif season and rest 36.80 per cent in
rabi season. In case of adopters, these figures were 64.52 per cent for kharif season
and 35.48 per cent for rabi season as against 62.20 per cent and 37.80 per cent
respectively among non-adopters category.
25
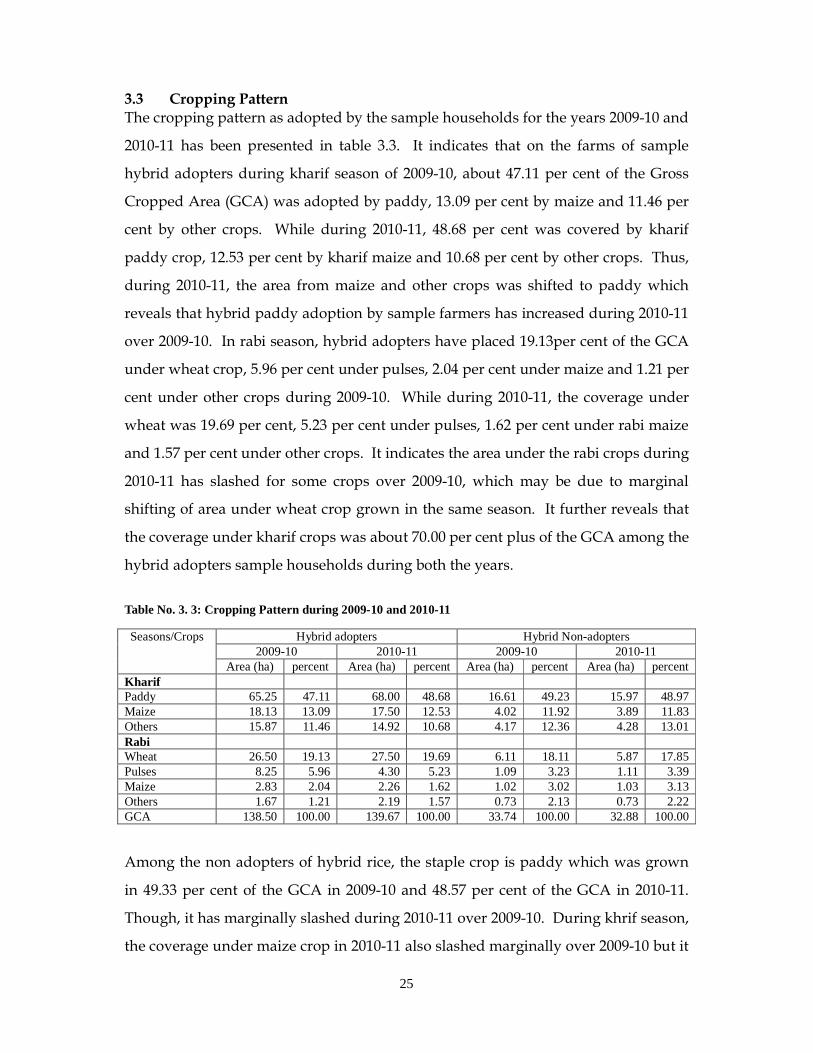
3.3 Cropping Pattern The cropping pattern as adopted by the sample households for the years 2009-10 and
2010-11 has been presented in table 3.3. It indicates that on the farms of sample
hybrid adopters during kharif season of 2009-10, about 47.11 per cent of the Gross
Cropped Area (GCA) was adopted by paddy, 13.09 per cent by maize and 11.46 per
cent by other crops. While during 2010-11, 48.68 per cent was covered by kharif
paddy crop, 12.53 per cent by kharif maize and 10.68 per cent by other crops. Thus,
during 2010-11, the area from maize and other crops was shifted to paddy which
reveals that hybrid paddy adoption by sample farmers has increased during 2010-11
over 2009-10. In rabi season, hybrid adopters have placed 19.13per cent of the GCA
under wheat crop, 5.96 per cent under pulses, 2.04 per cent under maize and 1.21 per
cent under other crops during 2009-10. While during 2010-11, the coverage under
wheat was 19.69 per cent, 5.23 per cent under pulses, 1.62 per cent under rabi maize
and 1.57 per cent under other crops. It indicates the area under the rabi crops during
2010-11 has slashed for some crops over 2009-10, which may be due to marginal
shifting of area under wheat crop grown in the same season. It further reveals that
the coverage under kharif crops was about 70.00 per cent plus of the GCA among the
hybrid adopters sample households during both the years.
Table No. 3. 3: Cropping Pattern during 2009-10 and 2010-11
Hybrid adopters Hybrid Non-adopters 2009-10 2010-11 2009-10 2010-11
Seasons/Crops
Area (ha) percent Area (ha) percent Area (ha) percent Area (ha) percent Kharif Paddy 65.25 47.11 68.00 48.68 16.61 49.23 15.97 48.97 Maize 18.13 13.09 17.50 12.53 4.02 11.92 3.89 11.83 Others 15.87 11.46 14.92 10.68 4.17 12.36 4.28 13.01 Rabi Wheat 26.50 19.13 27.50 19.69 6.11 18.11 5.87 17.85 Pulses 8.25 5.96 4.30 5.23 1.09 3.23 1.11 3.39 Maize 2.83 2.04 2.26 1.62 1.02 3.02 1.03 3.13 Others 1.67 1.21 2.19 1.57 0.73 2.13 0.73 2.22 GCA 138.50 100.00 139.67 100.00 33.74 100.00 32.88 100.00
Among the non adopters of hybrid rice, the staple crop is paddy which was grown
in 49.33 per cent of the GCA in 2009-10 and 48.57 per cent of the GCA in 2010-11.
Though, it has marginally slashed during 2010-11 over 2009-10. During khrif season,
the coverage under maize crop in 2010-11 also slashed marginally over 2009-10 but it
26
was reported a little increase under other crops during 2010-11 over 2009-10. During
rabi season, wheat was grown in 18.11 per cent of the GCA in 2009-10 and 17.85 per
cent in 2010-11. The area under pulses, rabi maize and other crops was found a little
higher in 2010-11 over 2009-10. The aggregate share of kharif crops of the GCA was
almost 73.00 per cent plus among the non-adopters of hybrid rice during both years.
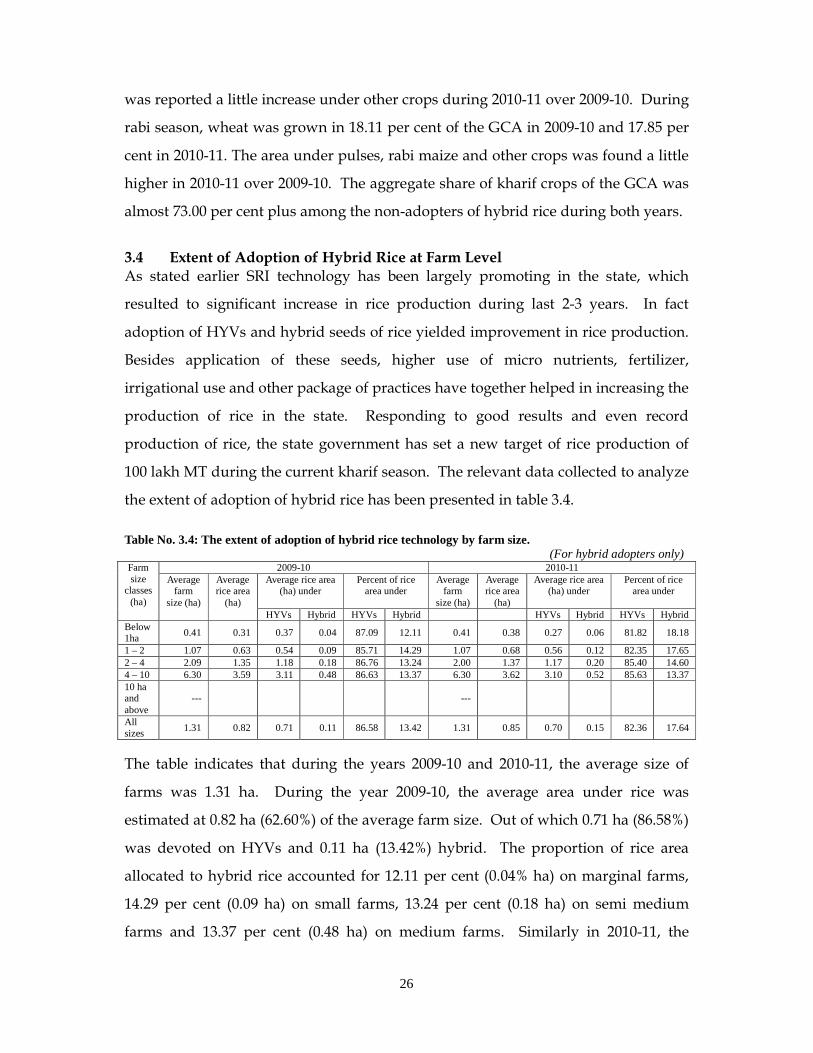
3.4 Extent of Adoption of Hybrid Rice at Farm Level As stated earlier SRI technology has been largely promoting in the state, which
resulted to significant increase in rice production during last 2-3 years. In fact
adoption of HYVs and hybrid seeds of rice yielded improvement in rice production.
Besides application of these seeds, higher use of micro nutrients, fertilizer,
irrigational use and other package of practices have together helped in increasing the
production of rice in the state. Responding to good results and even record
production of rice, the state government has set a new target of rice production of
100 lakh MT during the current kharif season. The relevant data collected to analyze
the extent of adoption of hybrid rice has been presented in table 3.4.
Table No. 3.4: The extent of adoption of hybrid rice technology by farm size. (For hybrid adopters only)
2009-10 2010-11 Average rice area
(ha) under Percent of rice
area under Average
farm size (ha)
Average rice area
(ha)
Average rice area (ha) under
Percent of rice area under
Farm size
classes (ha)
Average farm
size (ha)
Average rice area
(ha) HYVs Hybrid HYVs Hybrid HYVs Hybrid HYVs Hybrid
Below 1ha 0.41 0.31 0.37 0.04 87.09 12.11 0.41 0.38 0.27 0.06 81.82 18.18
1 – 2 1.07 0.63 0.54 0.09 85.71 14.29 1.07 0.68 0.56 0.12 82.35 17.65 2 – 4 2.09 1.35 1.18 0.18 86.76 13.24 2.00 1.37 1.17 0.20 85.40 14.60 4 – 10 6.30 3.59 3.11 0.48 86.63 13.37 6.30 3.62 3.10 0.52 85.63 13.37 10 ha and above
--- ---
All sizes 1.31 0.82 0.71 0.11 86.58 13.42 1.31 0.85 0.70 0.15 82.36 17.64
The table indicates that during the years 2009-10 and 2010-11, the average size of
farms was 1.31 ha. During the year 2009-10, the average area under rice was
estimated at 0.82 ha (62.60%) of the average farm size. Out of which 0.71 ha (86.58%)
was devoted on HYVs and 0.11 ha (13.42%) hybrid. The proportion of rice area
allocated to hybrid rice accounted for 12.11 per cent (0.04% ha) on marginal farms,
14.29 per cent (0.09 ha) on small farms, 13.24 per cent (0.18 ha) on semi medium
farms and 13.37 per cent (0.48 ha) on medium farms. Similarly in 2010-11, the
27
average area under rice was estimated at 0.85 ha (64.88%) of the average farm size.
Out of which 0.70 ha (82.36%) was devoted on HYVs and 0.15 ha (17.64%) on hybrid
rice. The proportion of rice area allocated to hybrid rice accounted for 18.18 per cent
(0.06 ha) on marginal farms, 17.65 per cent (0.12 ha) on small farms, 14.60 per cent
(0.20 ha) on semi-medium farms and 13.37 per cent (0.52 ha) on medium farms. The
analysis of all sizes farm and as according to farms clearly reveals that the coverage
under hybrid rice has been due to the fact that the farmers have been realizing the
vast potential of hybrid over inbred varieties of rice. Though, its promotion by
continuing the assistance under SRI technique at the farm level is the most
important.
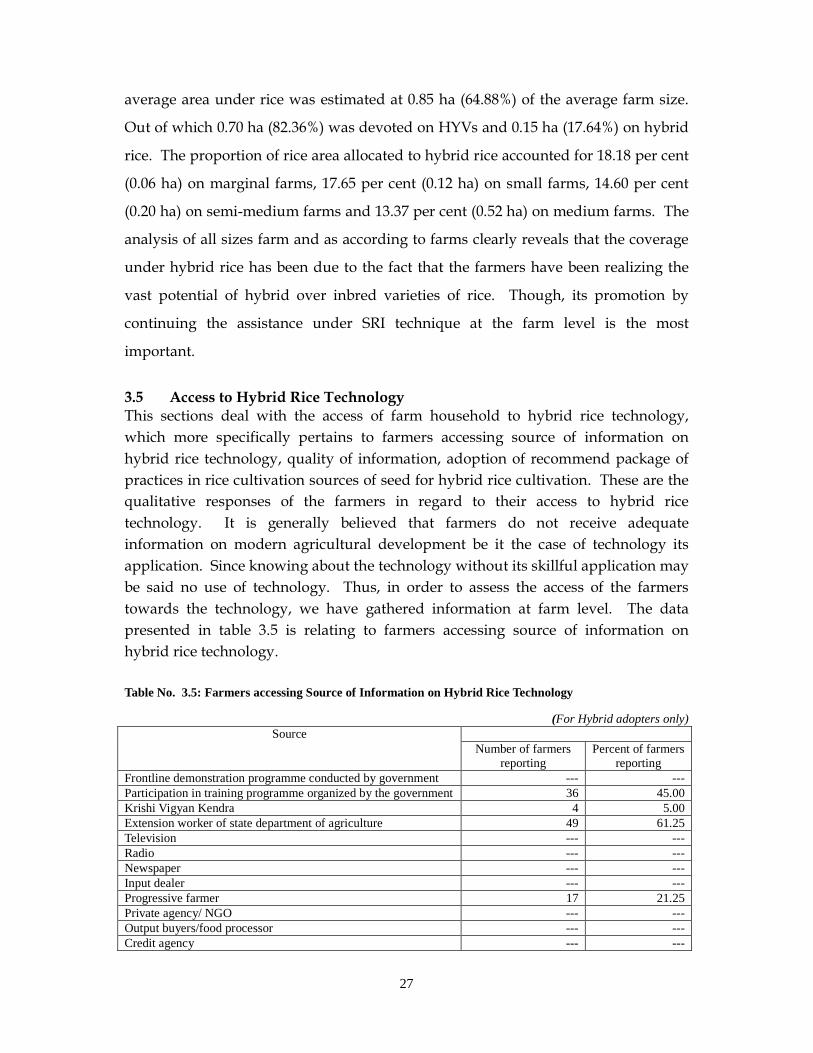
3.5 Access to Hybrid Rice Technology This sections deal with the access of farm household to hybrid rice technology,
which more specifically pertains to farmers accessing source of information on
hybrid rice technology, quality of information, adoption of recommend package of
practices in rice cultivation sources of seed for hybrid rice cultivation. These are the
qualitative responses of the farmers in regard to their access to hybrid rice
technology. It is generally believed that farmers do not receive adequate
information on modern agricultural development be it the case of technology its
application. Since knowing about the technology without its skillful application may
be said no use of technology. Thus, in order to assess the access of the farmers
towards the technology, we have gathered information at farm level. The data
presented in table 3.5 is relating to farmers accessing source of information on
hybrid rice technology.
Table No. 3.5: Farmers accessing Source of Information on Hybrid Rice Technology
(For Hybrid adopters only) Source
Number of farmers reporting
Percent of farmers reporting
Frontline demonstration programme conducted by government --- --- Participation in training programme organized by the government 36 45.00 Krishi Vigyan Kendra 4 5.00 Extension worker of state department of agriculture 49 61.25 Television --- --- Radio --- --- Newspaper --- --- Input dealer --- --- Progressive farmer 17 21.25 Private agency/ NGO --- --- Output buyers/food processor --- --- Credit agency --- ---
28
Others --- ---
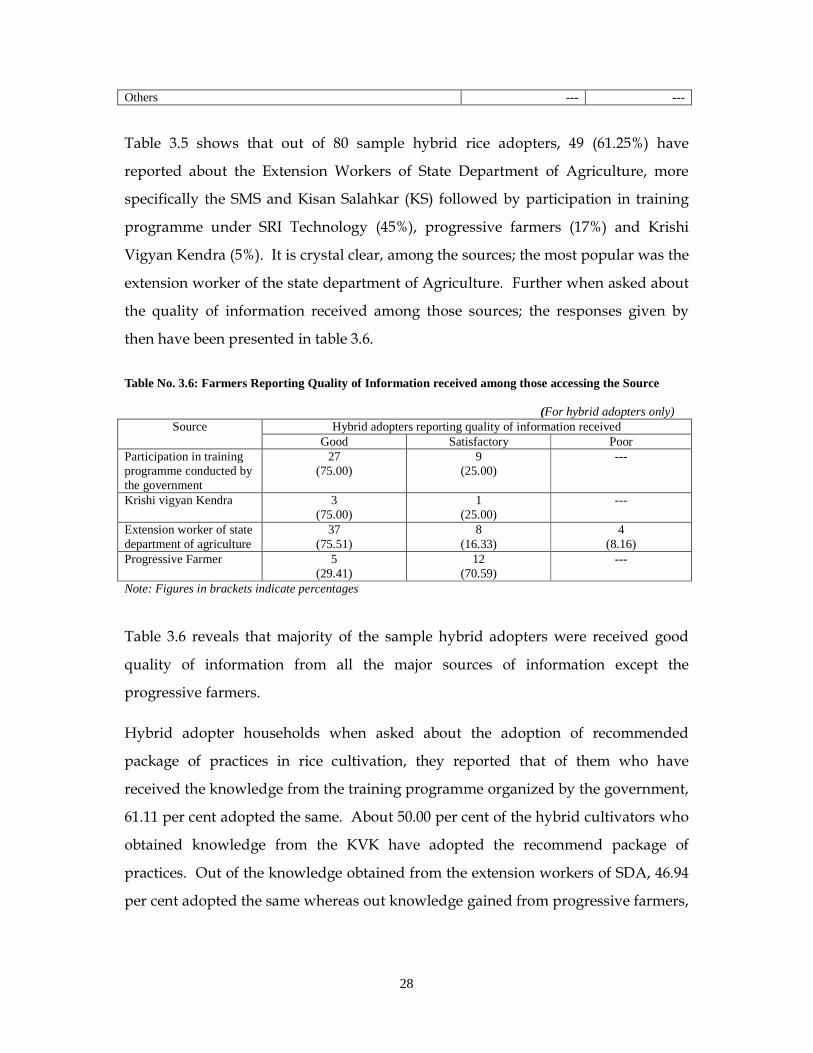
Table 3.5 shows that out of 80 sample hybrid rice adopters, 49 (61.25%) have
reported about the Extension Workers of State Department of Agriculture, more
specifically the SMS and Kisan Salahkar (KS) followed by participation in training
programme under SRI Technology (45%), progressive farmers (17%) and Krishi
Vigyan Kendra (5%). It is crystal clear, among the sources; the most popular was the
extension worker of the state department of Agriculture. Further when asked about
the quality of information received among those sources; the responses given by
then have been presented in table 3.6.
Table No. 3.6: Farmers Reporting Quality of Information received among those accessing the Source (For hybrid adopters only)
Hybrid adopters reporting quality of information received Source Good Satisfactory Poor
Participation in training programme conducted by the government
27 (75.00)
9 (25.00)
---
Krishi vigyan Kendra 3 (75.00)
1 (25.00)
---
Extension worker of state department of agriculture
37 (75.51)
8 (16.33)
4 (8.16)
Progressive Farmer 5 (29.41)
12 (70.59)
---
Note: Figures in brackets indicate percentages
Table 3.6 reveals that majority of the sample hybrid adopters were received good
quality of information from all the major sources of information except the
progressive farmers.
Hybrid adopter households when asked about the adoption of recommended
package of practices in rice cultivation, they reported that of them who have
received the knowledge from the training programme organized by the government,
61.11 per cent adopted the same. About 50.00 per cent of the hybrid cultivators who
obtained knowledge from the KVK have adopted the recommend package of
practices. Out of the knowledge obtained from the extension workers of SDA, 46.94
per cent adopted the same whereas out knowledge gained from progressive farmers,
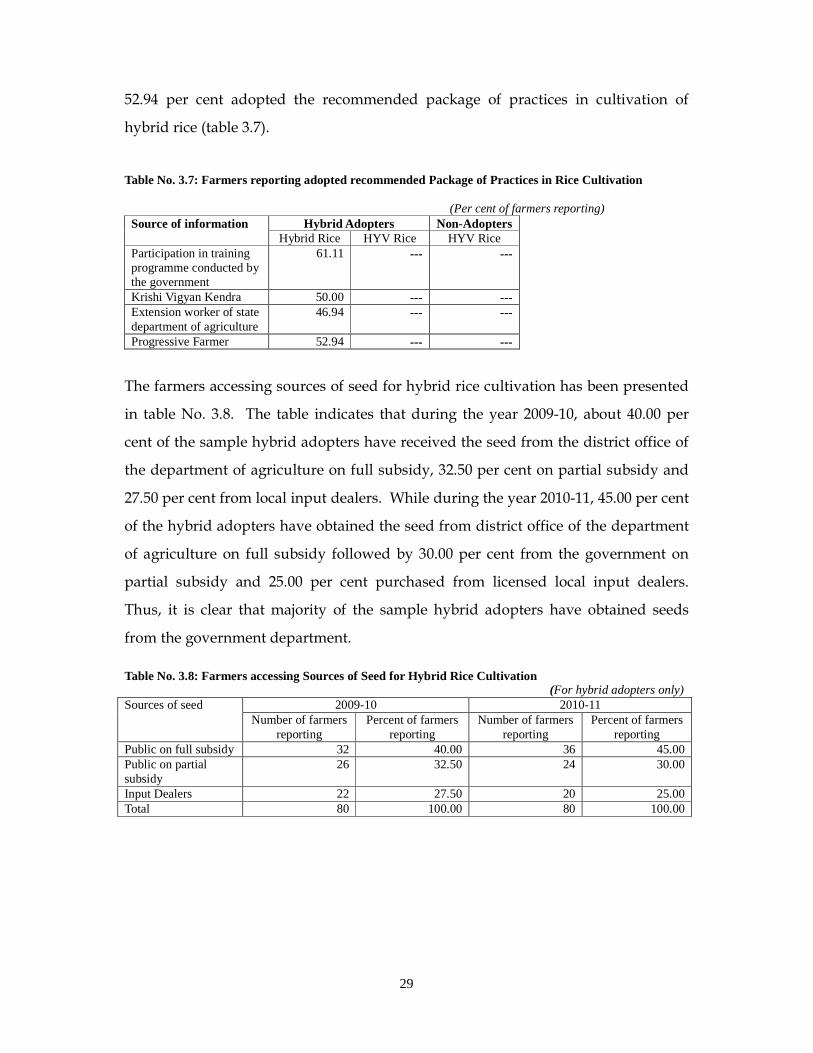
29
52.94 per cent adopted the recommended package of practices in cultivation of
hybrid rice (table 3.7).
Table No. 3.7: Farmers reporting adopted recommended Package of Practices in Rice Cultivation (Per cent of farmers reporting)
Hybrid Adopters Non-Adopters Source of information Hybrid Rice HYV Rice HYV Rice
Participation in training programme conducted by the government
61.11 --- ---
Krishi Vigyan Kendra 50.00 --- --- Extension worker of state department of agriculture
46.94 --- ---
Progressive Farmer 52.94 --- ---
The farmers accessing sources of seed for hybrid rice cultivation has been presented
in table No. 3.8. The table indicates that during the year 2009-10, about 40.00 per
cent of the sample hybrid adopters have received the seed from the district office of
the department of agriculture on full subsidy, 32.50 per cent on partial subsidy and
27.50 per cent from local input dealers. While during the year 2010-11, 45.00 per cent
of the hybrid adopters have obtained the seed from district office of the department
of agriculture on full subsidy followed by 30.00 per cent from the government on
partial subsidy and 25.00 per cent purchased from licensed local input dealers.
Thus, it is clear that majority of the sample hybrid adopters have obtained seeds
from the government department.
Table No. 3.8: Farmers accessing Sources of Seed for Hybrid Rice Cultivation (For hybrid adopters only)
2009-10 2010-11 Sources of seed Number of farmers
reporting Percent of farmers
reporting Number of farmers
reporting Percent of farmers
reporting Public on full subsidy 32 40.00 36 45.00 Public on partial subsidy
26 32.50 24 30.00
Input Dealers 22 27.50 20 25.00 Total 80 100.00 80 100.00
30
CHAPTER – IV
IMPACT OF HYBRID RICE CULTIVATION ON OVERALL PRODUCTION OF RICE
As a result of various initiative taken by the Government in the implementation of a
number of Crop Development Schemes, the productivity of rice has increased from
1901 kg/ha in 2000-01 to 2372 kg/ha in 2011-12 (4th Adv. Estimate) and it touched a
record production of 104.32 million tones in 2011-12. All-India average annual
growth rate of yield of rice has shown a growth of 1.47 per cent per annum during
2000-01 to 2010-11 compared to 1.36 per cent per annum during 1990-91 to 1999-
2000. The turn around seems to be in the eastern states (including Bihar) where the
government is implementing the BGREI (Bringing Green Revolution to Eastern
India) Programme since 2010-11.
In Bihar, because of use of new ‘SRI’ technique, there was enormous rise in rice
production. The level of rice production prior to 2010-11 was not consistent and
there was much variation in the production over the years. This is due to the fact
that around 50.00 per cent of net sown area is bereft of irrigation and dependent on
rain. The average production figure was around 50 lakh tones during the period
from 2007-08 to 2010-11. Major initiative taken by the government through its 1st
Agricultural Road Map (2007-12) was to provide quality seeds are --- Chief
Ministers’ Crash Seed Programme, Seed Village Programme (Beej Gram Yojana),
provision of subsidy for the production and use of certified seeds, revival of
dormant Bihar Rajya Beej Nigam (BRBM), strengthening of Bihar Seed Certification
agency and multiplication of seeds by state farms. All these together have
contributed much towards agricultural productivity in the state. Recently, the
31
scheme called ‘Mukhyamantri Tibra Beej Vistar Karyakram’ has helped farmers
immensely for hybrid paddy cultivation. The SRR for major crops like rice has
increased substantially from 26.40 per cent in 2009-10 to 38.00 per cent in 2011-12.
During kharif 2011, SRI technique was used for paddy cultivation and hybrid
varieties of paddy in 4.10 lakh hectares. These interventions resulted into record rice
production in state. Paddy productivity rose to as high as 22.40 MT per hectare one
of the regular efforts by the state government in extension services is to average for
minikit distributions at the Panchayat or village level. The number of
demonstrations for paddy (5 kg), which was 35,880 in 2008-09 increased to 36,188 in
2011-12. The number of demonstrations for HYV paddy (6 kg) was 8014 in 2009-10,
3346 in 2010-11 and 5500 in 2011-12. This comprehensive effort resulted to increase
in productivity of rice from 1457 kg/ha in triennium average for 2000-03 to 1574 kg
per hectare in triennium for 2009-12, registering a percentage change between the
two trienniums of 8.03 per cent.
In above backdrop, the present chapter deals with impact of hybrid rice cultivation
on overall production of rice in Bihar are following sections.
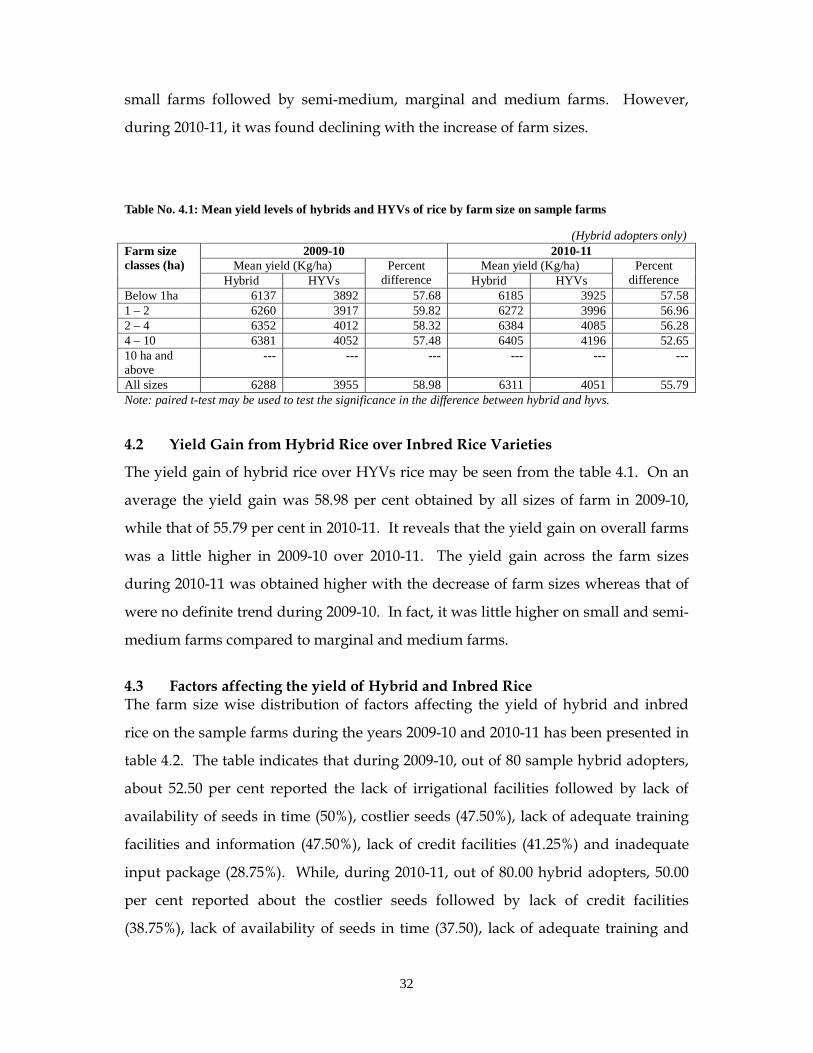
4.1 Yield Performance of Hybrid and HYVs Rice In table No. 4.1 mean yield levels of hybrid and HYVs rice by farm sizes on sample
farms has been worked out. The table indicates that on overall, hybrid rice
performed better with mean yield of 6288 kg/ha than the mean yield of 3955 kg/ha
for HYVs rice during the year 2009-10. The percentage difference between the
hybrid and HYVs rice was calculated at 58.98 per cent. While the mean yield of
hybrid rice was 6311 kg/ha than the mean yield of 4051 kg/ha for HYVs during the
year 2010-11. The percentage difference between the hybrid and HYVs rice was
estimated at 55.79 per cent. During 2009-10, the percentage difference between the
mean yields of hybrid and HYVs rice was better than the percentage difference
between the mean yields of hybrid and HYVs rice of 2010-11. The farm wise
analysis of percentage difference between the mean yields of hybrid and HYVs rice
was not found in a definite trend during the year 2009-10. It was found higher on
32
small farms followed by semi-medium, marginal and medium farms. However,
during 2010-11, it was found declining with the increase of farm sizes.
Table No. 4.1: Mean yield levels of hybrids and HYVs of rice by farm size on sample farms
(Hybrid adopters only) 2009-10 2010-11
Mean yield (Kg/ha) Mean yield (Kg/ha) Farm size classes (ha)
Hybrid HYVs Percent
difference Hybrid HYVs Percent
difference Below 1ha 6137 3892 57.68 6185 3925 57.58 1 – 2 6260 3917 59.82 6272 3996 56.96 2 – 4 6352 4012 58.32 6384 4085 56.28 4 – 10 6381 4052 57.48 6405 4196 52.65 10 ha and above
--- --- --- --- --- ---
All sizes 6288 3955 58.98 6311 4051 55.79 Note: paired t-test may be used to test the significance in the difference between hybrid and hyvs.
4.2 Yield Gain from Hybrid Rice over Inbred Rice Varieties
The yield gain of hybrid rice over HYVs rice may be seen from the table 4.1. On an
average the yield gain was 58.98 per cent obtained by all sizes of farm in 2009-10,
while that of 55.79 per cent in 2010-11. It reveals that the yield gain on overall farms
was a little higher in 2009-10 over 2010-11. The yield gain across the farm sizes
during 2010-11 was obtained higher with the decrease of farm sizes whereas that of
were no definite trend during 2009-10. In fact, it was little higher on small and semi-
medium farms compared to marginal and medium farms.
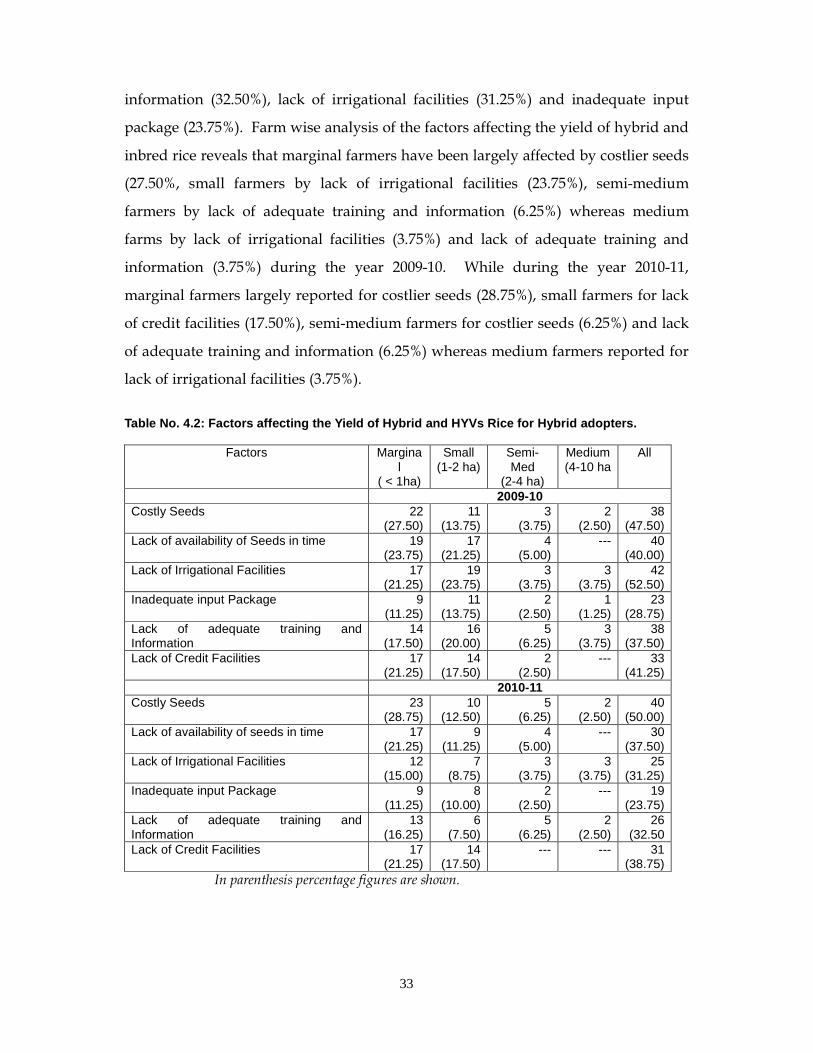
4.3 Factors affecting the yield of Hybrid and Inbred Rice The farm size wise distribution of factors affecting the yield of hybrid and inbred
rice on the sample farms during the years 2009-10 and 2010-11 has been presented in
table 4.2. The table indicates that during 2009-10, out of 80 sample hybrid adopters,
about 52.50 per cent reported the lack of irrigational facilities followed by lack of
availability of seeds in time (50%), costlier seeds (47.50%), lack of adequate training
facilities and information (47.50%), lack of credit facilities (41.25%) and inadequate
input package (28.75%). While, during 2010-11, out of 80.00 hybrid adopters, 50.00
per cent reported about the costlier seeds followed by lack of credit facilities
(38.75%), lack of availability of seeds in time (37.50), lack of adequate training and
33
information (32.50%), lack of irrigational facilities (31.25%) and inadequate input
package (23.75%). Farm wise analysis of the factors affecting the yield of hybrid and
inbred rice reveals that marginal farmers have been largely affected by costlier seeds
(27.50%, small farmers by lack of irrigational facilities (23.75%), semi-medium
farmers by lack of adequate training and information (6.25%) whereas medium
farms by lack of irrigational facilities (3.75%) and lack of adequate training and
information (3.75%) during the year 2009-10. While during the year 2010-11,
marginal farmers largely reported for costlier seeds (28.75%), small farmers for lack
of credit facilities (17.50%), semi-medium farmers for costlier seeds (6.25%) and lack
of adequate training and information (6.25%) whereas medium farmers reported for
lack of irrigational facilities (3.75%).
Table No. 4.2: Factors affecting the Yield of Hybri d and HYVs Rice for Hybrid adopters.
Factors Marginal
( < 1ha)
Small (1-2 ha)
Semi-Med
(2-4 ha)
Medium (4-10 ha
All
2009-10 Costly Seeds 22
(27.50) 11
(13.75) 3
(3.75) 2
(2.50) 38
(47.50) Lack of availability of Seeds in time 19
(23.75) 17
(21.25) 4
(5.00) --- 40
(40.00) Lack of Irrigational Facilities 17
(21.25) 19
(23.75) 3
(3.75) 3
(3.75) 42
(52.50) Inadequate input Package 9
(11.25) 11
(13.75) 2
(2.50) 1
(1.25) 23
(28.75) Lack of adequate training and Information
14 (17.50)
16 (20.00)
5 (6.25)
3 (3.75)
38 (37.50)
Lack of Credit Facilities 17 (21.25)
14 (17.50)
2 (2.50)
--- 33 (41.25)
2010-11 Costly Seeds 23
(28.75) 10
(12.50) 5
(6.25) 2
(2.50) 40
(50.00) Lack of availability of seeds in time 17
(21.25) 9
(11.25) 4
(5.00) --- 30
(37.50) Lack of Irrigational Facilities 12
(15.00) 7
(8.75) 3
(3.75) 3
(3.75) 25
(31.25) Inadequate input Package 9
(11.25) 8
(10.00) 2
(2.50) --- 19
(23.75) Lack of adequate training and Information
13 (16.25)
6 (7.50)
5 (6.25)
2 (2.50)
26 (32.50
Lack of Credit Facilities 17 (21.25)
14 (17.50)
--- --- 31 (38.75)
In parenthesis percentage figures are shown.
34
CHAPTER – V
COMPARATIVE ECONOMICS OF HYBRID AND INBRED RICE CULTIVATION
The present chapter deals with the input use pattern, operation wise labour
absorption including female labour, cost of input used and economic return obtained
by adopters over non-adopters of hybrid rice technology in the study area.
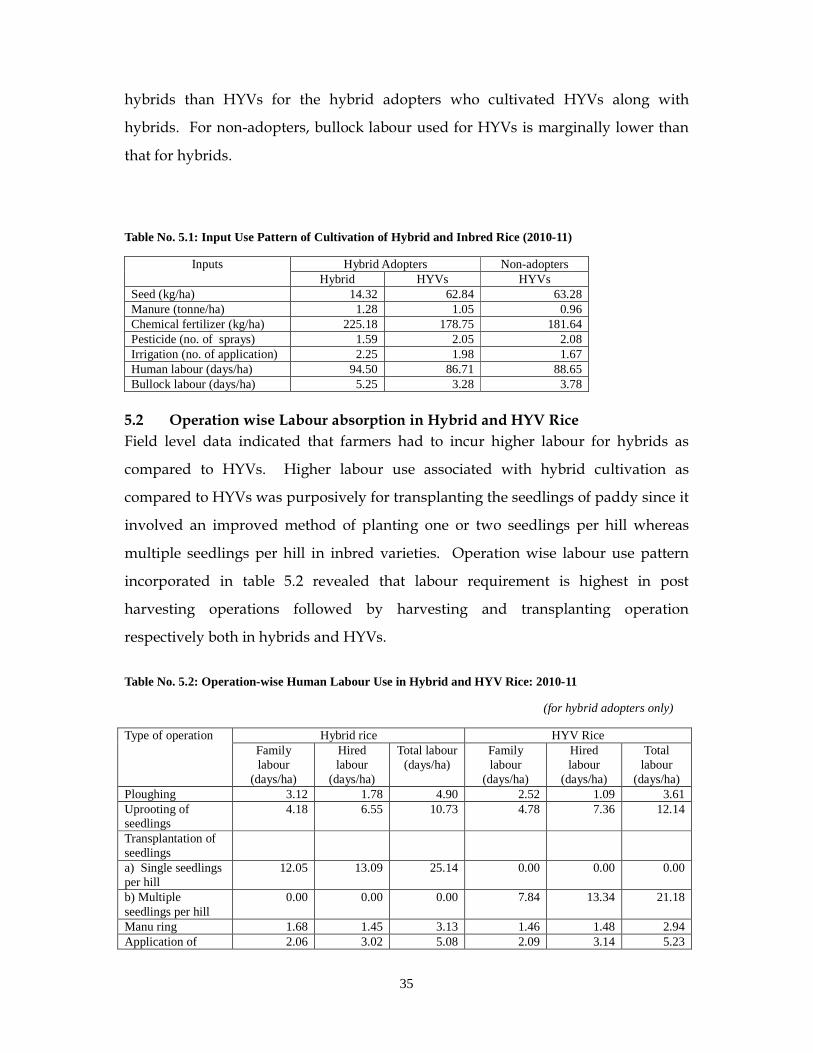
5.1 Input use Pattern for Cultivation of Hybrid & HYV Rice The input use pattern of cultivation of hybrid and inbred rice concerted to hybrid
rice growers and non-adopters of hybrid rice is presented in table 5.1. It is observed
from table that seed rate (kg/ha) is significantly lower for the hybrid than for HYVs.
This is fact that hybrids required only one or two seedling per hill for transplanting.
Seed rate for hybrids is 14.32 kg/ha whereas it is 62.84 kg per hectare for HYVs. In
case of non-adopter more or less similar seed rate is used. Organic and farm-yard
manure use for hybrid was nearly 21.90 per cent higher than that for HYVs. The use
of chemical fertilizer is also 25.97 per cent higher than that for HYVs. While in case
of non-adopter of hybrid rice, it is higher by 23.96 per cent. The number of
pesticides used is relatively lower for hybrid varieties than HYVs viewing hybrids
relatively less sensitive to insect and pest attack. But irrigation is almost same for the
hybrid and inbred varieties. Labour use is significantly higher for the hybrid than
that for HYVs. Among the group of hybrid adopters, the intensity of human labour
used is about on an average 94.50 days per hectare for hybrid as compared to 86.71
days per hectare for HYVs. That is 88.65 day per ha for non-adopter against hybrid
rice adopters. Bullock labour use in terms of days per hectare is merely higher for
35
hybrids than HYVs for the hybrid adopters who cultivated HYVs along with
hybrids. For non-adopters, bullock labour used for HYVs is marginally lower than
that for hybrids.
Table No. 5.1: Input Use Pattern of Cultivation of Hybrid and Inbred Rice (2010-11)
Hybrid Adopters Non-adopters Inputs Hybrid HYVs HYVs
Seed (kg/ha) 14.32 62.84 63.28 Manure (tonne/ha) 1.28 1.05 0.96 Chemical fertilizer (kg/ha) 225.18 178.75 181.64 Pesticide (no. of sprays) 1.59 2.05 2.08 Irrigation (no. of application) 2.25 1.98 1.67 Human labour (days/ha) 94.50 86.71 88.65 Bullock labour (days/ha) 5.25 3.28 3.78
5.2 Operation wise Labour absorption in Hybrid and HYV Rice
Field level data indicated that farmers had to incur higher labour for hybrids as
compared to HYVs. Higher labour use associated with hybrid cultivation as
compared to HYVs was purposively for transplanting the seedlings of paddy since it
involved an improved method of planting one or two seedlings per hill whereas
multiple seedlings per hill in inbred varieties. Operation wise labour use pattern
incorporated in table 5.2 revealed that labour requirement is highest in post
harvesting operations followed by harvesting and transplanting operation
respectively both in hybrids and HYVs.
Table No. 5.2: Operation-wise Human Labour Use in Hybrid and HYV Rice: 2010-11
(for hybrid adopters only)
Hybrid rice HYV Rice Type of operation Family labour
(days/ha)
Hired labour
(days/ha)
Total labour (days/ha)
Family labour
(days/ha)
Hired labour
(days/ha)
Total labour
(days/ha) Ploughing 3.12 1.78 4.90 2.52 1.09 3.61 Uprooting of seedlings
4.18 6.55 10.73 4.78 7.36 12.14
Transplantation of seedlings
a) Single seedlings per hill
12.05 13.09 25.14 0.00 0.00 0.00
b) Multiple seedlings per hill
0.00 0.00 0.00 7.84 13.34 21.18
Manu ring 1.68 1.45 3.13 1.46 1.48 2.94 Application of 2.06 3.02 5.08 2.09 3.14 5.23
36
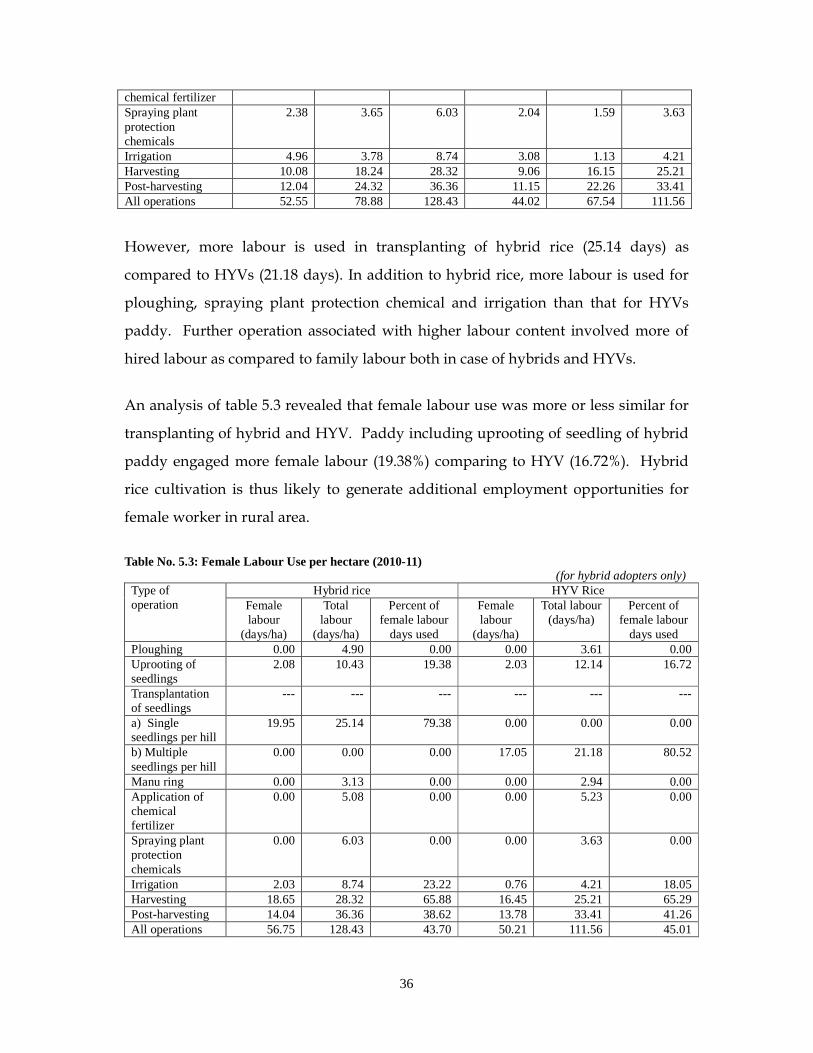
chemical fertilizer Spraying plant protection chemicals
2.38 3.65 6.03 2.04 1.59 3.63
Irrigation 4.96 3.78 8.74 3.08 1.13 4.21 Harvesting 10.08 18.24 28.32 9.06 16.15 25.21 Post-harvesting 12.04 24.32 36.36 11.15 22.26 33.41 All operations 52.55 78.88 128.43 44.02 67.54 111.56
However, more labour is used in transplanting of hybrid rice (25.14 days) as
compared to HYVs (21.18 days). In addition to hybrid rice, more labour is used for
ploughing, spraying plant protection chemical and irrigation than that for HYVs
paddy. Further operation associated with higher labour content involved more of
hired labour as compared to family labour both in case of hybrids and HYVs.
An analysis of table 5.3 revealed that female labour use was more or less similar for
transplanting of hybrid and HYV. Paddy including uprooting of seedling of hybrid
paddy engaged more female labour (19.38%) comparing to HYV (16.72%). Hybrid
rice cultivation is thus likely to generate additional employment opportunities for
female worker in rural area.
Table No. 5.3: Female Labour Use per hectare (2010-11) (for hybrid adopters only)
Hybrid rice HYV Rice Type of operation Female
labour (days/ha)
Total labour
(days/ha)
Percent of female labour
days used
Female labour
(days/ha)
Total labour (days/ha)
Percent of female labour
days used Ploughing 0.00 4.90 0.00 0.00 3.61 0.00 Uprooting of seedlings
2.08 10.43 19.38 2.03 12.14 16.72
Transplantation of seedlings
--- --- --- --- --- ---
a) Single seedlings per hill
19.95 25.14 79.38 0.00 0.00 0.00
b) Multiple seedlings per hill
0.00 0.00 0.00 17.05 21.18 80.52
Manu ring 0.00 3.13 0.00 0.00 2.94 0.00 Application of chemical fertilizer
0.00 5.08 0.00 0.00 5.23 0.00
Spraying plant protection chemicals
0.00 6.03 0.00 0.00 3.63 0.00
Irrigation 2.03 8.74 23.22 0.76 4.21 18.05 Harvesting 18.65 28.32 65.88 16.45 25.21 65.29 Post-harvesting 14.04 36.36 38.62 13.78 33.41 41.26 All operations 56.75 128.43 43.70 50.21 111.56 45.01
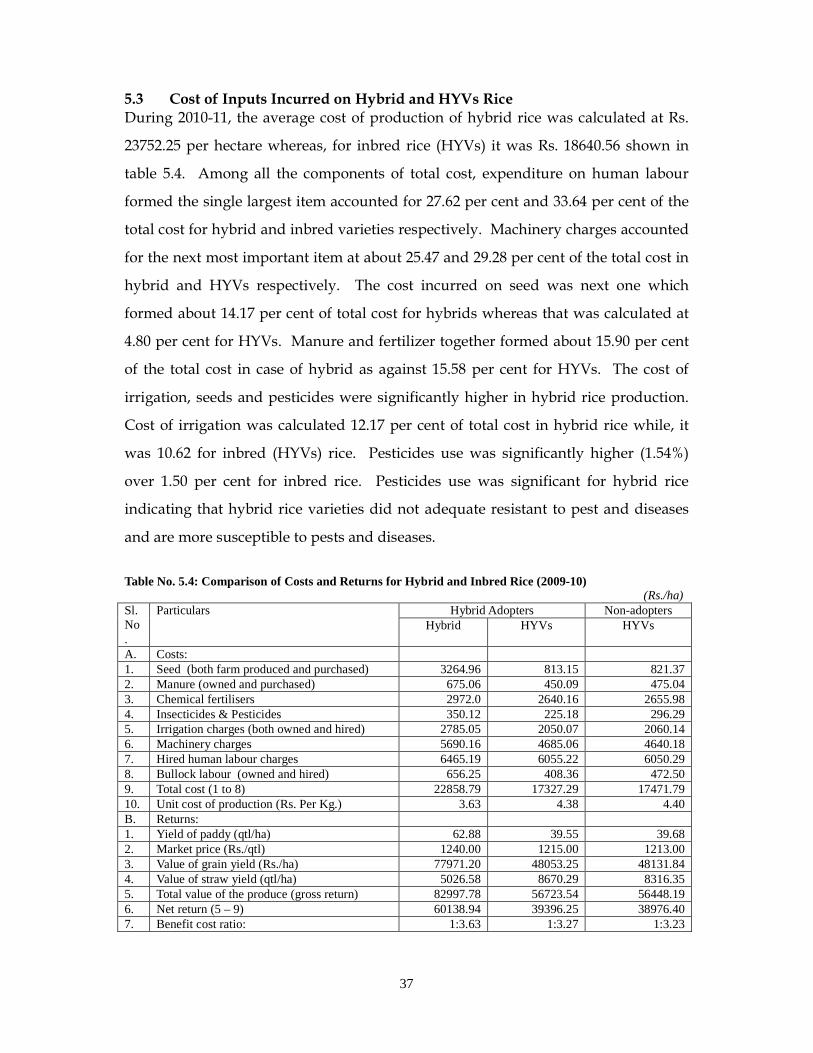
37
5.3 Cost of Inputs Incurred on Hybrid and HYVs Rice During 2010-11, the average cost of production of hybrid rice was calculated at Rs.
23752.25 per hectare whereas, for inbred rice (HYVs) it was Rs. 18640.56 shown in
table 5.4. Among all the components of total cost, expenditure on human labour
formed the single largest item accounted for 27.62 per cent and 33.64 per cent of the
total cost for hybrid and inbred varieties respectively. Machinery charges accounted
for the next most important item at about 25.47 and 29.28 per cent of the total cost in
hybrid and HYVs respectively. The cost incurred on seed was next one which
formed about 14.17 per cent of total cost for hybrids whereas that was calculated at
4.80 per cent for HYVs. Manure and fertilizer together formed about 15.90 per cent
of the total cost in case of hybrid as against 15.58 per cent for HYVs. The cost of
irrigation, seeds and pesticides were significantly higher in hybrid rice production.
Cost of irrigation was calculated 12.17 per cent of total cost in hybrid rice while, it
was 10.62 for inbred (HYVs) rice. Pesticides use was significantly higher (1.54%)
over 1.50 per cent for inbred rice. Pesticides use was significant for hybrid rice
indicating that hybrid rice varieties did not adequate resistant to pest and diseases
and are more susceptible to pests and diseases.
Table No. 5.4: Comparison of Costs and Returns for Hybrid and Inbred Rice (2009-10) (Rs./ha)
Hybrid Adopters Non-adopters Sl. No.
Particulars Hybrid HYVs HYVs
A. Costs: 1. Seed (both farm produced and purchased) 3264.96 813.15 821.37 2. Manure (owned and purchased) 675.06 450.09 475.04 3. Chemical fertilisers 2972.0 2640.16 2655.98 4. Insecticides & Pesticides 350.12 225.18 296.29 5. Irrigation charges (both owned and hired) 2785.05 2050.07 2060.14 6. Machinery charges 5690.16 4685.06 4640.18 7. Hired human labour charges 6465.19 6055.22 6050.29 8. Bullock labour (owned and hired) 656.25 408.36 472.50 9. Total cost (1 to 8) 22858.79 17327.29 17471.79 10. Unit cost of production (Rs. Per Kg.) 3.63 4.38 4.40 B. Returns: 1. Yield of paddy (qtl/ha) 62.88 39.55 39.68 2. Market price (Rs./qtl) 1240.00 1215.00 1213.00 3. Value of grain yield (Rs./ha) 77971.20 48053.25 48131.84 4. Value of straw yield (qtl/ha) 5026.58 8670.29 8316.35 5. Total value of the produce (gross return) 82997.78 56723.54 56448.19 6. Net return (5 – 9) 60138.94 39396.25 38976.40 7. Benefit cost ratio: 1:3.63 1:3.27 1:3.23
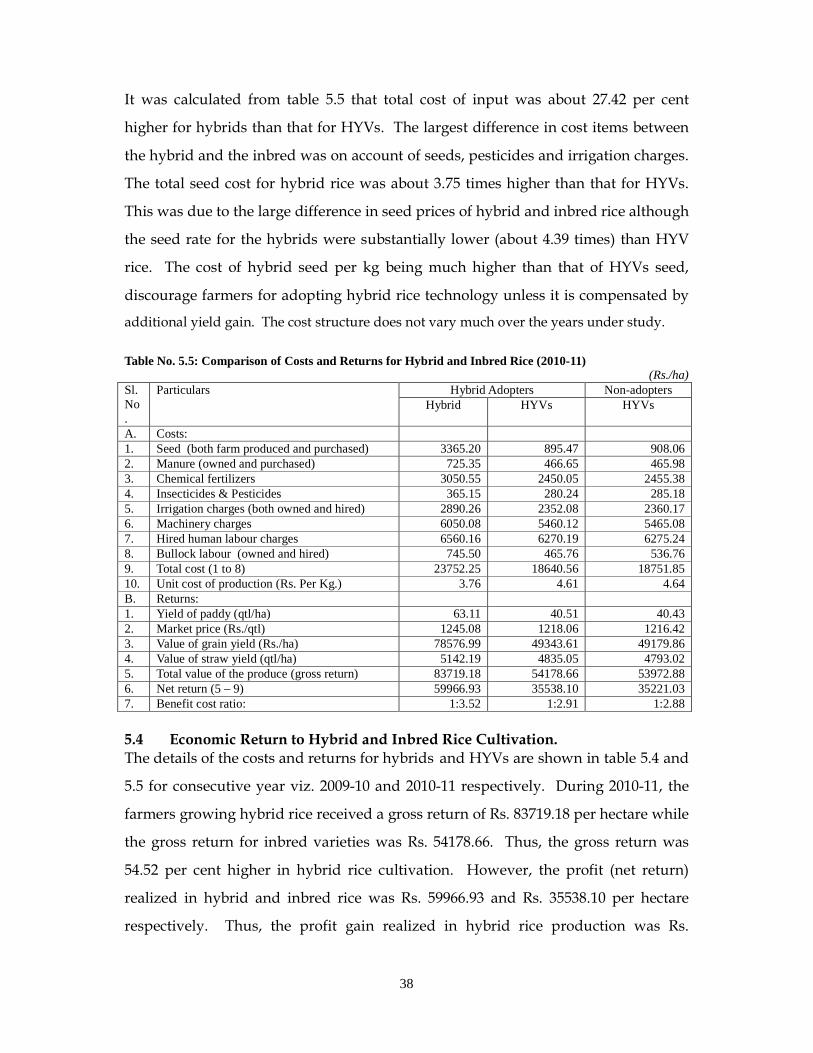
38
It was calculated from table 5.5 that total cost of input was about 27.42 per cent
higher for hybrids than that for HYVs. The largest difference in cost items between
the hybrid and the inbred was on account of seeds, pesticides and irrigation charges.
The total seed cost for hybrid rice was about 3.75 times higher than that for HYVs.
This was due to the large difference in seed prices of hybrid and inbred rice although
the seed rate for the hybrids were substantially lower (about 4.39 times) than HYV
rice. The cost of hybrid seed per kg being much higher than that of HYVs seed,
discourage farmers for adopting hybrid rice technology unless it is compensated by
additional yield gain. The cost structure does not vary much over the years under study.
Table No. 5.5: Comparison of Costs and Returns for Hybrid and Inbred Rice (2010-11)
(Rs./ha) Hybrid Adopters Non-adopters Sl.
No.
Particulars Hybrid HYVs HYVs
A. Costs: 1. Seed (both farm produced and purchased) 3365.20 895.47 908.06 2. Manure (owned and purchased) 725.35 466.65 465.98 3. Chemical fertilizers 3050.55 2450.05 2455.38 4. Insecticides & Pesticides 365.15 280.24 285.18 5. Irrigation charges (both owned and hired) 2890.26 2352.08 2360.17 6. Machinery charges 6050.08 5460.12 5465.08 7. Hired human labour charges 6560.16 6270.19 6275.24 8. Bullock labour (owned and hired) 745.50 465.76 536.76 9. Total cost (1 to 8) 23752.25 18640.56 18751.85 10. Unit cost of production (Rs. Per Kg.) 3.76 4.61 4.64 B. Returns: 1. Yield of paddy (qtl/ha) 63.11 40.51 40.43 2. Market price (Rs./qtl) 1245.08 1218.06 1216.42 3. Value of grain yield (Rs./ha) 78576.99 49343.61 49179.86 4. Value of straw yield (qtl/ha) 5142.19 4835.05 4793.02 5. Total value of the produce (gross return) 83719.18 54178.66 53972.88 6. Net return (5 – 9) 59966.93 35538.10 35221.03 7. Benefit cost ratio: 1:3.52 1:2.91 1:2.88 5.4 Economic Return to Hybrid and Inbred Rice Cultivation. The details of the costs and returns for hybrids and HYVs are shown in table 5.4 and
5.5 for consecutive year viz. 2009-10 and 2010-11 respectively. During 2010-11, the
farmers growing hybrid rice received a gross return of Rs. 83719.18 per hectare while
the gross return for inbred varieties was Rs. 54178.66. Thus, the gross return was
54.52 per cent higher in hybrid rice cultivation. However, the profit (net return)
realized in hybrid and inbred rice was Rs. 59966.93 and Rs. 35538.10 per hectare
respectively. Thus, the profit gain realized in hybrid rice production was Rs.
39
24428.83 per hectare or 68.74 per cent over inbred varieties of rice. Consequently the
benefit cost ratio was also higher in hybrid rice cultivation (3.52:1). Now, net return
from hybrids over the reference periods has merely decreased from Rs. 60138.94 per
hectare in 2009-10 to Rs. 59966.93 per hectare in 2010-11 accounting for 0.28 per cent
decreased in 2010-11. Also for inbred rice, the net return decreased from Rs.
39396.25 per hectare in 2009-10 to Rs. 35538.10 per hectare in 2010-11 accounting for
9.97 per cent decreased. The net result has been decreased in benefit cost ratio for
hybrid rice cultivation from 3.63:1 in 2009-10 to 3.52:1 in 2010-11. Correspondingly,
there has been decline in benefit cost ratio for inbred rice from 3.27:1 in 2009-10 to
2.91:1 during the same period of time. It is important to say that some active factors
that accounted for the higher profit margin in case of hybrid rice cultivation. Of
course, the higher profit margin in hybrid rice cultivation is a matter of concern since
the adoption of a new technology depends much on profitability. It can be seen from
table 5.3B; hybrid rice growers incurred additional costs for all the inputs with
higher productivity.
Hybrid rice growers incurred an additional expenditure of Rs. 2469.73 per hectare on
seed alone. Similarly hybrid rice growers incurred higher expenditure on labour
including hired human labour and bullock labour (569.71) per hectare for
performing various cultural operations. More expenditure on fertilizer (Rs. 600.50),
irrigation (Rs. 538.18), and pesticides (Rs. 84.91) also contributed to pushing up the
cost of production of hybrid rice. Coupling with higher production cost was higher
market price realization for hybrid paddy. On an average, during the year 2010-11
the hybrid rice growing farmers realized a sale price of Rs. 1245.08 per quintal of
paddy sold in the market which was higher by Rs. 27.02 per quintal realized for
inbred rice. The cost price difference was quite sharp during 2009-10 and during
same period of time, market price per quintal of hybrid rice was higher by Rs. 25.00
compared with inbred rice. During the year 2010-11, hybrid rice was Rs. 24428.83
more profitable accounting for 68.74 per cent than HYVs, while in 2009-10, the net
return (profit) realized in hybrid rice cultivation was higher Rs. 20742.69 per hectare
as compared to HYVs.
40
Higher costs of production along with higher market price have contributed to
higher profit margin of hybrid rice cultivation to HYVs even with higher grain yield
acquired (obtained) of 55.79 per cent for hybrid rice over inbred rice varieties. This
is fact that there is need for improved technology to reduce costs of cultivation and
enhancing the quality attributes of hybrid rice.
CHAPTER – VI
GRAIN QUALITY CONSIDERATION AND THE ASPECT OF MARKE TING
Rice is always used as most important food item; therefore, cooking and eating
quality traits assume special significance. For consumer acceptance, it is essential
that the hybrids developed have good quality characteristics apart from high yield
potential. About 80-85 per cent of sample farmers who both produce and consume
hybrid rice reported that the grain of hybrid rice was inferior to that of the popular
inbred rices in terms of cooking and storage quality and more sickness of cooked
rice. Therefore, acceptance of hybrids by consumers in primarily determined by
cooking and eating quality characteristics. The price for volume of marketing for
farmer’s produce is also determined by quality traits. The present chapter deals with
the grain quality consideration and the different aspect of marketing including
output and sale of paddy, and seasonal flow of sale of unhusked and husked rice of
hybrid and inbred rice by the adopter and non-adopter of improved technology of rice.
6.1 Grain Quality Traits of Hybrid and HYV Rice A sensitivity analysis was done to assess the minimum required yield gain under
various scenarios in order to attract the farmers and make hybrid rice cultivation
commercially viable. A frequently raised concern on the prospects of large scale
adoption of hybrid rice is the acceptability of the quality of hybrid rice grain among
consumers. Consumer acceptance is the ultimate factor that determines the price of
the product which ultimately affects the gross revenues particularly of those who
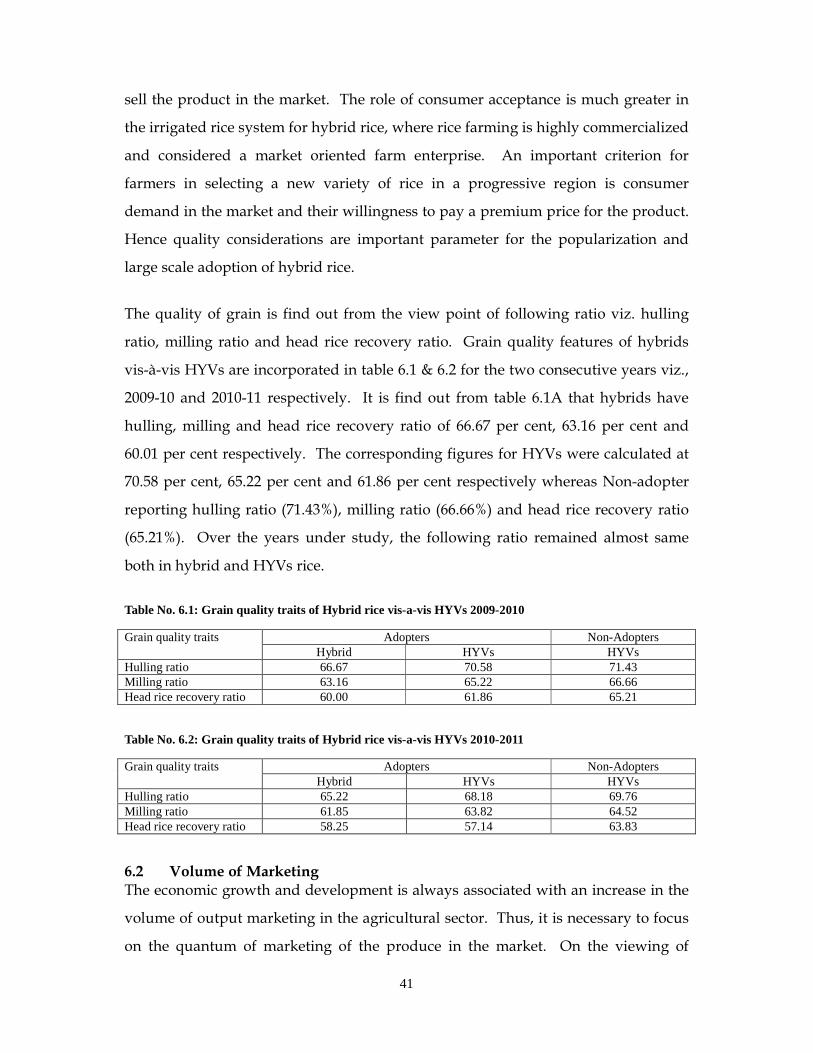
41
sell the product in the market. The role of consumer acceptance is much greater in
the irrigated rice system for hybrid rice, where rice farming is highly commercialized
and considered a market oriented farm enterprise. An important criterion for
farmers in selecting a new variety of rice in a progressive region is consumer
demand in the market and their willingness to pay a premium price for the product.
Hence quality considerations are important parameter for the popularization and
large scale adoption of hybrid rice.
The quality of grain is find out from the view point of following ratio viz. hulling
ratio, milling ratio and head rice recovery ratio. Grain quality features of hybrids
vis-à-vis HYVs are incorporated in table 6.1 & 6.2 for the two consecutive years viz.,
2009-10 and 2010-11 respectively. It is find out from table 6.1A that hybrids have
hulling, milling and head rice recovery ratio of 66.67 per cent, 63.16 per cent and
60.01 per cent respectively. The corresponding figures for HYVs were calculated at
70.58 per cent, 65.22 per cent and 61.86 per cent respectively whereas Non-adopter
reporting hulling ratio (71.43%), milling ratio (66.66%) and head rice recovery ratio
(65.21%). Over the years under study, the following ratio remained almost same
both in hybrid and HYVs rice.
Table No. 6.1: Grain quality traits of Hybrid rice vis-a-vis HYVs 2009-2010
Adopters Non-Adopters Grain quality traits Hybrid HYVs HYVs
Hulling ratio 66.67 70.58 71.43 Milling ratio 63.16 65.22 66.66 Head rice recovery ratio 60.00 61.86 65.21
Table No. 6.2: Grain quality traits of Hybrid rice vis-a-vis HYVs 2010-2011
Adopters Non-Adopters Grain quality traits Hybrid HYVs HYVs
Hulling ratio 65.22 68.18 69.76 Milling ratio 61.85 63.82 64.52 Head rice recovery ratio 58.25 57.14 63.83
6.2 Volume of Marketing The economic growth and development is always associated with an increase in the
volume of output marketing in the agricultural sector. Thus, it is necessary to focus
on the quantum of marketing of the produce in the market. On the viewing of
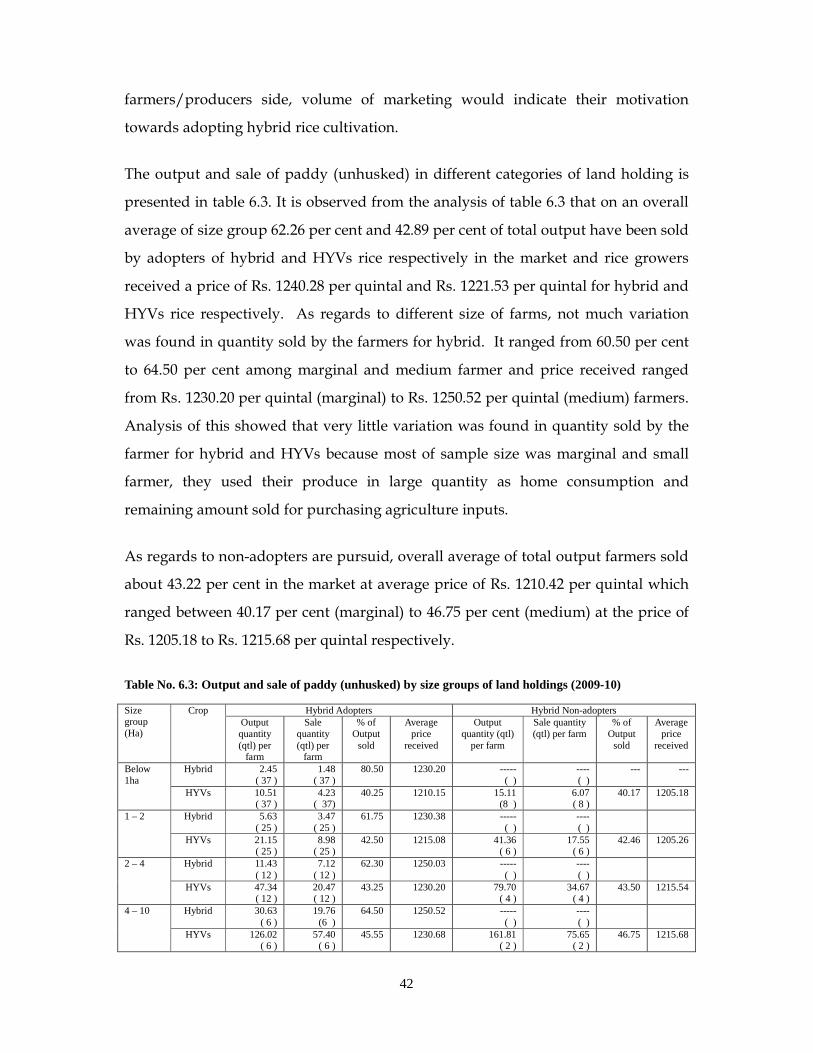
42
farmers/producers side, volume of marketing would indicate their motivation
towards adopting hybrid rice cultivation.
The output and sale of paddy (unhusked) in different categories of land holding is
presented in table 6.3. It is observed from the analysis of table 6.3 that on an overall
average of size group 62.26 per cent and 42.89 per cent of total output have been sold
by adopters of hybrid and HYVs rice respectively in the market and rice growers
received a price of Rs. 1240.28 per quintal and Rs. 1221.53 per quintal for hybrid and
HYVs rice respectively. As regards to different size of farms, not much variation
was found in quantity sold by the farmers for hybrid. It ranged from 60.50 per cent
to 64.50 per cent among marginal and medium farmer and price received ranged
from Rs. 1230.20 per quintal (marginal) to Rs. 1250.52 per quintal (medium) farmers.
Analysis of this showed that very little variation was found in quantity sold by the
farmer for hybrid and HYVs because most of sample size was marginal and small
farmer, they used their produce in large quantity as home consumption and
remaining amount sold for purchasing agriculture inputs.
As regards to non-adopters are pursuid, overall average of total output farmers sold
about 43.22 per cent in the market at average price of Rs. 1210.42 per quintal which
ranged between 40.17 per cent (marginal) to 46.75 per cent (medium) at the price of
Rs. 1205.18 to Rs. 1215.68 per quintal respectively.
Table No. 6.3: Output and sale of paddy (unhusked) by size groups of land holdings (2009-10)
Hybrid Adopters Hybrid Non-adopters Size group (Ha)
Crop Output quantity (qtl) per
farm
Sale quantity (qtl) per
farm
% of Output
sold
Average price
received
Output quantity (qtl)
per farm
Sale quantity (qtl) per farm
% of Output
sold
Average price
received
Hybrid
2.45 ( 37 )
1.48 ( 37 )
80.50 1230.20 ----- ( )
---- ( )
--- --- Below 1ha
HYVs 10.51 ( 37 )
4.23 ( 37)
40.25 1210.15 15.11 (8 )
6.07 ( 8 )
40.17 1205.18
Hybrid
5.63 ( 25 )
3.47 ( 25 )
61.75 1230.38 ----- ( )
---- ( )
1 – 2
HYVs 21.15 ( 25 )
8.98 ( 25 )
42.50 1215.08 41.36 ( 6 )
17.55 ( 6 )
42.46 1205.26
Hybrid
11.43 ( 12 )
7.12 ( 12 )
62.30 1250.03 ----- ( )
---- ( )
2 – 4
HYVs 47.34 ( 12 )
20.47 ( 12 )
43.25 1230.20 79.70 ( 4 )
34.67 ( 4 )
43.50 1215.54
Hybrid
30.63 ( 6 )
19.76 (6 )
64.50 1250.52 ----- ( )
---- ( )
4 – 10
HYVs 126.02 ( 6 )
57.40 ( 6 )
45.55 1230.68 161.81 ( 2 )
75.65 ( 2 )
46.75 1215.68
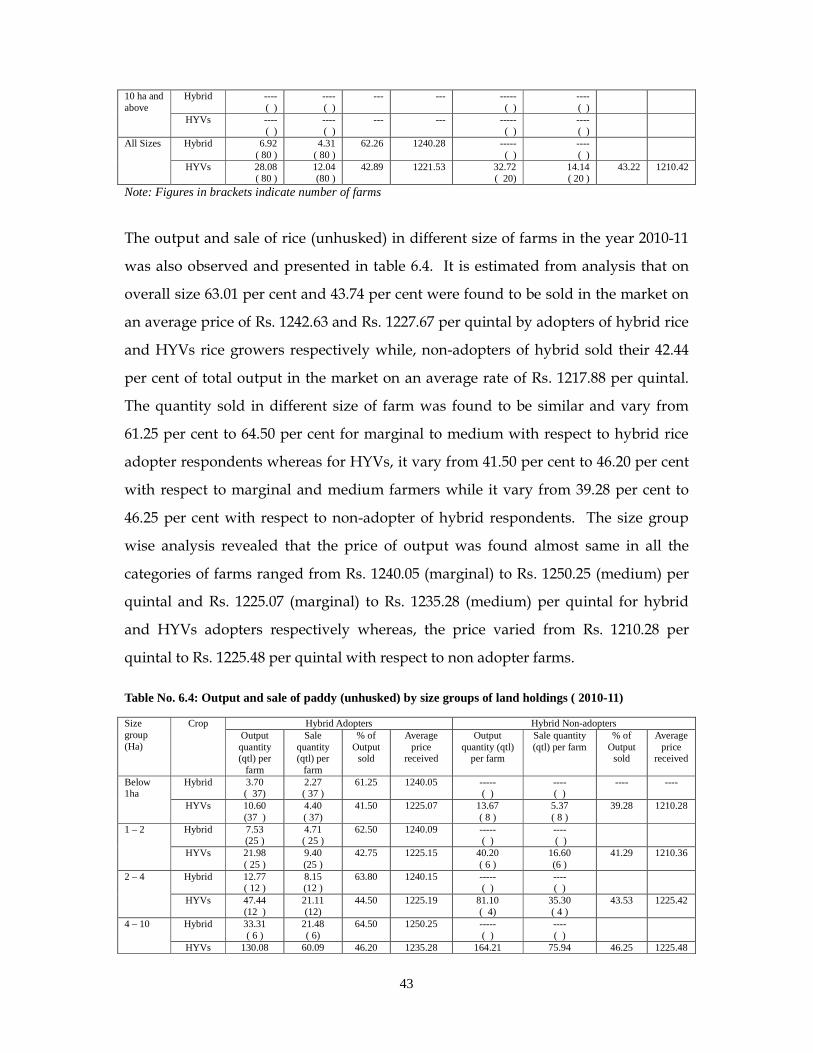
43
Hybrid
---- ( )
---- ( )
--- --- ----- ( )
---- ( )
10 ha and above
HYVs ---- ( )
---- ( )
--- --- ----- ( )
---- ( )
Hybrid
6.92 ( 80 )
4.31 ( 80 )
62.26 1240.28 ----- ( )
---- ( )
All Sizes
HYVs 28.08 ( 80 )
12.04 (80 )
42.89 1221.53 32.72 ( 20)
14.14 ( 20 )
43.22 1210.42
Note: Figures in brackets indicate number of farms
The output and sale of rice (unhusked) in different size of farms in the year 2010-11
was also observed and presented in table 6.4. It is estimated from analysis that on
overall size 63.01 per cent and 43.74 per cent were found to be sold in the market on
an average price of Rs. 1242.63 and Rs. 1227.67 per quintal by adopters of hybrid rice
and HYVs rice growers respectively while, non-adopters of hybrid sold their 42.44
per cent of total output in the market on an average rate of Rs. 1217.88 per quintal.
The quantity sold in different size of farm was found to be similar and vary from
61.25 per cent to 64.50 per cent for marginal to medium with respect to hybrid rice
adopter respondents whereas for HYVs, it vary from 41.50 per cent to 46.20 per cent
with respect to marginal and medium farmers while it vary from 39.28 per cent to
46.25 per cent with respect to non-adopter of hybrid respondents. The size group
wise analysis revealed that the price of output was found almost same in all the
categories of farms ranged from Rs. 1240.05 (marginal) to Rs. 1250.25 (medium) per
quintal and Rs. 1225.07 (marginal) to Rs. 1235.28 (medium) per quintal for hybrid
and HYVs adopters respectively whereas, the price varied from Rs. 1210.28 per
quintal to Rs. 1225.48 per quintal with respect to non adopter farms.
Table No. 6.4: Output and sale of paddy (unhusked) by size groups of land holdings ( 2010-11)
Hybrid Adopters Hybrid Non-adopters Size group (Ha)
Crop Output quantity (qtl) per
farm
Sale quantity (qtl) per
farm
% of Output
sold
Average price
received
Output quantity (qtl)
per farm
Sale quantity (qtl) per farm
% of Output
sold
Average price
received
Hybrid
3.70 ( 37)
2.27 ( 37 )
61.25 1240.05 ----- ( )
---- ( )
---- ---- Below 1ha
HYVs 10.60 (37 )
4.40 ( 37)
41.50 1225.07 13.67 ( 8 )
5.37 ( 8 )
39.28 1210.28
Hybrid
7.53 (25 )
4.71 ( 25 )
62.50 1240.09 ----- ( )
---- ( )
1 – 2
HYVs 21.98 ( 25 )
9.40 (25 )
42.75 1225.15 40.20 ( 6 )
16.60 (6 )
41.29 1210.36
Hybrid
12.77 ( 12 )
8.15 (12 )
63.80 1240.15 ----- ( )
---- ( )
2 – 4
HYVs 47.44 (12 )
21.11 (12)
44.50 1225.19 81.10 ( 4)
35.30 ( 4 )
43.53 1225.42
Hybrid
33.31 ( 6 )
21.48 ( 6)
64.50 1250.25 ----- ( )
---- ( )
4 – 10
HYVs 130.08 60.09 46.20 1235.28 164.21 75.94 46.25 1225.48
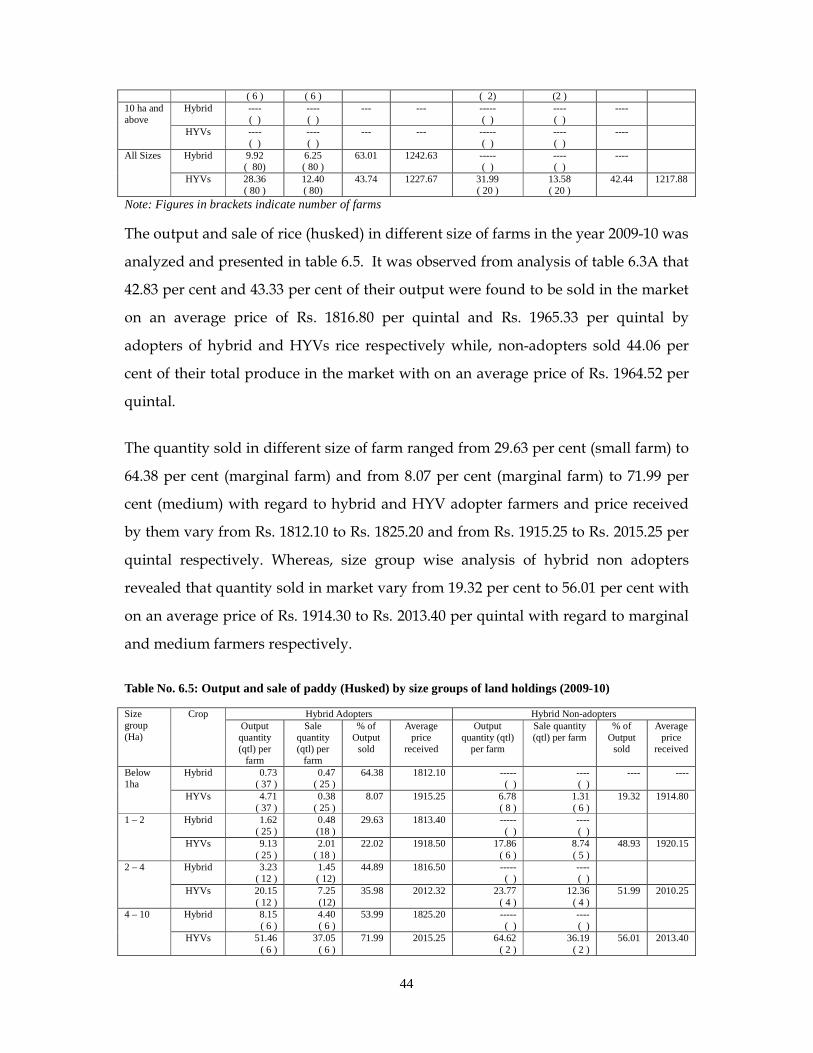
44
( 6 ) ( 6 ) ( 2) (2 ) Hybrid
---- ( )
---- ( )
--- --- ----- ( )
---- ( )
---- 10 ha and above
HYVs ---- ( )
---- ( )
--- --- ----- ( )
---- ( )
----
Hybrid
9.92 ( 80)
6.25 ( 80 )
63.01 1242.63 ----- ( )
---- ( )
---- All Sizes
HYVs 28.36 ( 80 )
12.40 ( 80)
43.74 1227.67 31.99 ( 20 )
13.58 ( 20 )
42.44 1217.88
Note: Figures in brackets indicate number of farms
The output and sale of rice (husked) in different size of farms in the year 2009-10 was
analyzed and presented in table 6.5. It was observed from analysis of table 6.3A that
42.83 per cent and 43.33 per cent of their output were found to be sold in the market
on an average price of Rs. 1816.80 per quintal and Rs. 1965.33 per quintal by
adopters of hybrid and HYVs rice respectively while, non-adopters sold 44.06 per
cent of their total produce in the market with on an average price of Rs. 1964.52 per
quintal.
The quantity sold in different size of farm ranged from 29.63 per cent (small farm) to
64.38 per cent (marginal farm) and from 8.07 per cent (marginal farm) to 71.99 per
cent (medium) with regard to hybrid and HYV adopter farmers and price received
by them vary from Rs. 1812.10 to Rs. 1825.20 and from Rs. 1915.25 to Rs. 2015.25 per
quintal respectively. Whereas, size group wise analysis of hybrid non adopters
revealed that quantity sold in market vary from 19.32 per cent to 56.01 per cent with
on an average price of Rs. 1914.30 to Rs. 2013.40 per quintal with regard to marginal
and medium farmers respectively.
Table No. 6.5: Output and sale of paddy (Husked) by size groups of land holdings (2009-10)
Hybrid Adopters Hybrid Non-adopters Size group (Ha)
Crop Output quantity (qtl) per
farm
Sale quantity (qtl) per
farm
% of Output
sold
Average price
received
Output quantity (qtl)
per farm
Sale quantity (qtl) per farm
% of Output
sold
Average price
received
Hybrid
0.73 ( 37 )
0.47 ( 25 )
64.38 1812.10 ----- ( )
---- ( )
---- ---- Below 1ha
HYVs 4.71 ( 37 )
0.38 ( 25 )
8.07 1915.25 6.78 ( 8 )
1.31 ( 6 )
19.32 1914.80
Hybrid
1.62 ( 25 )
0.48 (18 )
29.63 1813.40 ----- ( )
---- ( )
1 – 2
HYVs 9.13 ( 25 )
2.01 ( 18 )
22.02 1918.50 17.86 ( 6 )
8.74 ( 5 )
48.93 1920.15
Hybrid
3.23 ( 12 )
1.45 ( 12)
44.89 1816.50 ----- ( )
---- ( )
2 – 4
HYVs 20.15 ( 12 )
7.25 (12)
35.98 2012.32 23.77 ( 4 )
12.36 ( 4 )
51.99 2010.25
Hybrid
8.15 ( 6 )
4.40 ( 6 )
53.99 1825.20 ----- ( )
---- ( )
4 – 10
HYVs 51.46 ( 6 )
37.05 ( 6 )
71.99 2015.25 64.62 ( 2 )
36.19 ( 2 )
56.01 2013.40
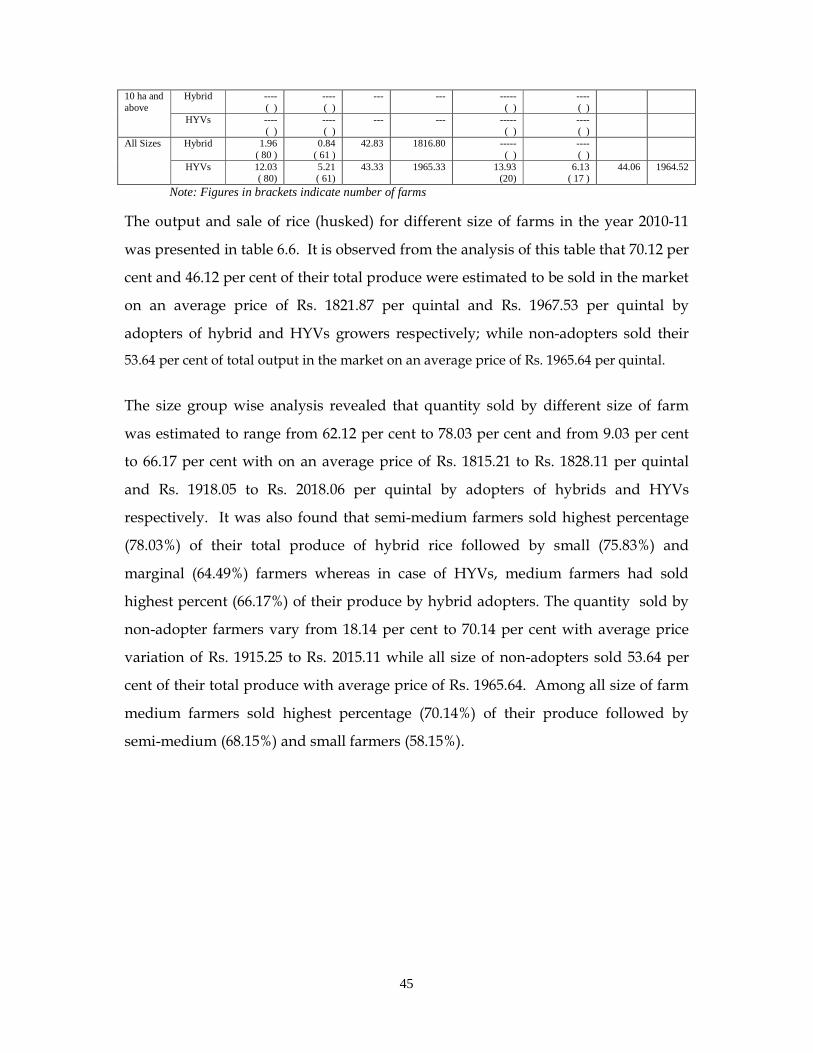
45
Hybrid
---- ( )
---- ( )
--- --- ----- ( )
---- ( )
10 ha and above
HYVs ---- ( )
---- ( )
--- --- ----- ( )
---- ( )
Hybrid
1.96 ( 80 )
0.84 ( 61 )
42.83 1816.80 ----- ( )
---- ( )
All Sizes
HYVs 12.03 ( 80)
5.21 ( 61)
43.33 1965.33 13.93 (20)
6.13 ( 17 )
44.06 1964.52
Note: Figures in brackets indicate number of farms
The output and sale of rice (husked) for different size of farms in the year 2010-11
was presented in table 6.6. It is observed from the analysis of this table that 70.12 per
cent and 46.12 per cent of their total produce were estimated to be sold in the market
on an average price of Rs. 1821.87 per quintal and Rs. 1967.53 per quintal by
adopters of hybrid and HYVs growers respectively; while non-adopters sold their
53.64 per cent of total output in the market on an average price of Rs. 1965.64 per quintal.
The size group wise analysis revealed that quantity sold by different size of farm
was estimated to range from 62.12 per cent to 78.03 per cent and from 9.03 per cent
to 66.17 per cent with on an average price of Rs. 1815.21 to Rs. 1828.11 per quintal
and Rs. 1918.05 to Rs. 2018.06 per quintal by adopters of hybrids and HYVs
respectively. It was also found that semi-medium farmers sold highest percentage
(78.03%) of their total produce of hybrid rice followed by small (75.83%) and
marginal (64.49%) farmers whereas in case of HYVs, medium farmers had sold
highest percent (66.17%) of their produce by hybrid adopters. The quantity sold by
non-adopter farmers vary from 18.14 per cent to 70.14 per cent with average price
variation of Rs. 1915.25 to Rs. 2015.11 while all size of non-adopters sold 53.64 per
cent of their total produce with average price of Rs. 1965.64. Among all size of farm
medium farmers sold highest percentage (70.14%) of their produce followed by
semi-medium (68.15%) and small farmers (58.15%).
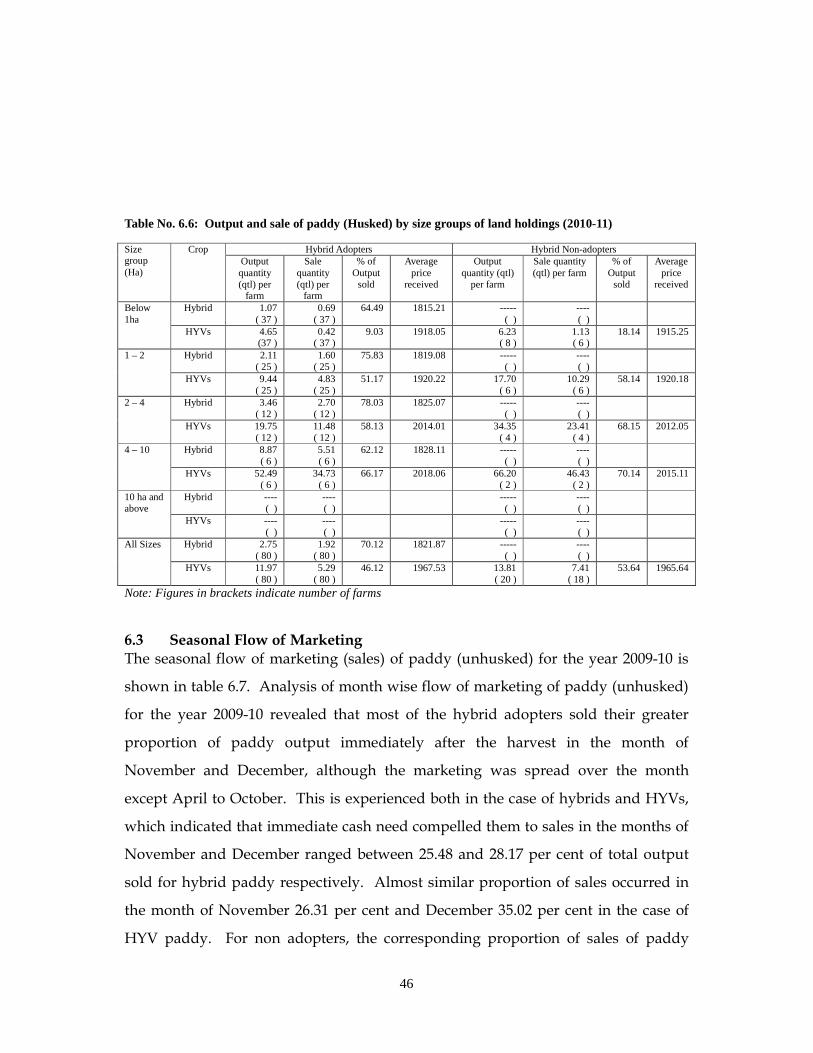
46
Table No. 6.6: Output and sale of paddy (Husked) by size groups of land holdings (2010-11)
Hybrid Adopters Hybrid Non-adopters Size group (Ha)
Crop Output quantity (qtl) per
farm
Sale quantity (qtl) per
farm
% of Output
sold
Average price
received
Output quantity (qtl)
per farm
Sale quantity (qtl) per farm
% of Output
sold
Average price
received
Hybrid
1.07 ( 37 )
0.69 ( 37 )
64.49 1815.21 ----- ( )
---- ( )
Below 1ha
HYVs 4.65 (37 )
0.42 ( 37 )
9.03 1918.05 6.23 ( 8 )
1.13 ( 6 )
18.14 1915.25
Hybrid
2.11 ( 25 )
1.60 ( 25 )
75.83 1819.08 ----- ( )
---- ( )
1 – 2
HYVs 9.44 ( 25 )
4.83 ( 25 )
51.17 1920.22 17.70 ( 6 )
10.29 ( 6 )
58.14 1920.18
Hybrid
3.46 ( 12 )
2.70 ( 12 )
78.03 1825.07 ----- ( )
---- ( )
2 – 4
HYVs 19.75 ( 12 )
11.48 ( 12 )
58.13 2014.01 34.35 ( 4 )
23.41 ( 4 )
68.15 2012.05
Hybrid
8.87 ( 6 )
5.51 ( 6 )
62.12 1828.11 ----- ( )
---- ( )
4 – 10
HYVs 52.49 ( 6 )
34.73 ( 6 )
66.17 2018.06 66.20 ( 2 )
46.43 ( 2 )
70.14 2015.11
Hybrid
---- ( )
---- ( )
----- ( )
---- ( )
10 ha and above
HYVs ---- ( )
---- ( )
----- ( )
---- ( )
Hybrid
2.75 ( 80 )
1.92 ( 80 )
70.12 1821.87 ----- ( )
---- ( )
All Sizes
HYVs 11.97 ( 80 )
5.29 ( 80 )
46.12 1967.53 13.81 ( 20 )
7.41 ( 18 )
53.64 1965.64
Note: Figures in brackets indicate number of farms
6.3 Seasonal Flow of Marketing The seasonal flow of marketing (sales) of paddy (unhusked) for the year 2009-10 is
shown in table 6.7. Analysis of month wise flow of marketing of paddy (unhusked)
for the year 2009-10 revealed that most of the hybrid adopters sold their greater
proportion of paddy output immediately after the harvest in the month of
November and December, although the marketing was spread over the month
except April to October. This is experienced both in the case of hybrids and HYVs,
which indicated that immediate cash need compelled them to sales in the months of
November and December ranged between 25.48 and 28.17 per cent of total output
sold for hybrid paddy respectively. Almost similar proportion of sales occurred in
the month of November 26.31 per cent and December 35.02 per cent in the case of
HYV paddy. For non adopters, the corresponding proportion of sales of paddy
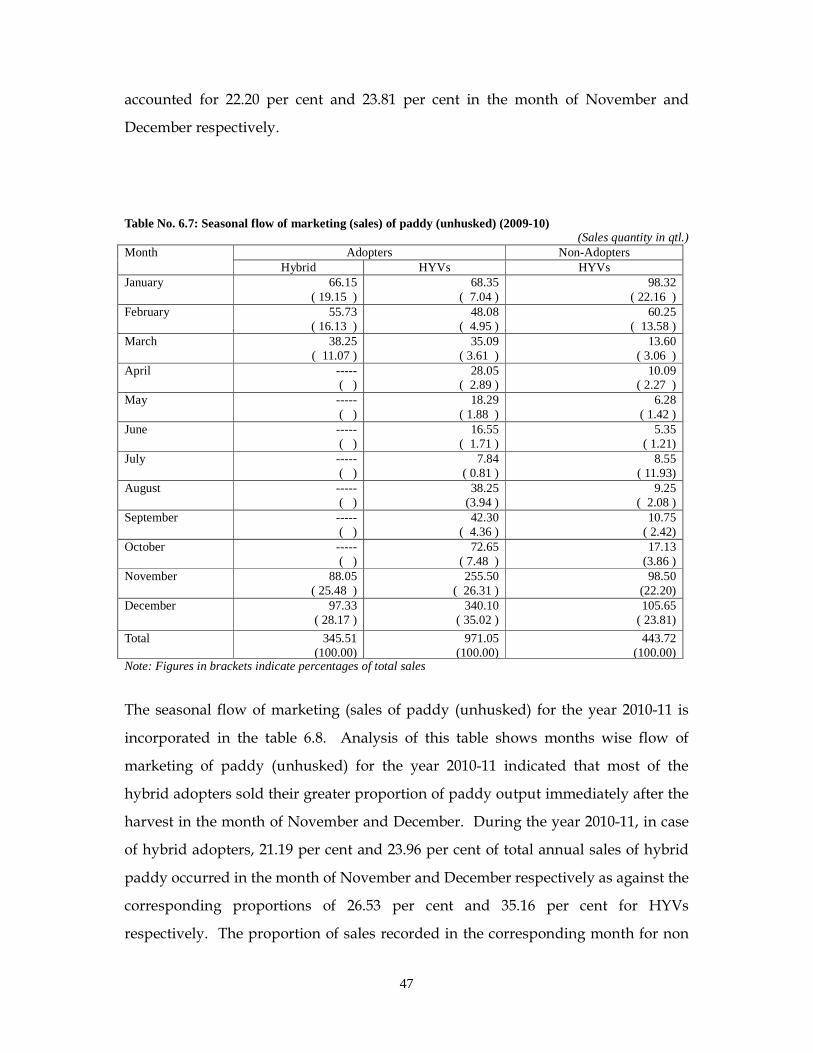
47
accounted for 22.20 per cent and 23.81 per cent in the month of November and
December respectively.
Table No. 6.7: Seasonal flow of marketing (sales) of paddy (unhusked) (2009-10)
(Sales quantity in qtl.) Adopters Non-Adopters Month
Hybrid HYVs HYVs January 66.15
( 19.15 ) 68.35
( 7.04 ) 98.32
( 22.16 ) February 55.73
( 16.13 ) 48.08
( 4.95 ) 60.25
( 13.58 ) March 38.25
( 11.07 ) 35.09
( 3.61 ) 13.60
( 3.06 ) April -----
( ) 28.05
( 2.89 ) 10.09
( 2.27 ) May -----
( ) 18.29
( 1.88 ) 6.28
( 1.42 ) June -----
( ) 16.55
( 1.71 ) 5.35
( 1.21) July -----
( ) 7.84
( 0.81 ) 8.55
( 11.93) August -----
( ) 38.25
(3.94 ) 9.25
( 2.08 ) September -----
( ) 42.30
( 4.36 ) 10.75
( 2.42) October -----
( ) 72.65
( 7.48 ) 17.13
(3.86 ) November 88.05
( 25.48 ) 255.50
( 26.31 ) 98.50
(22.20) December 97.33
( 28.17 ) 340.10
( 35.02 ) 105.65
( 23.81) Total 345.51
(100.00) 971.05
(100.00) 443.72
(100.00) Note: Figures in brackets indicate percentages of total sales
The seasonal flow of marketing (sales of paddy (unhusked) for the year 2010-11 is
incorporated in the table 6.8. Analysis of this table shows months wise flow of
marketing of paddy (unhusked) for the year 2010-11 indicated that most of the
hybrid adopters sold their greater proportion of paddy output immediately after the
harvest in the month of November and December. During the year 2010-11, in case
of hybrid adopters, 21.19 per cent and 23.96 per cent of total annual sales of hybrid
paddy occurred in the month of November and December respectively as against the
corresponding proportions of 26.53 per cent and 35.16 per cent for HYVs
respectively. The proportion of sales recorded in the corresponding month for non
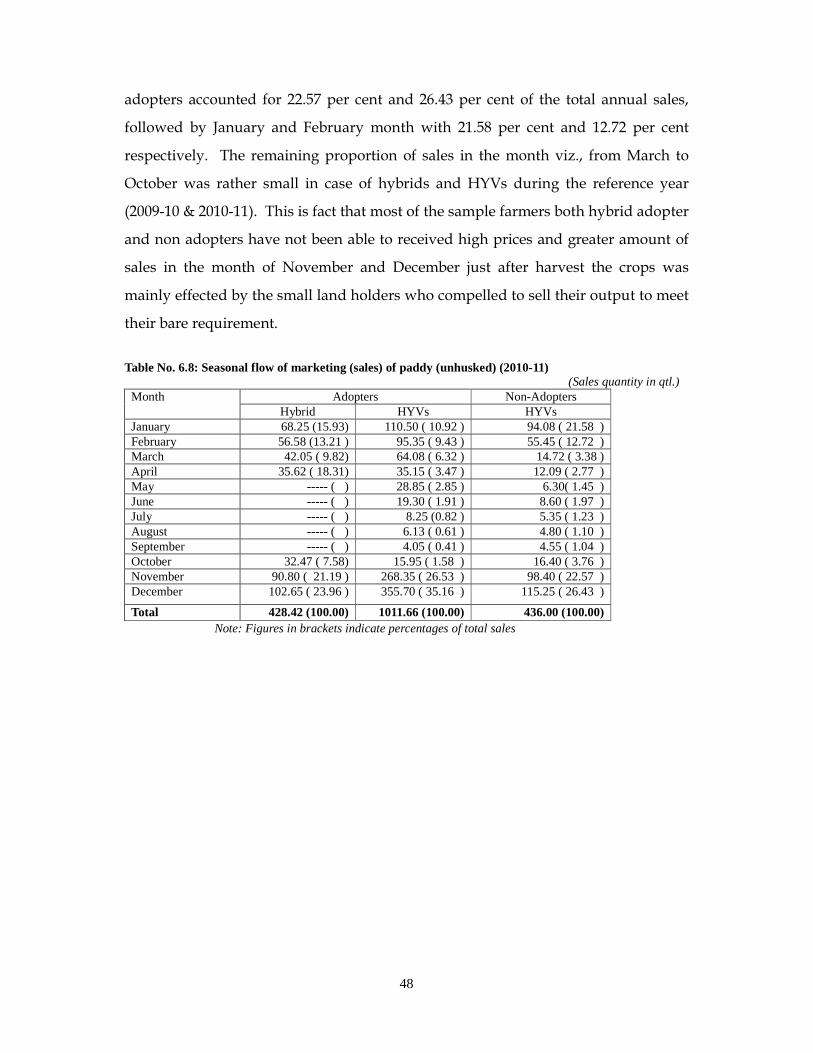
48
adopters accounted for 22.57 per cent and 26.43 per cent of the total annual sales,
followed by January and February month with 21.58 per cent and 12.72 per cent
respectively. The remaining proportion of sales in the month viz., from March to
October was rather small in case of hybrids and HYVs during the reference year
(2009-10 & 2010-11). This is fact that most of the sample farmers both hybrid adopter
and non adopters have not been able to received high prices and greater amount of
sales in the month of November and December just after harvest the crops was
mainly effected by the small land holders who compelled to sell their output to meet
their bare requirement.
Table No. 6.8: Seasonal flow of marketing (sales) of paddy (unhusked) (2010-11) (Sales quantity in qtl.)
Adopters Non-Adopters Month Hybrid HYVs HYVs
January 68.25 (15.93) 110.50 ( 10.92 ) 94.08 ( 21.58 ) February 56.58 (13.21 ) 95.35 ( 9.43 ) 55.45 ( 12.72 ) March 42.05 ( 9.82) 64.08 ( 6.32 ) 14.72 ( 3.38 ) April 35.62 ( 18.31) 35.15 ( 3.47 ) 12.09 ( 2.77 ) May ----- ( ) 28.85 ( 2.85 ) 6.30( 1.45 ) June ----- ( ) 19.30 ( 1.91 ) 8.60 ( 1.97 ) July ----- ( ) 8.25 (0.82 ) 5.35 ( 1.23 ) August ----- ( ) 6.13 ( 0.61 ) 4.80 ( 1.10 ) September ----- ( ) 4.05 ( 0.41 ) 4.55 ( 1.04 ) October 32.47 ( 7.58) 15.95 ( 1.58 ) 16.40 ( 3.76 ) November 90.80 ( 21.19 ) 268.35 ( 26.53 ) 98.40 ( 22.57 ) December 102.65 ( 23.96 ) 355.70 ( 35.16 ) 115.25 ( 26.43 )
Total 428.42 (100.00) 1011.66 (100.00) 436.00 (100.00) Note: Figures in brackets indicate percentages of total sales
49
CHAPTER – VII
PROBLEMS AND PROSPECTS FOR INCREASING HYBRID RICE CULTIVATION
The present chapter deals with the problem and prospects for increasing hybrid rice
cultivation in the study area. To assess farmer’s perception with their own
experience regarding hybrid rice cultivation, farmers responses were collected from
sample hybrid rice growers through personnel interviews with the help of well
scheduled questionnaire. Farmers’ awareness about hybrid rice technology, assess
to input use including fertilizer, pesticide, credit and their overall perception are
considered during course of investigation. An attempt has been made to elicit the
perception of non-participants with regard to reasons for non-adopting of hybrid rice.
7.1 Farmers’ Awareness about Hybrid Rice Technology There has been made an attempt asked to sample hybrid growers’ about awareness
of hybrid rice technology including source of knowledge, frontline demonstration
and training programme organized by government are presented in table 7.1. An
analysis of this table showed that 73.50 per cent of the sample farmers reported
extension worker of the state department of the agriculture as their source of
awareness about hybrid rice technology. Newspaper and other cultivators
considered as other sources were reported to be 12.25 per cent and 14.25 per cent
respectively. Majority of sample farmers (74%) reported that frontline
demonstration programme was organized by the government in order to create
awareness about hybrid rice technology. As regard to their participation in the
demonstration programme, 72.00 of the farmers reported in favour of participation.
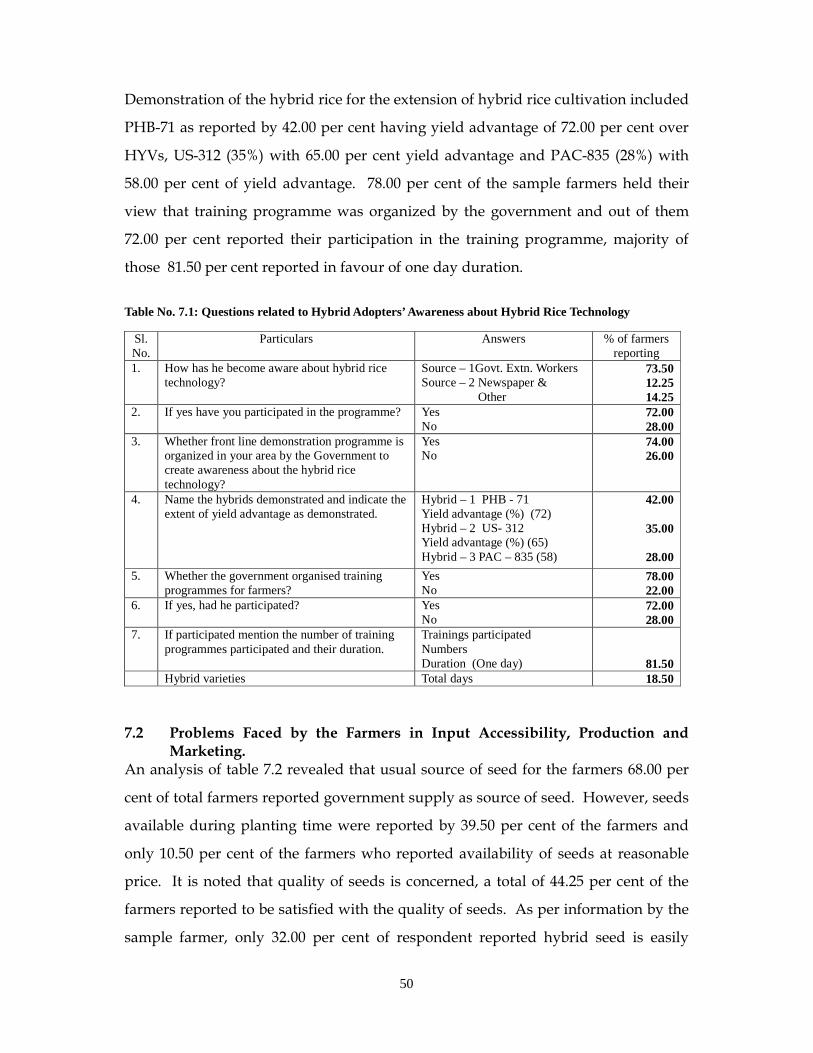
50
Demonstration of the hybrid rice for the extension of hybrid rice cultivation included
PHB-71 as reported by 42.00 per cent having yield advantage of 72.00 per cent over
HYVs, US-312 (35%) with 65.00 per cent yield advantage and PAC-835 (28%) with
58.00 per cent of yield advantage. 78.00 per cent of the sample farmers held their
view that training programme was organized by the government and out of them
72.00 per cent reported their participation in the training programme, majority of
those 81.50 per cent reported in favour of one day duration.
Table No. 7.1: Questions related to Hybrid Adopters’ Awareness about Hybrid Rice Technology
Sl. No.
Particulars Answers % of farmers reporting
1. How has he become aware about hybrid rice technology?
Source – 1Govt. Extn. Workers Source – 2 Newspaper & Other
73.50 12.25 14.25
2. If yes have you participated in the programme? Yes No
72.00 28.00
3. Whether front line demonstration programme is organized in your area by the Government to create awareness about the hybrid rice technology?
Yes No
74.00 26.00
4. Name the hybrids demonstrated and indicate the extent of yield advantage as demonstrated.
Hybrid – 1 PHB - 71 Yield advantage (%) (72) Hybrid – 2 US- 312 Yield advantage (%) (65) Hybrid – 3 PAC – 835 (58)
42.00
35.00
28.00 5. Whether the government organised training
programmes for farmers? Yes No
78.00 22.00
6. If yes, had he participated? Yes No
72.00 28.00
7. If participated mention the number of training programmes participated and their duration.
Trainings participated Numbers Duration (One day)
81.50 Hybrid varieties Total days 18.50
7.2 Problems Faced by the Farmers in Input Accessibility, Production and
Marketing. An analysis of table 7.2 revealed that usual source of seed for the farmers 68.00 per
cent of total farmers reported government supply as source of seed. However, seeds
available during planting time were reported by 39.50 per cent of the farmers and
only 10.50 per cent of the farmers who reported availability of seeds at reasonable
price. It is noted that quality of seeds is concerned, a total of 44.25 per cent of the
farmers reported to be satisfied with the quality of seeds. As per information by the
sample farmer, only 32.00 per cent of respondent reported hybrid seed is easily
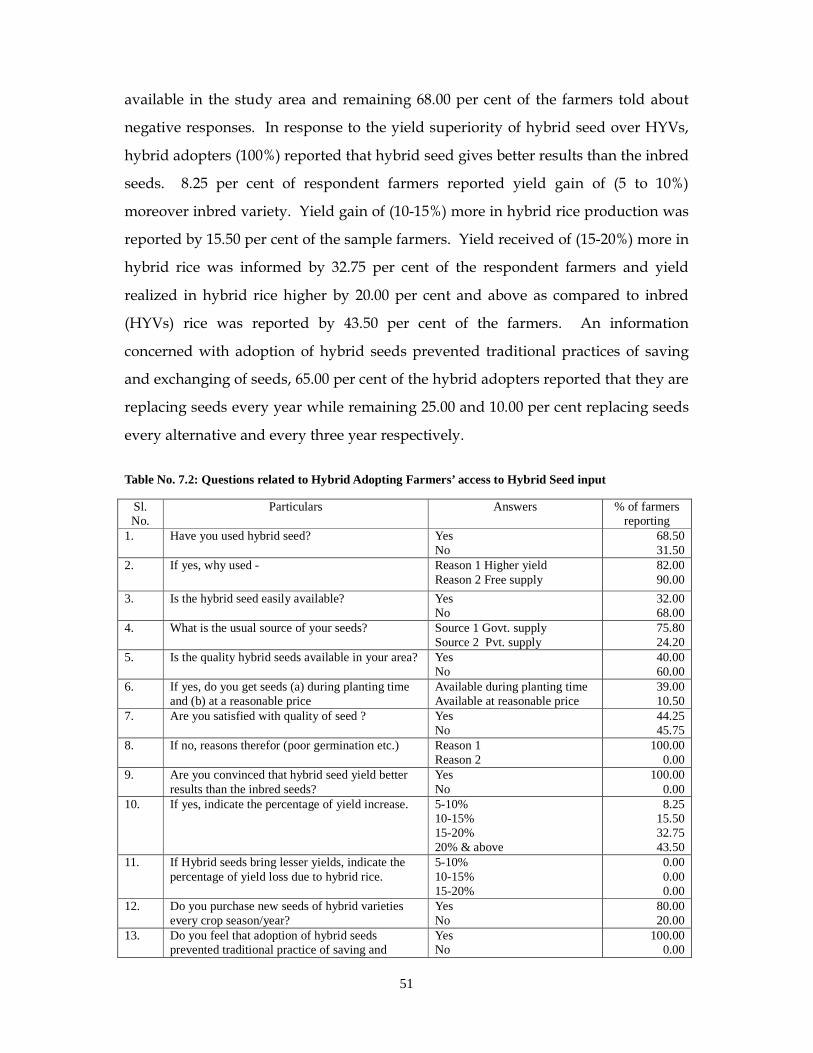
51
available in the study area and remaining 68.00 per cent of the farmers told about
negative responses. In response to the yield superiority of hybrid seed over HYVs,
hybrid adopters (100%) reported that hybrid seed gives better results than the inbred
seeds. 8.25 per cent of respondent farmers reported yield gain of (5 to 10%)
moreover inbred variety. Yield gain of (10-15%) more in hybrid rice production was
reported by 15.50 per cent of the sample farmers. Yield received of (15-20%) more in
hybrid rice was informed by 32.75 per cent of the respondent farmers and yield
realized in hybrid rice higher by 20.00 per cent and above as compared to inbred
(HYVs) rice was reported by 43.50 per cent of the farmers. An information
concerned with adoption of hybrid seeds prevented traditional practices of saving
and exchanging of seeds, 65.00 per cent of the hybrid adopters reported that they are
replacing seeds every year while remaining 25.00 and 10.00 per cent replacing seeds
every alternative and every three year respectively.
Table No. 7.2: Questions related to Hybrid Adopting Farmers’ access to Hybrid Seed input
Sl. No.
Particulars Answers % of farmers reporting
1. Have you used hybrid seed?
Yes No
68.50 31.50
2. If yes, why used -
Reason 1 Higher yield Reason 2 Free supply
82.00 90.00
3. Is the hybrid seed easily available? Yes No
32.00 68.00
4. What is the usual source of your seeds?
Source 1 Govt. supply Source 2 Pvt. supply
75.80 24.20
5. Is the quality hybrid seeds available in your area? Yes No
40.00 60.00
6. If yes, do you get seeds (a) during planting time and (b) at a reasonable price
Available during planting time Available at reasonable price
39.00 10.50
7. Are you satisfied with quality of seed ? Yes No
44.25 45.75
8. If no, reasons therefor (poor germination etc.)
Reason 1 Reason 2
100.00 0.00
9. Are you convinced that hybrid seed yield better results than the inbred seeds?
Yes No
100.00 0.00
10. If yes, indicate the percentage of yield increase.
5-10% 10-15% 15-20% 20% & above
8.25 15.50 32.75 43.50
11. If Hybrid seeds bring lesser yields, indicate the percentage of yield loss due to hybrid rice.
5-10% 10-15% 15-20%
0.00 0.00 0.00
12. Do you purchase new seeds of hybrid varieties every crop season/year?
Yes No
80.00 20.00
13. Do you feel that adoption of hybrid seeds prevented traditional practice of saving and
Yes No
100.00 0.00
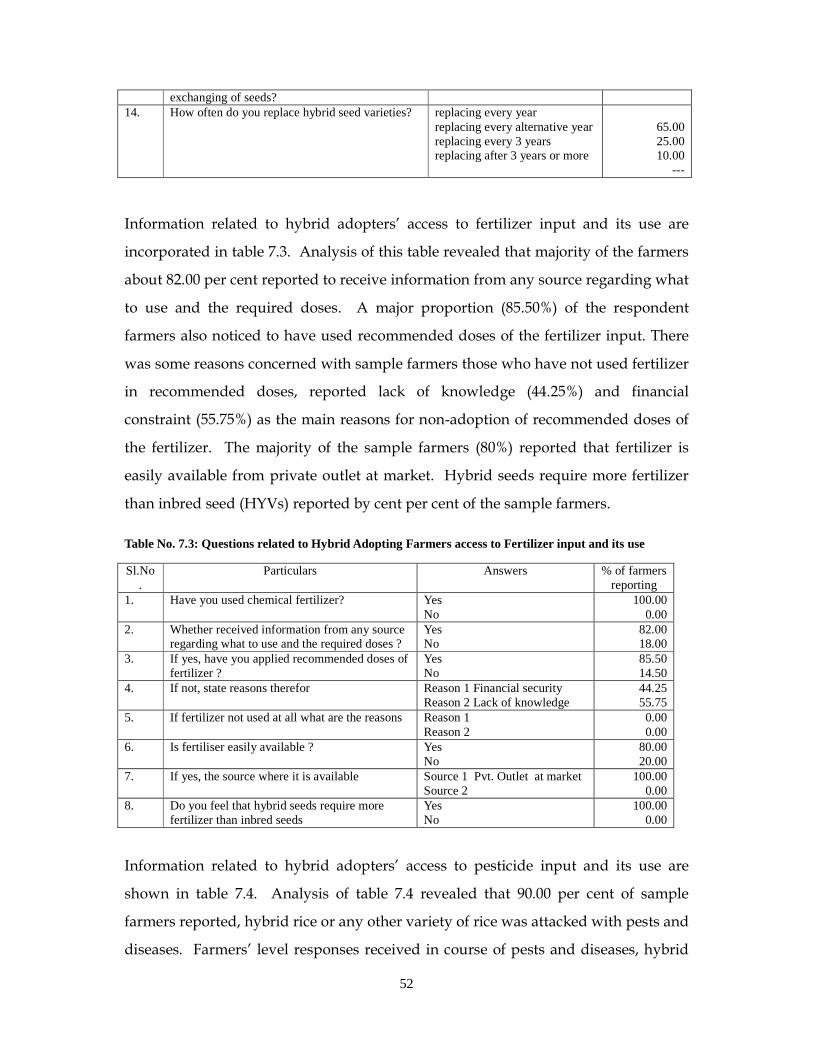
52
exchanging of seeds? 14. How often do you replace hybrid seed varieties?
replacing every year replacing every alternative year replacing every 3 years replacing after 3 years or more
65.00 25.00 10.00
--- Information related to hybrid adopters’ access to fertilizer input and its use are
incorporated in table 7.3. Analysis of this table revealed that majority of the farmers
about 82.00 per cent reported to receive information from any source regarding what
to use and the required doses. A major proportion (85.50%) of the respondent
farmers also noticed to have used recommended doses of the fertilizer input. There
was some reasons concerned with sample farmers those who have not used fertilizer
in recommended doses, reported lack of knowledge (44.25%) and financial
constraint (55.75%) as the main reasons for non-adoption of recommended doses of
the fertilizer. The majority of the sample farmers (80%) reported that fertilizer is
easily available from private outlet at market. Hybrid seeds require more fertilizer
than inbred seed (HYVs) reported by cent per cent of the sample farmers.
Table No. 7.3: Questions related to Hybrid Adopting Farmers access to Fertilizer input and its use
Sl.No.
Particulars Answers % of farmers reporting
1. Have you used chemical fertilizer? Yes No
100.00 0.00
2. Whether received information from any source regarding what to use and the required doses ?
Yes No
82.00 18.00
3. If yes, have you applied recommended doses of fertilizer ?
Yes No
85.50 14.50
4. If not, state reasons therefor Reason 1 Financial security Reason 2 Lack of knowledge
44.25 55.75
5. If fertilizer not used at all what are the reasons Reason 1 Reason 2
0.00 0.00
6. Is fertiliser easily available ? Yes No
80.00 20.00
7. If yes, the source where it is available Source 1 Pvt. Outlet at market Source 2
100.00 0.00
8. Do you feel that hybrid seeds require more fertilizer than inbred seeds
Yes No
100.00 0.00
Information related to hybrid adopters’ access to pesticide input and its use are
shown in table 7.4. Analysis of table 7.4 revealed that 90.00 per cent of sample
farmers reported, hybrid rice or any other variety of rice was attacked with pests and
diseases. Farmers’ level responses received in course of pests and diseases, hybrid
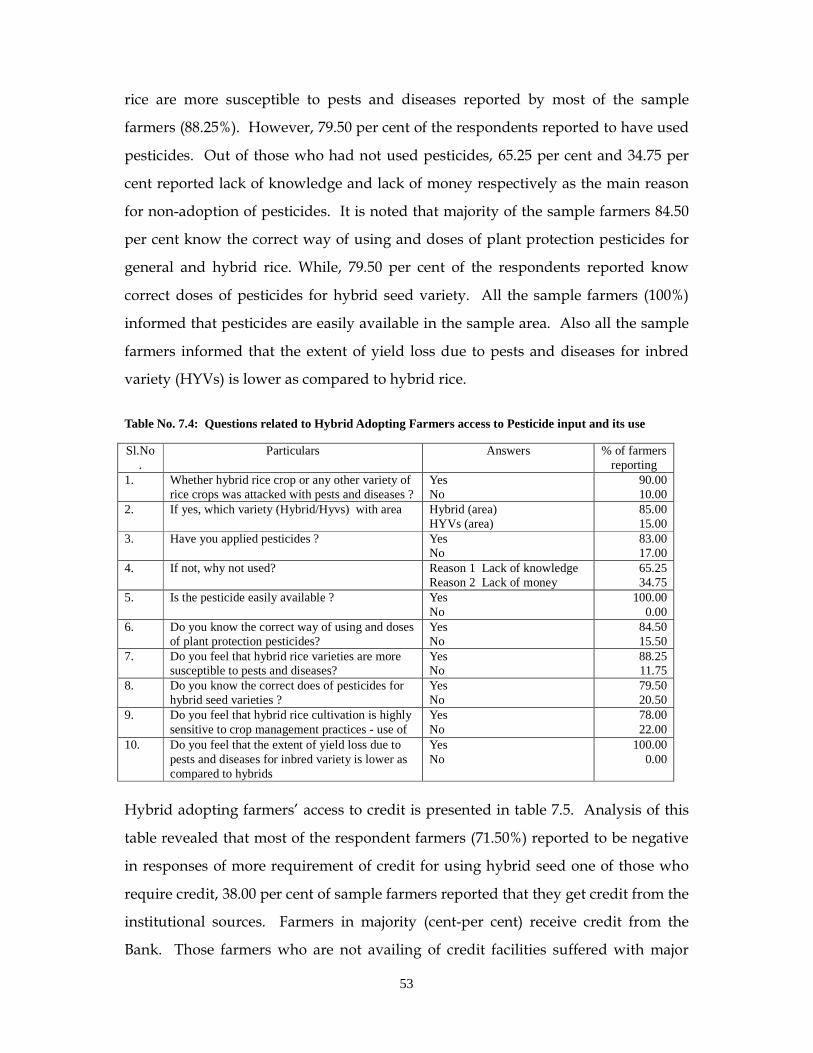
53
rice are more susceptible to pests and diseases reported by most of the sample
farmers (88.25%). However, 79.50 per cent of the respondents reported to have used
pesticides. Out of those who had not used pesticides, 65.25 per cent and 34.75 per
cent reported lack of knowledge and lack of money respectively as the main reason
for non-adoption of pesticides. It is noted that majority of the sample farmers 84.50
per cent know the correct way of using and doses of plant protection pesticides for
general and hybrid rice. While, 79.50 per cent of the respondents reported know
correct doses of pesticides for hybrid seed variety. All the sample farmers (100%)
informed that pesticides are easily available in the sample area. Also all the sample
farmers informed that the extent of yield loss due to pests and diseases for inbred
variety (HYVs) is lower as compared to hybrid rice.
Table No. 7.4: Questions related to Hybrid Adopting Farmers access to Pesticide input and its use
Sl.No.
Particulars Answers % of farmers reporting
1. Whether hybrid rice crop or any other variety of rice crops was attacked with pests and diseases ?
Yes No
90.00 10.00
2. If yes, which variety (Hybrid/Hyvs) with area
Hybrid (area) HYVs (area)
85.00 15.00
3. Have you applied pesticides ? Yes No
83.00 17.00
4. If not, why not used?
Reason 1 Lack of knowledge Reason 2 Lack of money
65.25 34.75
5. Is the pesticide easily available ? Yes No
100.00 0.00
6. Do you know the correct way of using and doses of plant protection pesticides?
Yes No
84.50 15.50
7. Do you feel that hybrid rice varieties are more susceptible to pests and diseases?
Yes No
88.25 11.75
8. Do you know the correct does of pesticides for hybrid seed varieties ?
Yes No
79.50 20.50
9. Do you feel that hybrid rice cultivation is highly sensitive to crop management practices - use of key inputs and time bound operations?
Yes No
78.00 22.00
10. Do you feel that the extent of yield loss due to pests and diseases for inbred variety is lower as compared to hybrids
Yes No
100.00 0.00
Hybrid adopting farmers’ access to credit is presented in table 7.5. Analysis of this
table revealed that most of the respondent farmers (71.50%) reported to be negative
in responses of more requirement of credit for using hybrid seed one of those who
require credit, 38.00 per cent of sample farmers reported that they get credit from the
institutional sources. Farmers in majority (cent-per cent) receive credit from the
Bank. Those farmers who are not availing of credit facilities suffered with major
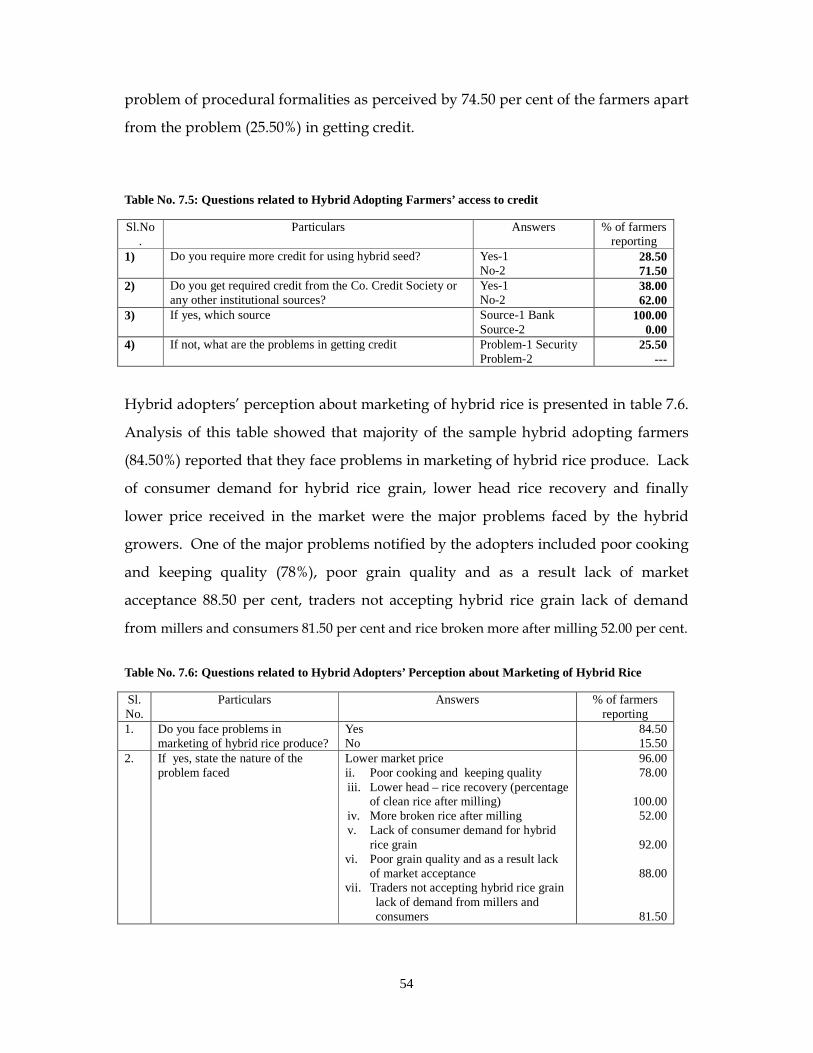
54
problem of procedural formalities as perceived by 74.50 per cent of the farmers apart
from the problem (25.50%) in getting credit.
Table No. 7.5: Questions related to Hybrid Adopting Farmers’ access to credit
Sl.No.
Particulars Answers % of farmers reporting
1) Do you require more credit for using hybrid seed? Yes-1 No-2
28.50 71.50
2) Do you get required credit from the Co. Credit Society or any other institutional sources?
Yes-1 No-2
38.00 62.00
3) If yes, which source Source-1 Bank Source-2
100.00 0.00
4) If not, what are the problems in getting credit Problem-1 Security Problem-2
25.50 ---
Hybrid adopters’ perception about marketing of hybrid rice is presented in table 7.6.
Analysis of this table showed that majority of the sample hybrid adopting farmers
(84.50%) reported that they face problems in marketing of hybrid rice produce. Lack
of consumer demand for hybrid rice grain, lower head rice recovery and finally
lower price received in the market were the major problems faced by the hybrid
growers. One of the major problems notified by the adopters included poor cooking
and keeping quality (78%), poor grain quality and as a result lack of market
acceptance 88.50 per cent, traders not accepting hybrid rice grain lack of demand
from millers and consumers 81.50 per cent and rice broken more after milling 52.00 per cent.
Table No. 7.6: Questions related to Hybrid Adopters’ Perception about Marketing of Hybrid Rice
Sl. No.
Particulars Answers % of farmers reporting
1. Do you face problems in marketing of hybrid rice produce?
Yes No
84.50 15.50
2. If yes, state the nature of the problem faced
Lower market price ii. Poor cooking and keeping quality iii. Lower head – rice recovery (percentage
of clean rice after milling) iv. More broken rice after milling v. Lack of consumer demand for hybrid
rice grain vi. Poor grain quality and as a result lack
of market acceptance vii. Traders not accepting hybrid rice grain
lack of demand from millers and consumers
96.00 78.00
100.00 52.00
92.00
88.00
81.50
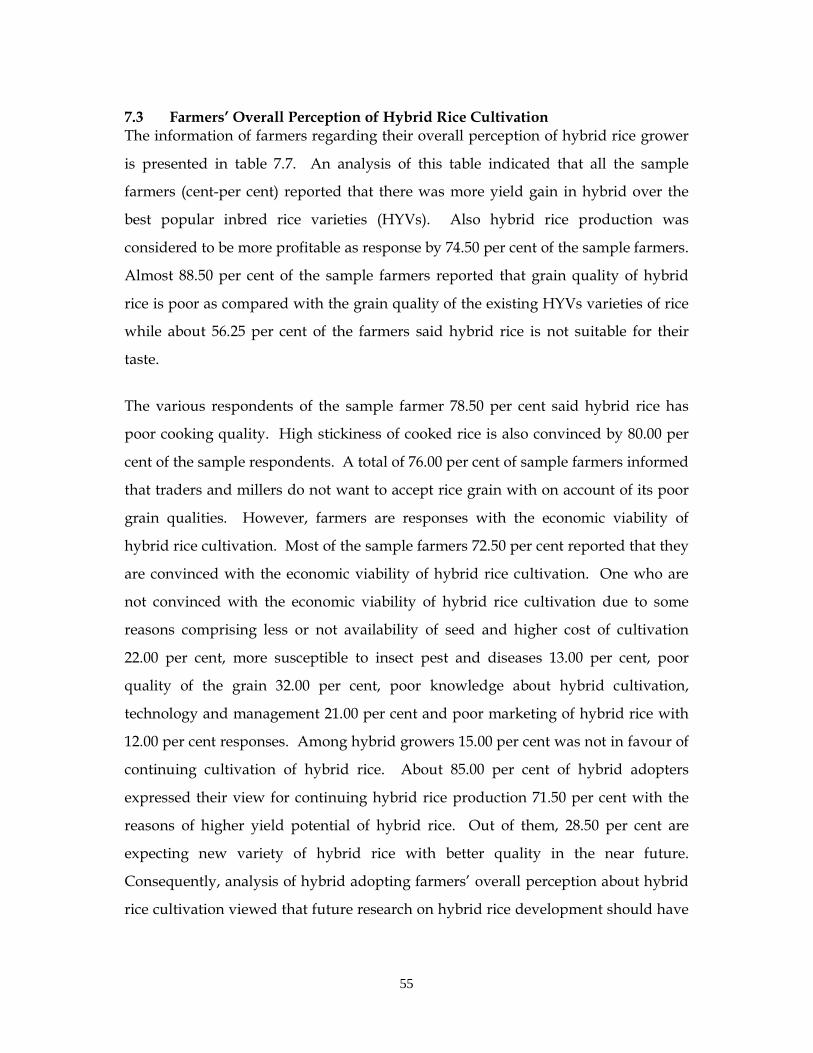
55
7.3 Farmers’ Overall Perception of Hybrid Rice Cultivation The information of farmers regarding their overall perception of hybrid rice grower
is presented in table 7.7. An analysis of this table indicated that all the sample
farmers (cent-per cent) reported that there was more yield gain in hybrid over the
best popular inbred rice varieties (HYVs). Also hybrid rice production was
considered to be more profitable as response by 74.50 per cent of the sample farmers.
Almost 88.50 per cent of the sample farmers reported that grain quality of hybrid
rice is poor as compared with the grain quality of the existing HYVs varieties of rice
while about 56.25 per cent of the farmers said hybrid rice is not suitable for their
taste.
The various respondents of the sample farmer 78.50 per cent said hybrid rice has
poor cooking quality. High stickiness of cooked rice is also convinced by 80.00 per
cent of the sample respondents. A total of 76.00 per cent of sample farmers informed
that traders and millers do not want to accept rice grain with on account of its poor
grain qualities. However, farmers are responses with the economic viability of
hybrid rice cultivation. Most of the sample farmers 72.50 per cent reported that they
are convinced with the economic viability of hybrid rice cultivation. One who are
not convinced with the economic viability of hybrid rice cultivation due to some
reasons comprising less or not availability of seed and higher cost of cultivation
22.00 per cent, more susceptible to insect pest and diseases 13.00 per cent, poor
quality of the grain 32.00 per cent, poor knowledge about hybrid cultivation,
technology and management 21.00 per cent and poor marketing of hybrid rice with
12.00 per cent responses. Among hybrid growers 15.00 per cent was not in favour of
continuing cultivation of hybrid rice. About 85.00 per cent of hybrid adopters
expressed their view for continuing hybrid rice production 71.50 per cent with the
reasons of higher yield potential of hybrid rice. Out of them, 28.50 per cent are
expecting new variety of hybrid rice with better quality in the near future.
Consequently, analysis of hybrid adopting farmers’ overall perception about hybrid
rice cultivation viewed that future research on hybrid rice development should have
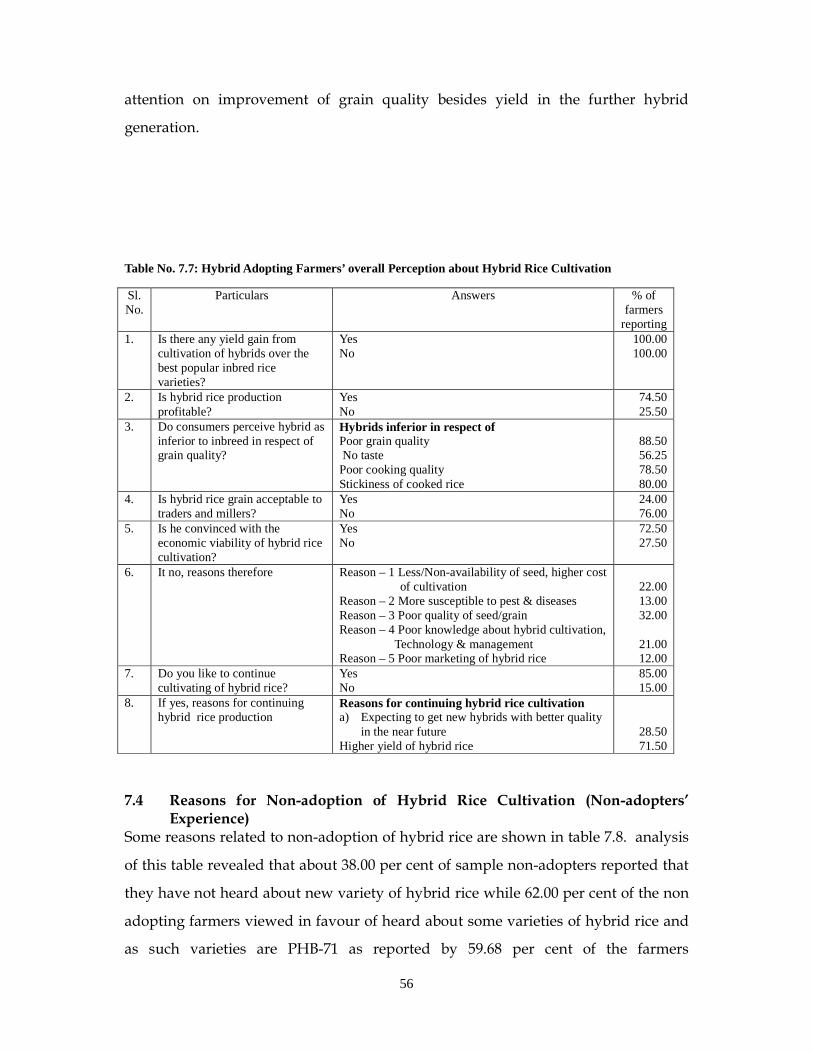
56
attention on improvement of grain quality besides yield in the further hybrid
generation.
Table No. 7.7: Hybrid Adopting Farmers’ overall Perception about Hybrid Rice Cultivation
Sl. No.
Particulars Answers % of farmers
reporting 1. Is there any yield gain from
cultivation of hybrids over the best popular inbred rice varieties?
Yes No
100.00 100.00
2. Is hybrid rice production profitable?
Yes No
74.50 25.50
3. Do consumers perceive hybrid as inferior to inbreed in respect of grain quality?
Hybrids inferior in respect of Poor grain quality No taste Poor cooking quality Stickiness of cooked rice
88.50 56.25 78.50 80.00
4. Is hybrid rice grain acceptable to traders and millers?
Yes No
24.00 76.00
5. Is he convinced with the economic viability of hybrid rice cultivation?
Yes No
72.50 27.50
6. It no, reasons therefore
Reason – 1 Less/Non-availability of seed, higher cost of cultivation
Reason – 2 More susceptible to pest & diseases Reason – 3 Poor quality of seed/grain Reason – 4 Poor knowledge about hybrid cultivation,
Technology & management Reason – 5 Poor marketing of hybrid rice
22.00 13.00 32.00
21.00 12.00
7. Do you like to continue cultivating of hybrid rice?
Yes No
85.00 15.00
8. If yes, reasons for continuing hybrid rice production
Reasons for continuing hybrid rice cultivation a) Expecting to get new hybrids with better quality
in the near future Higher yield of hybrid rice
28.50 71.50
7.4 Reasons for Non-adoption of Hybrid Rice Cultivation (Non-adopters’
Experience) Some reasons related to non-adoption of hybrid rice are shown in table 7.8. analysis
of this table revealed that about 38.00 per cent of sample non-adopters reported that
they have not heard about new variety of hybrid rice while 62.00 per cent of the non
adopting farmers viewed in favour of heard about some varieties of hybrid rice and
as such varieties are PHB-71 as reported by 59.68 per cent of the farmers
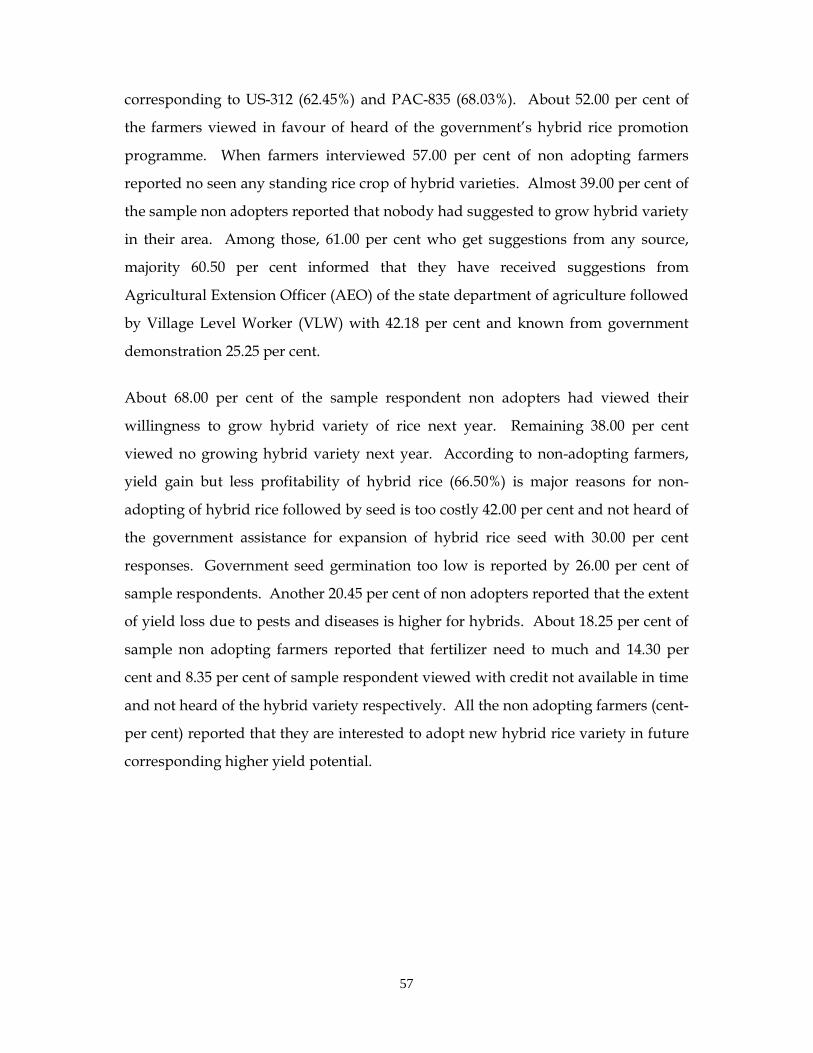
57
corresponding to US-312 (62.45%) and PAC-835 (68.03%). About 52.00 per cent of
the farmers viewed in favour of heard of the government’s hybrid rice promotion
programme. When farmers interviewed 57.00 per cent of non adopting farmers
reported no seen any standing rice crop of hybrid varieties. Almost 39.00 per cent of
the sample non adopters reported that nobody had suggested to grow hybrid variety
in their area. Among those, 61.00 per cent who get suggestions from any source,
majority 60.50 per cent informed that they have received suggestions from
Agricultural Extension Officer (AEO) of the state department of agriculture followed
by Village Level Worker (VLW) with 42.18 per cent and known from government
demonstration 25.25 per cent.
About 68.00 per cent of the sample respondent non adopters had viewed their
willingness to grow hybrid variety of rice next year. Remaining 38.00 per cent
viewed no growing hybrid variety next year. According to non-adopting farmers,
yield gain but less profitability of hybrid rice (66.50%) is major reasons for non-
adopting of hybrid rice followed by seed is too costly 42.00 per cent and not heard of
the government assistance for expansion of hybrid rice seed with 30.00 per cent
responses. Government seed germination too low is reported by 26.00 per cent of
sample respondents. Another 20.45 per cent of non adopters reported that the extent
of yield loss due to pests and diseases is higher for hybrids. About 18.25 per cent of
sample non adopting farmers reported that fertilizer need to much and 14.30 per
cent and 8.35 per cent of sample respondent viewed with credit not available in time
and not heard of the hybrid variety respectively. All the non adopting farmers (cent-
per cent) reported that they are interested to adopt new hybrid rice variety in future
corresponding higher yield potential.
58
Table No. 7.8: Questions related to Reasons for non-adoption of hybrid rice (reaction of non-participants)
Sl. No.
Particulars Answers % of farmers reporting
1. Have you heard of any of the new hybrid varieties of rice? (Yes-1, No-2)
Yes – 1 No – 2
62.00 38.00
2. If yes, what are they? (name them) --- --- 3. Have you heard of the Govts. Hybrid rice
promotion programme? (Yes-1, No-2) Yes – 1 No - 2
52.00 48.00
4. Have you seen any standing rice crop of hybrid variety in your area? (Yes-1, No-2)
Yes – 1 No - 2
43.00 57.00
5. Did anybody suggest you to grow this variety? (Yes-1, No-2)
Yes – 1 No - 2
61.00 39.00
6. If yes, state who suggested?
V.L.W BDO AEO Relative Other cultivators Known from government demonstration Others (Specify)
42.18 4.20
60.50 ---
10.45 25.25 15.75
7. Will you be growing this variety next year? Yes No
68.00 32.00
8. What are the reasons for your not using this year?
Not heard of the variety ii. Not heard of the Govt. assistance for
expansion of hybrid rice seeds. Non-availability of seed
Not at all Not in time Pure hybrid seed not available
Seed is too costly Seed available, but at too far a distance vi. Pre-treatment of seed is necessary and have
never done it before. Govt. Seed germination rate too low viii. Not convinced that the seed is of high quality ix. Not convinced that its yield is sufficiently
high Lower yield for hybrid than for inbred xi. Yield gain but lower profitability of Hybrid
rice Variety too coarse Higher risks xiv. Will fetch lower price as compared to inbred
variety Needs too much of fertilizers Soil type not suitable Not insects pests and disease resistant. xviii. The extent of yield loss due to pests and
diseases is higher for hybrids. Needs more water Fodder quality not good Credit – not available in time Credit not at all available xxiii. Restrictions on disposal i.e. should be sold to
a particular agency Any other (Specify)
8.35
30.00
42.00
26.00
66.50
18.25
20.45
14.30
9. Are you ready to accept new hybrid rice varieties in future considering superior grain quality and higher yield potential?
Yes No
100.00
10. If no, reasons therefore.
Reasons – 1 Reasons – 2
NIL
59
CHAPTER – VIII
SUMMARY & POLICY RECOMMENDATIONS
8.1 Background With over one billion people in India, there is a need to increase food production to
meet the demand of the burgeoning population. As rice is the staple food in most
parts of India and there is a need to increase production of rice and productivity of
land under rice cultivation. India has the largest acreage under rice at 43.97 million
hectare with a production of 104.32 million tones and yield of 2372 kg/ha
(Government of India, 2012).
In fact the rice research programme in India over the past 50 years has largely
centred on shifting the yield frontier which contributed substantially to achieving
food security through increased rice supplies (CRRI, 1996). Several studies indicated
high payoffs to rice research in India (Evenson & McKinsey, 1991); Evenson, 1993;
Kumar & Rosegranht, 1994; Pingali et.al, 1997; Jha & Kumar, 1998 as quoted in Pingali &
Hossain, 1999). The rice output growth was 2.80 per cent per annum during 1966-99
with the highest rate of growth (4.00% per year) achieved during the 1980s. Yield
improvement in rice was major sources of strong output growth, largely due to
widespread adoption of modern rice varieties in favourable irrigated environments
(Baker & Herdt, 1985; David & Outsuka, 1994; Hossain, 1996; Pingali et.al 1997).
However, the sense of complacency in the demand-supply balance began
disappearing in early 1990s, when it was observed that yield advances in rice
drastically slowed down for the irrigated rice systems in India as well as in other
Asian countries. The intensive rice growing states of Andhra Pradesh, Tamil Nadu,
60
Punjab & Haryana, which performed significantly in terms of yield improvements
until the 1980s, have been witnessing either a plateau or negative yield growth
during the 1990s. The economically exploitable yield of existing High Yield Varieties
(HYVs) of rice has almost reached the technical optimum in irrigated rice systems
with the universal adoption of HYVs.
Among various approaches and options available policymakers and research
managers considered development and use of hybrid rice technology in the late
1980s as a readily available option to shift upward and yield frontier in the irrigated
environments in India. Further, the miraculous success of hybrid rice technology in
China, which greatly contributed to the growth of rice production in that country
(Lin, 1994; Virmani et.al 1998), triggered an interest in strengthening research efforts
in some tropical countries in Asia including India in early 1990s.
Several international agencies like UNDP, FAO, ADB and International Rice
Research Institute (IRRI) have generously supported the hybrid rice research and
development at many national research institutions in tropical Asia including India
in the early 1990s. India received nearly US $ 8 million in financial support from
these external agencies between 1990 & 2000 for activities under the hybrid rice
programme initiated in 1989 at the Directorate of Rice Research, Hyderabad. An
additional to external funding with the Central Government through the ICAR and
State Governments have invested huge capital and human resources for the
development and supply of suitable hybrid rice technology for Indian farmers. The
private sector participated in hybrid rice research programme and seed production
in a big way in the early 1990s, expecting a huge seed business and a guaranteed
seed market in view of rice being a widely cultivated crop in the country and the
farmer not being able to keep hybrid seed from his/her own produce. Among about
130 private seed companies engaged in rice business across the country, 15 larger
companies participated in hybrid rice seed production and distribution in early
1990s. After four years of rigorous research (1989-93), the first hybrid rice was
released in Andhra Pradesh in 1993-94 rabi season. Subsequently, as a result of
concerted efforts over a period of two decades since the inception of the National
61
Programme on Hybrid Rice (1989), a total of 43 rice hybrids have been released for
commercial cultivation in the country of which 27 as indicated in table No. 1.1 were
developed by public sector institutions and 16 were developed by private sector
(Shoba Rani et. Al., 2010, p. 36). In contrast, in China the initial phase of development
of hybrid rice was solely a public sector affair.
At present hybrid rice is reported to be grown approximately 2 lakh hectares. Area
under hybrid rice will further increase after heterotic hybrids suitable for high
productivity areas of Punjab, Haryana, coastal region of Andhra Pradesh and
shallow low land areas are identified and an effective transfer of technology is taken
up vigorously in the target states (Viraktamat, 2010). Based on the quantity of
hybrid seed sold in 2008, it is estimated that hybrid rice was cultivated on 0.15 m ha.
The National Food Security Mission (NFSM) launched in 2007 envisioned an
increase of 10 m. tons by the end of 11th Five Year Plan (2012). Of this hybrid rice is
expected to contribute 3.4 mt if grown in 3.4 m ha (@ on tone advantage). The
ultimate goal of the mission is to extend 20.00 per cent of the total rice area planted
with hybrid rice. In an effort to enhance rice productivity, the present government
has, in a policy shift, decided to encourage the cultivation of hybrid varieties by
offering subsidies even in those cases where the seeds are not certified, but are
truthfully labeled and notified. Under the NFSM, the approach is to bridge the yield
gap in respect of rice through dissemination of improved technology and farm
management practices. Added emphasis is being given for adoption of hybrid rice
under the special scheme namely; “Bringing Green Revolution to Eastern India
(BGREI).” The programme covers traditional rice growing areas such as Uttar
Pradesh, Bihar, Jharkhand, West Bengal, Madhya Pradesh, Chattisgarh & Assam and
these states account for 80.00 per cent of adoption. It is to be pointed out here that
adoption of rice hybrids developed in India did not take place in the in green
revolution areas where productivity plateau. The extent of adoption of hybrid rice
in South India is very low (5.00%) and North-West India (Punjab, Haryana &
Maharashtra account for 15.00 Per cent.
62
Moreover, Janaiah (2002) argues that in spite of huge capital and human resources
invested over the past decade to develop and supply hybrid rice technology for
Indian farmers, there has not been a noticeable impact on the sector. India has tried
to emulate China’s success story in the area of hybrid rice research and
development, but Indian farmers have not readily accepted hybrid rice technology.
If one looks at adoption of hybrid rice in different states the adoption, empirical
results found that the farmers have not adopted hybrid rice for various reasons. In
spite of attempts over a decade to popularize hybrid rice in states like Andhra
Pradesh, Tamil Nadu & Karnataka in south the adoption is very low (Janaiah; 2003;
Chengappa et.al; 2003 & Ramasamy et.al, 2003). The reasons for resistance to adopt
hybrid rice in India are (a) shortage of hybrid rice in terms of quantity and quality,
(b) poor hybrid rice grain formation, (c) yield, biotic stresses like bacterial and pest
attack, (d) lack of market for hybrid rice because of consumer’s preferences
regarding grain quality, shape, colour and cooking quality, and; (e) high cost of
hybrid seed. In fact, recently the Bihar Government paid Rs. 61 crore to farmers who
cultivated hybrid rice because the grain formation did not occur in the seed and
hence farmers incurred losses. Despite all above, a number of varieties, as staged in
table No. 1.1, have been released by the Central Government and states as well to
meet the demand of the farmers; the spread of these new varieties in place of
traditional ones has not been examined adequately. In fact, there is no
comprehensive study to record farm level experiences of hybrid rice, thus, the
Ministry of Agriculture, Government of India has decided to assign the study
entitled “Spread of New Varieties of Hybrid Rice and their I mpact on the Overall Production
and Productivity” to its Agro-Economic Research Centres in their respective states.
Accordingly, this Centre has been undertaken the study in Bihar.
8.2 Objectives of the Study i. To indicate the extent of adoption and the level of participation by the different
categories of farmers in the cultivation of hybrid rice.
ii. To assess the overall impact on rice production and productivity of hybrid rice
cultivation.
iii. To study the economics of cultivation of hybrid rice varieties vis-à-vis inbred
varieties.
63
iv. To identify factors determining the adoption of hybrid rice varieties.
v. To address various constraints and outline the prospects for increasing hybrid rice
cultivation and finally
vi. To suggests policy measures for expansion of hybrid rice cultivation.
8.3 Data Base and Methodology
This study is based on both secondary and primary data. Secondary data relating to
area, production and yield of rice crop were collected from the Directorate of
Agriculture, Government of Bihar. Secondary data were also obtained from the
publications of Government of Bihar and Government of India. These are mainly
Economic Survey of Bihar, Statistical Handbook of Bihar, Agricultural Statistics--- At
a Glance: 2012 etc. To arrive at the trends in APY of rice secondary data were
collected for the years from 1984-85 to 2009-10. Primary data is confined to the
National Food Security Mission (NFSM) paddy districts (18 districts) of Bihar. Out
of these 18 NFSM paddy districts, two (02) districts namely; Muzaffarpur and Gaya
were selected on the basis of having higher concentration of hybrid seeds
cultivation. From Muzaffarpur districts, two representative blocks namely;
Minapur, Motipur & from Gaya district Aamas & Dumaria blocks were chosen
following same criteria. Thereafter from each of the selected blocks, two villages
namely; Shital Sema & Minapur from Minapur Block and Morsandi and Tajpur from
Motipur Block and Mahua and Bazitpur from Aamas Block and Karhani and Bokaha
from Dumaria Block were selected for in-depth enquiry. From each of the selected
villages, lists of cultivating households growing hybrid rice varieties and inbred
varieties were prepared separately and stratified according to farm size groups such
as marginal (< 1 ha), small (1 to 2 ha), semi-medium (2 to 4 ha), medium (4 to10 ha)
and large (10 ha & above). Due attention was given in the sample to accommodate
the social composition of the villages. As regards the sample size is concerned, 40
hybrid rice growers from the list of hybrid rice growers and 10 inbred rice growers
from the list of inbred rice growers were randomly chosen, making a total of 50
paddy growers from each of the sample district were selected. This way the total
64
size of the sample is 100 paddy growers, equally spread over in two selected districts
from the state (Bihar). The reference period of primary data was 2008-09 and 2009-
10. Primary data was obtained by administering a duly structured schedule.
8.4 Major Findings Followings are major findings of the study:
Out of the three rice growing seasons, winter (Aghani) is the most important season
in Bihar in terms of area sown and production. In 2009-10 winter rice accounted for
36.99 per cent of total output and 80.93 per cent of total area cultivated under rice.
The importance of winter rice output in total production has fallen from 91.41 per
cent in 1984-85 to 36.99 per cent in 2009-10 while that of Boro rice has risen from 1.65
per cent in 1984-85 to 2.07 per cent in 2009-10 except a few years. Increase in the
share of output in case of autumn rice (Bhadai) is due to increased in area from 6.94
per cent in 1984-85 to 88.61 per cent in 2007-08. However, it declined to 60.95 per
cent in 2009-10. For summer rice, increased share in production is attributable to
increase in both area and production. The relative importance of winter rice has also
sharply fallen in terms of acreage planted and production. It is noted that average
rice yield in Bihar increased to 1475 kg per hectare in 2006-07 except 2008-09 & 2009-
10. These were 928 kg per hectare in 1987-88 and 1211 kg per ha in 1984-85, the
period when rice crop of the state was yet to switch over to the hybrid technology.
In case of summer rice, yield rate increased from 1406 kg per ha in 1984-85 to 2053 kg
per ha in 1998-99, which again increased to 1736 kg per ha in 2009-10. For winter
rice, yield level increased from 1098 kg per ha in 1984-85 to 1142 kg per ha in 2009-10
through 1555 kg per ha in 2006-07 whereas autumn rice recorded yield levels of 947
kg per ha in 2009-10 which was 1648 kg per ha in 2008-09 against 771 kg per ha in
1984-85. Above analysis showed that there has been overall increase in rice
production during the period under study 1984-85 to 2009-10.
65
Total area under HYV rice has increased from 1401 thousand ha in 1994-95 to a peak
of 1984 thousand ha in 1999-2K but it has fallen in subsequent years and reached to
the level of 1691 thousand ha in 2009-10. But it has increased from 1401 thousand ha
in 1994-95 to 1691 thousand ha in 2009-10, registering an increase of 20.70 per cent in
area. In case of production almost similar pattern was observed. It increased from
2065 thousand MT in 1994-95 to 2203 thousand MT in 2009-10, accounting for an
increase in production by 6.69 per cent during the period.
Compound Growth Rate (CGR) in area of total paddy on an aggregate level during
the period-I (1984-85 to 1993-94) was estimated as 0.68 per cent per annum which
decreased to -2.13 per cent per annum during the period – II (1994-95 to 2003-04).
But thereafter it increased at the rate of 12.95 per cent per annum during the period –
III (2004-05 to 2009-10). Thus, it clearly indicates that the area under total paddy on
an aggregate level in the state of Bihar has increased significantly during the period
– III (2004-05 to 2009-10). Compound Growth Rate of production of total paddy had
recorded increase at the rate of 1.45 per cent per annum during period-I (1984-85 to
1993-94), and 15.93 per cent per annum during the period – III (2004-05 to 2009-10)
except decrease in period – II (1994-95 to 2003-04) by 4.63 per cent per annum.
Similarly, the CGR of productivity of total paddy had also increased at the rate of
0.77 per cent per annum during period – I (1984-85 to 1993-94) and 2.64 per cent per
annum till during the period – III (2004-05 to 2009-10). But it has fallen by 0.97 per
cent per annum during the period – II (1994-95 to 2003-04).
Co-efficient of variation on an aggregate in the area of total paddy was estimated to
10.10 per cent during the period of 1984-85 to 1993-94 which varied to 26.76 per cent
till the period of 2004-05 to 2009-10. While, the coefficient of variation in production
of total paddy had varied in increasing direction from 13.58 per cent in the period of
1984-85 to 1993-94 to 27.19 per cent till the period of 2004-05 to 2009-10. But the
coefficient of variation in yield of total paddy was recorded to 16.38 per cent during
1984-85 to 1993-94, which increased to 20.25 per cent till the period of 2004-05 to
2009-10.
66
The compound growth rate in area of total HYV paddy was estimated as 2.11 per
cent per annum during the period of 1994-95 to 2003-04 which increased to 3.08 per
cent per annum during the period of 2004-05 to 2009-10. The compound growth rate
in production of total HYV paddy had also increased at the rate of 4.08 per cent per
annum during 1994-95 to 2003-04 to 8.38 per cent per annum till the period of 2004-
05 to 2009-10.
The co-efficient of variation in total area of HYV paddy during the period of 1994-95
to 2003-04 was calculated to 11.93 per cent which decreased to 7.57 per cent during
the period of 2004-05 to 2009-10. The variation in total production was estimated to
18.01 per cent during the period of 1994-95 to 2003-04 which increased to 24.20 per
cent during the period of 2004-05 to 2009-10. The variation in total productivity was
recorded to be 8.94 per cent during the period of 1994-95 to 2003-04 which also
increased to 18.68 per cent during the period of 2004 - 05 to 2009-10.
The table reveals that the share in area of HYV rice was 31.00 per cent in 1994-95,
which touched to the level of 52.63 per cent in 2009-10. Similarly the share in
production of HYV rice to total rice production in the year 1994-95 was 30.11 per
cent, which doubled in the year 2009-10.
The agricultural economy of Bihar is largely dependent on marginal and small
operational holdings, which accounts for 96.92 per cent, followed by semi-medium
(2.56%), medium (0.50%) and large (0.02%). Besides, out of the total working
population (33.88%), 77.35 per cent are engaged in agricultural activities (cultivators
plus agricultural labourers) in the state.
Out of 80 adopters’ farm household marginal and small farmer together account for
77.50 per cent followed by semi-medium (15%) and medium (7.50%). Similarly in
case of non-adopters farm families, 70.00 per cent account for marginal and small
farms, 20.00 per cent semi-medium and 10.00 per cent medium farms.
On an average there were 7.39 persons in a farm family constituting 62.66 per cent
male and 37.24 per cent female. It was 7.43 persons among the adopters’ farm
households and 7.25 among the non-adopters farm households.
67
The average age of the head of family is largely in the category of 18 to 60 years
(92%) at the overall level; however, it was a little bit higher among the adopters’
category (92.50%), and that of 90.00 per cent among the non-adopter farm
households.
The caste composition of households reveals that 60.00 per cent are belonged to
other backward castes followed by general category of castes (30%) and scheduled
castes (10%) on overall basis.
On the farms of sample hybrid adopters during kharif season of 2009-10, about 47.11
per cent of the Gross Cropped Area (GCA) was adopted by paddy, 13.09 per cent by
maize and 11.46 per cent by other crops. While during 2010-11, 48.68 per cent was
covered by kharif paddy crop, 12.53 per cent by kharif maize and 10.68 per cent by
other crops.
The area under pulses, rabi maize and other crops was found a little higher in 2010-
11 over 2009-10. The aggregate share of kharif crops of the GCA was almost 73.00
per cent plus among the non-adopters of hybrid rice during both years.
During the year 2009-10, the average area under rice was estimated at 0.82 ha
(62.60%) of the average farm size. Out of which 0.71 ha (86.58%) was devoted on
HYVs and 0.11 ha (13.42%) hybrid. Similarly in 2010-11, the average area under rice
was estimated at 0.85 ha (64.88%) of the average farm size. Out of which 0.70 ha
(82.36%) was devoted on HYVs and 0.15 ha (17.64%) on hybrid rice.
Out of 80 sample hybrid rice adopters, 49 (61.25%) have reported about the
Extension Workers of State Department of Agriculture, more specifically the SMS
and Kisan Salahkar (KS) followed by participation in training programme under SRI
Technology (45%), progressive farmers (17%) and Krishi Vigyan Kendra (5%).
Majority of the sample hybrid adopters were received good quality of information
from all the major sources of information except the progressive farmers.
During the year 2009-10, about 40.00 per cent of the sample hybrid adopters have
received the seed from the district office of the department of agriculture on full
68
subsidy, 32.50 per cent on partial subsidy and 27.50 per cent from local input dealers.
While during the year 2010-11, 45.00 per cent of the hybrid adopters have obtained
the seed from district office of the department of agriculture on full subsidy followed
by 30.00 per cent from the government on partial subsidy and 25.00 per cent
purchased from licensed local input dealers.
The percentage difference between the hybrid and HYVs rice was calculated at 58.98
per cent. During 2009-10, the percentage difference between the mean yields of
hybrid and HYVs rice was better than the percentage difference between the mean
yields of hybrid and HYVs rice of 2010-11. On an average the yield gain was 58.98
per cent obtained by all sizes of farm in 2009-10, while that of 55.79 per cent in 2010-11.
Marginal farmers have been largely affected by costlier seeds (27.50%, small farmers
by lack of irrigational facilities (23.75%), semi-medium farmers by lack of adequate
training and information (6.25%) whereas medium farms by lack of irrigational
facilities (3.75%) and lack of adequate training and information (3.75%) during the
year 2009-10. While during the year 2010-11, marginal farmers largely reported for
costlier seeds (28.75%), small farmers for lack of credit facilities (17.50%), semi-
medium farmers for costlier seeds (6.25%) and lack of adequate training and
information (6.25%) whereas medium farmers reported for lack of irrigational
facilities (3.75%).
Seed rate (kg/ha) is significantly lower for the hybrid than for HYVs. The use of
chemical fertilizer is also 25.97 per cent higher than that for HYVs. While in case of
non-adopter of hybrid rice, it is higher by 23.96 per cent. Labour use is significantly
higher for the hybrid than that for HYVs. However, more labour is used in
transplanting of hybrid rice (25.14 days) as compared to HYVs (21.18 days). Among
all the components of total cost, expenditure on human labour formed the single
largest item accounted for 27.62 per cent and 33.64 per cent of the total cost for
hybrid and inbred varieties respectively. The cost incurred on seed was next one
which formed about 14.17 per cent of total cost for hybrids whereas that was
calculated at 4.80 per cent for HYVs. Total cost of input was about 27.42 per cent
69
higher for hybrids than that for HYVs. The total seed cost for hybrid rice was about
3.75 times higher than that for HYVs.
During 2010-11, the farmers growing hybrid rice received a gross return of Rs.
83719.18 per hectare while the gross return for inbred varieties was Rs. 54178.66.
Thus, the gross return was 54.52 per cent higher in hybrid rice cultivation. However,
the profit (net return) realized in hybrid and inbred rice was Rs. 59966.93 and Rs.
35538.10 per hectare respectively. Thus, the profit gain realized in hybrid rice
production was Rs. 24428.83 per hectare or 68.74 per cent over inbred varieties of
rice. Consequently the benefit cost ratio was also higher in hybrid rice cultivation
(3.52:1). Now, net return from hybrids over the reference periods has merely
decreased from Rs. 60138.94 per hectare in 2009-10 to Rs. 59966.93 per hectare in
2010-11 accounting for 0.28 per cent decreased in 2010-11.
Hybrids have hulling, milling and head rice recovery ratio of 66.67 per cent, 63.16
per cent and 60.01 per cent respectively. The corresponding figures for HYVs were
calculated at 70.58 per cent, 65.22 per cent and 61.86 per cent respectively whereas
Non-adopter reporting hulling ratio (71.43%), milling ratio (66.66%) and head rice
recovery ratio (65.21%).
On an overall average of size group 62.26 per cent and 42.89 per cent of total output
have been sold by adopters of hybrid and HYVs rice respectively in the market and
rice growers received a price of Rs. 1240.28 per quintal and Rs. 1221.53 per quintal
for hybrid and HYVs rice respectively.
Very little variation was found in quantity sold by the farmer for hybrid and HYVs
because most of sample size was marginal and small farmer, they used their produce
in large quantity as home consumption and remaining amount sold for purchasing
agriculture inputs.
On overall size 63.01 per cent and 43.74 per cent were found to be sold in the market
on an average price of Rs. 1242.63 and Rs. 1227.67 per quintal by adopters of hybrid
rice and HYVs rice growers respectively while, non-adopters of hybrid sold their
42.44 per cent of total output in the market on an average rate of Rs. 1217.88 per
70
quintal. 42.83 per cent and 43.33 per cent of their output were found to be sold in the
market on an average price of Rs. 1816.80 per quintal and Rs. 1965.33 per quintal by
adopters of hybrid and HYVs rice respectively while, non-adopters sold 44.06 per
cent of their total produce in the market with on an average price of Rs. 1964.52 per
quintal. 70.12 per cent and 46.12 per cent of their total produce were estimated to be
sold in the market on an average price of Rs. 1821.87 per quintal and Rs. 1967.53 per
quintal by adopters of hybrid and HYVs growers respectively; while non-adopters
sold their 53.64 per cent of total output in the market on an average price of Rs. 1965.64 per
quintal.
Most of the hybrid adopters sold their greater proportion of paddy output
immediately after the harvest in the month of November and December, although
the marketing was spread over the month except April to October.
During the year 2010-11, in case of hybrid adopters, 21.19 per cent and 23.96 per cent
of total annual sales of hybrid paddy occurred in the month of November and
December respectively as against the corresponding proportions of 26.53 per cent
and 35.16 per cent for HYVs respectively.
Most of the sample farmers both hybrid adopter and non adopters have not been
able to received high prices and greater amount of sales in the month of November
and December just after harvest the crops was mainly effected by the small land
holders who compelled to sell their output to meet their bare requirement.
73.50 per cent of the sample farmers reported extension worker of the state
department of the agriculture as their source of awareness about hybrid rice
technology.
Demonstration of the hybrid rice for the extension of hybrid rice cultivation included
PHB-71 as reported by 42.00 per cent having yield advantage of 72.00 per cent over
HYVs, US-312 (35%) with 65.00 per cent yield advantage and PAC-835 (28%) with
58.00 per cent of yield advantage.
71
Usual source of seed for the farmers 68.00 per cent of total farmers reported
government supply as source of seed. However, seeds available during planting
time were reported by 39.50 per cent of the farmers and only 10.50 per cent of the
farmers who reported availability of seeds at reasonable price.
Yield gain of (10-15%) more in hybrid rice production was reported by 15.50 per cent
of the sample farmers. Yield received of (15-20%) more in hybrid rice was informed
by 32.75 per cent of the respondent farmers and yield realized in hybrid rice higher
by 20.00 per cent and above as compared to inbred (HYVs) rice was reported by
43.50 per cent of the farmers.
A major proportion (85.50%) of the respondent farmers also noticed to have used
recommended doses of the fertilizer input. There was some reasons concerned with
sample farmers those who have not used fertilizer in recommended doses, reported
lack of knowledge (44.25%) and financial constraint (55.75%) as the main reasons for
non-adoption of recommended doses of the fertilizer.
Majority of the sample farmers 84.50 per cent know the correct way of using and
doses of plant protection pesticides for general and hybrid rice. While, 79.50 per cent
of the respondents reported know correct doses of pesticides for hybrid seed variety.
Most of the respondent farmers (71.50%) reported to be negative in responses of
more requirement of credit for using hybrid seed one of those who require credit,
38.00 per cent of sample farmers reported that they get credit from the institutional
sources.
One of the major problems notified by the adopters included poor cooking and
keeping quality (78%), poor grain quality and as a result lack of market acceptance
88.50 per cent, traders not accepting hybrid rice grain lack of demand from millers
and consumers 81.50 per cent and rice broken more after milling 52.00 per cent.
All the sample farmers (cent-per cent) reported that there was more yield gain in
hybrid over the best popular inbred rice varieties (HYVs). Also hybrid rice
production was considered to be more profitable as response by 74.50 per cent of the
72
sample farmers. Almost 88.50 per cent of the sample farmers reported that grain
quality of hybrid rice is poor as compared with the grain quality of the existing
HYVs varieties of rice while about 56.25 per cent of the farmers said hybrid rice is
not suitable for their taste.
About 38.00 per cent of sample non-adopters reported that they have not heard
about new variety of hybrid rice while 62.00 per cent of the non adopting farmers
viewed in favour of heard about some varieties of hybrid rice and as such varieties
are PHB-71 as reported by 59.68 per cent of the farmers corresponding to US-312
(62.45%) and PAC-835 (68.03%).
Majority 60.50 per cent informed that they have received suggestions from
Agricultural Extension Officer (AEO) of the state department of agriculture followed
by Village Level Worker (VLW) with 42.18 per cent and known from government
demonstration 25.25 per cent.
According to non-adopting farmers, yield gain but less profitability of hybrid rice
(66.50%) is major reasons for non-adopting of hybrid rice followed by seed is too
costly 42.00 per cent and not heard of the government assistance for expansion of
hybrid rice seed with 30.00 per cent responses. Government seed germination too
low is reported by 26.00 per cent of sample respondents.
8.5 Policy Implications On the basis of above findings and field level observations followings are the policy implications:
1. The cost of irrigation, seeds and pesticides were significantly higher in hybrid
rice production than HYVs, which may be reduced by providing skill
oriented training & incentivization programme to hybrid rice growers over
HYV rice growers (Attn: Directorate of Agriculture, Government of Bihar).
2. The access for hybrid rice technology was poor. So there is need to promote
such technology by way of training, extension services, monitoring etc. (Attn:
Directorate of Agriculture, Government of Bihar).
73
3. Since most of the hybrid adopters sold their output just after harvesting
causing them low returns, so hybrid adopters should be encouraged to
process and sell husked paddy to make it more profitable. It requires proper
storage facilities also (Attn: Directorate of Agriculture, Government of Bihar).
4. Most of hybrid adopters reported about the quality of hybrid in terms of
cooking and keeping was much poor. So there is need to improve the quality
by promoting more scientific applications (Attn: SAUs, Government of Bihar).
5. Adoption of hybrid paddy was found poor, which needs to be increased.
(Attn: Directorate of Agriculture, Government of Bihar).
6. Since efforts is required to encourage small & marginal farmers for adoption
of hybrid rice. To popularize the same, distribution of rice minikits (hybrid
rice kits) among them should be at larger scale (Attn: Directorate of
Agriculture, Government of Bihar).
7. Effective implementation and monitoring of NFSM (Rice) and BGREI
Programme is need of hour to increase the rice area, production and yield in
the state because of high potentiality of the region/state in terms of having
rice based cropping system (Attn: Directorate of Agriculture, Government of
Bihar).
********* ******
***
74
References
GoI, (2012); Agricultural Statistics at a Glance--- 2012, Ministry of Agriculture, Government of
India.
CRRI (1996): Fifty years of Research at CRRI, Cuttack, Orissa.
Evenson, R E & J W Mckinsey (1991); ‘Research, Extension Infrastructure and Productivity Change
in Indian Agriculture’ in Research and Productivity in Asian Agriculture, RE Evenson & CE Pray
(eds), Cornell University Press, Ithaca, US.
Evenson, R E (1993); ‘Technological Distance and Rice Productivity in India,’ Paper presented at the
national Workshop on ‘Agricultural Research Evaluation: Methods and Applications,’ National
Academy of Agricultural management (NAARM), Hyderabad.
Kumar, P & Mark N Rosegrant (1994); Productivity and Sources of Growth for Rice in India,
Economic & Political Weekly, Vol. 29, No. 53, pp A183-A188.
Pingali, P L, M Hossain & R Gerpaico (1997); Asian Rice Bowls: The Returning Crisis, CANB
International and IRRI, Los Banos, Philippines.
Pingali, P L & M Hossain (ed.) (1999); Impact of Rice Research Thailand Development Research
Institute, Bangkok and IRRI, Loss Banos, Philippines.
Boker, R & R N Herdt (1985); The Rice Economy of Asia, Resource for future, Washington, DC.
75
David, C C & K Otsuka (1994); Modern Rice Technology and Income Distribution in Asia (ed.),
Lynne Rienner Publishers (Boulder & London) and International Rice Research Institute, Los banos,
Manila, Philippines, pp 1-22.
Hossain, M (1996); Rice Economy in India: Achievements, Challenges and Implications for
Technology Development Research, Paper presented at the IRRI--- India Dialogue, New Delhi, India,
Sept., 28-29.
Lin, J Y (1991); The Household Responsibility System Reform and Adoption of Hybrid Rice in China,
Journal of Development Economics, Vol. 36, pp 353-72.
Virmani, S S, E A Siddiq & K Muralidaran (1998); Advances in Hybrid Rice Technology (ed.),
IRRI, Los Banos, Manila, Philippines.
Shoba, Rani N, Prasad, GSV; Shailaja, ASR, Muthuraman, B, Meera, P & Sheikh, N & Viraktamath
BC (2010); Rice Almanac of India, Hyderabad: Directorate of Rice Research.
Viraktamath, BC (2010); Hybrid Rice in India--- Current Status and Future Prospects, Hyderabad:
Directorate of Rice Research.
Janaiah, A (2003); Hybrid Rice in Andhra Pradesh: Findings of a Survey, Economic and Political
Weekly, Vol. 38, No. 25, June 21-27, pp 2513-2516.
Chengappa, P G; Janaih, A; & Gowda, MVS (2003); Profitability of Hybrid Rice Cultivation:
Evidence from Karnataka, Economic & Political Weekly, Vol. 38, No. 25, June 21-27, pp 2531-2534.
Ramasamy, C; Aldas Janaiah, K N Selvaraj & M Hossain (2003); Hybrid Rice in Tamil Nadu:
Evaluation of Farmer’s Experience, Economic & Political Weekly, June 21-27.
Janaiah, A (2002); Hybrid Rice for Indian Farmers--- Myths and Realities, Economic & Political
Weekly, Vol. 37, No. 42, Oct., 19-25, pp 4319-4328.
76
Comments on the ‘Draft Report’ on “Spread of New Varieties of Hybrid Rice and their Impact on the overall Production and Productivity – in the state of Bihar".
Report by AERC, Bhagalpur
A. The Date of Receipt of the draft Report ................... 05/08/2013.
B. The Coordinator`s comment dispatched on ............... 14/08/2013.
Comments: 1. The Report is well drafted, where all the objectives have been addressed properly.
2. a) In the First Chapter under 1.4 (Database, Sampling Design. Methodology and Coverage), in case of secondary data one statement should be included to arrive at the conclusion regarding trends in APY of rice Viz. 1984-85 to 1993-94, 1994-95 to 2003-2004 and 2004-2005 to 2009-2010 to have a glimpse over the pre and post introduction of hybrid rice across Per iod-I, Period-II and Period-III respectively. 2. b) The reference years in the study design are mentioned as 2009-2010 and 2010-2011, but here the reference years have been taken as 2008-2009 and 2009-2010. This variation should be explained. 3. In most of the chapters sequences of sub-chapters (numbering and heading) are not maintained accordingly and it starts from the sub chapter 2.3 in page number 13. In Chapter III, IV, and chapter V such type of mis-numbering is also found. It will create difficulties to the coordinator during consolidation of the studies. Please rectify. 4. In Chapter III analyses of determinants of participation in Hybrid Rice Cultivation are not found. This is extremely important to assess the role of determining factors for introduction of Hybrid Rice in the respective States. 5. The Chapter IV is abruptly ended without explaining the Yield Response Function for Inbred Rice as mentioned in the Study design. 6. Chapters V, VI and VII are well drafted barring the disorganized design of sub-chapter sequences.
7. In case of Policy Implications (in Chapter VIII) some points are repeated viz. Point 1 and 2 can be merged into one. Suggestions need to be more concretized. Overall presentation and acceptability of the Report:-
77
The Report may be accepted after the necessary modifications and corrections are done. Comments prepared by Mr. K.S. Chattopadhyay, Coordinator for this Study. Kindly acknowledge the receipt of these comments. ---- DR. SAUMYA CHAKRABARTI. ASSOCIATE PROFESSOR OF ECONOMICS, HONY. DIRECTOR, AGRO-ECONOMIC RESEARCH CENTRE; VISVA-BHARATI (UNIVERSITY), SANTINIKETAN; INDIA.
Alternative Emails: [email protected] and [email protected].
Personal Website: https://sites.google.com/a/visva-bharati.ac.in/saumya-chakrabarti-economics/ AERC Website: http://www.visva-bharati.ac.in/InstitutionsCentresSchools/Contents/AERC-DETAIL/aerc-detail.htm/
Appendix –II
ACTION TAKEN REPORT
Name of the Study : Spread of New Varieties of Hybr id Rice and their Impact
on the Overall Production and Productivity in Bihar Date of received comments : 16/08/2013 Date of dispatch of Report : 10/09/2013 Comment wise Action Taken 1. No action is required.
2 (a) Corrections made accordingly by incorporating in the report at proper place. (b) The variation in reference years is due to mistake at our end while comparing
from the manuscript. Necessary corrections made accordingly. 3. The chapter sequences of sub-chapters (numbering and heading) rectified
accordingly in all the chapters.
4. It could not be incorporated as per the comments but meaningful determinants can be seen from the section 3.5 and table Nos. 3.5 to 3.8.
5. In lack of statistical staff in this Centre, it could not be statistically presented.
However, the tabular analysis made in this chapter (IV) is sufficient to cover the objectives of the study.
78
6. Sub-chapter sequences of chapter V, VI & VII have been corrected. 7. Point – I & Point – II of policy implication in chapter – VIII have been merged
in one point.
Rambalak Choudhary Research Officer -Cum-Project Leader


![Aerc%20 Presentation[1]](https://img.pdfslide.us/doc/110x75/558650dcd8b42a1b498b4704/aerc20-presentation1.jpg)