Embed Size (px)
Citation preview
CHAPTER I
FUNCTIONING OF
POWER SECTOR PSUs

PART - I
Chapter I
Functioning of Power Sector PSUs
Introduction
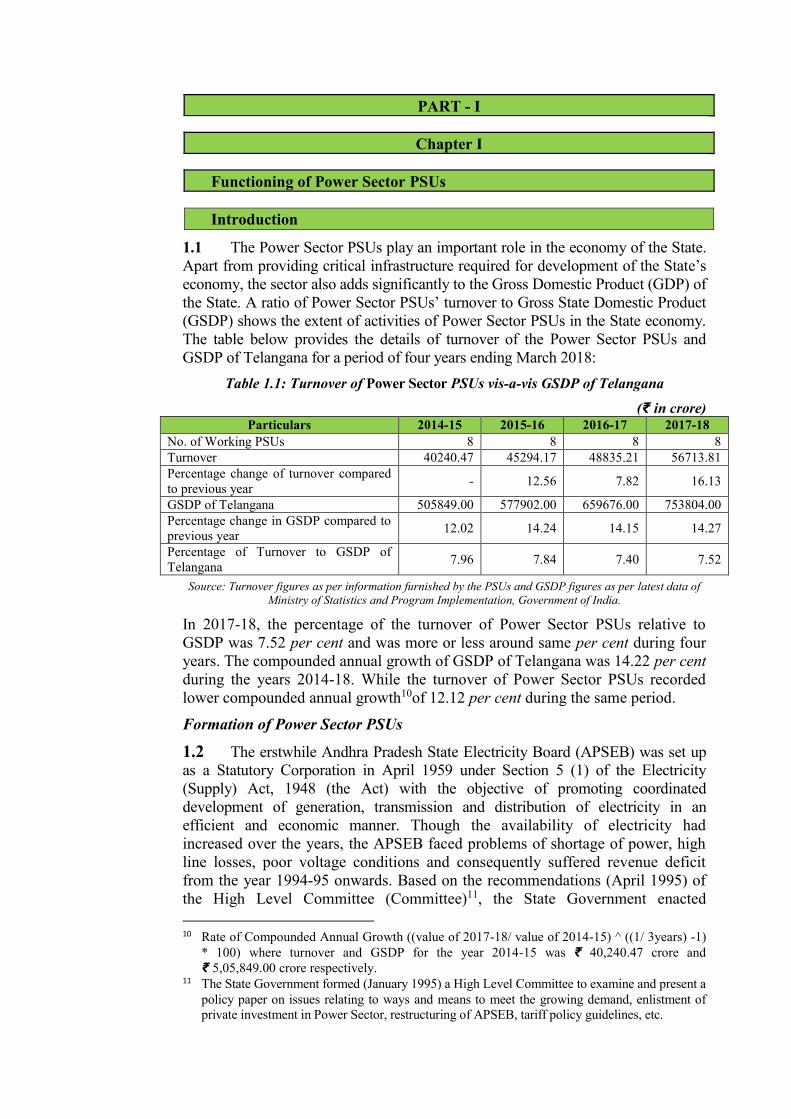
1.1 The Power Sector PSUs play an important role in the economy of the State. Apart from providing critical infrastructure required for development of the State’s economy, the sector also adds significantly to the Gross Domestic Product (GDP) of the State. A ratio of Power Sector PSUs’ turnover to Gross State Domestic Product (GSDP) shows the extent of activities of Power Sector PSUs in the State economy. The table below provides the details of turnover of the Power Sector PSUs and GSDP of Telangana for a period of four years ending March 2018:
Table 1.1: Turnover of Power Sector PSUs vis-a-vis GSDP of Telangana
(₹ in crore) Particulars 2014-15 2015-16 2016-17 2017-18
No. of Working PSUs 8 8 8 8 Turnover 40240.47 45294.17 48835.21 56713.81 Percentage change of turnover compared to previous year - 12.56 7.82 16.13
GSDP of Telangana 505849.00 577902.00 659676.00 753804.00 Percentage change in GSDP compared to previous year 12.02 14.24 14.15 14.27
Percentage of Turnover to GSDP of Telangana 7.96 7.84 7.40 7.52
Source: Turnover figures as per information furnished by the PSUs and GSDP figures as per latest data of Ministry of Statistics and Program Implementation, Government of India.
In 2017-18, the percentage of the turnover of Power Sector PSUs relative to GSDP was 7.52 per cent and was more or less around same per cent during four years. The compounded annual growth of GSDP of Telangana was 14.22 per cent during the years 2014-18. While the turnover of Power Sector PSUs recorded lower compounded annual growth10of 12.12 per cent during the same period.
Formation of Power Sector PSUs
1.2 The erstwhile Andhra Pradesh State Electricity Board (APSEB) was set up as a Statutory Corporation in April 1959 under Section 5 (1) of the Electricity (Supply) Act, 1948 (the Act) with the objective of promoting coordinated development of generation, transmission and distribution of electricity in an efficient and economic manner. Though the availability of electricity had increased over the years, the APSEB faced problems of shortage of power, high line losses, poor voltage conditions and consequently suffered revenue deficit from the year 1994-95 onwards. Based on the recommendations (April 1995) of the High Level Committee (Committee)11, the State Government enacted 10 Rate of Compounded Annual Growth ((value of 2017-18/ value of 2014-15) ^ ((1/ 3years) -1)
* 100) where turnover and GSDP for the year 2014-15 was ₹ 40,240.47 crore and ₹ 5,05,849.00 crore respectively.
11 The State Government formed (January 1995) a High Level Committee to examine and present a policy paper on issues relating to ways and means to meet the growing demand, enlistment of private investment in Power Sector, restructuring of APSEB, tariff policy guidelines, etc.
Audit Report on Economic Sector and Public Sector Undertakings for the year ended 31 March 2018
12
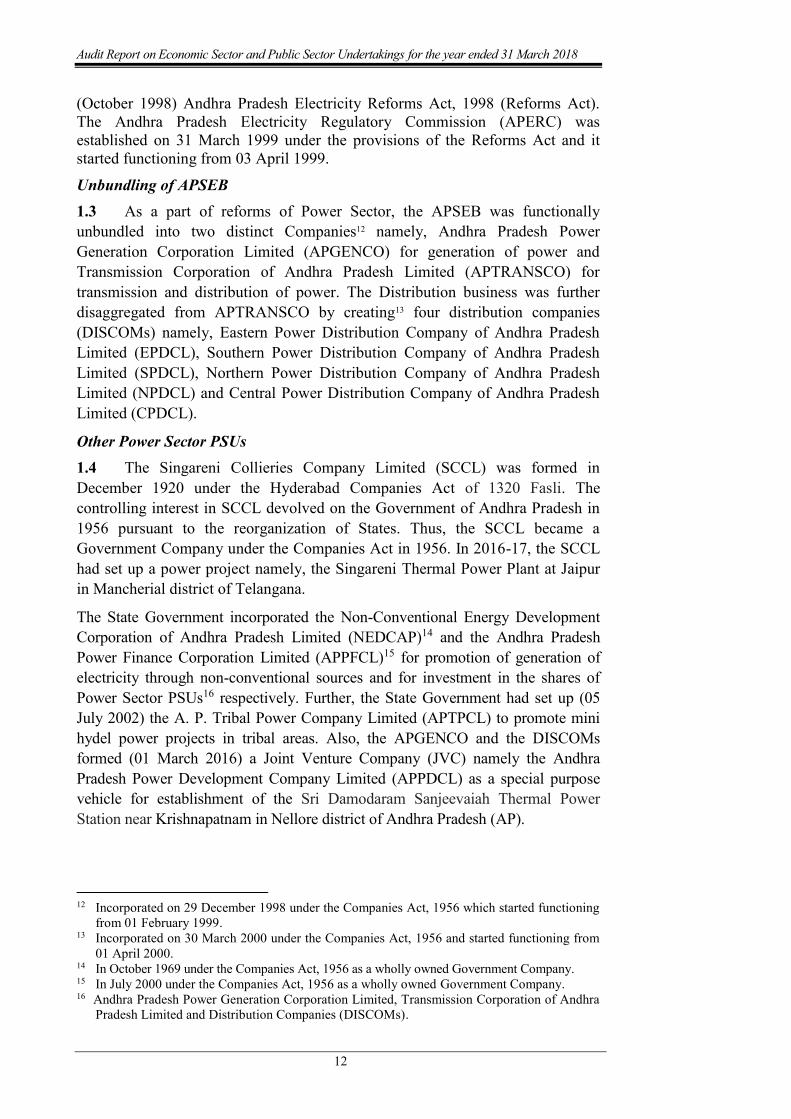
(October 1998) Andhra Pradesh Electricity Reforms Act, 1998 (Reforms Act). The Andhra Pradesh Electricity Regulatory Commission (APERC) was established on 31 March 1999 under the provisions of the Reforms Act and it started functioning from 03 April 1999.
Unbundling of APSEB 1.3 As a part of reforms of Power Sector, the APSEB was functionally unbundled into two distinct Companies12 namely, Andhra Pradesh Power Generation Corporation Limited (APGENCO) for generation of power and Transmission Corporation of Andhra Pradesh Limited (APTRANSCO) for transmission and distribution of power. The Distribution business was further disaggregated from APTRANSCO by creating13 four distribution companies (DISCOMs) namely, Eastern Power Distribution Company of Andhra Pradesh Limited (EPDCL), Southern Power Distribution Company of Andhra Pradesh Limited (SPDCL), Northern Power Distribution Company of Andhra Pradesh Limited (NPDCL) and Central Power Distribution Company of Andhra Pradesh Limited (CPDCL).
Other Power Sector PSUs 1.4 The Singareni Collieries Company Limited (SCCL) was formed in December 1920 under the Hyderabad Companies Act of 1320 Fasli. The controlling interest in SCCL devolved on the Government of Andhra Pradesh in 1956 pursuant to the reorganization of States. Thus, the SCCL became a Government Company under the Companies Act in 1956. In 2016-17, the SCCL had set up a power project namely, the Singareni Thermal Power Plant at Jaipur in Mancherial district of Telangana.
The State Government incorporated the Non-Conventional Energy Development Corporation of Andhra Pradesh Limited (NEDCAP)14 and the Andhra Pradesh Power Finance Corporation Limited (APPFCL)15 for promotion of generation of electricity through non-conventional sources and for investment in the shares of Power Sector PSUs16 respectively. Further, the State Government had set up (05 July 2002) the A. P. Tribal Power Company Limited (APTPCL) to promote mini hydel power projects in tribal areas. Also, the APGENCO and the DISCOMs formed (01 March 2016) a Joint Venture Company (JVC) namely the Andhra Pradesh Power Development Company Limited (APPDCL) as a special purpose vehicle for establishment of the Sri Damodaram Sanjeevaiah Thermal Power Station near Krishnapatnam in Nellore district of Andhra Pradesh (AP).
12 Incorporated on 29 December 1998 under the Companies Act, 1956 which started functioning
from 01 February 1999. 13 Incorporated on 30 March 2000 under the Companies Act, 1956 and started functioning from
01 April 2000. 14 In October 1969 under the Companies Act, 1956 as a wholly owned Government Company. 15 In July 2000 under the Companies Act, 1956 as a wholly owned Government Company. 16 Andhra Pradesh Power Generation Corporation Limited, Transmission Corporation of Andhra
Pradesh Limited and Distribution Companies (DISCOMs).
Chapter I - Functioning of Power Sector PSUs
13
Reorganisation of State 1.5 Telangana State was formed on 02 June 201417, following bifurcation of erstwhile composite State of AP. Under, the AP Reorganisation Act, 2014, a PSU shall pass to that State where it is exclusively located in or its operations are exclusively confined. Assets and liabilities of PSUs with interstate operations was to be apportioned between the two States as under:
The operational units on location basis; and The headquarters on the basis of population ratio.
As on the date of bifurcation of erstwhile composite State of AP, the APGENCO, the APTRANSCO, the APPFCL and the NEDCAP had interstate operations. Therefore, these entities were bifurcated into AP and Telangana units. Separate Companies namely Telangana State Power Generation Corporation Limited (TSGENCO), Transmission Corporation of Telangana Limited (TSTRANSCO), Telangana Power Finance Corporation Limited (TPFCL) and Telangana State Renewable Energy Development Corporation Limited (TSREDCL) were formed18 under the Companies Act, 2013 in respect of Telangana units. The transfer of assets and liabilities of these demerged PSUs was, however, yet to be completed. Of the four DISCOMs, two DISCOMs namely, Central Power Distribution Company of Andhra Pradesh Limited (CPDCL) & Northern Power Distribution Company of Andhra Pradesh Limited (NPDCL) were allotted exclusively to Telangana and renamed as Southern Power Distribution Company of Telangana Limited (TSSPDCL) and Northern Power Distribution Company of Telangana Limited (TSNPDCL). The two other DISCOMs namely, EPDCL & SPDCL were allotted exclusively to AP. As the operations of SCCL were confined to coal mine areas located in Telangana, the SCCL was treated as PSU exclusive to Telangana. The JVC namely, the APPDCL was allotted exclusively to AP. Thus, as on 31 March 2018, there were eight working Power Sector PSUs19 in the State of Telangana. All the Power Sector PSUs allocated to Telangana State are functioning under the administrative control of the Energy Department of the State Government. The APTPCL however, was still under demerger (separate unit for Telangana State is yet to be formed) though the De-merger Plan was approved (August 2017) by the Expert Committee20.
Restructuring, Disinvestment and Privatisation of Power Sector PSUs
1.6 The Power Sector PSUs are engaged in all the power supply activities of generation, transmission and distribution of electricity. None of the Power Sector PSUs was listed on the stock exchange(s). There are no statutory corporations in the Power Sector of the State. There was no information of any proposals for disinvestment and privatization of the Power Sector PSUs of the Telangana State.
17 Effective Date of Bifurcation of Government Companies/ Date of formation of Telangana State. 18 TSGENCO (19.05.2014), TSTRANSCO (29.05.2014), TPFCL (31.07.2014) and TSREDCL
(08.08.2014). 19 3 PSUs exclusive to Telangana, 4 PSUs formed due to demerger and 1 PSU under demerger. 20 Sheela Bhide Committee was appointed (May/ June 2014) by the State Government of erstwhile
AP to review and approve the demerger proposals of all the Government Companies, Corporations and Entities notified in Schedule 9 of the AP Reorganisation Act, 2014.
Audit Report on Economic Sector and Public Sector Undertakings for the year ended 31 March 2018
14
Investment in Power Sector PSUs
1.7 The activity wise investment (capital and long-term loans) in the Power Sector PSUs as on 31March 2018 is detailed below:
Table 1.2: Total investment in Power Sector PSUs (₹ in crore)
Activity Number of PSUs Equity$ Long term
loans* Total
Generation of Power 3 2603.09 19684.71 22287.80 Transmission of Power 1 0.05 5585.26 5585.31 Distribution of Power 2 8610.30 7950.20 16560.50 Others 2 0.19 3512.57 3512.76 Total 8 11213.63 36732.74 47946.37
Source: Based on information furnished by PSUs
$ Equity includes share application money
* The long-term loans include loans from Central and State Governments, Public Financial Institutions and Commercial Banks.
As on 31 March 2018, 23.39 per cent and 76.61 per cent of the total investment in Power Sector PSUs comprised of equity capital and long-term loans respectively. The long-term loans in Power Sector PSUs consisted of ₹ 4,509.85 crore (12.28 per cent) advanced by the State Government and ₹ 32,222.89 crore (87.72 per cent) raised from other sources. During 2016-17 and 2017-18, the State Government had taken over ₹ 8,922.81 crore (75 per cent) of the outstanding debts (₹ 11,897.08 crore) of the DISCOMs as on 30 September 2015 and released ₹ 7,723.00 crore (as on 31st March 2018) as equity contribution under Ujwal DISCOM Assurance Yojana21 (UDAY) scheme. Equity shares were, however, issued for ₹ 2,846.17 crore only as the allotment of shares for balance equity contribution was not completed by the end of March 2018.
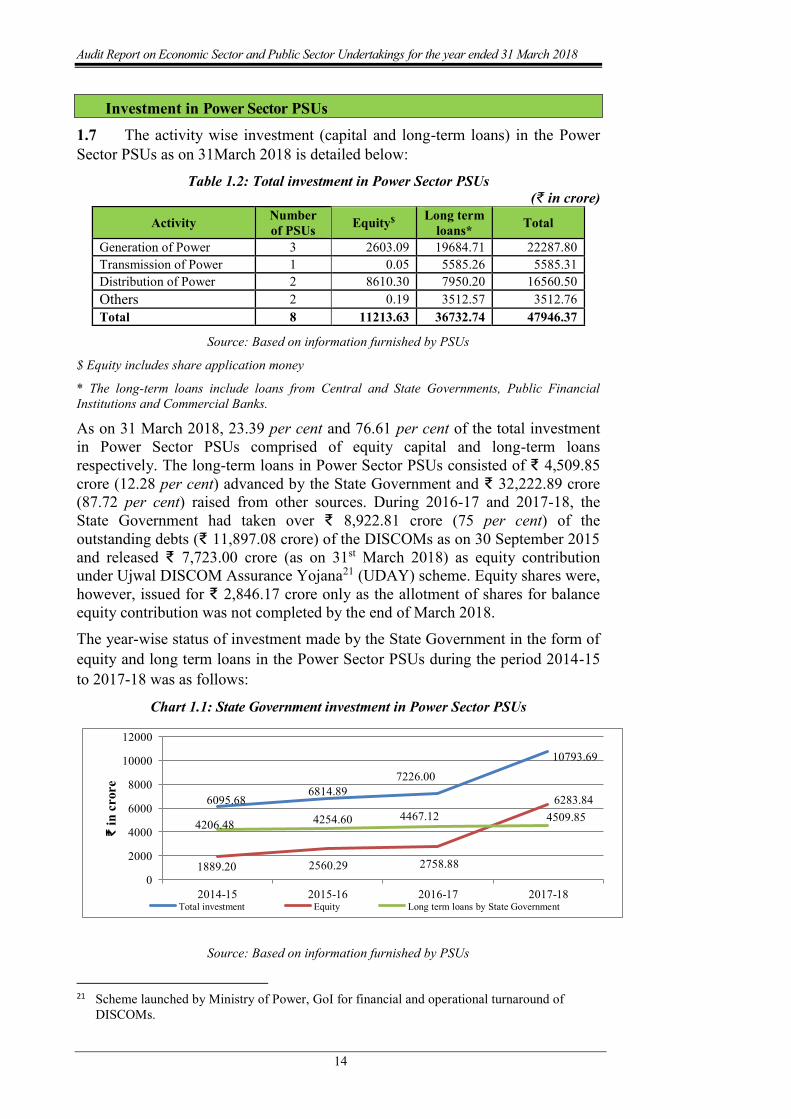
The year-wise status of investment made by the State Government in the form of equity and long term loans in the Power Sector PSUs during the period 2014-15 to 2017-18 was as follows:
Chart 1.1: State Government investment in Power Sector PSUs
6095.686814.89
7226.00
10793.69
1889.20 2560.29 2758.88
6283.84
4206.48 4254.60 4467.12 4509.85
0
2000
4000
6000
8000
10000
12000
2014-15 2015-16 2016-17 2017-18
₹ in
cro
re
Total investment Equity Long term loans by State Government
Source: Based on information furnished by PSUs
21 Scheme launched by Ministry of Power, GoI for financial and operational turnaround of
DISCOMs.
Chapter I - Functioning of Power Sector PSUs
15
Budgetary support to Power Sector PSUs
1.8 The State Government provided financial support to Power Sector PSUs in various forms through annual budget. The summarized details of budgetary outgo towards equity, loans, grants/ subsidies, loans converted into equity, interest written off and guarantees issued/ outstanding in respect of Power Sector PSUs for the last four years ending March 2018 are as follows:
Table 1.3: Details regarding budgetary support to Power Sector PSUs (₹ in crore)
Sl. No. Particulars
2014-15 2015-16 2016-17 2017-18 No. of
PSUs Amount
No. of
PSUs Amount
No. of
PSUs Amount
No. of
PSUs Amount
1 Equity capital outgo from budget 4 346.20 1 523.59 2 2262.62 2 2498.29
2 Loans given from budget 0 0.00 0 0 0 0.00 0 0.00
3 Grants/Subsidy given from budget 4 3539.40 4 3967.39 4 4418.68 4 4253.16
4 Total Outgo 522 3885.60 622 4490.98 522 6681.30 422 6751.45 5 Loans converted
into equity 0 0 0 0.00 0 0.00 1 2,846.17
6 Interest/ Penal interest written off 0 0 0 0.00 0 0.00 0 0.00
7 Guarantees issued23 0 0 0 0.00 0 0.00 0 0.00
8 Guarantee Commitment24 4 11316.16 4 9495.06 4 6760.80 5 7989.69
Source: Based on information furnished by PSUs
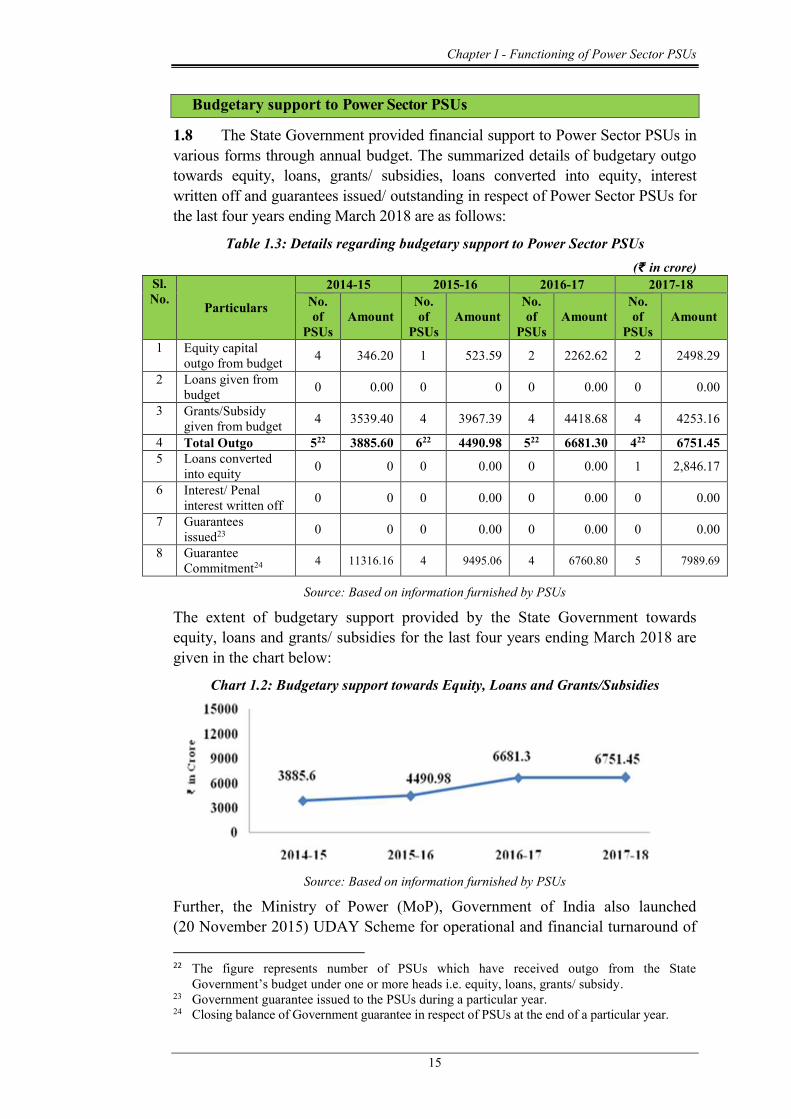
The extent of budgetary support provided by the State Government towards equity, loans and grants/ subsidies for the last four years ending March 2018 are given in the chart below:
Chart 1.2: Budgetary support towards Equity, Loans and Grants/Subsidies
Source: Based on information furnished by PSUs
Further, the Ministry of Power (MoP), Government of India also launched (20 November 2015) UDAY Scheme for operational and financial turnaround of 22 The figure represents number of PSUs which have received outgo from the State
Government’s budget under one or more heads i.e. equity, loans, grants/ subsidy. 23 Government guarantee issued to the PSUs during a particular year. 24 Closing balance of Government guarantee in respect of PSUs at the end of a particular year.
Audit Report on Economic Sector and Public Sector Undertakings for the year ended 31 March 2018
16
the DISCOMs. The provisions of UDAY and status of implementation of the scheme by the DISCOMs are discussed under Para 1.23 of this Chapter.
The addition of ₹ 2,498.29 crore in equity of Power Sector PSUs during 2017-18 was through cash induction while outstanding loans amounting to ₹ 2,846.17 crore were converted into equity during 2017-18 under UDAY scheme. The addition in equity was done in the DISCOMs to plough back the power purchase dues to TSGENCO/ TSTRANSCO and to meet the expenditure on Electricity Duty, VAT and Royalty payable to the State Government. There was marginal decrease in the subsidy/ grants provided by the State Government during the year 2017-18 (₹ 4,253.16 crore) in comparison to previous year ₹ 4,418.68 crore). During 2017-18, subsidy/ grant was given mainly towards tariff subsidy to DISCOMs (₹ 3,928.29 crore).
Guarantee fee 1.9 State Government helps the Power Sector PSUs to raise loans from banks and Public Financial Institutions by giving guarantee for repayment of principal and interest. For this purpose, the State Government charges guarantee commission of 0.50 per cent per annum or two per cent consolidated for the entire guarantee period as decided by the State Government, depending upon the loanees. The outstanding guarantee commitment given for the Power Sector PSUs increased by 18 per cent from ₹ 6,760.80 crore in 2016-17 to ₹ 7,989.69 crore in 2017-18. The Power Sector PSUs have, however, not furnished to audit the details of outstanding Guarantee Fee payable by them.
Reconciliation with Finance Accounts of the State Government
1.10 The figures in respect of equity, loans and guarantees outstanding as per records of Power Sector PSUs should agree with that of the figures appearing in the Finance Accounts of the State. In case the figures do not agree, the PSUs concerned and the Finance Department should carry out reconciliation of differences. The position in this regard as at 31 March 2018 was as follows:
Table 1.4: Equity, loans, guarantees outstanding as per Finance Accounts vis-a-vis records of Power Sector PSUs
(₹ in crore)
Outstanding in respect of
No. of PSUs
Amount as per Finance
Accounts
Amount as per records of PSUs Difference
(A) (B) (C) (D) (E) = (C)-(D) Equity$ 2 13218.89 4528.2 0 8690.69 Loans$ 3 287.35 3967.69 (-) 3680.34
Guarantees 5 2965.87 4,628.99 (-) 1663.12
Source: Based on Finance Accounts and information furnished by PSUs
$ Information in respect of only those PSUs whose equity and loans were bifurcated on demerger as per finance accounts is considered
It was observed that the differences in the figures of Equity were due to accounting the State Government Investments as Share Application Money
Chapter I - Functioning of Power Sector PSUs
17
pending allotment of shares. The differences in Loans and Guarantees were however, pending reconciliation since long. The matter was taken up (December 2018) with the State Government and replies were awaited. The State Government and the Power Sector PSUs should take concrete steps to reconcile the differences in a time bound manner.
Submission of accounts by Power Sector PSUs
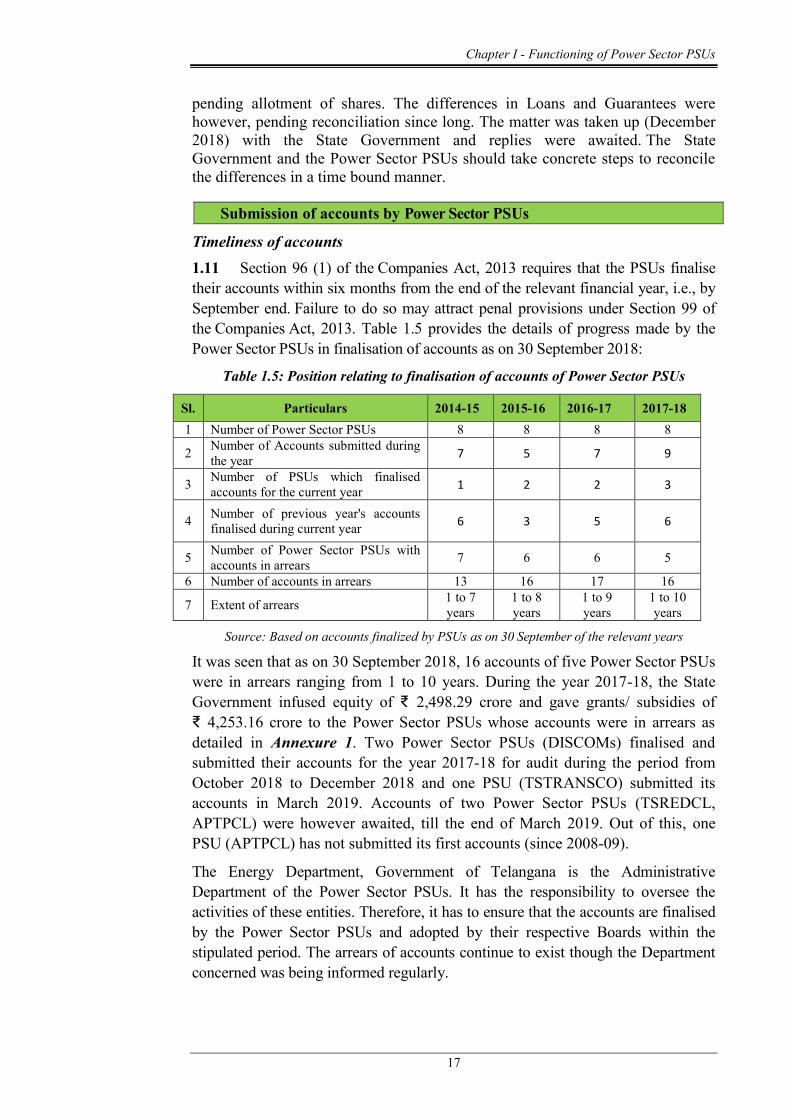
Timeliness of accounts 1.11 Section 96 (1) of the Companies Act, 2013 requires that the PSUs finalise their accounts within six months from the end of the relevant financial year, i.e., by September end. Failure to do so may attract penal provisions under Section 99 of the Companies Act, 2013. Table 1.5 provides the details of progress made by the Power Sector PSUs in finalisation of accounts as on 30 September 2018:
Table 1.5: Position relating to finalisation of accounts of Power Sector PSUs
Sl. Particulars 2014-15 2015-16 2016-17 2017-18 1 Number of Power Sector PSUs 8 8 8 8
2 Number of Accounts submitted during the year 7 5 7 9
3 Number of PSUs which finalised accounts for the current year 1 2 2 3
4 Number of previous year's accounts finalised during current year 6 3 5 6
5 Number of Power Sector PSUs with accounts in arrears 7 6 6 5
6 Number of accounts in arrears 13 16 17 16
7 Extent of arrears 1 to 7 years
1 to 8 years
1 to 9 years
1 to 10 years
Source: Based on accounts finalized by PSUs as on 30 September of the relevant years
It was seen that as on 30 September 2018, 16 accounts of five Power Sector PSUs were in arrears ranging from 1 to 10 years. During the year 2017-18, the State Government infused equity of ₹ 2,498.29 crore and gave grants/ subsidies of ₹ 4,253.16 crore to the Power Sector PSUs whose accounts were in arrears as detailed in Annexure 1. Two Power Sector PSUs (DISCOMs) finalised and submitted their accounts for the year 2017-18 for audit during the period from October 2018 to December 2018 and one PSU (TSTRANSCO) submitted its accounts in March 2019. Accounts of two Power Sector PSUs (TSREDCL, APTPCL) were however awaited, till the end of March 2019. Out of this, one PSU (APTPCL) has not submitted its first accounts (since 2008-09).
The Energy Department, Government of Telangana is the Administrative Department of the Power Sector PSUs. It has the responsibility to oversee the activities of these entities. Therefore, it has to ensure that the accounts are finalised by the Power Sector PSUs and adopted by their respective Boards within the stipulated period. The arrears of accounts continue to exist though the Department concerned was being informed regularly.
Audit Report on Economic Sector and Public Sector Undertakings for the year ended 31 March 2018
18
Impact of non-finalisation of accounts 1.12 As pointed out above, the delay in finalisation of accounts may also result in risk of fraud and leakage of public money. It is also in violation of the provisions of the relevant Statutes. In view of the above state of arrears of accounts, it is recommended that the State Government may:
set up a cell to oversee the clearance of arrears and set the targets for individual PSU which would be monitored by the cell;
consider outsourcing the work relating to preparation of accounts, wherever the staff is inadequate or lacks expertise.
Performance of Power Sector PSUs
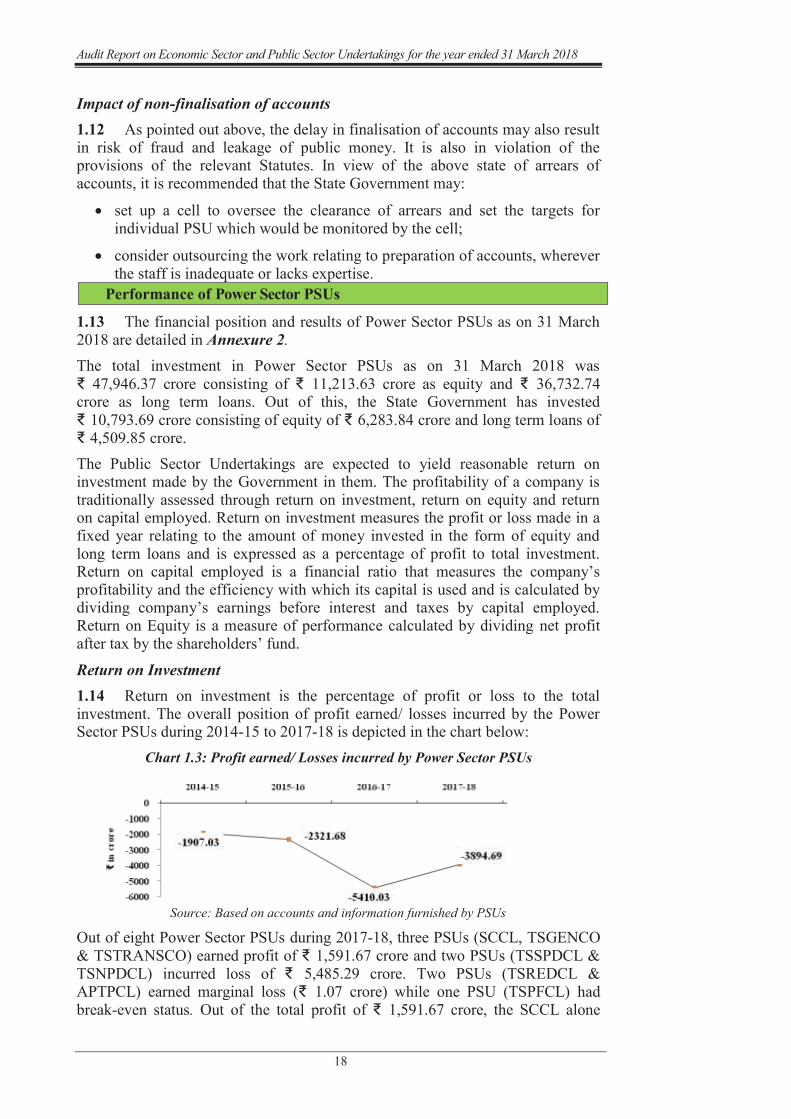
1.13 The financial position and results of Power Sector PSUs as on 31 March 2018 are detailed in Annexure 2. The total investment in Power Sector PSUs as on 31 March 2018 was ₹ 47,946.37 crore consisting of ₹ 11,213.63 crore as equity and ₹ 36,732.74 crore as long term loans. Out of this, the State Government has invested ₹ 10,793.69 crore consisting of equity of ₹ 6,283.84 crore and long term loans of ₹ 4,509.85 crore. The Public Sector Undertakings are expected to yield reasonable return on investment made by the Government in them. The profitability of a company is traditionally assessed through return on investment, return on equity and return on capital employed. Return on investment measures the profit or loss made in a fixed year relating to the amount of money invested in the form of equity and long term loans and is expressed as a percentage of profit to total investment. Return on capital employed is a financial ratio that measures the company’s profitability and the efficiency with which its capital is used and is calculated by dividing company’s earnings before interest and taxes by capital employed. Return on Equity is a measure of performance calculated by dividing net profit after tax by the shareholders’ fund. Return on Investment 1.14 Return on investment is the percentage of profit or loss to the total investment. The overall position of profit earned/ losses incurred by the Power Sector PSUs during 2014-15 to 2017-18 is depicted in the chart below:
Chart 1.3: Profit earned/ Losses incurred by Power Sector PSUs
Source: Based on accounts and information furnished by PSUs
Out of eight Power Sector PSUs during 2017-18, three PSUs (SCCL, TSGENCO & TSTRANSCO) earned profit of ₹ 1,591.67 crore and two PSUs (TSSPDCL & TSNPDCL) incurred loss of ₹ 5,485.29 crore. Two PSUs (TSREDCL & APTPCL) earned marginal loss (₹ 1.07 crore) while one PSU (TSPFCL) had break-even status. Out of the total profit of ₹ 1,591.67 crore, the SCCL alone
Chapter I - Functioning of Power Sector PSUs
19
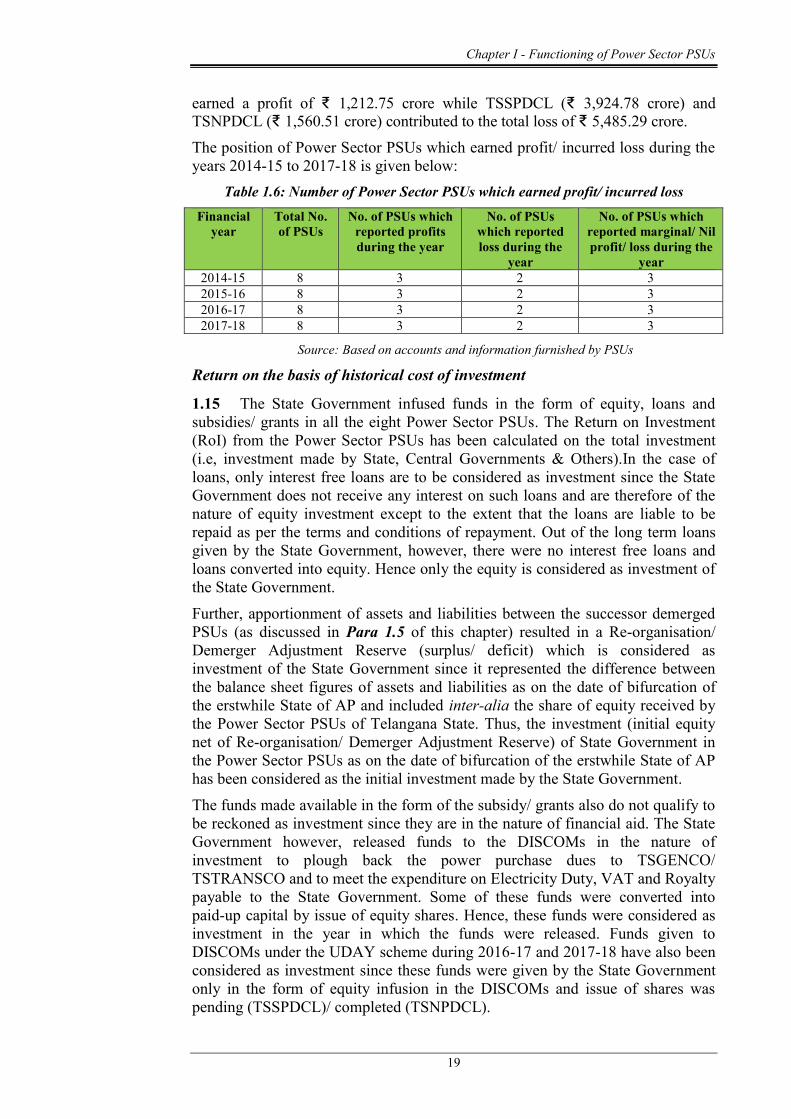
earned a profit of ₹ 1,212.75 crore while TSSPDCL (₹ 3,924.78 crore) and TSNPDCL (₹ 1,560.51 crore) contributed to the total loss of ₹ 5,485.29 crore. The position of Power Sector PSUs which earned profit/ incurred loss during the years 2014-15 to 2017-18 is given below:
Table 1.6: Number of Power Sector PSUs which earned profit/ incurred loss Financial
year Total No. of PSUs
No. of PSUs which reported profits during the year
No. of PSUs which reported loss during the
year
No. of PSUs which reported marginal/ Nil profit/ loss during the
year 2014-15 8 3 2 3 2015-16 8 3 2 3 2016-17 8 3 2 3 2017-18 8 3 2 3
Source: Based on accounts and information furnished by PSUs
Return on the basis of historical cost of investment
1.15 The State Government infused funds in the form of equity, loans and subsidies/ grants in all the eight Power Sector PSUs. The Return on Investment (RoI) from the Power Sector PSUs has been calculated on the total investment (i.e, investment made by State, Central Governments & Others).In the case of loans, only interest free loans are to be considered as investment since the State Government does not receive any interest on such loans and are therefore of the nature of equity investment except to the extent that the loans are liable to be repaid as per the terms and conditions of repayment. Out of the long term loans given by the State Government, however, there were no interest free loans and loans converted into equity. Hence only the equity is considered as investment of the State Government. Further, apportionment of assets and liabilities between the successor demerged PSUs (as discussed in Para 1.5 of this chapter) resulted in a Re-organisation/ Demerger Adjustment Reserve (surplus/ deficit) which is considered as investment of the State Government since it represented the difference between the balance sheet figures of assets and liabilities as on the date of bifurcation of the erstwhile State of AP and included inter-alia the share of equity received by the Power Sector PSUs of Telangana State. Thus, the investment (initial equity net of Re-organisation/ Demerger Adjustment Reserve) of State Government in the Power Sector PSUs as on the date of bifurcation of the erstwhile State of AP has been considered as the initial investment made by the State Government. The funds made available in the form of the subsidy/ grants also do not qualify to be reckoned as investment since they are in the nature of financial aid. The State Government however, released funds to the DISCOMs in the nature of investment to plough back the power purchase dues to TSGENCO/ TSTRANSCO and to meet the expenditure on Electricity Duty, VAT and Royalty payable to the State Government. Some of these funds were converted into paid-up capital by issue of equity shares. Hence, these funds were considered as investment in the year in which the funds were released. Funds given to DISCOMs under the UDAY scheme during 2016-17 and 2017-18 have also been considered as investment since these funds were given by the State Government only in the form of equity infusion in the DISCOMs and issue of shares was pending (TSSPDCL)/ completed (TSNPDCL).
Audit Report on Economic Sector and Public Sector Undertakings for the year ended 31 March 2018
20
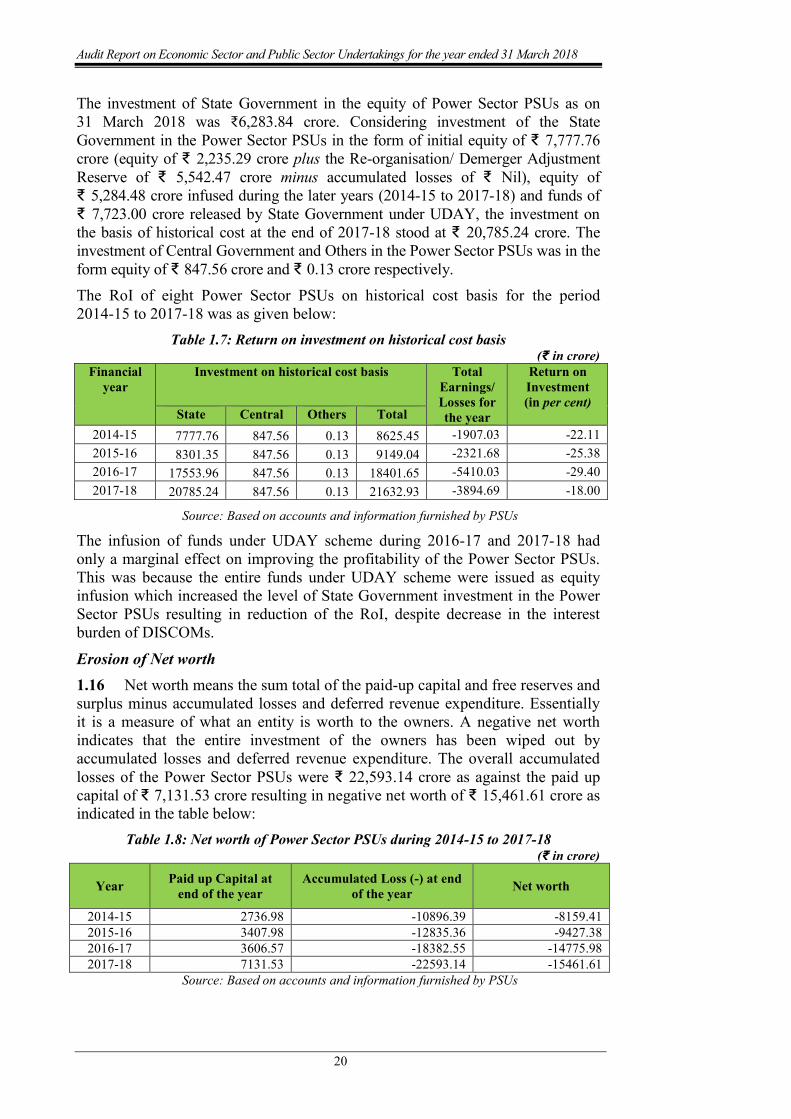
The investment of State Government in the equity of Power Sector PSUs as on 31 March 2018 was ₹6,283.84 crore. Considering investment of the State Government in the Power Sector PSUs in the form of initial equity of ₹ 7,777.76 crore (equity of ₹ 2,235.29 crore plus the Re-organisation/ Demerger Adjustment Reserve of ₹ 5,542.47 crore minus accumulated losses of ₹ Nil), equity of ₹ 5,284.48 crore infused during the later years (2014-15 to 2017-18) and funds of ₹ 7,723.00 crore released by State Government under UDAY, the investment on the basis of historical cost at the end of 2017-18 stood at ₹ 20,785.24 crore. The investment of Central Government and Others in the Power Sector PSUs was in the form equity of ₹ 847.56 crore and ₹ 0.13 crore respectively. The RoI of eight Power Sector PSUs on historical cost basis for the period 2014-15 to 2017-18 was as given below:
Table 1.7: Return on investment on historical cost basis (₹ in crore)
Financial year
Investment on historical cost basis Total Earnings/ Losses for the year
Return on Investment (in per cent)
State Central Others Total 2014-15 7777.76 847.56 0.13 8625.45 -1907.03 -22.11 2015-16 8301.35 847.56 0.13 9149.04 -2321.68 -25.38 2016-17 17553.96 847.56 0.13 18401.65 -5410.03 -29.40 2017-18 20785.24 847.56 0.13 21632.93 -3894.69 -18.00
Source: Based on accounts and information furnished by PSUs
The infusion of funds under UDAY scheme during 2016-17 and 2017-18 had only a marginal effect on improving the profitability of the Power Sector PSUs. This was because the entire funds under UDAY scheme were issued as equity infusion which increased the level of State Government investment in the Power Sector PSUs resulting in reduction of the RoI, despite decrease in the interest burden of DISCOMs.
Erosion of Net worth 1.16 Net worth means the sum total of the paid-up capital and free reserves and surplus minus accumulated losses and deferred revenue expenditure. Essentially it is a measure of what an entity is worth to the owners. A negative net worth indicates that the entire investment of the owners has been wiped out by accumulated losses and deferred revenue expenditure. The overall accumulated losses of the Power Sector PSUs were ₹ 22,593.14 crore as against the paid up capital of ₹ 7,131.53 crore resulting in negative net worth of ₹ 15,461.61 crore as indicated in the table below:
Table 1.8: Net worth of Power Sector PSUs during 2014-15 to 2017-18 (₹ in crore)
Year Paid up Capital at end of the year
Accumulated Loss (-) at end of the year Net worth
2014-15 2736.98 -10896.39 -8159.41 2015-16 3407.98 -12835.36 -9427.38 2016-17 3606.57 -18382.55 -14775.98 2017-18 7131.53 -22593.14 -15461.61
Source: Based on accounts and information furnished by PSUs
Chapter I - Functioning of Power Sector PSUs
21
Of the eight Power Sector PSUs during 2014-15 to 2017-18, four PSUs25 showed positive net worth while the net worth of four26 PSUs was in the negative. The net worth was eroded mainly in TSSPDCL (₹ 18,666.55 crore) and TSNPDCL (₹ 5,014.51 crore). The State Government provided financial support to the Power Sector PSUs by infusing equity (paid up capital of ₹ 4,394.55 crore) during the period 2015-18. Despite infusion of substantial equity capital, the accumulated losses of the Power Sector PSUs increased from ₹ 10,896.39 crore in 2014-15 to ₹ 22,593.14 crore in 2017-18. The entire capital infused in the Power Sector PSUs had been eroded and the accumulated losses are increasing every year as the Power Sector PSUs continued to earn negative returns (losses).
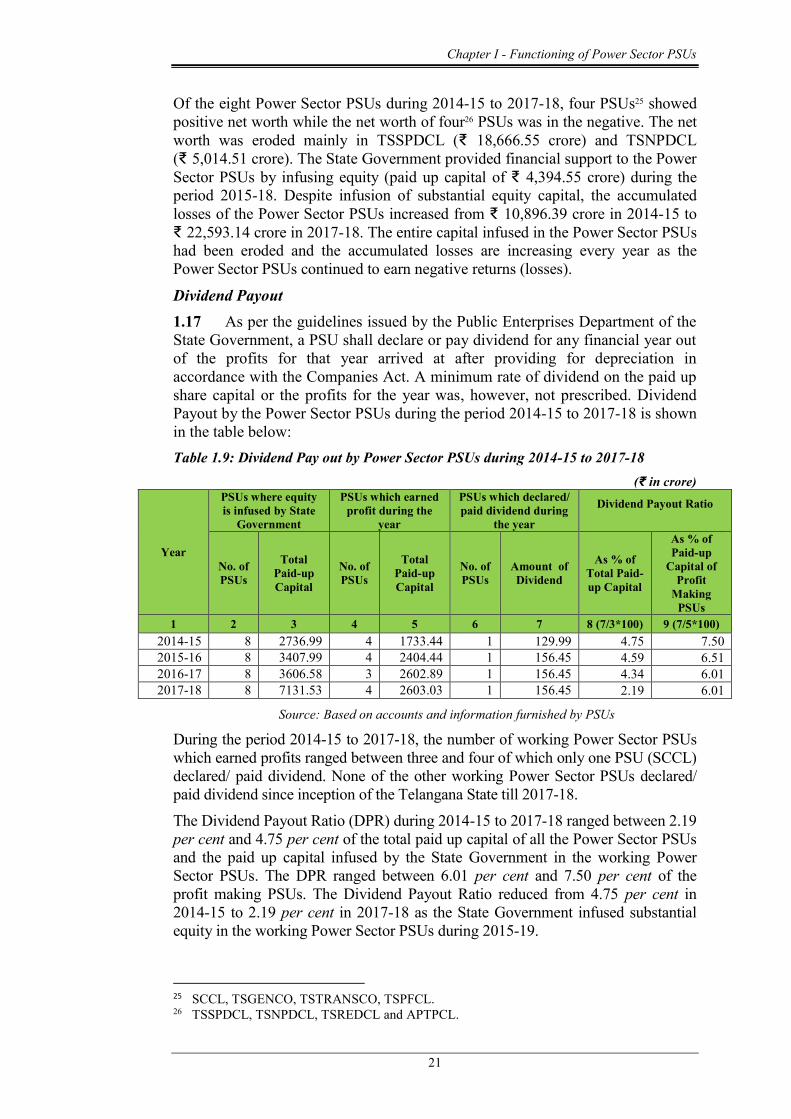
Dividend Payout 1.17 As per the guidelines issued by the Public Enterprises Department of the State Government, a PSU shall declare or pay dividend for any financial year out of the profits for that year arrived at after providing for depreciation in accordance with the Companies Act. A minimum rate of dividend on the paid up share capital or the profits for the year was, however, not prescribed. Dividend Payout by the Power Sector PSUs during the period 2014-15 to 2017-18 is shown in the table below: Table 1.9: Dividend Pay out by Power Sector PSUs during 2014-15 to 2017-18
(₹ in crore)
Year
PSUs where equity is infused by State
Government
PSUs which earned profit during the
year
PSUs which declared/ paid dividend during
the year
Dividend Payout Ratio
No. of PSUs
Total Paid-up Capital
No. of PSUs
Total Paid-up Capital
No. of PSUs
Amount of Dividend
As % of Total Paid-up Capital
As % of Paid-up
Capital of Profit
Making PSUs
1 2 3 4 5 6 7 8 (7/3*100) 9 (7/5*100) 2014-15 8 2736.99 4 1733.44 1 129.99 4.75 7.50 2015-16 8 3407.99 4 2404.44 1 156.45 4.59 6.51 2016-17 8 3606.58 3 2602.89 1 156.45 4.34 6.01 2017-18 8 7131.53 4 2603.03 1 156.45 2.19 6.01
Source: Based on accounts and information furnished by PSUs During the period 2014-15 to 2017-18, the number of working Power Sector PSUs which earned profits ranged between three and four of which only one PSU (SCCL) declared/ paid dividend. None of the other working Power Sector PSUs declared/ paid dividend since inception of the Telangana State till 2017-18. The Dividend Payout Ratio (DPR) during 2014-15 to 2017-18 ranged between 2.19 per cent and 4.75 per cent of the total paid up capital of all the Power Sector PSUs and the paid up capital infused by the State Government in the working Power Sector PSUs. The DPR ranged between 6.01 per cent and 7.50 per cent of the profit making PSUs. The Dividend Payout Ratio reduced from 4.75 per cent in 2014-15 to 2.19 per cent in 2017-18 as the State Government infused substantial equity in the working Power Sector PSUs during 2015-19.
25 SCCL, TSGENCO, TSTRANSCO, TSPFCL. 26 TSSPDCL, TSNPDCL, TSREDCL and APTPCL.
Audit Report on Economic Sector and Public Sector Undertakings for the year ended 31 March 2018
22
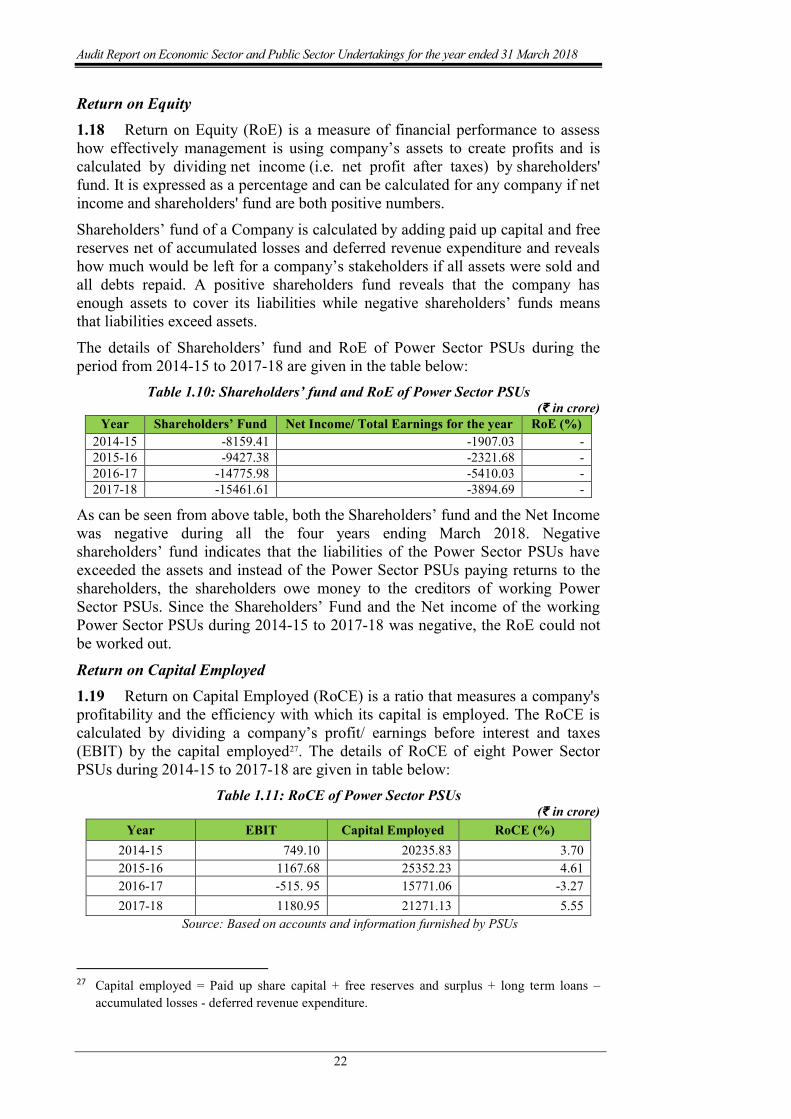
Return on Equity 1.18 Return on Equity (RoE) is a measure of financial performance to assess how effectively management is using company’s assets to create profits and is calculated by dividing net income (i.e. net profit after taxes) by shareholders' fund. It is expressed as a percentage and can be calculated for any company if net income and shareholders' fund are both positive numbers. Shareholders’ fund of a Company is calculated by adding paid up capital and free reserves net of accumulated losses and deferred revenue expenditure and reveals how much would be left for a company’s stakeholders if all assets were sold and all debts repaid. A positive shareholders fund reveals that the company has enough assets to cover its liabilities while negative shareholders’ funds means that liabilities exceed assets. The details of Shareholders’ fund and RoE of Power Sector PSUs during the period from 2014-15 to 2017-18 are given in the table below:
Table 1.10: Shareholders’ fund and RoE of Power Sector PSUs (₹ in crore)
Year Shareholders’ Fund Net Income/ Total Earnings for the year RoE (%) 2014-15 -8159.41 -1907.03 - 2015-16 -9427.38 -2321.68 - 2016-17 -14775.98 -5410.03 - 2017-18 -15461.61 -3894.69 -
As can be seen from above table, both the Shareholders’ fund and the Net Income was negative during all the four years ending March 2018. Negative shareholders’ fund indicates that the liabilities of the Power Sector PSUs have exceeded the assets and instead of the Power Sector PSUs paying returns to the shareholders, the shareholders owe money to the creditors of working Power Sector PSUs. Since the Shareholders’ Fund and the Net income of the working Power Sector PSUs during 2014-15 to 2017-18 was negative, the RoE could not be worked out.
Return on Capital Employed 1.19 Return on Capital Employed (RoCE) is a ratio that measures a company's profitability and the efficiency with which its capital is employed. The RoCE is calculated by dividing a company’s profit/ earnings before interest and taxes (EBIT) by the capital employed27. The details of RoCE of eight Power Sector PSUs during 2014-15 to 2017-18 are given in table below:
Table 1.11: RoCE of Power Sector PSUs (₹ in crore)
Year EBIT Capital Employed RoCE (%) 2014-15 749.10 20235.83 3.70 2015-16 1167.68 25352.23 4.61 2016-17 -515. 95 15771.06 -3.27 2017-18 1180.95 21271.13 5.55
Source: Based on accounts and information furnished by PSUs
27 Capital employed = Paid up share capital + free reserves and surplus + long term loans –
accumulated losses - deferred revenue expenditure.
Chapter I - Functioning of Power Sector PSUs
23
The RoCE of the Power Sector PSUs ranged between (-) 3.27 per cent and 5.55 per cent during the period 2014-15 to 2017-18. The RoCE decreased during 2016-17 on account of two to three times increase in the losses of DISCOMs as compared to increase of 20 per cent to 50 per cent in the profit of other PSUs. The RoCE substantially increased during the year 2017-18 in comparison to the previous year mainly due to increase in capital employed on account of equity infusion by the State Government in the DISCOMs under UDAY scheme which was used by the DISCOMs to repay their old outstanding debts which resulted in decrease in their interest burden and consequent increase in EBIT.
Analysis of Long term loans of the Power Sector PSUs 1.20 The ability of the Power Sector PSUs to service the debt owed by them to the Government, banks and other financial institutions is assessed through the Interest Coverage Ratio and the Debt Turnover Ratio.
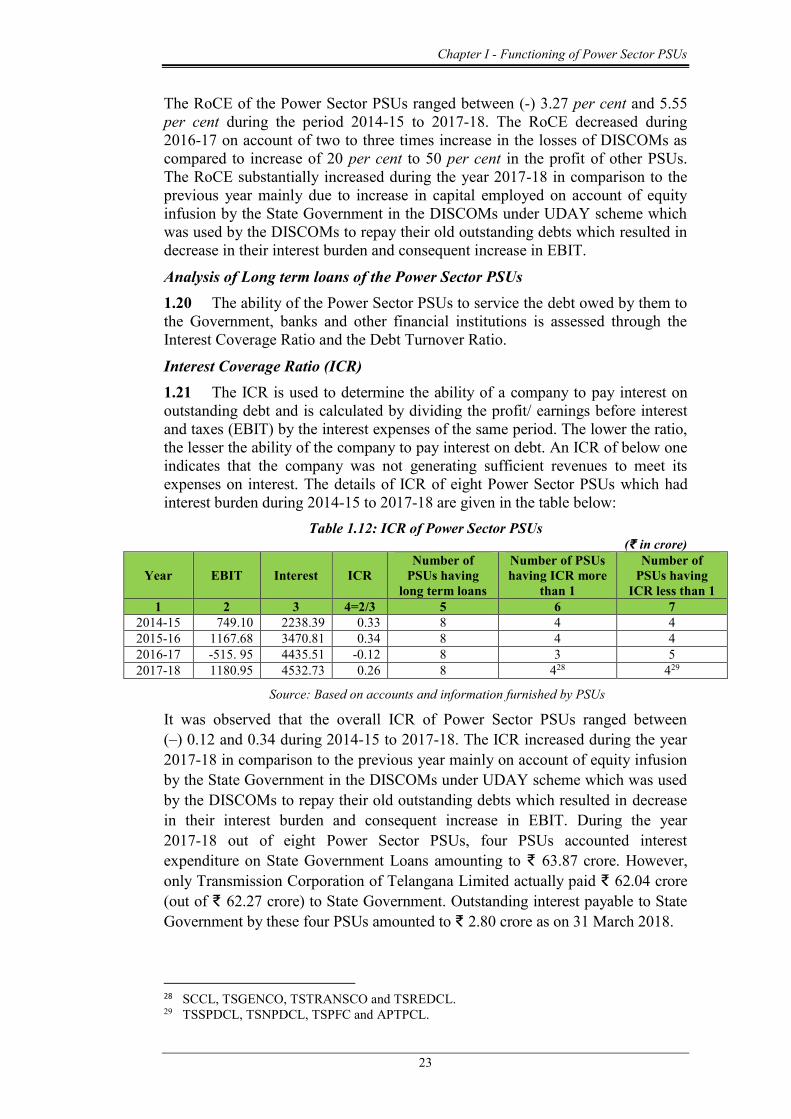
Interest Coverage Ratio (ICR) 1.21 The ICR is used to determine the ability of a company to pay interest on outstanding debt and is calculated by dividing the profit/ earnings before interest and taxes (EBIT) by the interest expenses of the same period. The lower the ratio, the lesser the ability of the company to pay interest on debt. An ICR of below one indicates that the company was not generating sufficient revenues to meet its expenses on interest. The details of ICR of eight Power Sector PSUs which had interest burden during 2014-15 to 2017-18 are given in the table below:
Table 1.12: ICR of Power Sector PSUs (₹ in crore)
Year EBIT Interest ICR Number of
PSUs having long term loans
Number of PSUs having ICR more
than 1
Number of PSUs having
ICR less than 1 1 2 3 4=2/3 5 6 7
2014-15 749.10 2238.39 0.33 8 4 4 2015-16 1167.68 3470.81 0.34 8 4 4 2016-17 -515. 95 4435.51 -0.12 8 3 5 2017-18 1180.95 4532.73 0.26 8 428 429
Source: Based on accounts and information furnished by PSUs It was observed that the overall ICR of Power Sector PSUs ranged between (–) 0.12 and 0.34 during 2014-15 to 2017-18. The ICR increased during the year 2017-18 in comparison to the previous year mainly on account of equity infusion by the State Government in the DISCOMs under UDAY scheme which was used by the DISCOMs to repay their old outstanding debts which resulted in decrease in their interest burden and consequent increase in EBIT. During the year 2017-18 out of eight Power Sector PSUs, four PSUs accounted interest expenditure on State Government Loans amounting to ₹ 63.87 crore. However, only Transmission Corporation of Telangana Limited actually paid ₹ 62.04 crore (out of ₹ 62.27 crore) to State Government. Outstanding interest payable to State Government by these four PSUs amounted to ₹ 2.80 crore as on 31 March 2018.
28 SCCL, TSGENCO, TSTRANSCO and TSREDCL. 29 TSSPDCL, TSNPDCL, TSPFC and APTPCL.
Audit Report on Economic Sector and Public Sector Undertakings for the year ended 31 March 2018
24
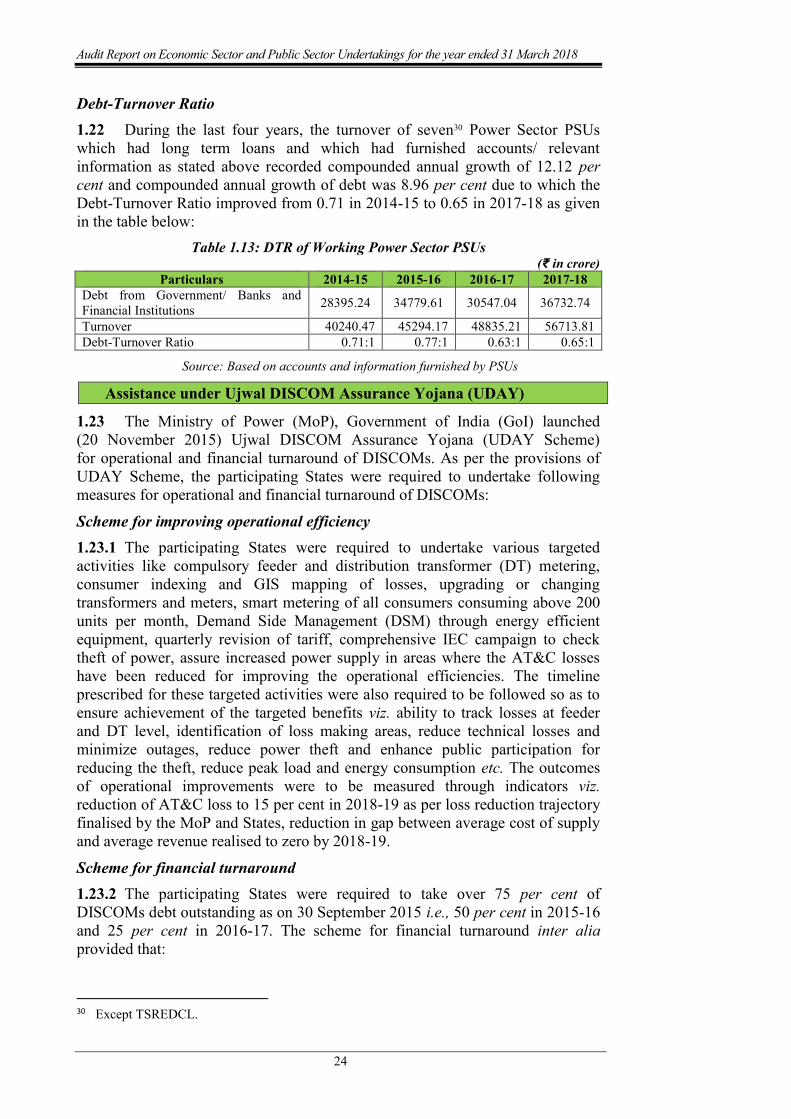
Debt-Turnover Ratio 1.22 During the last four years, the turnover of seven30 Power Sector PSUs which had long term loans and which had furnished accounts/ relevant information as stated above recorded compounded annual growth of 12.12 per cent and compounded annual growth of debt was 8.96 per cent due to which the Debt-Turnover Ratio improved from 0.71 in 2014-15 to 0.65 in 2017-18 as given in the table below:
Table 1.13: DTR of Working Power Sector PSUs (₹ in crore)
Particulars 2014-15 2015-16 2016-17 2017-18 Debt from Government/ Banks and Financial Institutions 28395.24 34779.61 30547.04 36732.74
Turnover 40240.47 45294.17 48835.21 56713.81 Debt-Turnover Ratio 0.71:1 0.77:1 0.63:1 0.65:1
Source: Based on accounts and information furnished by PSUs
Assistance under Ujwal DISCOM Assurance Yojana (UDAY)
1.23 The Ministry of Power (MoP), Government of India (GoI) launched (20 November 2015) Ujwal DISCOM Assurance Yojana (UDAY Scheme) for operational and financial turnaround of DISCOMs. As per the provisions of UDAY Scheme, the participating States were required to undertake following measures for operational and financial turnaround of DISCOMs:
Scheme for improving operational efficiency 1.23.1 The participating States were required to undertake various targeted activities like compulsory feeder and distribution transformer (DT) metering, consumer indexing and GIS mapping of losses, upgrading or changing transformers and meters, smart metering of all consumers consuming above 200 units per month, Demand Side Management (DSM) through energy efficient equipment, quarterly revision of tariff, comprehensive IEC campaign to check theft of power, assure increased power supply in areas where the AT&C losses have been reduced for improving the operational efficiencies. The timeline prescribed for these targeted activities were also required to be followed so as to ensure achievement of the targeted benefits viz. ability to track losses at feeder and DT level, identification of loss making areas, reduce technical losses and minimize outages, reduce power theft and enhance public participation for reducing the theft, reduce peak load and energy consumption etc. The outcomes of operational improvements were to be measured through indicators viz. reduction of AT&C loss to 15 per cent in 2018-19 as per loss reduction trajectory finalised by the MoP and States, reduction in gap between average cost of supply and average revenue realised to zero by 2018-19.
Scheme for financial turnaround 1.23.2 The participating States were required to take over 75 per cent of DISCOMs debt outstanding as on 30 September 2015 i.e., 50 per cent in 2015-16 and 25 per cent in 2016-17. The scheme for financial turnaround inter alia provided that:
30 Except TSREDCL.
Chapter I - Functioning of Power Sector PSUs
25
State will issue ‘Non Statutory Liquidity Ratio (Non-SLR) bonds’ and the proceeds realized from issue of such bonds shall be transferred to the DISCOMs which in turn shall discharge the corresponding amount of Banks/ FIs debt. The bonds so issued will have a maturity period of 10-15 years with a moratorium on repayment of principal upto 5 years.
Debt of DISCOMs will be taken over in the priority of debt already due, followed by debt with higher cost.
The transfer to the DISCOMs by the State in 2015-16 and 2016-17 will be as a mix of grant (50 per cent), loan (25 per cent to be taken over in 2017-18) or equity (25 per cent).
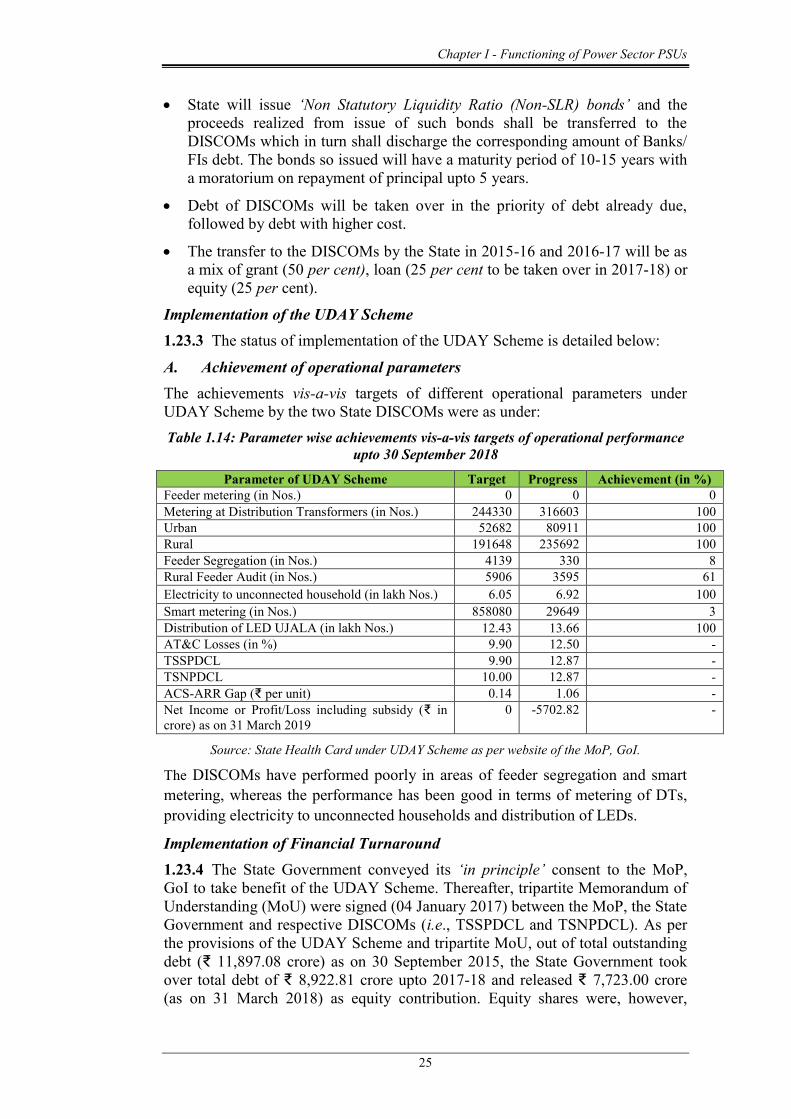
Implementation of the UDAY Scheme 1.23.3 The status of implementation of the UDAY Scheme is detailed below:
A. Achievement of operational parameters The achievements vis-a-vis targets of different operational parameters under UDAY Scheme by the two State DISCOMs were as under: Table 1.14: Parameter wise achievements vis-a-vis targets of operational performance
upto 30 September 2018
Parameter of UDAY Scheme Target Progress Achievement (in %) Feeder metering (in Nos.) 0 0 0 Metering at Distribution Transformers (in Nos.) 244330 316603 100 Urban 52682 80911 100 Rural 191648 235692 100 Feeder Segregation (in Nos.) 4139 330 8 Rural Feeder Audit (in Nos.) 5906 3595 61 Electricity to unconnected household (in lakh Nos.) 6.05 6.92 100 Smart metering (in Nos.) 858080 29649 3 Distribution of LED UJALA (in lakh Nos.) 12.43 13.66 100 AT&C Losses (in %) 9.90 12.50 - TSSPDCL 9.90 12.87 - TSNPDCL 10.00 12.87 - ACS-ARR Gap (₹ per unit) 0.14 1.06 - Net Income or Profit/Loss including subsidy (₹ in crore) as on 31 March 2019
0 -5702.82 -
Source: State Health Card under UDAY Scheme as per website of the MoP, GoI.
The DISCOMs have performed poorly in areas of feeder segregation and smart metering, whereas the performance has been good in terms of metering of DTs, providing electricity to unconnected households and distribution of LEDs.
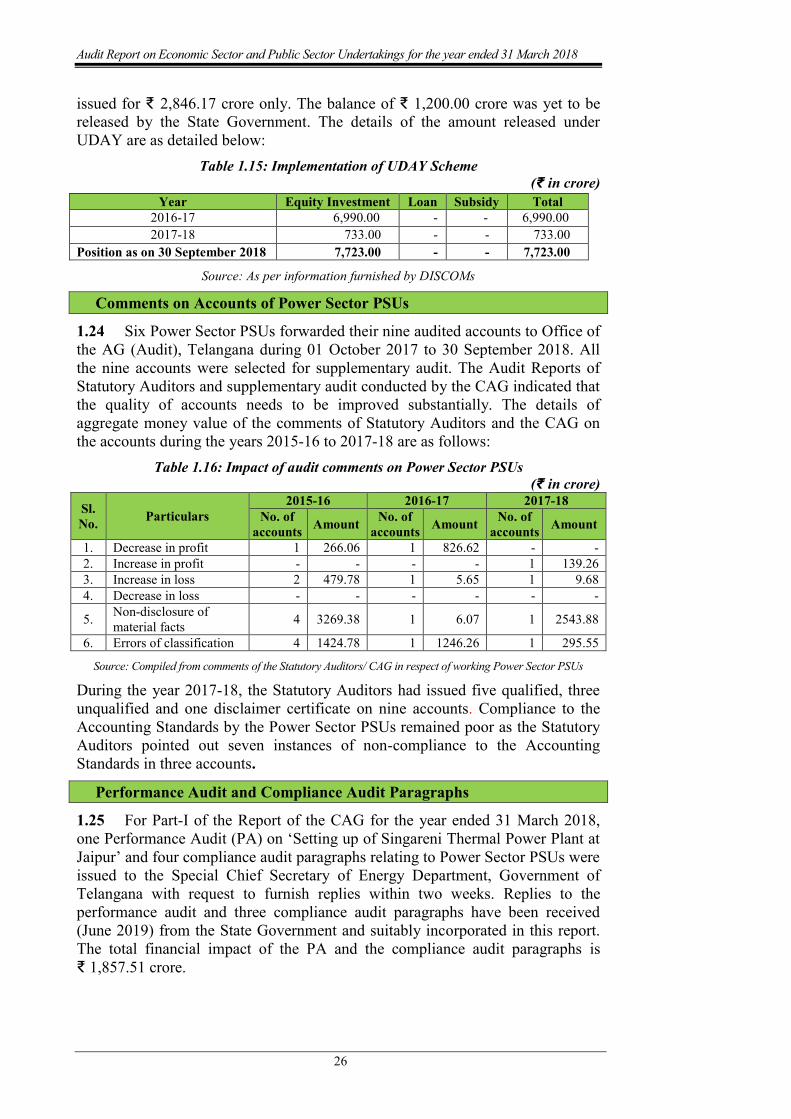
Implementation of Financial Turnaround 1.23.4 The State Government conveyed its ‘in principle’ consent to the MoP, GoI to take benefit of the UDAY Scheme. Thereafter, tripartite Memorandum of Understanding (MoU) were signed (04 January 2017) between the MoP, the State Government and respective DISCOMs (i.e., TSSPDCL and TSNPDCL). As per the provisions of the UDAY Scheme and tripartite MoU, out of total outstanding debt (₹ 11,897.08 crore) as on 30 September 2015, the State Government took over total debt of ₹ 8,922.81 crore upto 2017-18 and released ₹ 7,723.00 crore (as on 31 March 2018) as equity contribution. Equity shares were, however,
Audit Report on Economic Sector and Public Sector Undertakings for the year ended 31 March 2018
26
issued for ₹ 2,846.17 crore only. The balance of ₹ 1,200.00 crore was yet to be released by the State Government. The details of the amount released under UDAY are as detailed below:
Table 1.15: Implementation of UDAY Scheme (₹ in crore)
Source: As per information furnished by DISCOMs
Comments on Accounts of Power Sector PSUs
1.24 Six Power Sector PSUs forwarded their nine audited accounts to Office of the AG (Audit), Telangana during 01 October 2017 to 30 September 2018. All the nine accounts were selected for supplementary audit. The Audit Reports of Statutory Auditors and supplementary audit conducted by the CAG indicated that the quality of accounts needs to be improved substantially. The details of aggregate money value of the comments of Statutory Auditors and the CAG on the accounts during the years 2015-16 to 2017-18 are as follows:
Table 1.16: Impact of audit comments on Power Sector PSUs (₹ in crore)
Sl. No. Particulars
2015-16 2016-17 2017-18 No. of
accounts Amount No. of accounts Amount No. of
accounts Amount
1. Decrease in profit 1 266.06 1 826.62 - - 2. Increase in profit - - - - 1 139.26 3. Increase in loss 2 479.78 1 5.65 1 9.68 4. Decrease in loss - - - - - -
5. Non-disclosure of material facts 4 3269.38 1 6.07 1 2543.88
6. Errors of classification 4 1424.78 1 1246.26 1 295.55
Source: Compiled from comments of the Statutory Auditors/ CAG in respect of working Power Sector PSUs
During the year 2017-18, the Statutory Auditors had issued five qualified, three unqualified and one disclaimer certificate on nine accounts. Compliance to the Accounting Standards by the Power Sector PSUs remained poor as the Statutory Auditors pointed out seven instances of non-compliance to the Accounting Standards in three accounts.
Performance Audit and Compliance Audit Paragraphs
1.25 For Part-I of the Report of the CAG for the year ended 31 March 2018, one Performance Audit (PA) on ‘Setting up of Singareni Thermal Power Plant at Jaipur’ and four compliance audit paragraphs relating to Power Sector PSUs were issued to the Special Chief Secretary of Energy Department, Government of Telangana with request to furnish replies within two weeks. Replies to the performance audit and three compliance audit paragraphs have been received (June 2019) from the State Government and suitably incorporated in this report. The total financial impact of the PA and the compliance audit paragraphs is ₹ 1,857.51 crore.
Year Equity Investment Loan Subsidy Total 2016-17 6,990.00 - - 6,990.00 2017-18 733.00 - - 733.00
Position as on 30 September 2018 7,723.00 - - 7,723.00
Chapter I - Functioning of Power Sector PSUs
27
Follow up action on Audit Reports
1.26 The Report of the CAG represents the culmination of the process of audit scrutiny. It is, therefore, necessary that they elicit appropriate and timely response from the executive. The Finance Department, erstwhile Government of Andhra Pradesh, had issued (June 2004) instructions to all Administrative Departments to submit replies/ explanatory notes to paragraphs/ reviews included in the Audit Reports of the CAG of India within a period of three months of their presentation in the Legislature, in the prescribed format, without waiting for any questionnaires from the CoPU.
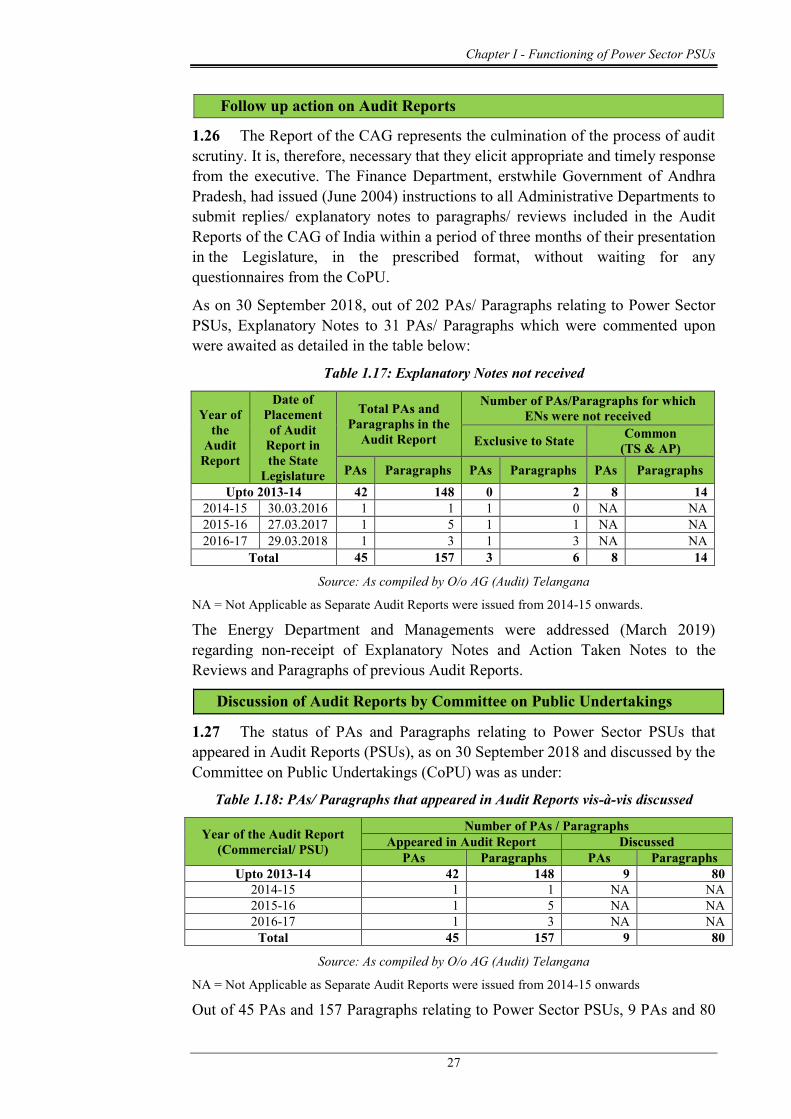
As on 30 September 2018, out of 202 PAs/ Paragraphs relating to Power Sector PSUs, Explanatory Notes to 31 PAs/ Paragraphs which were commented upon were awaited as detailed in the table below:
Table 1.17: Explanatory Notes not received
Year of the
Audit Report
Date of Placement of Audit
Report in the State
Legislature
Total PAs and Paragraphs in the
Audit Report
Number of PAs/Paragraphs for which ENs were not received
Exclusive to State Common (TS & AP)
PAs Paragraphs PAs Paragraphs PAs Paragraphs Upto 2013-14 42 148 0 2 8 14
2014-15 30.03.2016 1 1 1 0 NA NA 2015-16 27.03.2017 1 5 1 1 NA NA 2016-17 29.03.2018 1 3 1 3 NA NA
Total 45 157 3 6 8 14
Source: As compiled by O/o AG (Audit) Telangana
NA = Not Applicable as Separate Audit Reports were issued from 2014-15 onwards.
The Energy Department and Managements were addressed (March 2019) regarding non-receipt of Explanatory Notes and Action Taken Notes to the Reviews and Paragraphs of previous Audit Reports.
Discussion of Audit Reports by Committee on Public Undertakings
1.27 The status of PAs and Paragraphs relating to Power Sector PSUs that appeared in Audit Reports (PSUs), as on 30 September 2018 and discussed by the Committee on Public Undertakings (CoPU) was as under:
Table 1.18: PAs/ Paragraphs that appeared in Audit Reports vis-à-vis discussed
Year of the Audit Report (Commercial/ PSU)
Number of PAs / Paragraphs Appeared in Audit Report Discussed
PAs Paragraphs PAs Paragraphs Upto 2013-14 42 148 9 80
2014-15 1 1 NA NA 2015-16 1 5 NA NA 2016-17 1 3 NA NA
Total 45 157 9 80
Source: As compiled by O/o AG (Audit) Telangana
NA = Not Applicable as Separate Audit Reports were issued from 2014-15 onwards
Out of 45 PAs and 157 Paragraphs relating to Power Sector PSUs, 9 PAs and 80
Audit Report on Economic Sector and Public Sector Undertakings for the year ended 31 March 2018
28
Paragraphs were discussed by CoPU. The issue of inadequacy of CoPU meetings to discuss the pending PAs/ Paragraphs and the modalities to reduce the pendency were discussed (July 2018) with CoPU. Response to the letters addressed (May 2018 and August 2018) to CoPU in this regard was awaited.
During 2014-18, seven meetings of the CoPU were conducted to discuss the Reports. The last meeting was held on 24 July 2018.
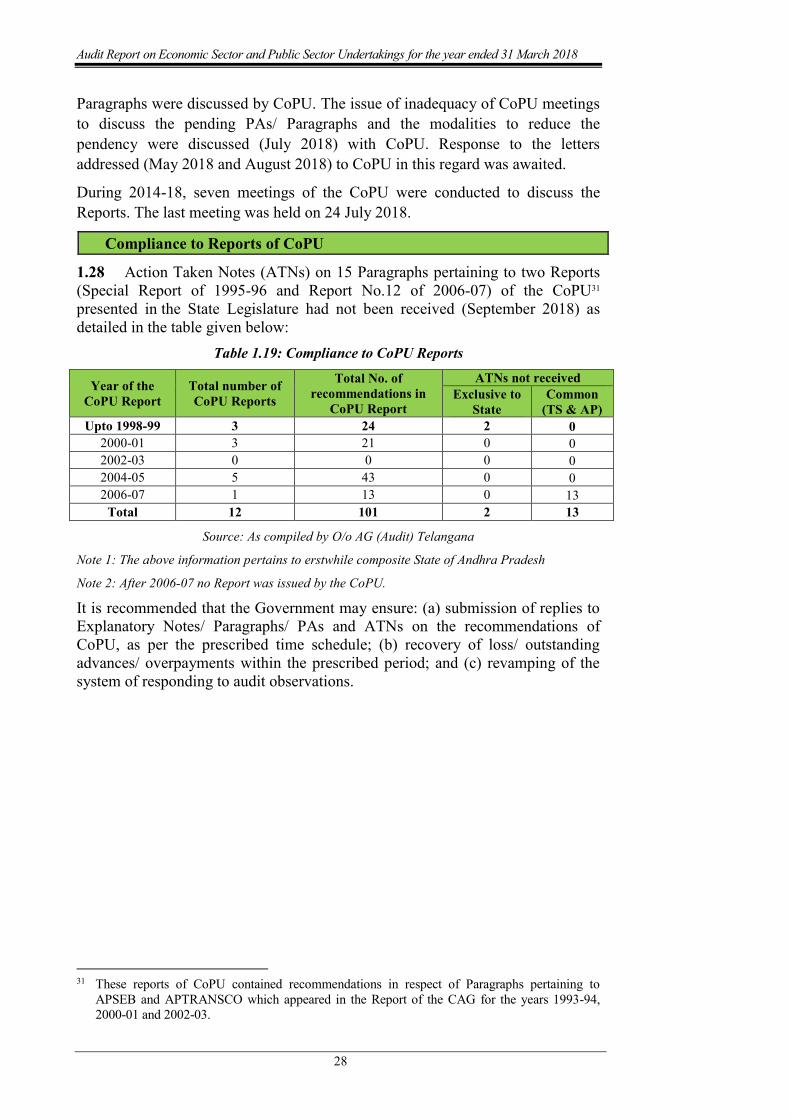
Compliance to Reports of CoPU
1.28 Action Taken Notes (ATNs) on 15 Paragraphs pertaining to two Reports (Special Report of 1995-96 and Report No.12 of 2006-07) of the CoPU31 presented in the State Legislature had not been received (September 2018) as detailed in the table given below:
Table 1.19: Compliance to CoPU Reports
Year of the CoPU Report
Total number of CoPU Reports
Total No. of recommendations in
CoPU Report
ATNs not received Exclusive to
State Common
(TS & AP) Upto 1998-99 3 24 2 0
2000-01 3 21 0 0 2002-03 0 0 0 0 2004-05 5 43 0 0 2006-07 1 13 0 13
Total 12 101 2 13
Source: As compiled by O/o AG (Audit) Telangana
Note 1: The above information pertains to erstwhile composite State of Andhra Pradesh
Note 2: After 2006-07 no Report was issued by the CoPU. It is recommended that the Government may ensure: (a) submission of replies to Explanatory Notes/ Paragraphs/ PAs and ATNs on the recommendations of CoPU, as per the prescribed time schedule; (b) recovery of loss/ outstanding advances/ overpayments within the prescribed period; and (c) revamping of the system of responding to audit observations.
31 These reports of CoPU contained recommendations in respect of Paragraphs pertaining to
APSEB and APTRANSCO which appeared in the Report of the CAG for the years 1993-94, 2000-01 and 2002-03.