Embed Size (px)
Citation preview
Chapter I: Characterization of indigenous Botryococcus sp. and microalgal lipid production
Page 21
Chapter I
Characterization of Indigenous Botryococcus sp. and
Microalgal Lipid Production
Chapter I: Characterization of indigenous Botryococcus sp. and microalgal lipid production
Page 22
Summary
This chapter includes the experimental procedures; materials and methodologies adopted
for the isolation, characterization, growth and lipids production from microalgae.
Botryococcus species procured from different culture collection centers were evaluated
for their adaptability to different culture conditions like different nitrogen sources, pH,
Salinity, different autotrophic media and the influence of media constituents on growth of
the algae using response surface methodology. RSM studies revealed that the nitrogen:
phosphate at the ratio of 1:0.5 was found to influence the growth and biomass yields of
the organism. Among the different autotrophic media used (Bold basal medium (BBM),
and bold basal with ammonium carbonate (BBMa), BG11 and modified Chu 13 medium,
BG11 was found to be the best medium for the growth and biomass production, although
the organism showed appreciable level of growth and biomass production in all the tested
media. It has shown its adaptability to varied range of salinity as well (17 mM to 85
mM). Among the different nitrogen sources tested (ammonium nitrate, calcium nitrate,
urea, sodium nitrate and potassium nitrate), potassium nitrate exhibited maximum
biomass yield. Botryococcus species were grown in different pH ranging from 6 to 8.5
and has shown its tolerance to the tested range. Race A strains of the genus Botryococcus
were found to produce lipid rich biomass (15 to 35% on dry weight) and upon fatty acid
analysis they were found to produce oleic, lenolenic, stearic and palmitic acids as major
fatty acids along with traces of pharmaceutically important alkyl substituted fatty acids
such as 12-methyl hexadecanoic acid, 14-methyl tetradecanoic acid and 16-methyl
heptadecanoic acid. Thus the algae Botryococcus appears to be potential organism for
lipid rich biomass production.
Therefore the study involved the isolation of indigenous Botryococcus species for
its possible industrial exploitation. Samples of the green, colonial, unicellular microalgae
Botryococcus sp. were collected from freshwater ponds in Mahabalipuram (Latitude
12o37' in the North to Longitude 80
o14' in the East.) Tamil Nadu, India. It was tentatively
identified to be Botryococcus sp. The hydrocarbon analysis of its hexane extracts showed
hexadecane (10.15%), heptadecane (17.82%) and pentacosane (18.74%) as its major
hydrocarbons. Further the 18S rRNA sequence (GU182893.1) analysis has confirmed its
taxonomical relationship to the order Trebouxiophyceae and has shown similarities with
Chapter I: Characterization of indigenous Botryococcus sp. and microalgal lipid production
Page 23
the reported species of the genus Botryococcus and in particular to Botryococcus braunii.
Based on morphological features and 18S rRNA sequence analysis the Indian isolate was
assigned as Botryococcus mahabali. Botryococcus braunii (LB 572) was obtained from
the University of Texas, U.S.A. B. braunii (SAG 30.81) was from the Sammlung von
AlgenKulturen, pflanzenphysiologisches Institut, Universitat Gottingen, Germany. B.
braunii (Strain 1) and B. braunii (Strain 2) obtained from university of Berkeley, UK.
Botryococcus Sp. (DB-8) was from University of Pune, Pune, India and Botryococcus Sp.
(MCRC) was of Murugappa Chattiar Research Centre, Chennai, India. The CFTRI isolate
B. mahabali was evaluated for its genetic variations & genetic relationships with the
other species belonging to different geographical locations and different chemical race
using 35 decamer RAPD primers. Several RAPD primers were selected after their
preliminary screening for their ability to produce clear and multiple bands. The analyses
resulted in the amplification of totally 407 bands of 100-3000 bp, of which 380 bands
were polymorphic, corresponds to 93.3% genetic diversity. The ability to distinguish
genotypes and the Resolving power (Rp) of the primer showed a linear relationship. From
these data, a genetic similarity matrix and the dendrogram were obtained by using the
unweighted pair group method with arithmetic mean (UPGMA). The RAPD analysis
produced genetic similarity coefficients ranged from 0.3312 to 0.7388. The study resulted
in the identification and molecular classification of Indian strains with that of other
strains belonging to different geographical locations. The study also revealed the clear
genetic distances between A race strains of B. braunii and B race strains of the same
species. Indigenous strains of Botryococcus sp. were further analyzed for their
hyrocarbons and fatty acids profiles and have shown some common chemical profiles.
All the three Indigenous strains of Botryococcus species and other microalgae such as
Dunaliella bardawil and Haematococcus pluvialis were evaluated for their lipid
production and for specialty lipids like poly unsaturated fatty acids have been detailed.
Analysis of fatty acids profiles of Dunaliella and Haematococcus has revealed that they
were found to produce hexadecanoic acid (16:0), oleic (18:1), linoleic (18:2), and
linolenic acids (18:3) as their major fatty acids. Dodecanoic acid (12:0), tetradecanoic
acid (14:0), hexadecanoic acid (16:0), oleic (18:1), linoleic (18:2) and linolenic acids
(18:3) were the major fatty acids produced by Botryococcus mahabali.
Chapter I: Characterization of indigenous Botryococcus sp. and microalgal lipid production
Page 24
2.1. Introduction
There is an increasing quest all over the world for the exploration of potential microalgae
for various industrial applications from nutraceutical to biodiesel feed stock. The green
colonial lipid rich microalgae Botryococcus is widespread in freshwater, brackish lakes,
reservoirs and ponds (Metzger and Largeau 2005). Botryococcus is characterized by its
ability to synthesise and accumulate very high levels of lipids. These lipid substances
include numerous hydrocarbons, i.e. highly reduced compounds comprising only carbon
and hydrogen as elements (Brown et al., 1969). Being a photosynthetic organism, it has
been reported to reduce CO2 emissions by 1.5 X 10⁵
tons/yr /8.4 × 103 ha (Sawayama et
al., 1999) and thus it offers an eco friendly process for production of lipid and other
bioactive compounds along with its carbon dioxide mitigation credits. The existence of
Botryococcus sp. in USA, Ivory Coast, Portugal, Bolivia, Morocco, India, Philippines,
Thailand, France and West Indies has confirmed its wide distribution (Chandra 1964;
Metzger et al., 1985; Wolf et al., 1985; Okada et al., 2000). Further, these geographical
regions belong to different climatic zones like continental, temperate, tropical and alpine
indicating its ability to grow in varied climatic conditions (Tyson, 1995). Because of its
potential to produce large amounts of lipids and hydrocarbons, exploration for newer
strains and species of the genus Botryococcus is increasing day by day and till date more
than 60 Botryococcus strains were cultivated in laboratory (For a non-exhaustive list, see
Metzger and Largeau 1999) and the exploration is still on. Most of the Botryococcus
strains cultivated in laboratory and wild samples collected from lakes are analyzed for
their lipid production (Metzger and Largeau, 1999) and are reported to produce 5 to 42%
of lipids and 0.1 to 61.0% hydrocarbons on their dry weight (Metzger and Largeau 1999,
2005; Dayananda et al., 2007a; Ranga Rao et al., 2007; Tran et al., 2009; Eroglu and
Melis, 2010; Samori et al., 2010). Therefore there is an increasing quest to isolate newer
species and strains of the genus Botryococcus produce lipids and other chemicals of
industrial importance. Morphological heterogeneity and the chemical nature of
hydrocarbons and the degree of lipid and polysaccharide production were found to exist
within the species and among the other species of the genus Botryococcus. Finding the
genetic polymorphism in different species of the genus Botryococcus and within the
species belonging to different chemical races of B. brauni using RAPD (random
Chapter I: Characterization of indigenous Botryococcus sp. and microalgal lipid production
Page 25
amplified polymorphic DNA) technique was employed. RAPD technique is being used
widely as an efficient technique in detecting genetic variations (Williams et al., 1990)
even in closely related organisms such as two near isogenic lines (NIL). At present,
RAPD markers have been successfully applied to detect the genetic similarities or
dissimilarities in various plants, algae, fungi and bacteria. (Carvalho et al., 2004; Comeau
et al., 2004; Martins et al., 2004; Ramage et al., 2004; Modgil et al., 2005; Martinez et
al., 2006; Touzet et al., 2007; Zhao et al., 2007, 2008; Olmos et al., 2009; Small et al.,
2009; Tilman et al., 2009). RAPD was employed here to differentiate the genetic
variations among the different chemical races of B. braunii and between the indigenous
strains of Botryococcus.
2.2. Materials and methods
2.2.1. Source of Botryococcus sp.
Botryococcus braunii (LB 572) was procured from the University of Texas, U.S.A.
Botryococcus braunii (SAG 30.81) from the Sammlung von AlgenKulturen,
pflanzenphysiologisches Institut, Universitat Gottingen, Germany. Botryococcus braunii
(Strain 1) and Botryococcus braunii (Strain 2) were obtained from university of Berkeley,
UK. Botryococcus sp. (DB-8) was obtained from the University of Pune, Pune, India and
Botryococcus sp. (MCRC) from Murugappa Chattiar Research Centre, Chennai, India.
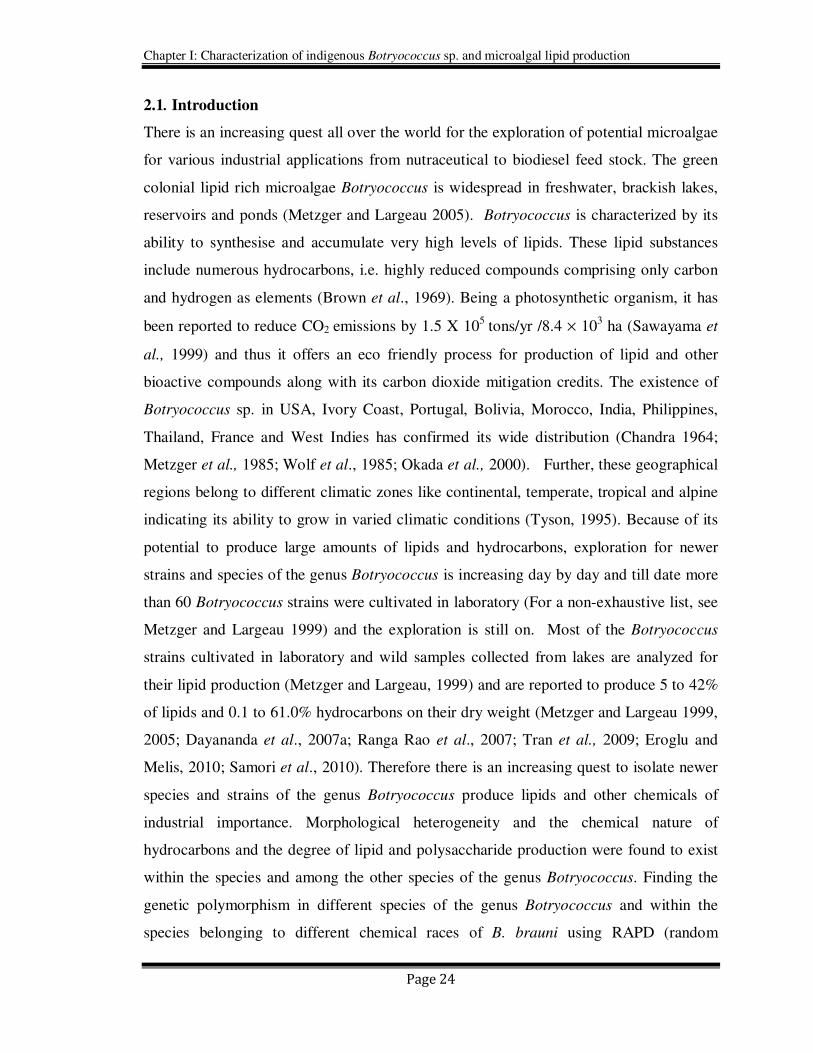
Stock cultures were maintained routinely on both liquid and agar slants of Modified Chu
13 medium (Table 4) (Largeau et al., 1980) by regular sub-culturing at two-week
intervals. Cultures were maintained at 25 ± 1°C with 1.2 ± 0.2 klux and a 16:8 light: dark
cycle.
Chapter I: Characterization of indigenous Botryococcus sp. and microalgal lipid production
Page 26
2.2.2. Dunaliella bardawil strain and culture condition
Indigenous strain of D. bardawil was isolated from the Sambar lake of Rajasthan, India
and was maintained in Plant Cell Biotechnology Department of CFTRI. The culture was
maintained in both agar slant and liquid AS-100 medium (Vonshak, 1986) by regular sub
culturing at two-week intervals. Cultures were maintained at 25 ± 1°C with 1.2 ± 0.2 klux
and a 16:8 light: dark cycle. Chemical composition of the AS-100 medium is shown in
Table 5. Two weeks grown stock cultures of Dunaliella bardawil were inoculated into
freshly prepared AS-100 media and incubated for four weeks at 25 ± 1oC temperature
with 1.2 ± 0.2 klux and 16:8 light dark cycle for two weeks. Cultures were harvested and
estimated for biomass and total lipid yields. Fatty acid profiles were analyzed by GCMS.
Table 4. Chemical composition of modified CHU 13
Constituent Gram/Liter
KNO3 0.2
K2HPO4 0.04
MgSO4 7H2O 0.1
CaCl2 6H2O 0.08
Ferric citrate 0.01
Citric acid 0.02
pH 7.5
Micro nutrients ppm
Boron 0.5
Manganese 0.5
Zinc 0.05
Copper 0.02
Cobalt 0.02
Molybdenum 0.02
Source: Largeau et al. (1980)
Chapter I: Characterization of indigenous Botryococcus sp. and microalgal lipid production
Page 27
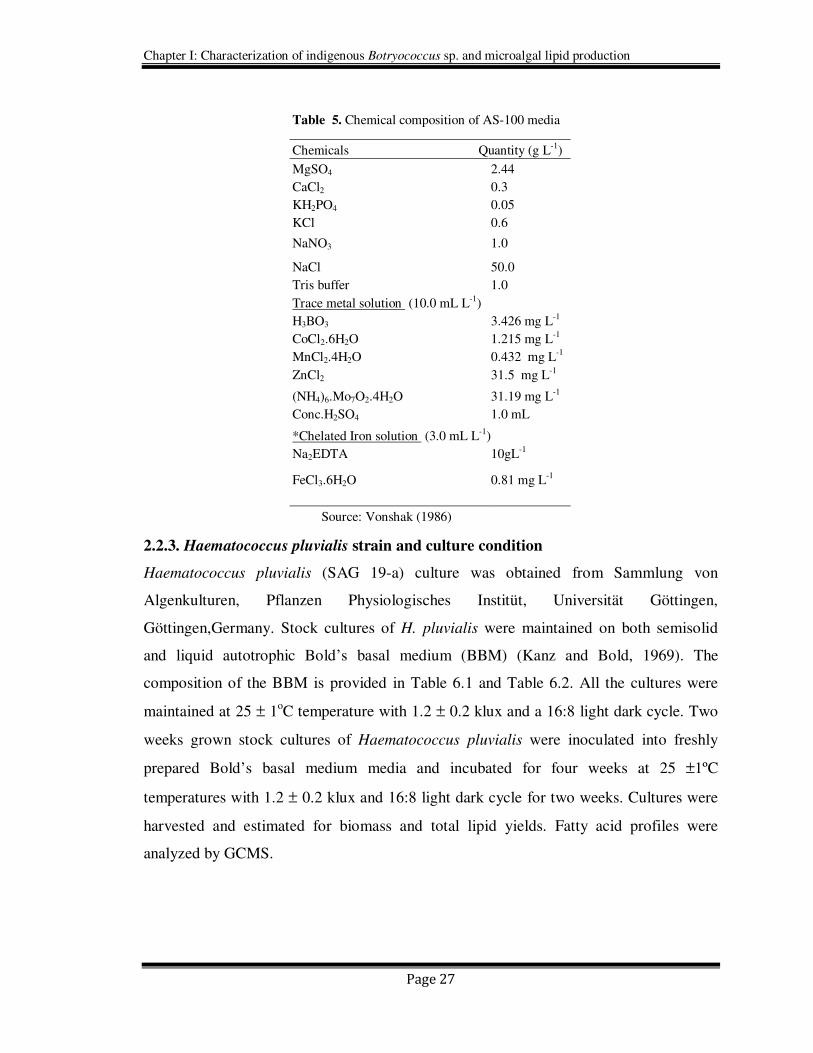
2.2.3. Haematococcus pluvialis strain and culture condition
Haematococcus pluvialis (SAG 19-a) culture was obtained from Sammlung von
Algenkulturen, Pflanzen Physiologisches Institüt, Universität Göttingen,
Göttingen,Germany. Stock cultures of H. pluvialis were maintained on both semisolid
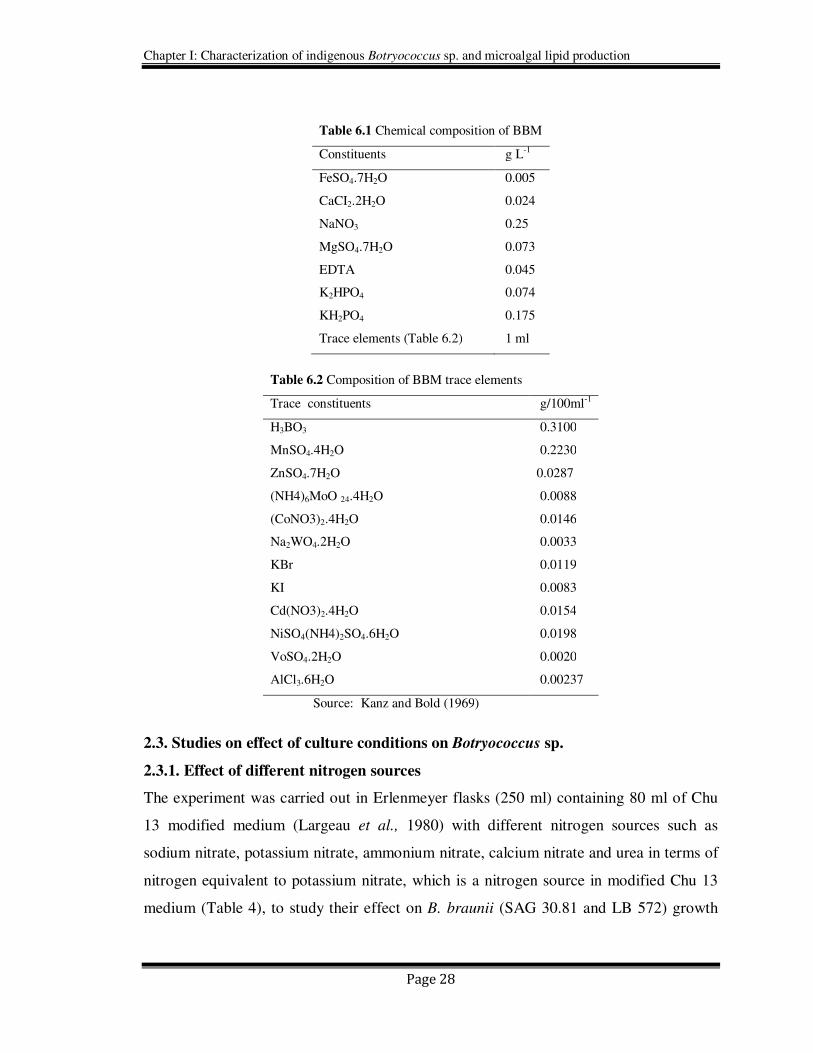
and liquid autotrophic Bold’s basal medium (BBM) (Kanz and Bold, 1969). The
composition of the BBM is provided in Table 6.1 and Table 6.2. All the cultures were
maintained at 25 ± 1oC temperature with 1.2 ± 0.2 klux and a 16:8 light dark cycle. Two
weeks grown stock cultures of Haematococcus pluvialis were inoculated into freshly
prepared Bold’s basal medium media and incubated for four weeks at 25 ±1ºC
temperatures with 1.2 ± 0.2 klux and 16:8 light dark cycle for two weeks. Cultures were
harvested and estimated for biomass and total lipid yields. Fatty acid profiles were
analyzed by GCMS.
Table 5. Chemical composition of AS-100 media
Chemicals Quantity (g L-1)
MgSO4 2.44
CaCl2 0.3
KH2PO4 0.05
KCl 0.6
NaNO3 1.0
NaCl 50.0
Tris buffer 1.0
Trace metal solution (10.0 mL L-1)
H3BO3 3.426 mg L-1
CoCl2.6H2O 1.215 mg L-1
MnCl2.4H2O 0.432 mg L-1
ZnCl2 31.5 mg L-1
(NH4)6.Mo7O2.4H2O 31.19 mg L-1
Conc.H2SO4 1.0 mL
*Chelated Iron solution (3.0 mL L-1)
Na2EDTA 10gL-1
FeCl3.6H2O 0.81 mg L-1
Source: Vonshak (1986)
Chapter I: Characterization of indigenous Botryococcus sp. and microalgal lipid production
Page 28
Table 6.1 Chemical composition of BBM
Constituents g L-1
FeSO4.7H2O 0.005
CaCI2.2H2O 0.024
NaNO3 0.25
MgSO4.7H2O 0.073
EDTA 0.045
K2HPO4 0.074
KH2PO4 0.175
Trace elements (Table 6.2) 1 ml
2.3. Studies on effect of culture conditions on Botryococcus sp.
2.3.1. Effect of different nitrogen sources
The experiment was carried out in Erlenmeyer flasks (250 ml) containing 80 ml of Chu
13 modified medium (Largeau et al., 1980) with different nitrogen sources such as
sodium nitrate, potassium nitrate, ammonium nitrate, calcium nitrate and urea in terms of
nitrogen equivalent to potassium nitrate, which is a nitrogen source in modified Chu 13
medium (Table 4), to study their effect on B. braunii (SAG 30.81 and LB 572) growth
Table 6.2 Composition of BBM trace elements
Trace constituents g/100ml-1
H3BO3 0.3100
MnSO4.4H2O 0.2230
ZnSO4.7H2O 0.0287
(NH4)6MoO 24.4H2O 0.0088
(CoNO3)2.4H2O 0.0146
Na2WO4.2H2O 0.0033
KBr 0.0119
KI 0.0083
Cd(NO3)2.4H2O 0.0154
NiSO4(NH4)2SO4.6H2O 0.0198
VoSO4.2H2O 0.0020
AlCl3.6H2O 0.00237
Source: Kanz and Bold (1969)
Chapter I: Characterization of indigenous Botryococcus sp. and microalgal lipid production
Page 29
and biomass yields. The culture flasks were incubated for 4 weeks at 25 ± 1oC
temperature with 1.2 ± 0.2 klux and 16:8 light dark cycle.
2.3.2. Effect of pH
The experiment was carried out in Erlenmeyer flasks (150ml) containing 40 ml of Chu 13
modified medium and the pH of the medium was adjusted to 6.0, 6.5, 7.0, 7.5, 8.0 and 8.5
before autoclaving. All the flasks were inoculated with uniform volume of B. braunii
(LB 572) and B. braunii (SAG 30.81) cultures. The culture flasks were incubated for four
weeks at 25 ± 1oC temperature with 1.2 ± 0.2 klux and 16:8 light dark cycle and the
biomass yields were analyzed.
2.3.3. Effect of Salinity
A set of 500 ml Erlenmeyer conical flasks were taken and 200 ml of modified Chu 13
medium was distributed and sodium chloride was added in the range of 17 mM to 85 mM
to the flasks and inoculated with two weeks old culture of B. braunii LB 572. The culture
flasks were incubated for 18 days at 25 ±1oC temperatures under 1.2 ± 0.2 klux light
intensity and 16:8 hr light dark cycle.
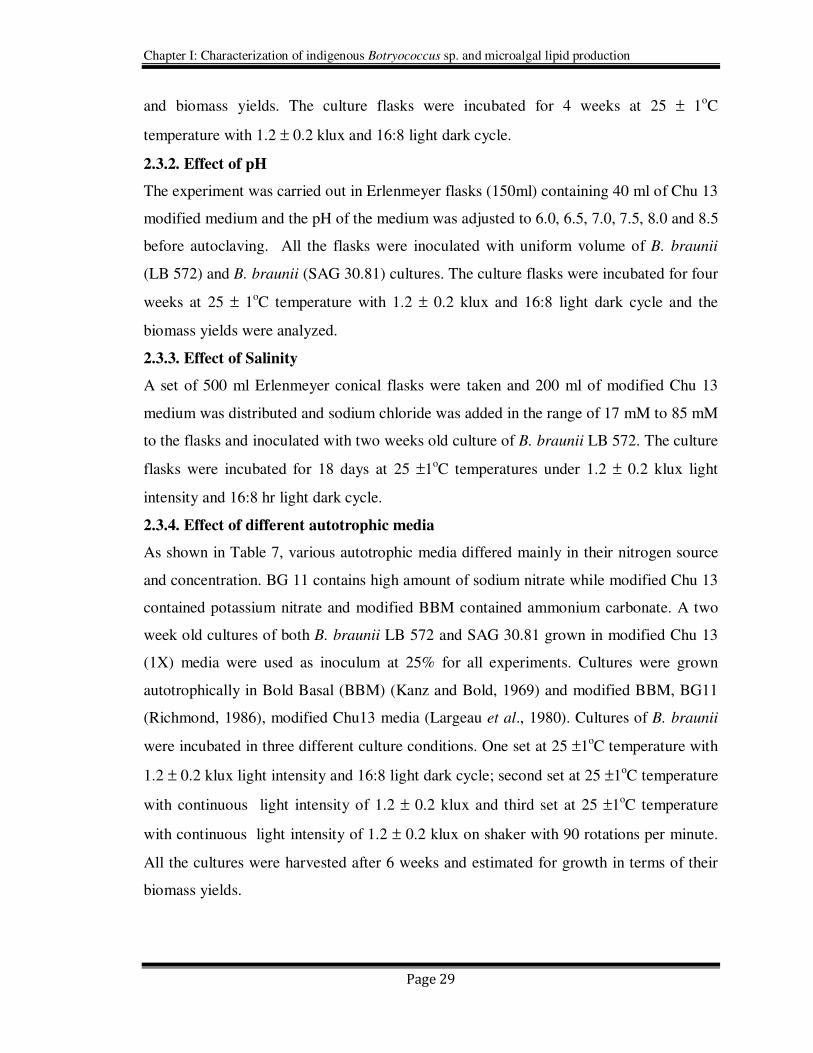
2.3.4. Effect of different autotrophic media
As shown in Table 7, various autotrophic media differed mainly in their nitrogen source
and concentration. BG 11 contains high amount of sodium nitrate while modified Chu 13
contained potassium nitrate and modified BBM contained ammonium carbonate. A two
week old cultures of both B. braunii LB 572 and SAG 30.81 grown in modified Chu 13
(1X) media were used as inoculum at 25% for all experiments. Cultures were grown
autotrophically in Bold Basal (BBM) (Kanz and Bold, 1969) and modified BBM, BG11
(Richmond, 1986), modified Chu13 media (Largeau et al., 1980). Cultures of B. braunii
were incubated in three different culture conditions. One set at 25 ±1oC temperature with
1.2 ± 0.2 klux light intensity and 16:8 light dark cycle; second set at 25 ±1oC temperature
with continuous light intensity of 1.2 ± 0.2 klux and third set at 25 ±1oC temperature
with continuous light intensity of 1.2 ± 0.2 klux on shaker with 90 rotations per minute.
All the cultures were harvested after 6 weeks and estimated for growth in terms of their
biomass yields.
Chapter I: Characterization of indigenous Botryococcus sp. and microalgal lipid production
Page 30
Table 7. Composition of autotrophic culture media*
Composition (g L-1)
Modified Chu 13
BG11
BBM
BBMa 0.25X 0.5X 0.75X 1X 2X
KNO3 0.05 0.1 0.15 0.2 0.4 - - -
NaNO3 - - - - - 1.5 0.25
K2HPO4 0.01 0.02 003 0.04 0.08 0.04 0.074 0.074
KH2PO4 - - - - - - 0.0175 0.0175
CaCl2.2H2O 0.02 0.04 0.06 0.08 0.16 0.036 0.024 0.024
MgSO4. 7H2O 0.025 0.05 0.075 0.1 0.2 0.075 0.073 0.073
Na2CO3 - - - - - 0.02 - -
NaCl - - - - - - 0.025 0.025
FeSO4 - - - - - - 0.005 0.005
EDTA - - - - - 0.001 0.045 0.045
Citric acid 0.025 0.05 0.075 0.1 0.2 0.006 - -
Ferric ammonium citrate - - - - - 0.006 - -
Ferric citrate 0.0025 0.005 0.0075 0.01 0.02 - - -
Ammonium carbonate - - - - - - - 0.157
*The respective trace solution were added
2.3.5. Influence of Culture age
Experiment was conducted to study the effect of culture age on B. braunii growth. Two
weeks old cultures of B. braunii (LB 572 and SAG 30.81) were used as inoculum at 20%
(v/v) and added to the Erlenmeyer flasks (150ml) containing 40 ml of Chu 13 modified
medium and incubated at 25 ± 1oC temperature with 1.2 ± 0.2 klux and 16:8 light dark
cycle. The culture flasks were harvested at regular intervals of 7 days (week) and
biomass yields were analyzed.
2.3.6. Influence of media constituents on Botryococcus growth using RSM
Botryococcus braunii (SAG 30.81) was obtained from Algal Culture Centre, University
of Gottingen, Germany. The stock culture was maintained on modified Chu13 medium
(Largeau et al., 1980) both in liquid medium and in slants. All the experiments were
carried in 150 ml Erlenmeyer flasks containing 40 ml CHU 13 medium with varied
concentrations of potassium nitrate, potassium dihydrogen phosphate, magnesium
sulphate and ferric citrate as given in Table 4. Ferric citrate-citric acid mixture was
maintained in the ratio of 1:10 by adding citric acid and keeping other constituents of the
medium constant. The culture flasks were incubated at 25 ± 1oC temperature, 1 ± 0.2 klux
Chapter I: Characterization of indigenous Botryococcus sp. and microalgal lipid production
Page 31
light intensity with 16hr: 8hr light dark cycle. The culture flasks were inoculated with
25% (v/v) of inoculum.
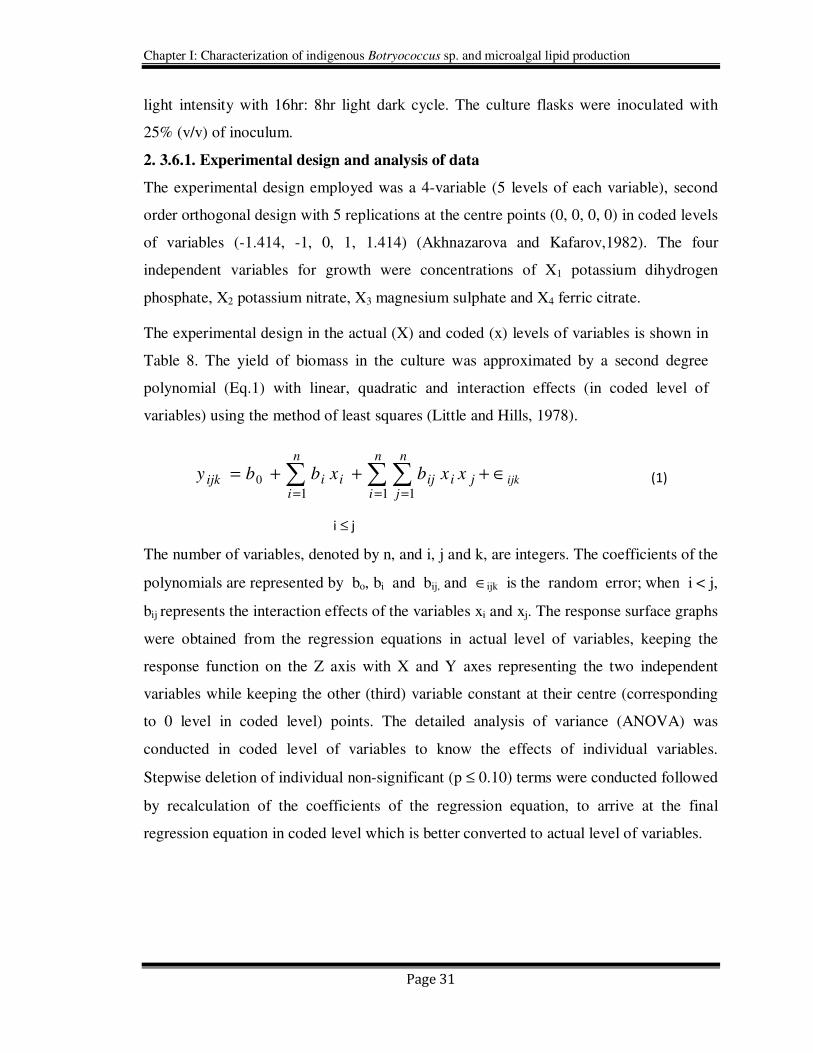
2. 3.6.1. Experimental design and analysis of data
The experimental design employed was a 4-variable (5 levels of each variable), second
order orthogonal design with 5 replications at the centre points (0, 0, 0, 0) in coded levels
of variables (-1.414, -1, 0, 1, 1.414) (Akhnazarova and Kafarov,1982). The four
independent variables for growth were concentrations of X1 potassium dihydrogen
phosphate, X2 potassium nitrate, X3 magnesium sulphate and X4 ferric citrate.
The experimental design in the actual (X) and coded (x) levels of variables is shown in
Table 8. The yield of biomass in the culture was approximated by a second degree
polynomial (Eq.1) with linear, quadratic and interaction effects (in coded level of
variables) using the method of least squares (Little and Hills, 1978).
ijkj
n
i
n
jiiji
n
iiijk xxbxbby ∈+++= ∑∑∑
= == 1 110 (1)
i ≤ j
The number of variables, denoted by n, and i, j and k, are integers. The coefficients of the
polynomials are represented by bo, bi and bij, and ∈ijk is the random error; when i < j,
bij represents the interaction effects of the variables xi and xj. The response surface graphs
were obtained from the regression equations in actual level of variables, keeping the
response function on the Z axis with X and Y axes representing the two independent
variables while keeping the other (third) variable constant at their centre (corresponding
to 0 level in coded level) points. The detailed analysis of variance (ANOVA) was
conducted in coded level of variables to know the effects of individual variables.
Stepwise deletion of individual non-significant (p ≤ 0.10) terms were conducted followed
by recalculation of the coefficients of the regression equation, to arrive at the final
regression equation in coded level which is better converted to actual level of variables.
Chapter I: Characterization of indigenous Botryococcus sp. and microalgal lipid production
Page 32
2.3.6.2. Optimization
Optimization was done by employing canonical analysis (Myers, 1971; Khuri and
Cornell, 1989) wherein the levels of the variables (x1, x2, x3, x4) (within the
experimental range) were determined to obtain the maximum yield of biomass
production. Optimization of the response function consists of the translation of the
response function (yk) from the origin to the stationary points (xo) (Myers, 1971). Then
the response function was expressed in terms of the new variables, the axes of which
correspond to the principal axes of the contour system. Further the roots (λ1, λ2, λ3, λ4)
of the auxiliary equation (λ2 - λ+1 =0) were calculated initially to know the nature of
optimum. The response function is maximum if all the roots have negative values, and
minimum if all roots have positive values. If some of the roots have positive values and
some negative, then it is the situation of a saddle point (Myers, 1971; Bhattacharya and
Prakash, 1994). Finally, the optimum levels of the variables were obtained by
superimposing the contours.
Chapter I: Characterization of indigenous Botryococcus sp. and microalgal lipid production
Page 33
Table 8. Orthogonal experimental design in coded and actual level of variables
Exp. No
Potassium dihydrogen phosphate
Potassium nitrate
Magnesium sulphate7-hydrate
Ferric citrate
coded level (x1)
actual level (g L-1) (X1)
coded level
(x2)
actual level
(g L-1) (X2)
coded level
(x3)
actual level (g L-1)
(X3)
coded level (x4)
actual level (g L-1) (X4)
1 1 0.172 1 0.861 1 0.43 1 0.043 2 -1 0.038 -1 0.189 1 0.43 1 0.043 3 1 0.172 -1 0.189 -1 0.09 1 0.043 4 -1 0.038 1 0.861 -1 0.09 1 0.043 5 1 0.172 -1 0.189 1 0.43 -1 0.012
6 -1 0.038 1 0.861 1 0.43 -1 0.012 7 1 0.172 1 0.861 -1 0.09 -1 0.012 8 -1 0.038 -1 0.189 -1 0.09 -1 0.012 9 1 0.172 -1 0.189 1 0.43 1 0.043 10 -1 0.038 1 0.861 1 0.43 1 0.043
11 1 0.172 1 0.861 -1 0.09 1 0.043 12 -1 0.038 -1 0.189 -1 0.09 1 0.043 13 1 0.172 1 0.861 1 0.43 -1 0.012 14 -1 0.038 -1 0.189 1 0.43 -1 0.012 15 1 0.172 -1 0.189 -1 0.09 -1 0.012
16 -1 0.038 1 0.861 -1 0.09 -1 0.012 17 0 0.105 0 0.525 0 0.26 0 0.028 18 1.414 0.2 0 0.525 0 0.26 0 0.028 19 -1.414 0.01 0 0.525 0 0.26 0 0.028 20 0 0.105 1.414 1.0 0 0.26 0 0.028
21 0 0.105 -1.414 0.05 0 0.26 0 0.028 22 0 0.105 0 0.525 1.414 0.5 0 0.028 23 0 0.105 0 0.525 -1.414 0.02 0 0.028 24 0 0.105 0 0.525 0 0.26 1.414 0.05 25 0 0.105 0 0.525 0 0.26 -1.414 0.005
26 0 0.105 0 0.525 0 0.26 0 0.028 27 0 0.105 0 0.525 0 0.26 0 0.028 28 0 0.105 0 0.525 0 0.26 0 0.028 29 0 0.105 0 0.525 0 0.26 0 0.028 30 0 0.105 0 0.525 0 0.26 0 0.028
Chapter I: Characterization of indigenous Botryococcus sp. and microalgal lipid production
Page 34
2.3.7. Isolation and purification of Botryococcus sp.
The algal samples were collected from the blooms in freshwater ponds of Mahabalipuram
(Latitude 12o37' in the North to Longitude 80
o14' in the East.) Tamil Nadu, India. The
samples were cultured in modified Chu 13 medium and subjected to purification by serial
dilution. The individual colonies were microscopically observed for their colonial and
morphological features. Pure culture was obtained from single colony and the culture was
established in both liquid and agar slants of modified Chu 13 medium, incubated at 25 ±
1°C under of 1.2 ± 0.2 klux irradiance with 16h: 8h light dark cycle. The purity of the
culture was ensured by repeated plating and by regular observation under microscope.
The Indian isolate was analyzed for its 18S rRNA sequence along with hydrocarbons,
carotenoids and fatty acids profiles.
2.3.7.1. Light Microscopy and Scanning Electron Microscopy
The algal cells were observed under light microscopy for their morphological features
and for other cellular details, the cells were further studied using scanning electron
microscopy (SEM) according to the method of Fowke et al. (1994). The samples were
fixed in 2% glutaraldehyde in 0.2 M phosphate buffer (pH 6.8) for 12 h, dried in alcohol
series up to 100%, sputter coated with gold and examined in a LEO Scanning Electron
Microscope 435 VP (Leo Electron Microscopy Ltd. Cambridge UK).
2.3.7.2. Biomass estimation
The known volume of cultures was harvested by centrifugation at 5000 rpm for 5 minutes
and the pellet was washed at least twice with distilled water and freeze dried. The dry
weight of algal biomass was determined gravimetrically and growth was expressed in
terms of dry weight gram per liter.
2.3.7.3. Chlorophyll and carotenoids estimation
A known volume of culture was centrifuged at 5000 rpm for 5 min and the pellet was
treated with known volume of methanol (1:1) and kept in water bath for 30 min at 60ºC.
Absorbance of the pooled extracts was measured at 450, 652 and 665 nm and total
chlorophyll and total carotenoids were estimated using Lichtenthaler equations
(Lichtenthaler, 1987).
Chapter I: Characterization of indigenous Botryococcus sp. and microalgal lipid production
Page 35
2.3.7.4. Hydrocarbon extraction and Analysis by GC-MS
Hydrocarbons were extracted by homogenizing the dry biomass with n-hexane for 30 min
intermittently. Supernatant recovered was evaporated to complete dryness under the
stream of nitrogen. Hydrocarbon content was measured gravimetrically and expressed as
percentage dry weight by the method of Sawayama et al. (1999). The hydrocarbon
samples were analyzed on SPB-5 column (30m × 0.32mm ID × 0.25 µm film thickness)
using GCMS equipped with FID and were identified by Dayananda et al. (2005)
comparing their fragmentation pattern with standards (Sigma chemicals USA) and with
NIST library.
2.3.7.5. Total Lipid estimation and Fatty acid Analysis
Total lipids were extracted with chloroform-methanol (2:1) and quantified
gravimetrically. The fatty acid methyl esters (FAME) were prepared by following the
procedure of Christie (1982). FAME were analyzed by GC-MS (PerkinElmer, Turbomass
Gold, Mass spectrometer) equipped with FID using SPB-1 (poly(dimethysiloxane))
capillary column (30m × 0.32mm ID × 0.25 µm film thickness) with a temperature
programming of 150°C(3’) to 280°C (5’) at a rate of 5°C/min. The FAMEs were
identified by comparing their fragmentation pattern with authentic standards (Sigma) and
with NIST library.
2.3.7.6. HPLC analysis of carotenoids
The acetone extract of the alga B. mahabali was analyzed by HPLC using a reversed
phase C18 column (4.5 cm ×150 mm) with an isocratic solvent system consisting of
acetonitrile/methanol/dichloromethane (7:1:2) at a flow rate of 1.0 ml/min and the
compounds were detected at 450 nm. Lutein and β-carotene were identified in the algal
extracts by comparing the retention time of the standards lutein and β-carotene procured
from sigma chemicals (Sigma chemicals, USA).
2.3.7.7. Extraction of genomic DNA and 18S rRNA amplification
Genomic DNA was extracted from the lyophilized algal biomass by liquid nitrogen using
the GenElute™ Plant Genomic DNA Mini prep kit (Sigma, St. Louis, USA). The RNA
contamination was removed by digesting the extract with 10 µg of RNase-A (Bangalore
Genei, Bangalore, India) for 30 min at 37 ºC. Quality and quantity of DNA preparations
were checked by standard spectrophotometry and the samples were diluted to a
Chapter I: Characterization of indigenous Botryococcus sp. and microalgal lipid production
Page 36
concentration of 25 ng µL-1
and used for PCR reactions. The 18S rRNA gene specific
primers for the Botryococcus sp. were designed from the reported sequences at NCBI
data base, 5’-CTGTGAAACTGCGAATGGC3’ as forward primer and 5’-
5’CTCCAATCCCTAGTCGGCATCG-3’ as reverse primer. PCR reaction was
performed in thermo-cycler using a PCR programme with 4 min initial denaturation at
94ºC and 35 cycles of 1 min denaturation at 94ºC, 1 min annealing at 52
ºC and 30 sec
extension at 72ºC with final extension at 72ºC for 10 min. The PCR products were
separated on agarose gels and stained with ethidium bromide and the gels were recorded
with a Hero Lab gel documentation system. The PCR was performed at least thrice to
check the reproducibility and then the PCR product was purified by the purification kit
supplied by Sigma and was again checked by gel electrophoresis. The PCR product was
cloned in T/A cloning vector (kit supplied by Invitrogen) and was sequenced after
confirmation by both PCR and restriction digestion. The sequence was submitted to
NCBI data base and was accorded with an accession number GU182893.1.
2.3.8. Preparation of template DNA for RAPD analysis
The genomic DNA from the two weeks grown cultures was extracted by using the
GenEluteTM
Plant Genomic DNA Mini prep kit supplied by Sigma (USA). RNA
contamination in all the samples were removed using RNase-A by following the
manufacturers protocol (100 µg mL-1
; Bangalore Genei, India) for 30 min at 37°C. The
quality and quantity of DNA were analyzed by standard spectrophotometry and the
samples were diluted to 25ng µL-1
.
2.3.8.1. DNA amplification for RAPD analysis
RAPD amplifications were performed using PCR mixture (25µL) having 1µL of genomic
DNA as template, 1X PCR buffer, 200 µM dNTPs, 1 unit (U) of Taq DNA polymerase
and 1 µM of each primer (Table 16, Results and discussion section) with an initial
denaturation at 93ºC for 4 min followed by 40 cycles of 1 min denaturation at 94°C, 1
min annealing at 36°C and 2 min extension at 72°C with a terminal extension of 72°C for
10 min using a thermal cycler (Eppendorf Thermal cycler, Model: 5332). The amplified
fragments were eletrophoretically separated in 2% agarose gels in TAE and stained in
ethidium bromide (0.001%) and documented in a gel documentation system (Hero-Lab
Chapter I: Characterization of indigenous Botryococcus sp. and microalgal lipid production
Page 37
GMBH, Germany). The size of the amplification products was estimated from 10kb DNA
ladder (Fermentas GMBH, Germany).
2.3.8.2. Resolving power (Rp) for RAPD analysis
Resolving power (Rp) for each primer was calculated following the method of Prevost
and Wilkinson (1999) for selecting primers that can distinguish a maximal number of
accessions. Resolving power (Rp) of a primer is = Ib where Ib (band informativeness)
takes the value of: Ib = 1 - [2 x |0.5 - p|], p being the proportion of the 7 genotypes (algal
strain analyzed) containing the bands.
2.3.8.3. Data analysis for RAPD analysis
The well-resolved RAPD fragments ranging from 100 to 3000 bp were scored as present
(1) or absent (0) for each primer analysis. Bands with the same migration distance were
considered homologous. The data was computed and analyzed with NTSYS pc (Rohlf
1998) version 2.02 using the simple matching coefficient (Sokal and Michener 1958).
Cluster analyses were obtained based on similarity matrices, using the unweighted pair
group method with arithmetic mean (UPGMA), and relationships between accessions
were visualized as dendrogram.
Chapter I: Characterization of indigenous Botryococcus sp. and microalgal lipid production
Page 38
2.4. Results and Discussion
2.4.1. Effect of culture conditions on Botryococcus sp.
2.4.1.1. Effect of different nitrogen sources
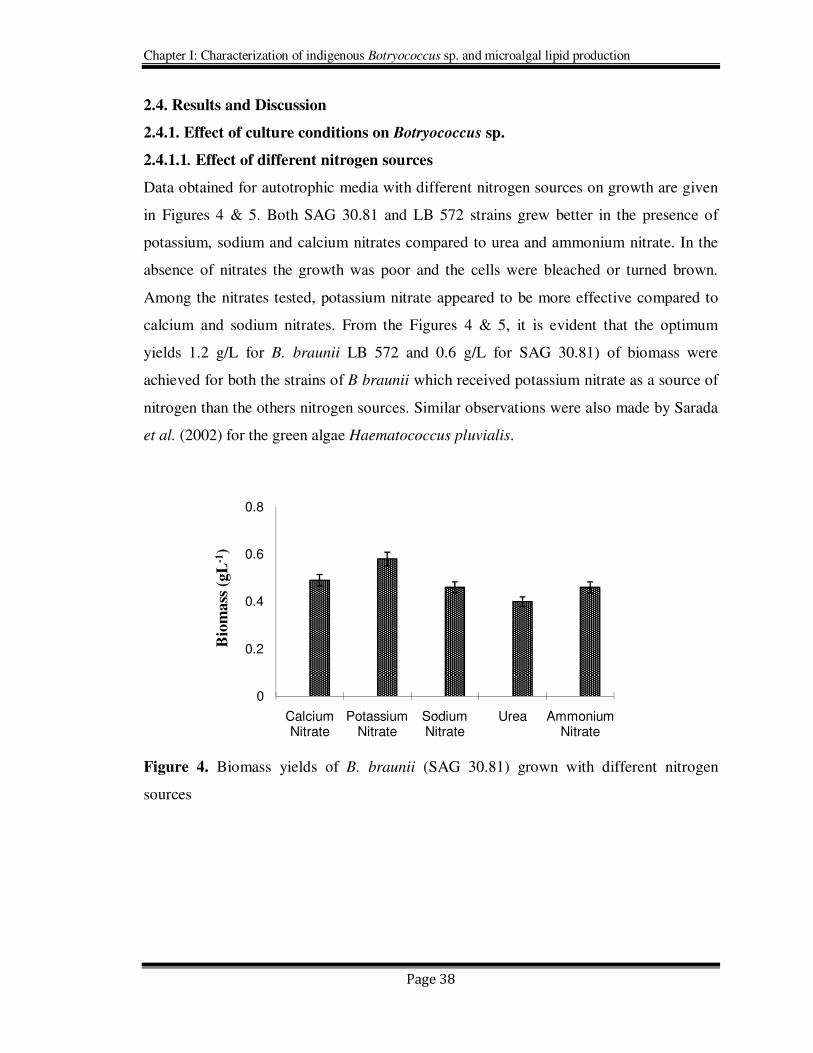
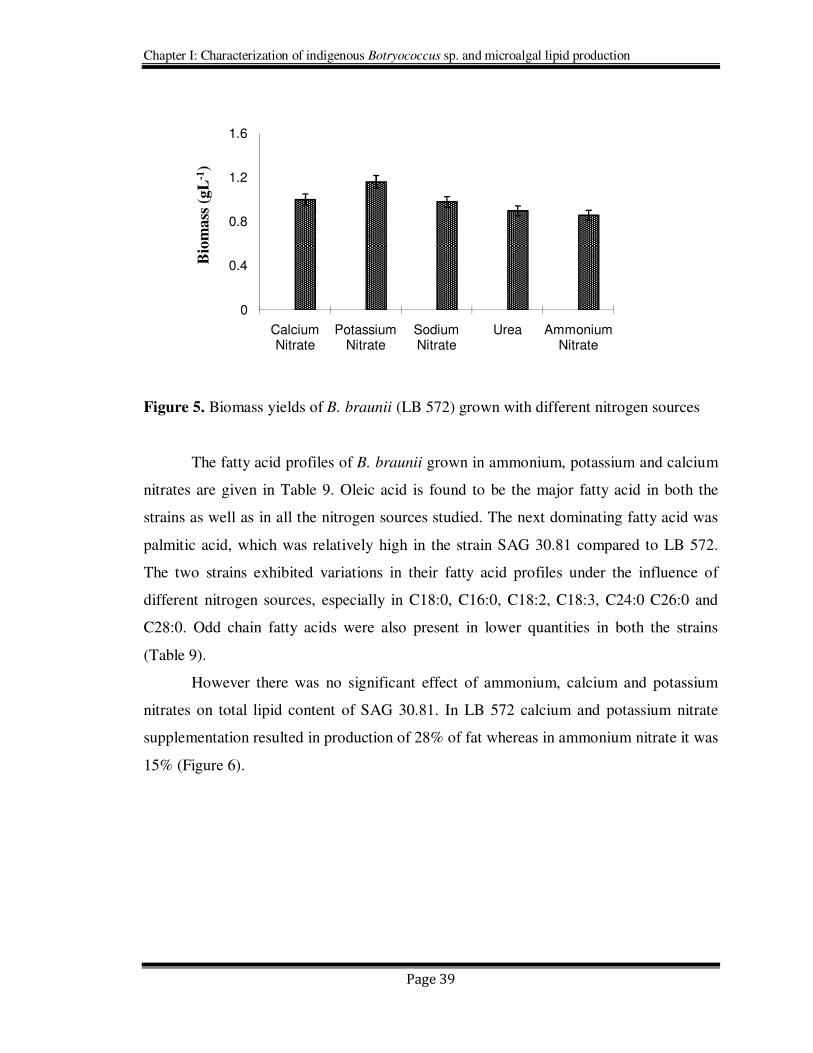
Data obtained for autotrophic media with different nitrogen sources on growth are given
in Figures 4 & 5. Both SAG 30.81 and LB 572 strains grew better in the presence of
potassium, sodium and calcium nitrates compared to urea and ammonium nitrate. In the
absence of nitrates the growth was poor and the cells were bleached or turned brown.
Among the nitrates tested, potassium nitrate appeared to be more effective compared to
calcium and sodium nitrates. From the Figures 4 & 5, it is evident that the optimum
yields 1.2 g/L for B. braunii LB 572 and 0.6 g/L for SAG 30.81) of biomass were
achieved for both the strains of B braunii which received potassium nitrate as a source of
nitrogen than the others nitrogen sources. Similar observations were also made by Sarada
et al. (2002) for the green algae Haematococcus pluvialis.
Figure 4. Biomass yields of B. braunii (SAG 30.81) grown with different nitrogen
sources
0
0.2
0.4
0.6
0.8
Calcium
Nitrate
Potassium
Nitrate
Sodium
Nitrate
Urea Ammonium
Nitrate
Bio
mass
(gL
-1)
Chapter I: Characterization of indigenous Botryococcus sp. and microalgal lipid production
Page 39
Figure 5. Biomass yields of B. braunii (LB 572) grown with different nitrogen sources
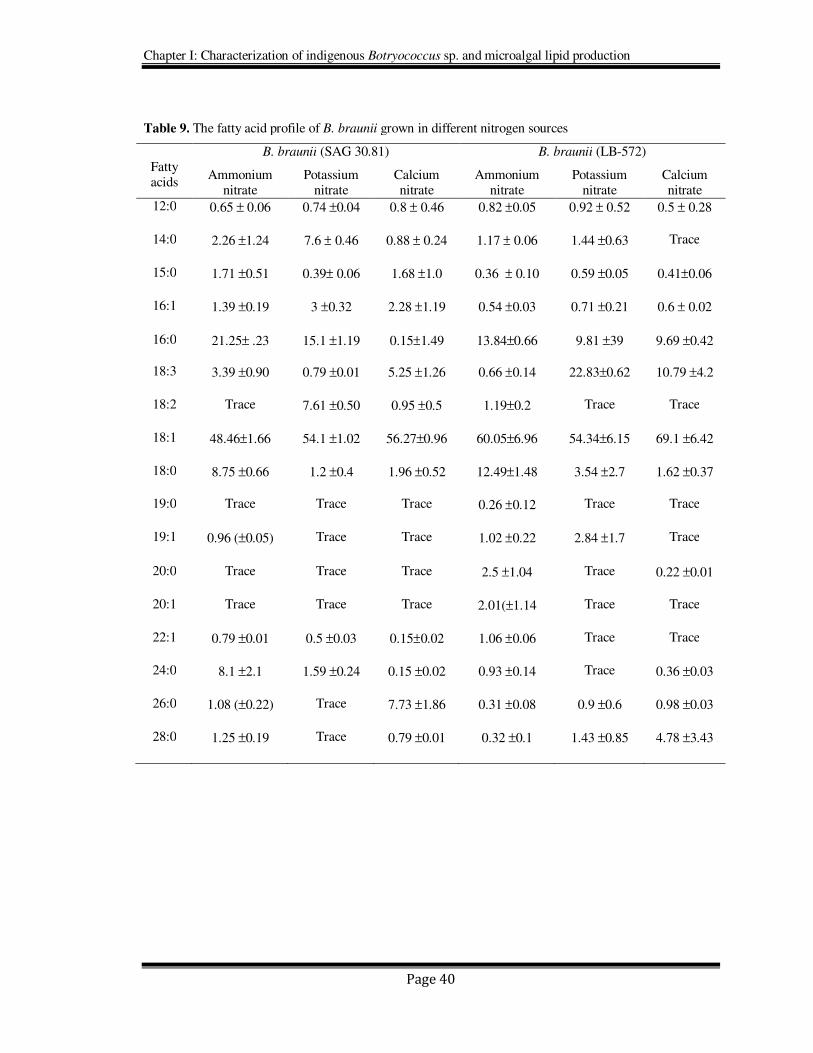
The fatty acid profiles of B. braunii grown in ammonium, potassium and calcium
nitrates are given in Table 9. Oleic acid is found to be the major fatty acid in both the
strains as well as in all the nitrogen sources studied. The next dominating fatty acid was
palmitic acid, which was relatively high in the strain SAG 30.81 compared to LB 572.
The two strains exhibited variations in their fatty acid profiles under the influence of
different nitrogen sources, especially in C18:0, C16:0, C18:2, C18:3, C24:0 C26:0 and
C28:0. Odd chain fatty acids were also present in lower quantities in both the strains
(Table 9).
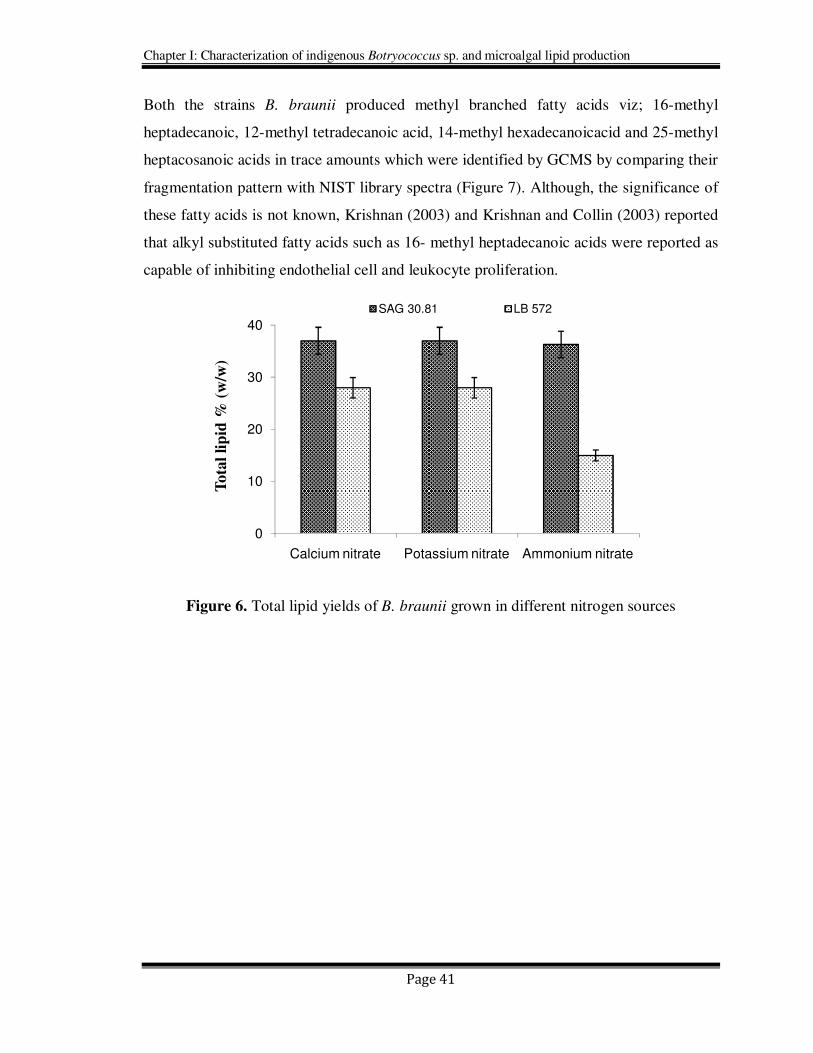
However there was no significant effect of ammonium, calcium and potassium
nitrates on total lipid content of SAG 30.81. In LB 572 calcium and potassium nitrate
supplementation resulted in production of 28% of fat whereas in ammonium nitrate it was
15% (Figure 6).
0
0.4
0.8
1.2
1.6
Calcium
Nitrate
Potassium
Nitrate
Sodium
Nitrate
Urea Ammonium
Nitrate
Bio
mass
(gL
-1)
Chapter I: Characterization of indigenous Botryococcus sp. and microalgal lipid production
Page 40
Table 9. The fatty acid profile of B. braunii grown in different nitrogen sources
Fatty acids
B. braunii (SAG 30.81) B. braunii (LB-572)
Ammonium nitrate
Potassium nitrate
Calcium nitrate
Ammonium nitrate
Potassium nitrate
Calcium nitrate
12:0 0.65 ± 0.06 0.74 ±0.04 0.8 ± 0.46 0.82 ±0.05 0.92 ± 0.52 0.5 ± 0.28
14:0 2.26 ±1.24 7.6 ± 0.46 0.88 ± 0.24 1.17 ± 0.06 1.44 ±0.63 Trace
15:0 1.71 ±0.51 0.39± 0.06 1.68 ±1.0 0.36 ± 0.10 0.59 ±0.05 0.41±0.06
16:1 1.39 ±0.19 3 ±0.32 2.28 ±1.19 0.54 ±0.03 0.71 ±0.21 0.6 ± 0.02
16:0 21.25± .23 15.1 ±1.19 0.15±1.49 13.84±0.66 9.81 ±39 9.69 ±0.42
18:3 3.39 ±0.90 0.79 ±0.01 5.25 ±1.26 0.66 ±0.14 22.83±0.62 10.79 ±4.2
18:2 Trace 7.61 ±0.50 0.95 ±0.5 1.19±0.2 Trace Trace
18:1 48.46±1.66 54.1 ±1.02 56.27±0.96 60.05±6.96 54.34±6.15 69.1 ±6.42
18:0 8.75 ±0.66 1.2 ±0.4 1.96 ±0.52 12.49±1.48 3.54 ±2.7 1.62 ±0.37
19:0 Trace Trace Trace 0.26 ±0.12 Trace Trace
19:1 0.96 (±0.05) Trace Trace 1.02 ±0.22 2.84 ±1.7 Trace
20:0 Trace Trace Trace 2.5 ±1.04 Trace 0.22 ±0.01
20:1 Trace Trace Trace 2.01(±1.14 Trace Trace
22:1 0.79 ±0.01 0.5 ±0.03 0.15±0.02 1.06 ±0.06 Trace Trace
24:0 8.1 ±2.1 1.59 ±0.24 0.15 ±0.02 0.93 ±0.14 Trace 0.36 ±0.03
26:0 1.08 (±0.22) Trace 7.73 ±1.86 0.31 ±0.08 0.9 ±0.6 0.98 ±0.03
28:0 1.25 ±0.19 Trace 0.79 ±0.01 0.32 ±0.1 1.43 ±0.85 4.78 ±3.43
Chapter I: Characterization of indigenous Botryococcus sp. and microalgal lipid production
Page 41
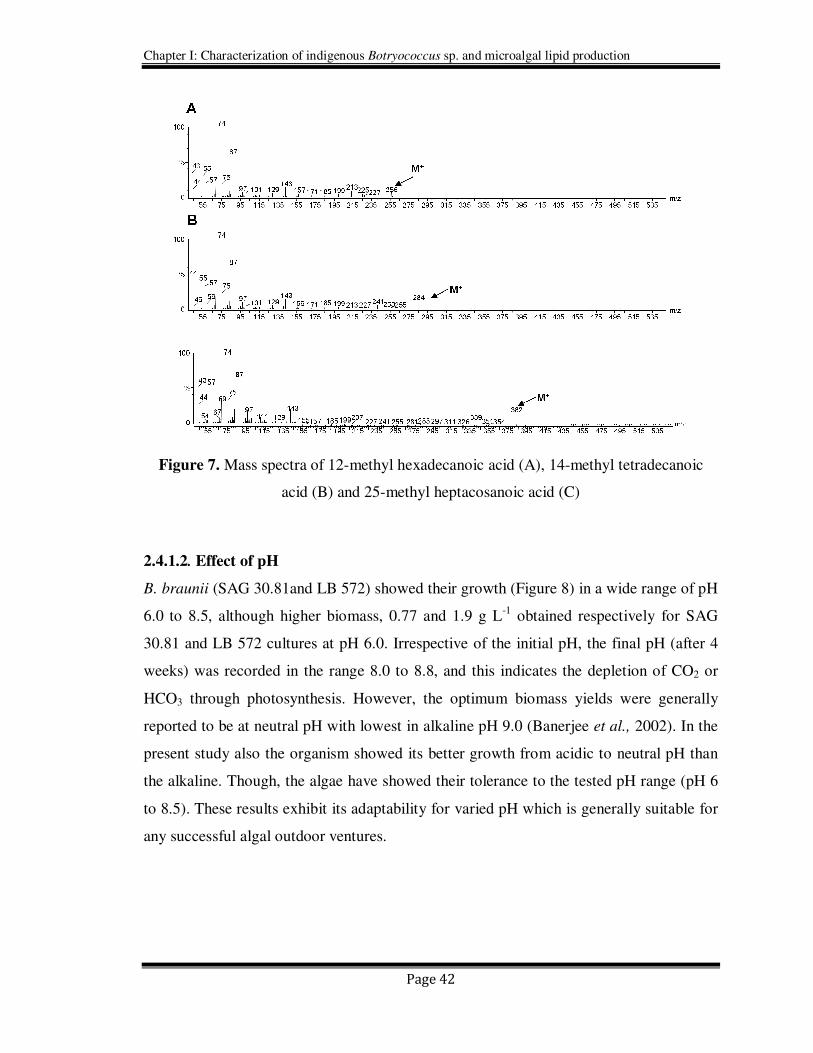
Both the strains B. braunii produced methyl branched fatty acids viz; 16-methyl
heptadecanoic, 12-methyl tetradecanoic acid, 14-methyl hexadecanoicacid and 25-methyl
heptacosanoic acids in trace amounts which were identified by GCMS by comparing their
fragmentation pattern with NIST library spectra (Figure 7). Although, the significance of
these fatty acids is not known, Krishnan (2003) and Krishnan and Collin (2003) reported
that alkyl substituted fatty acids such as 16- methyl heptadecanoic acids were reported as
capable of inhibiting endothelial cell and leukocyte proliferation.
Figure 6. Total lipid yields of B. braunii grown in different nitrogen sources
0
10
20
30
40
Calcium nitrate Potassium nitrate Ammonium nitrate
Tota
l li
pid
% (
w/w
)
SAG 30.81 LB 572
Chapter I: Characterization of indigenous Botryococcus sp. and microalgal lipid production
Page 42
Figure 7. Mass spectra of 12-methyl hexadecanoic acid (A), 14-methyl tetradecanoic
acid (B) and 25-methyl heptacosanoic acid (C)
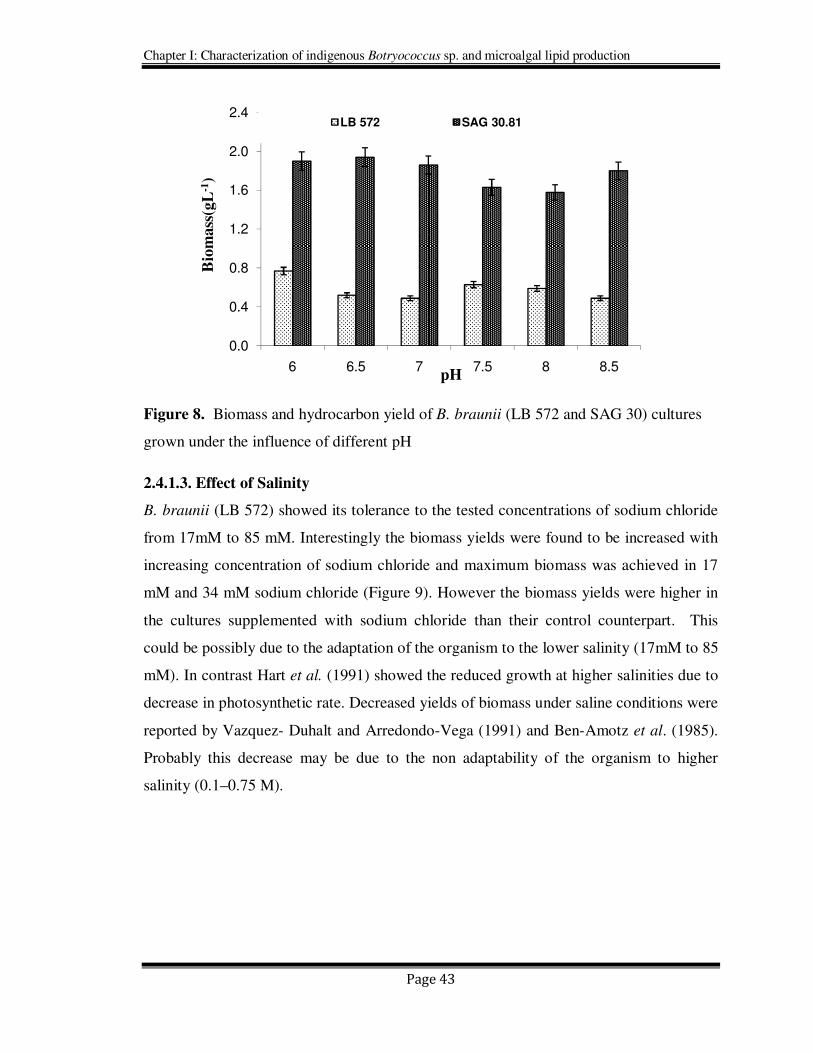
2.4.1.2. Effect of pH
B. braunii (SAG 30.81and LB 572) showed their growth (Figure 8) in a wide range of pH
6.0 to 8.5, although higher biomass, 0.77 and 1.9 g L-1
obtained respectively for SAG
30.81 and LB 572 cultures at pH 6.0. Irrespective of the initial pH, the final pH (after 4
weeks) was recorded in the range 8.0 to 8.8, and this indicates the depletion of CO2 or
HCO3 through photosynthesis. However, the optimum biomass yields were generally
reported to be at neutral pH with lowest in alkaline pH 9.0 (Banerjee et al., 2002). In the
present study also the organism showed its better growth from acidic to neutral pH than
the alkaline. Though, the algae have showed their tolerance to the tested pH range (pH 6
to 8.5). These results exhibit its adaptability for varied pH which is generally suitable for
any successful algal outdoor ventures.
Chapter I: Characterization of indigenous Botryococcus sp. and microalgal lipid production
Page 43
Figure 8. Biomass and hydrocarbon yield of B. braunii (LB 572 and SAG 30) cultures
grown under the influence of different pH
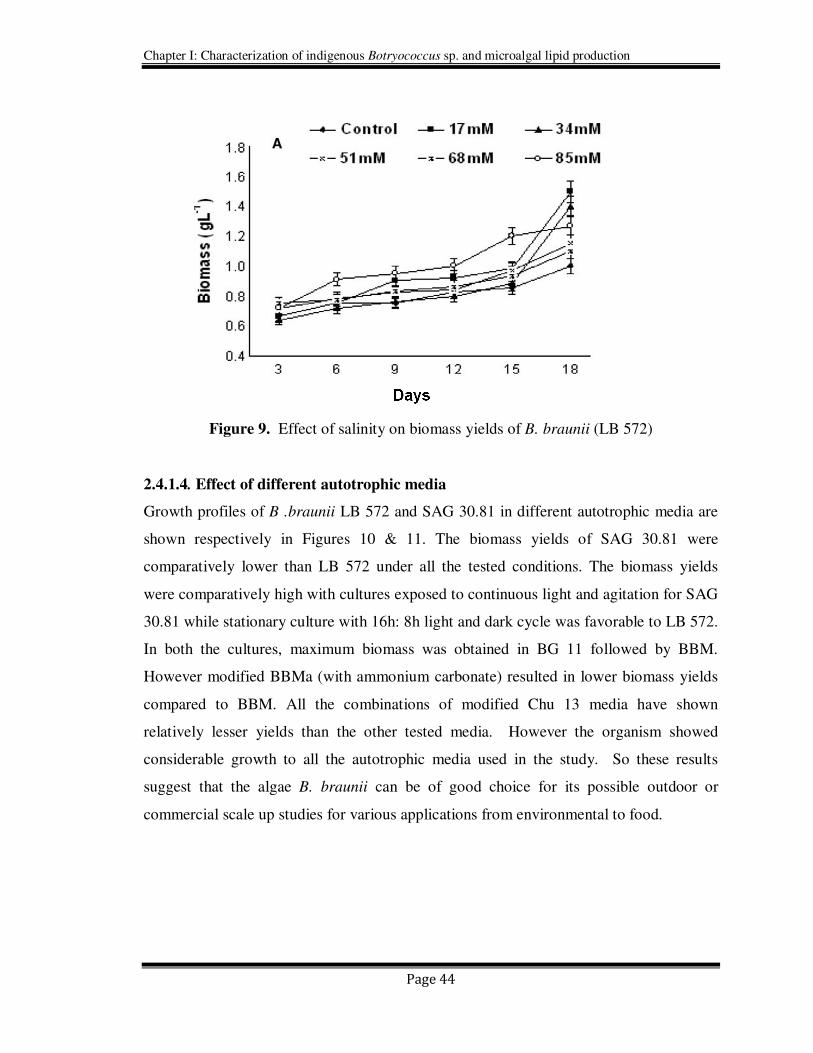
2.4.1.3. Effect of Salinity
B. braunii (LB 572) showed its tolerance to the tested concentrations of sodium chloride
from 17mM to 85 mM. Interestingly the biomass yields were found to be increased with
increasing concentration of sodium chloride and maximum biomass was achieved in 17
mM and 34 mM sodium chloride (Figure 9). However the biomass yields were higher in
the cultures supplemented with sodium chloride than their control counterpart. This
could be possibly due to the adaptation of the organism to the lower salinity (17mM to 85
mM). In contrast Hart et al. (1991) showed the reduced growth at higher salinities due to
decrease in photosynthetic rate. Decreased yields of biomass under saline conditions were
reported by Vazquez- Duhalt and Arredondo-Vega (1991) and Ben-Amotz et al. (1985).
Probably this decrease may be due to the non adaptability of the organism to higher
salinity (0.1–0.75 M).
0.0
0.4
0.8
1.2
1.6
2.0
2.4
6 6.5 7 7.5 8 8.5
Bio
mass
(gL
-1)
pH
LB 572 SAG 30.81
Chapter I: Characterization of indigenous Botryococcus sp. and microalgal lipid production
Page 44
Figure 9. Effect of salinity on biomass yields of B. braunii (LB 572)
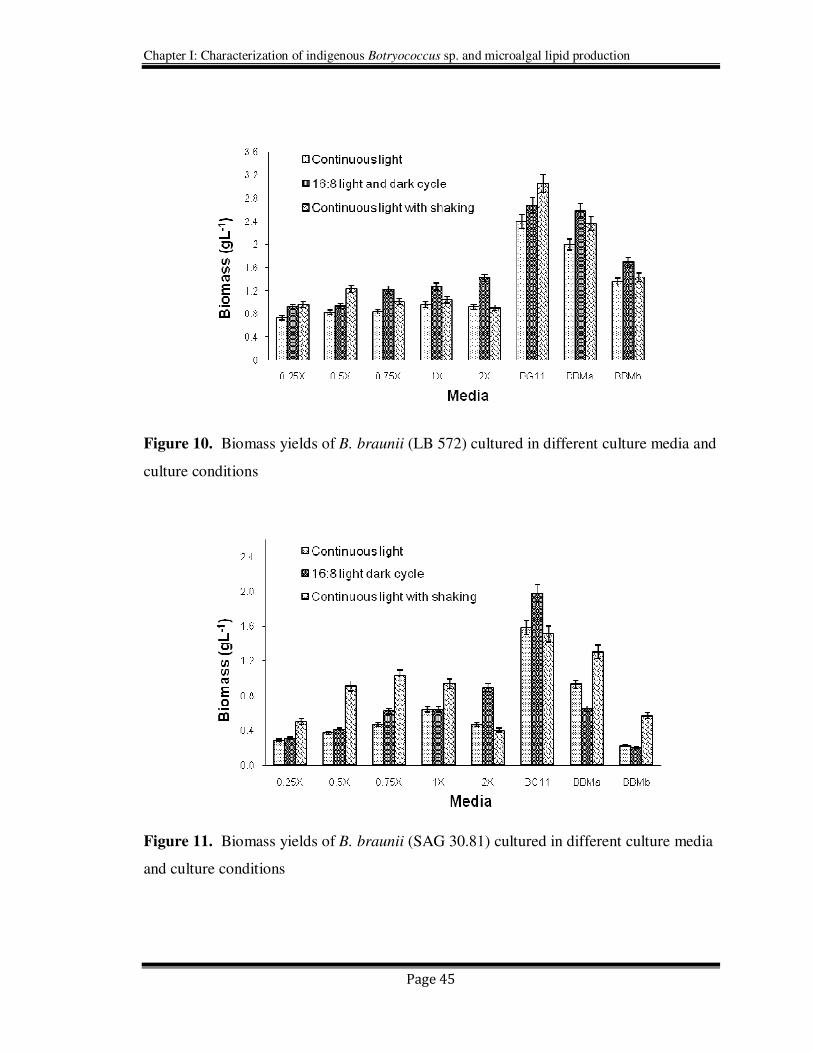
2.4.1.4. Effect of different autotrophic media
Growth profiles of B .braunii LB 572 and SAG 30.81 in different autotrophic media are
shown respectively in Figures 10 & 11. The biomass yields of SAG 30.81 were
comparatively lower than LB 572 under all the tested conditions. The biomass yields
were comparatively high with cultures exposed to continuous light and agitation for SAG
30.81 while stationary culture with 16h: 8h light and dark cycle was favorable to LB 572.
In both the cultures, maximum biomass was obtained in BG 11 followed by BBM.
However modified BBMa (with ammonium carbonate) resulted in lower biomass yields
compared to BBM. All the combinations of modified Chu 13 media have shown
relatively lesser yields than the other tested media. However the organism showed
considerable growth to all the autotrophic media used in the study. So these results
suggest that the algae B. braunii can be of good choice for its possible outdoor or
commercial scale up studies for various applications from environmental to food.
Chapter I: Characterization of indigenous Botryococcus sp. and microalgal lipid production
Page 45
Figure 10. Biomass yields of B. braunii (LB 572) cultured in different culture media and
culture conditions
Figure 11. Biomass yields of B. braunii (SAG 30.81) cultured in different culture media
and culture conditions
Chapter I: Characterization of indigenous Botryococcus sp. and microalgal lipid production
Page 46
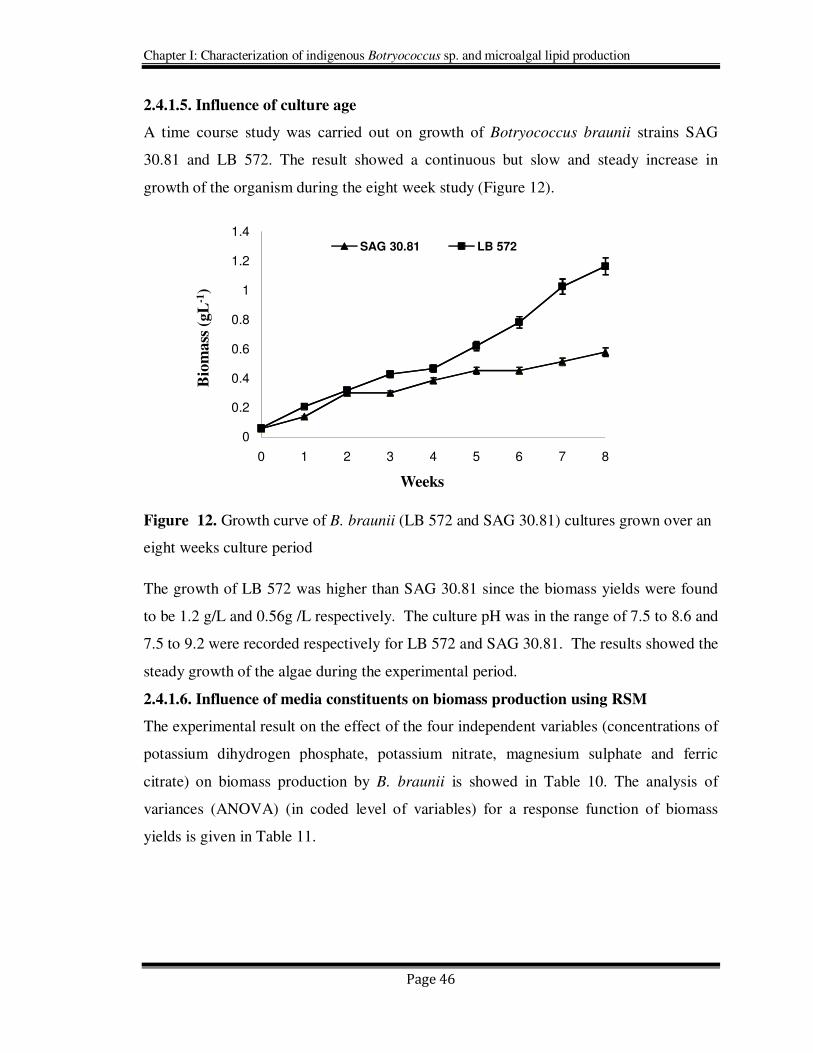
2.4.1.5. Influence of culture age
A time course study was carried out on growth of Botryococcus braunii strains SAG
30.81 and LB 572. The result showed a continuous but slow and steady increase in
growth of the organism during the eight week study (Figure 12).
Figure 12. Growth curve of B. braunii (LB 572 and SAG 30.81) cultures grown over an
eight weeks culture period
The growth of LB 572 was higher than SAG 30.81 since the biomass yields were found
to be 1.2 g/L and 0.56g /L respectively. The culture pH was in the range of 7.5 to 8.6 and
7.5 to 9.2 were recorded respectively for LB 572 and SAG 30.81. The results showed the
steady growth of the algae during the experimental period.
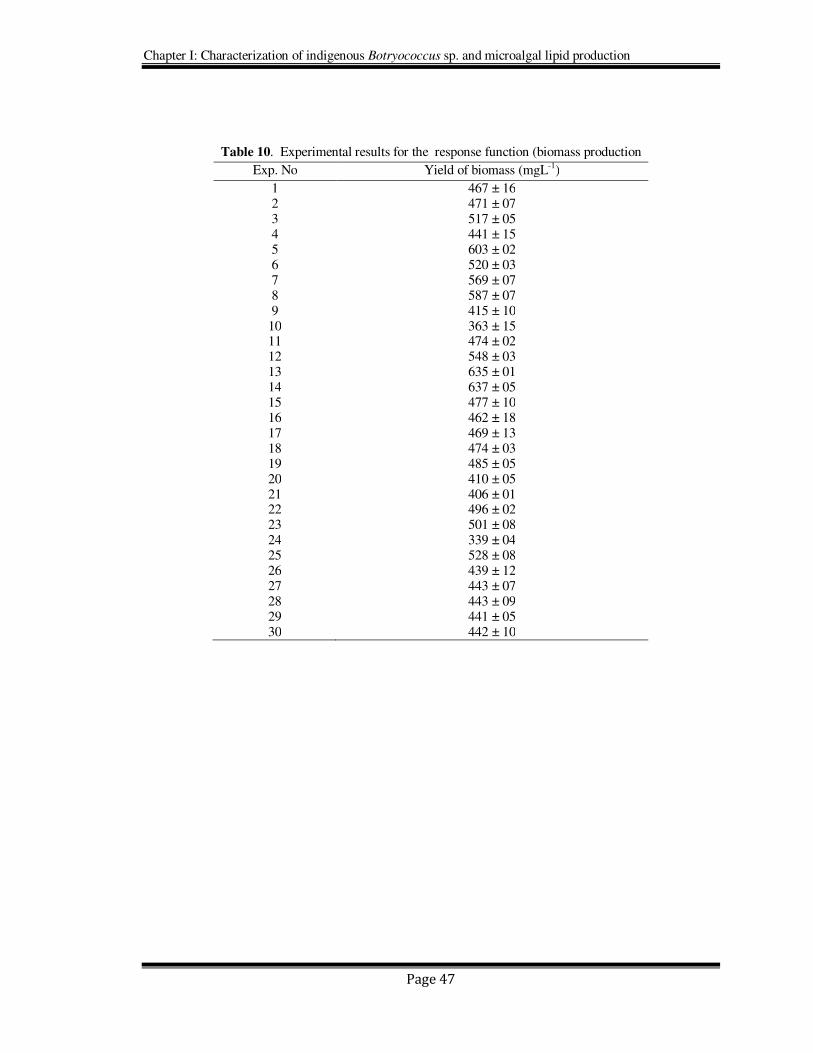
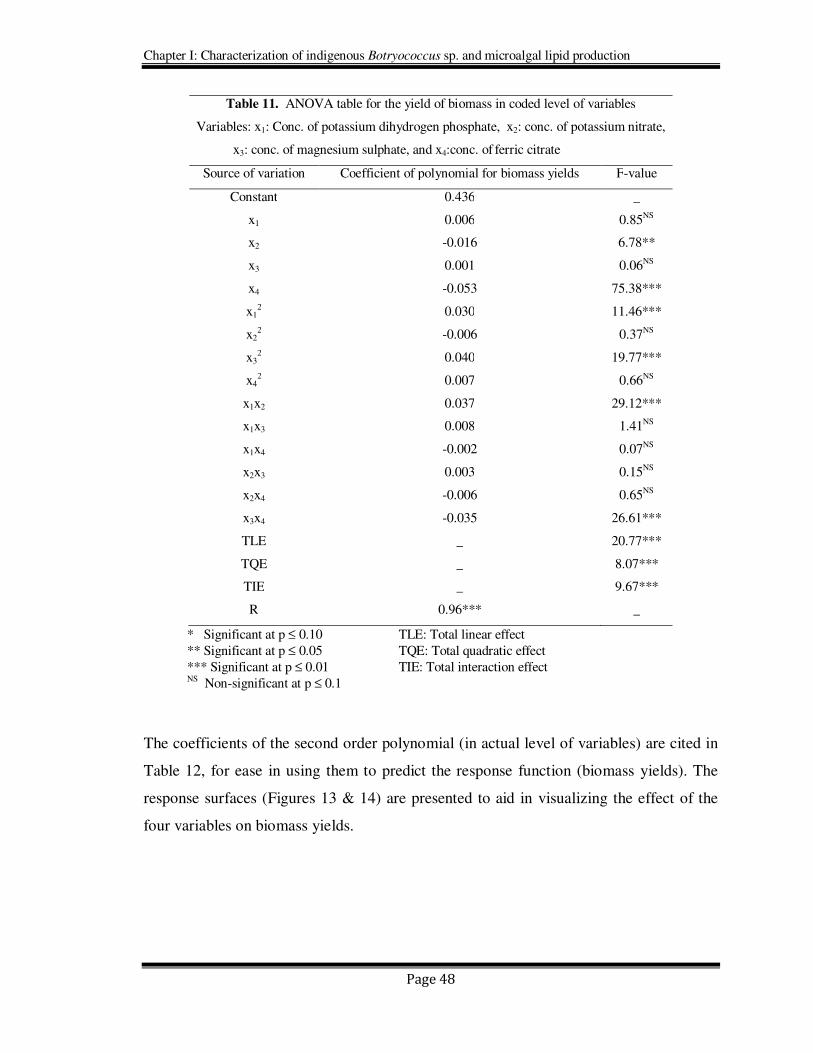
2.4.1.6. Influence of media constituents on biomass production using RSM
The experimental result on the effect of the four independent variables (concentrations of
potassium dihydrogen phosphate, potassium nitrate, magnesium sulphate and ferric
citrate) on biomass production by B. braunii is showed in Table 10. The analysis of
variances (ANOVA) (in coded level of variables) for a response function of biomass
yields is given in Table 11.
0
0.2
0.4
0.6
0.8
1
1.2
1.4
0 1 2 3 4 5 6 7 8
Bio
mass
(g
L-1
)
Weeks
SAG 30.81 LB 572
Chapter I: Characterization of indigenous Botryococcus sp. and microalgal lipid production
Page 47
Table 10. Experimental results for the response function (biomass production
Exp. No Yield of biomass (mgL-1)
1 467 ± 16 2 471 ± 07 3 517 ± 05 4 441 ± 15 5 603 ± 02 6 520 ± 03 7 569 ± 07 8 587 ± 07 9 415 ± 10
10 363 ± 15 11 474 ± 02 12 548 ± 03 13 635 ± 01 14 637 ± 05 15 477 ± 10 16 462 ± 18 17 469 ± 13 18 474 ± 03 19 485 ± 05 20 410 ± 05 21 406 ± 01 22 496 ± 02 23 501 ± 08 24 339 ± 04 25 528 ± 08 26 439 ± 12 27 443 ± 07 28 443 ± 09 29 441 ± 05 30 442 ± 10
Chapter I: Characterization of indigenous Botryococcus sp. and microalgal lipid production
Page 48
Table 11. ANOVA table for the yield of biomass in coded level of variables
Variables: x1: Conc. of potassium dihydrogen phosphate, x2: conc. of potassium nitrate,
x3: conc. of magnesium sulphate, and x4:conc. of ferric citrate
Source of variation Coefficient of polynomial for biomass yields F-value
Constant 0.436 _
x1 0.006 0.85NS
x2 -0.016 6.78**
x3 0.001 0.06NS
x4 -0.053 75.38***
x12 0.030 11.46***
x22 -0.006 0.37NS
x32 0.040 19.77***
x42 0.007 0.66NS
x1x2 0.037 29.12***
x1x3 0.008 1.41NS
x1x4 -0.002 0.07NS
x2x3 0.003 0.15NS
x2x4 -0.006 0.65NS
x3x4 -0.035 26.61***
TLE _ 20.77***
TQE _ 8.07***
TIE _ 9.67***
R 0.96*** _
* Significant at p ≤ 0.10 TLE: Total linear effect
** Significant at p ≤ 0.05 TQE: Total quadratic effect
*** Significant at p ≤ 0.01 TIE: Total interaction effect NS Non-significant at p ≤ 0.1
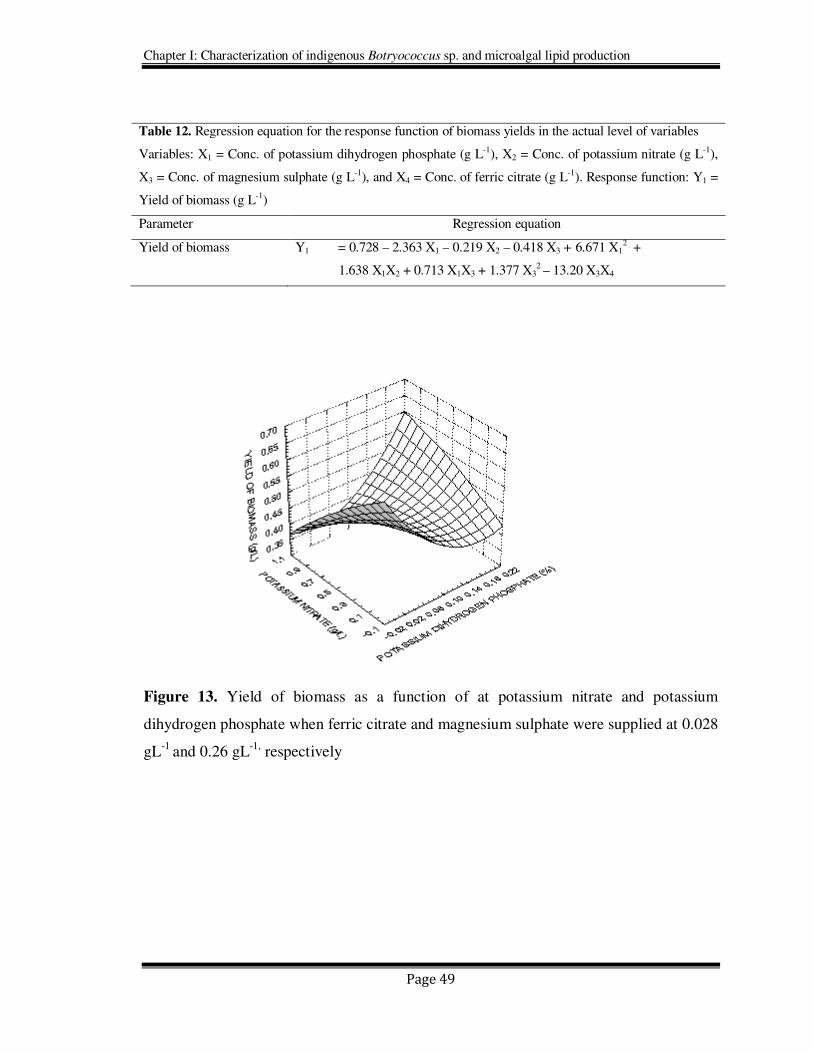
The coefficients of the second order polynomial (in actual level of variables) are cited in
Table 12, for ease in using them to predict the response function (biomass yields). The
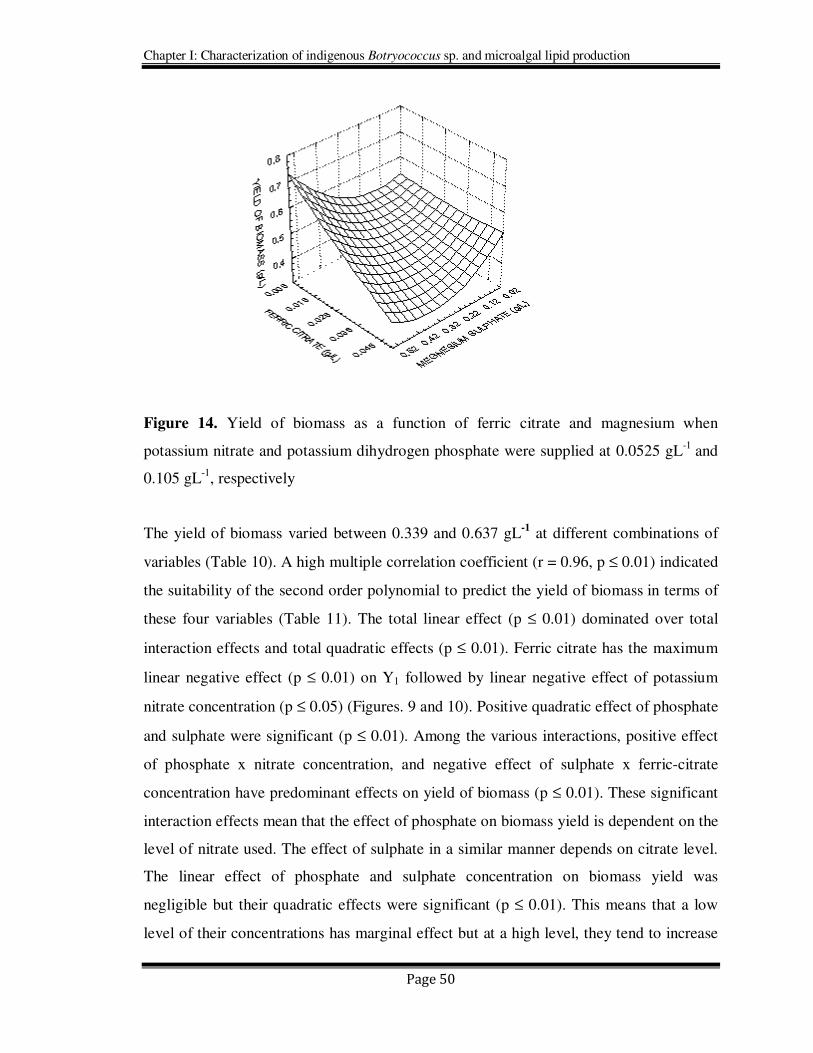
response surfaces (Figures 13 & 14) are presented to aid in visualizing the effect of the
four variables on biomass yields.
Chapter I: Characterization of indigenous Botryococcus sp. and microalgal lipid production
Page 49
Table 12. Regression equation for the response function of biomass yields in the actual level of variables
Variables: X1 = Conc. of potassium dihydrogen phosphate (g L-1), X2 = Conc. of potassium nitrate (g L-1),
X3 = Conc. of magnesium sulphate (g L-1), and X4 = Conc. of ferric citrate (g L-1). Response function: Y1 =
Yield of biomass (g L-1)
Parameter Regression equation
Yield of biomass Y1 = 0.728 – 2.363 X1 – 0.219 X2 – 0.418 X3 + 6.671 X1
2 +
1.638 X1X2 + 0.713 X1X3 + 1.377 X32 – 13.20 X3X4
Figure 13. Yield of biomass as a function of at potassium nitrate and potassium
dihydrogen phosphate when ferric citrate and magnesium sulphate were supplied at 0.028
gL-1
and 0.26 gL-1,
respectively
Chapter I: Characterization of indigenous Botryococcus sp. and microalgal lipid production
Page 50
Figure 14. Yield of biomass as a function of ferric citrate and magnesium when
potassium nitrate and potassium dihydrogen phosphate were supplied at 0.0525 gL-1
and
0.105 gL-1
, respectively
The yield of biomass varied between 0.339 and 0.637 gL-1
at different combinations of
variables (Table 10). A high multiple correlation coefficient (r = 0.96, p ≤ 0.01) indicated
the suitability of the second order polynomial to predict the yield of biomass in terms of
these four variables (Table 11). The total linear effect (p ≤ 0.01) dominated over total
interaction effects and total quadratic effects (p ≤ 0.01). Ferric citrate has the maximum
linear negative effect (p ≤ 0.01) on Y1 followed by linear negative effect of potassium
nitrate concentration (p ≤ 0.05) (Figures. 9 and 10). Positive quadratic effect of phosphate
and sulphate were significant (p ≤ 0.01). Among the various interactions, positive effect
of phosphate x nitrate concentration, and negative effect of sulphate x ferric-citrate
concentration have predominant effects on yield of biomass (p ≤ 0.01). These significant
interaction effects mean that the effect of phosphate on biomass yield is dependent on the
level of nitrate used. The effect of sulphate in a similar manner depends on citrate level.
The linear effect of phosphate and sulphate concentration on biomass yield was
negligible but their quadratic effects were significant (p ≤ 0.01). This means that a low
level of their concentrations has marginal effect but at a high level, they tend to increase
Chapter I: Characterization of indigenous Botryococcus sp. and microalgal lipid production
Page 51
the yield of biomass markedly. Therefore, high levels of potassium hydrogen phosphate
and magnesium sulphate concentration are expected to increase the yield of biomass in
the experimental ranges used.
It is concluded that high levels of phosphate and sulphate in the range of
experimental variables are desirable but their individual effects depend on the
concentrations of nitrate and citrate, respectively. The optimum medium conditions of
dihydrogen potassium phosphate, potassium nitrate, magnesium sulphate and ferric
citrate concentration were found to be 0.0195, 0.05, 0.02 and 0.0185 gL-1
respectively for
biomass yield of 0.65 gL-1
. Whereas in the control (modified Chu 13) medium yielded
only 0.45 gL-1
of biomass. Banerjee et al. (2002) reported a noticeable increase in the
amount of hydrocarbon production in the presence of excess phosphate. However there
are no reports on the interaction effects of phosphate and nitrate or sulphate and citrate.
2.4.1.6.1. Optimization by RSM
The process of optimization (maximization) of the yield of biomass was conducted using
the response surface methodology. The optimized conditions for growth of Botryococcus
braunii as depicted from its biomass indicated that when N: P of 1:0.5 favours both
growth & biomass yields. As the results indicates the possibility of using cultivation of
lipid rich algae for biomass and can be achieved in nitrate rich medium. As mentioned
previously, N: P ratio plays a significant role for biomass production. Botryococcus
braunii has received attention as a rich source of lipids rich biomass, therefore is a need
of the time to understand the influence of cultural conditions, which will facilitate its
mass cultivation.
2.4.2. Isolation and identification of Botryococcus sp.
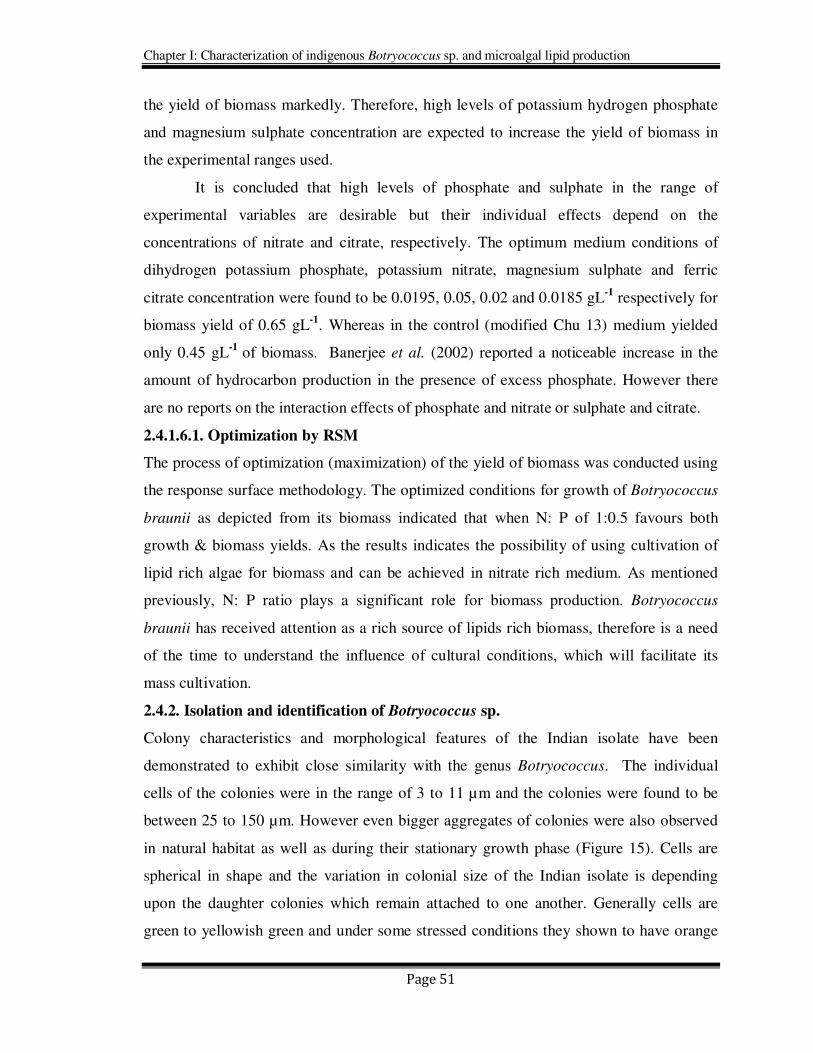
Colony characteristics and morphological features of the Indian isolate have been
demonstrated to exhibit close similarity with the genus Botryococcus. The individual
cells of the colonies were in the range of 3 to 11 µm and the colonies were found to be
between 25 to 150 µm. However even bigger aggregates of colonies were also observed
in natural habitat as well as during their stationary growth phase (Figure 15). Cells are
spherical in shape and the variation in colonial size of the Indian isolate is depending
upon the daughter colonies which remain attached to one another. Generally cells are
green to yellowish green and under some stressed conditions they shown to have orange
Chapter I: Characterization of indigenous Botryococcus sp. and microalgal lipid production
Page 52
yellow as well. Similar observations were made by Chandra in Miocene lignites of
Kerala, India (Chandra 1964).
Figure 15. Scanning electron microscopic and light microscopic images of B. mahabali
Further the 18S rRNA sequence (GU182893.1) analysis was carried out to know the
taxonomical identity of the Indian isolate and the studies revealed its taxonomical
relationship to the order Trebouxiophyceae, subsequently the sequence analysis has
shown more than 90% similarities with the reported 18S rRNA sequences of genus
Botryococcus, in particular to the species Botryococcus braunii. The species of the genus
Botryococcus were mainly distinguished based on colony size and details of cell shape.
Therefore, based on its distinctive morphological and cellular features with that of the
reported Botryococcus species the Indian isolate was assigned as Botryococcus mahabali.
The production of hydrocarbons is one of the characteristic features of
Botryococcus species and hence hydrocarbons analysis was also carried out to understand
the nature of hydrocarbons produced by the Indian isolate. Hydrocarbons of
Botryococcus mahabali were identified by comparing their mass spectra with standard
hydrocarbons (Sigma) and also with the NIST library. The types of hydrocarbons
produced by the Indian isolate were identified as saturated hydrocarbons in the range of
C13 to C26 (Table 13). The Indian isolate has produced hexadecane (10.15%),
heptadecane (17.82 %) and pentacosane (18.74%) as its major hydrocarbons (Table 13).
Similar types of saturated hydrocarbons (C21 to C31) were also reported by Yang et al.
(2004) from the Chinese strain of B. braunii with heptacosane as its major constituent.
Volova et al. (2003) has also reported the presence of saturated straight-chain and
Chapter I: Characterization of indigenous Botryococcus sp. and microalgal lipid production
Page 53
branched-chain (C14–C28) and long-chain linear aliphatic (C20–C27) hydrocarbons.
.Dennies and Kolattukudy (1992) have demonstrated the alkane biosynthesis by
decarbonylation of aldehyde catalyzed reactions in the absence of oxygen in the
microsomal preparations of B. braunii. Audino et al. (2001) identified the macrocyclic
alkanes (ranging from C15 to C34) and their methylated analogues (ranging from C17 to
C26) in B. braunii rich sediment (torbanite). These hydrocarbons served as another
chemical marker for the Indian isolate B. mahabali to assign to the genus Botryococcus.
B. mahabali was evaluated for its lipid content and was found to be 14 % on dry weight
basis and its fatty acids analysis has revealed hexadecadienoic acid (16:2), oleic (18:1),
linoleic (18:2), and linolenic acids (18:3) as its major fatty acids (Table 14). Similarly
Fang et al. (2004) have also reported palmitic acid and oleic acids as major components
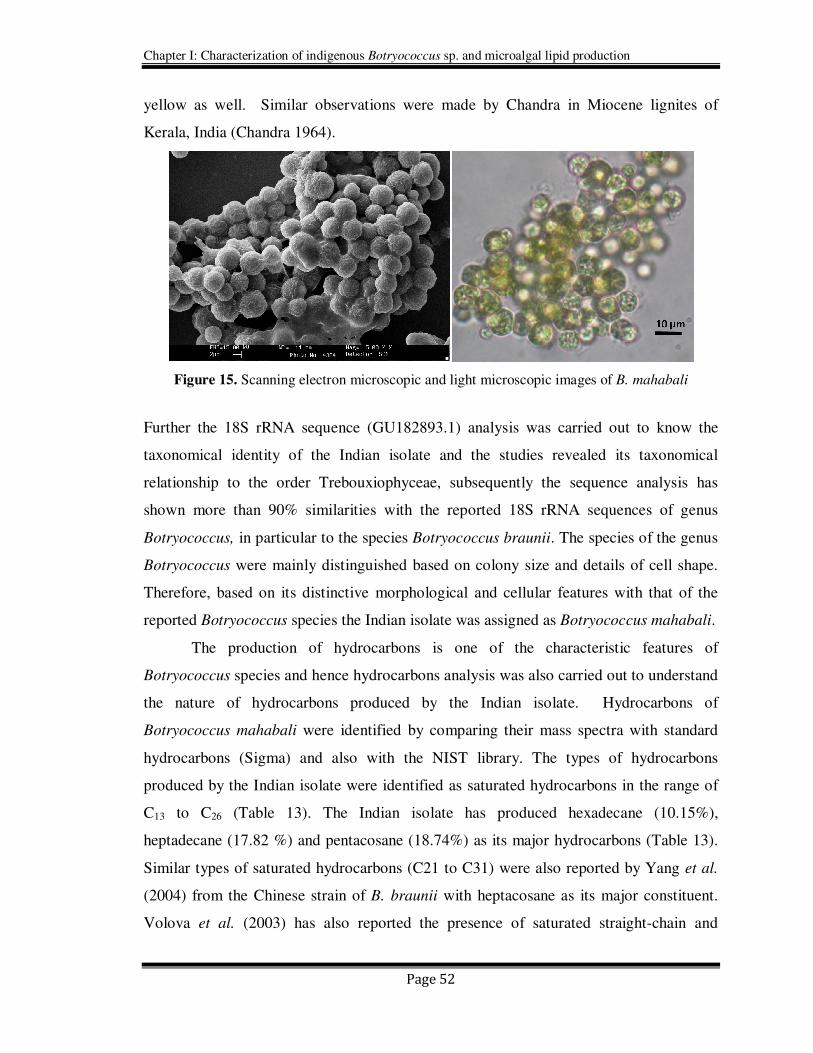
in the Botryococcus sp. The algal biomass was also analyzed for total carotenoids
contents (3.2 µg /g DW) which constituted predominantly lutein (24.75%) and β-carotene
(42.64%) as its chief components (Figure 16). These carotenoids are well known for their
Table 13. Hydrocarbons of Botryococcus mahabali
Hydrocarbons Relative %
C13 0.04
C14 3.64
C15 7.64
C16 10.15
C17 17.82
C18 6.2
C19 4.19
C20 8.21
C21 2.57
C22 5.8
C23 6.35
C24 4.81
C25
C26
18.74
4.33
Chapter I: Characterization of indigenous Botryococcus sp. and microalgal lipid production
Page 54
pharmaceutical, nutraceutical and cosmetic applications (Murthy et al., 2005; Vanitha et
al., 2007; Ranga Rao et al., 2006).
Figure 16. HPLC profile of carotenoids from Botryococcus mahabali
Table 14. Fatty acid profile of Botryococcus mahabali
Fatty acids % Composition
14:0 00.05
15:0 00.10
16:0 28.90
16:1 01.92
16:2 02.90
18:0 02.35
18:1 22.81
18:2 14.94
18:3 25.28
20:0 00.32
Chapter I: Characterization of indigenous Botryococcus sp. and microalgal lipid production
Page 55
2.4.3. Selection of primers and RAPD analysis
Three indigenous strains of Botryococcus sp. and other four strains of the same genus
obtained from different culture collection centers (two each of race-A and race-B) were
subjected for genetic analysis using RAPD markers. Several decamer primers were
screened for their ability to amplify DNA fragments. Based on the results of their ability
to produce good number of distinct bands, 35 RAPD primers were selected. DNA
samples from all the 7 strains of Botryococcus (Table 15) were amplified using the
decamers listed in Table 16, where all the primers produced polymorphic bands. The
majority of band positions varied between the strains. The polymorphisms were scored
visually based on the presence or absence of amplified fragments.
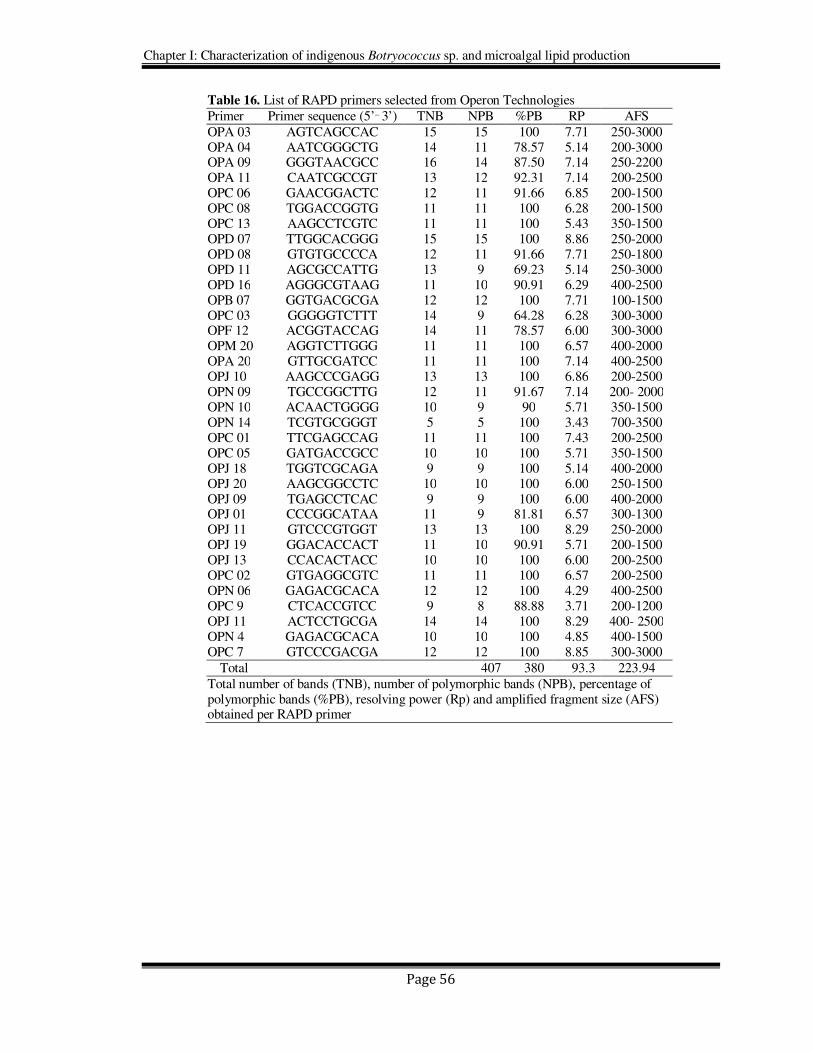
All the primers used in the study produced large numbers of polymorphic bands
(Table 16). The total number of bands (TNB), number of polymorphic bands (NPB),
percentage of polymorphic bands (%PB), Resolving power (Rp), amplified fragment size
(AFS) obtained for each primer are detailed in Table 16. The total amplified products of
35 RAPD primers was 407 (average of 11.62 bands per primer) ranging from 100 to 3000
bp, of which 380 were polymorphic (93.3%). The number of bands for each RAPD
primer varied from 5 (OPN 14) to 16 (OPA-09). The resolving power of the 35 RAPD
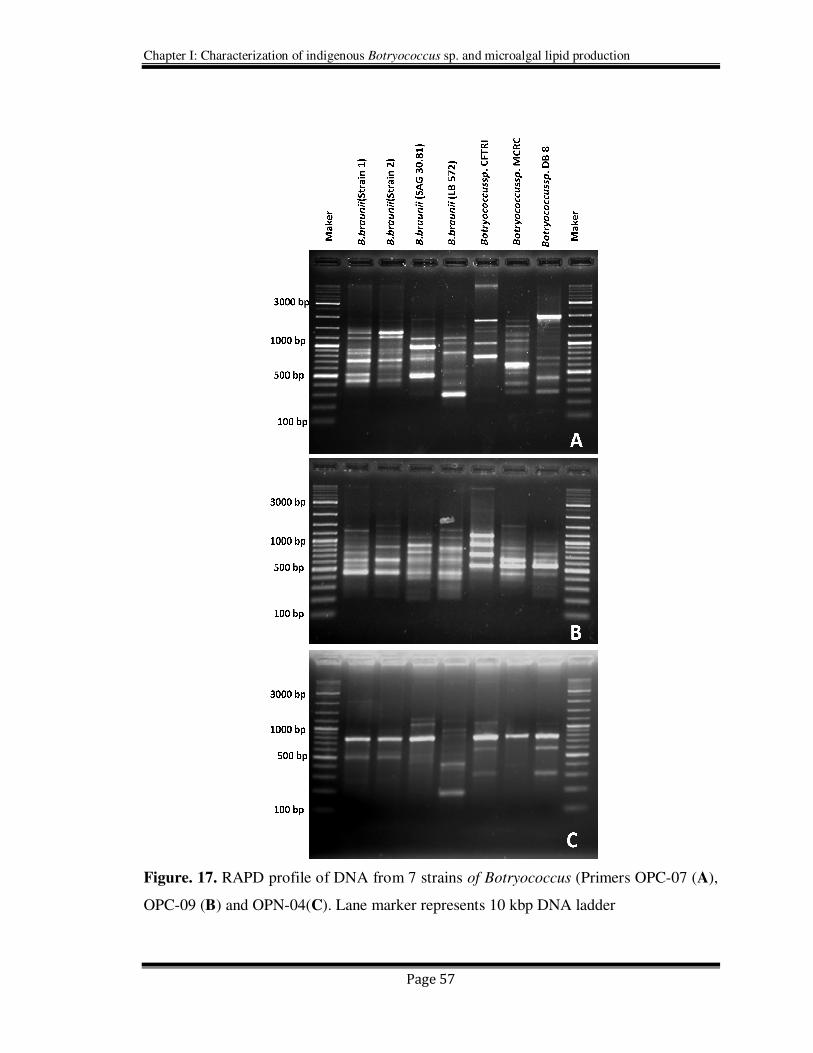
primers ranged from 3.43 for primer OPN-14 to 8.86 for primer OPD-07 and the samples
of RAPD analysis are visualized in Figure 17.
Table 15. Botryococcus strains used for the study
Algal strains
Botryococcus brauni[Strain 1]
Botryococcus brauni[Strain 2]
Botryococcus brauni[LB-572]
Botryococcus brauni[SAG 30.81]
Botryococcus sp. [DB-8]
Botryococcus sp.[MCRC]
Botryococcus mahabali[CFTRI]
Chapter I: Characterization of indigenous Botryococcus sp. and microalgal lipid production
Page 56
Table 16. List of RAPD primers selected from Operon Technologies
Primer Primer sequence (5’_ 3’) TNB NPB %PB RP AFS
OPA 03 AGTCAGCCAC 15 15 100 7.71 250-3000 OPA 04 AATCGGGCTG 14 11 78.57 5.14 200-3000 OPA 09 GGGTAACGCC 16 14 87.50 7.14 250-2200 OPA 11 CAATCGCCGT 13 12 92.31 7.14 200-2500 OPC 06 GAACGGACTC 12 11 91.66 6.85 200-1500 OPC 08 TGGACCGGTG 11 11 100 6.28 200-1500 OPC 13 AAGCCTCGTC 11 11 100 5.43 350-1500 OPD 07 TTGGCACGGG 15 15 100 8.86 250-2000 OPD 08 GTGTGCCCCA 12 11 91.66 7.71 250-1800 OPD 11 AGCGCCATTG 13 9 69.23 5.14 250-3000 OPD 16 AGGGCGTAAG 11 10 90.91 6.29 400-2500 OPB 07 GGTGACGCGA 12 12 100 7.71 100-1500 OPC 03 GGGGGTCTTT 14 9 64.28 6.28 300-3000 OPF 12 ACGGTACCAG 14 11 78.57 6.00 300-3000 OPM 20 AGGTCTTGGG 11 11 100 6.57 400-2000 OPA 20 GTTGCGATCC 11 11 100 7.14 400-2500 OPJ 10 AAGCCCGAGG 13 13 100 6.86 200-2500 OPN 09 TGCCGGCTTG 12 11 91.67 7.14 200- 2000 OPN 10 ACAACTGGGG 10 9 90 5.71 350-1500 OPN 14 TCGTGCGGGT 5 5 100 3.43 700-3500 OPC 01 TTCGAGCCAG 11 11 100 7.43 200-2500 OPC 05 GATGACCGCC 10 10 100 5.71 350-1500 OPJ 18 TGGTCGCAGA 9 9 100 5.14 400-2000 OPJ 20 AAGCGGCCTC 10 10 100 6.00 250-1500 OPJ 09 TGAGCCTCAC 9 9 100 6.00 400-2000 OPJ 01 CCCGGCATAA 11 9 81.81 6.57 300-1300 OPJ 11 GTCCCGTGGT 13 13 100 8.29 250-2000 OPJ 19 GGACACCACT 11 10 90.91 5.71 200-1500 OPJ 13 CCACACTACC 10 10 100 6.00 200-2500 OPC 02 GTGAGGCGTC 11 11 100 6.57 200-2500 OPN 06 GAGACGCACA 12 12 100 4.29 400-2500 OPC 9 CTCACCGTCC 9 8 88.88 3.71 200-1200 OPJ 11 ACTCCTGCGA 14 14 100 8.29 400- 2500 OPN 4 GAGACGCACA 10 10 100 4.85 400-1500 OPC 7 GTCCCGACGA 12 12 100 8.85 300-3000
Total 407 380 93.3 223.94
Total number of bands (TNB), number of polymorphic bands (NPB), percentage of polymorphic bands (%PB), resolving power (Rp) and amplified fragment size (AFS) obtained per RAPD primer
Chapter I: Characterization of indigenous Botryococcus sp. and microalgal lipid production
Page 57
Figure. 17. RAPD profile of DNA from 7 strains of Botryococcus (Primers OPC-07 (A),
OPC-09 (B) and OPN-04(C). Lane marker represents 10 kbp DNA ladder
Chapter I: Characterization of indigenous Botryococcus sp. and microalgal lipid production
Page 58
2.4.3. 1. Molecular analysis and fingerprinting of Botryococcus strains
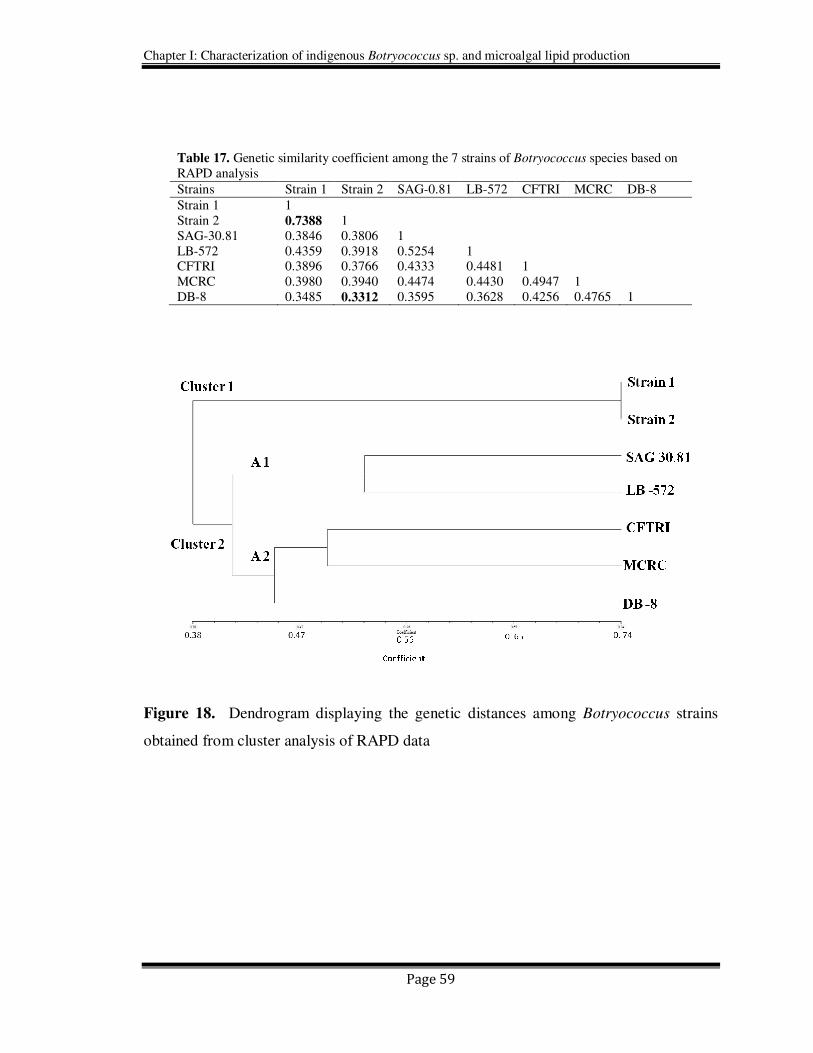
The genetic similarity coefficients for 7 strains of Botryococcus species were obtained
with RAPD markers ranged from 0.3312 to 0.7388between the strains evaluated. The
unweighted pair group method with arithmetic mean (UPGMA) analysis made it possible
to discriminate all the genotypes of Botryococcus sp. used in this study. The dendrogram
obtained based on RAPD data showed a clear distinction into two major clusters (Figure
18). The dendrogram (Figure 18) obtained using per cent disagreement coefficient (Table
17) showed the presence of 2 main clusters (Cluster 1 and 2, having 2 and 5 strains in
each, respectively). The cluster 1 had two strains (Strain 1 and Strain 2) which belong to
B race, while the A race strains LB -572 and SAG 30.81 formed a sub -cluster A1 in
cluster 2 and the other 3 indigenous strains (CFTRI, MCRC and DB-8) formed an
another sub cluster A2 of cluster 2. The similarity coefficient matrix (Table 17) and the
dendrogram data have shown clear distinction between all the strains of Botryococcus
species studied and have also revealed a genetic relationship between the race A and race
B strains. All the indigenous strains have shown their genetic relationship with A race
strains and among the indigenous strains, Botryococcus sp. (DB-8) have shown its
genetic diversity with that of the other two indigenous strains (MCRC and CFTRI).
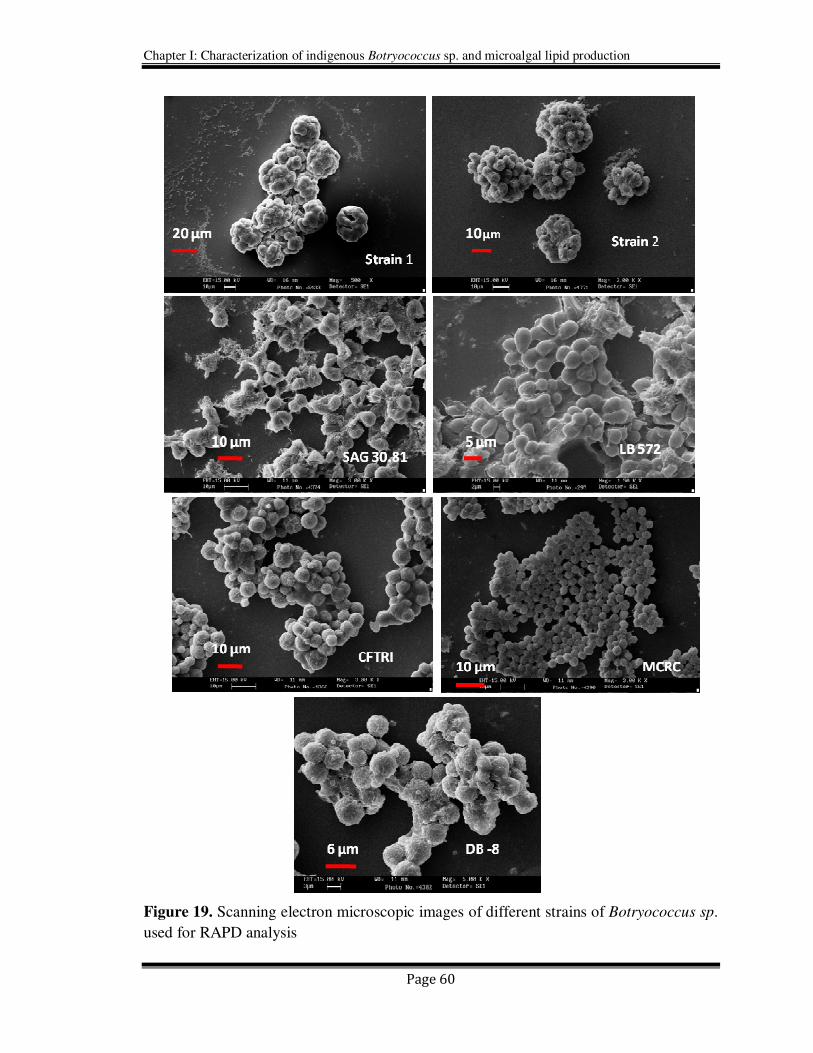
Morphological details of 7 strains of Botryococcus species (Figure 19) shows that
the features of A race strains, B race strains and indigenous strains were found to
substantiate the observations of RAPD data as well. Gomez and Gonzalez (2004) have
also used RAPD technique to see the genetic variations among the several strains of
microalgae Dunaliella salina.
Chapter I: Characterization of indigenous Botryococcus sp. and microalgal lipid production
Page 59
Figure 18. Dendrogram displaying the genetic distances among Botryococcus strains
obtained from cluster analysis of RAPD data
Table 17. Genetic similarity coefficient among the 7 strains of Botryococcus species based on
RAPD analysis
Strains Strain 1 Strain 2 SAG-0.81 LB-572 CFTRI MCRC DB-8
Strain 1 1
Strain 2 0.7388 1
SAG-30.81 0.3846 0.3806 1
LB-572 0.4359 0.3918 0.5254 1 CFTRI 0.3896 0.3766 0.4333 0.4481 1
MCRC 0.3980 0.3940 0.4474 0.4430 0.4947 1
DB-8 0.3485 0.3312 0.3595 0.3628 0.4256 0.4765 1
Chapter I: Characterization of indigenous Botryococcus sp. and microalgal lipid production
Page 60
Figure 19. Scanning electron microscopic images of different strains of Botryococcus sp.
used for RAPD analysis
Chapter I: Characterization of indigenous Botryococcus sp. and microalgal lipid production
Page 61
Genetic diversity studies will also gives the details of exotic genotypes. RAPD has been
successfully used to identify the genetic variation in both micro- and macroalgae (Neilan,
1995; Nishihara et al., 1997; Bolch et al., 1999a, 1999b; Gomez and Gonzalez, 2004;
Martinez et al., 2006; Zhao et al., 2007; Touzet et al., 2007; Zhao et al., 2008; Small et
al., 2009; Tilman et al., 2009; Olmos et al., 2009). The genetic diversity among the
different strains of Botryococcus is a clear demonstration of the genome participation in
determining the attributes related to production of different nature of hydrocarbons and
morphological features. The results of the study are very important since the existence of
genetically characterized strains will reduce incorrect assumptions about the
biotechnologically important traits of different strains, which could be due to phenotypic
flexibility. RAPD markers having high resolution power appear to offer many advantages
in establishing genetic distances among the microalgae. They were found to be effective
for assessing genetic variation in different species and strains of Botryococcus belonging
to various geographic locations and climatic zones as well. Thus diversity analysis by
RAPD technique efficiently discriminate phenotypic and environmentally acquired
characteristics. RAPD primes have been applied for establishing diversity of algal forms.
2.4.4. Microalgal lipid production
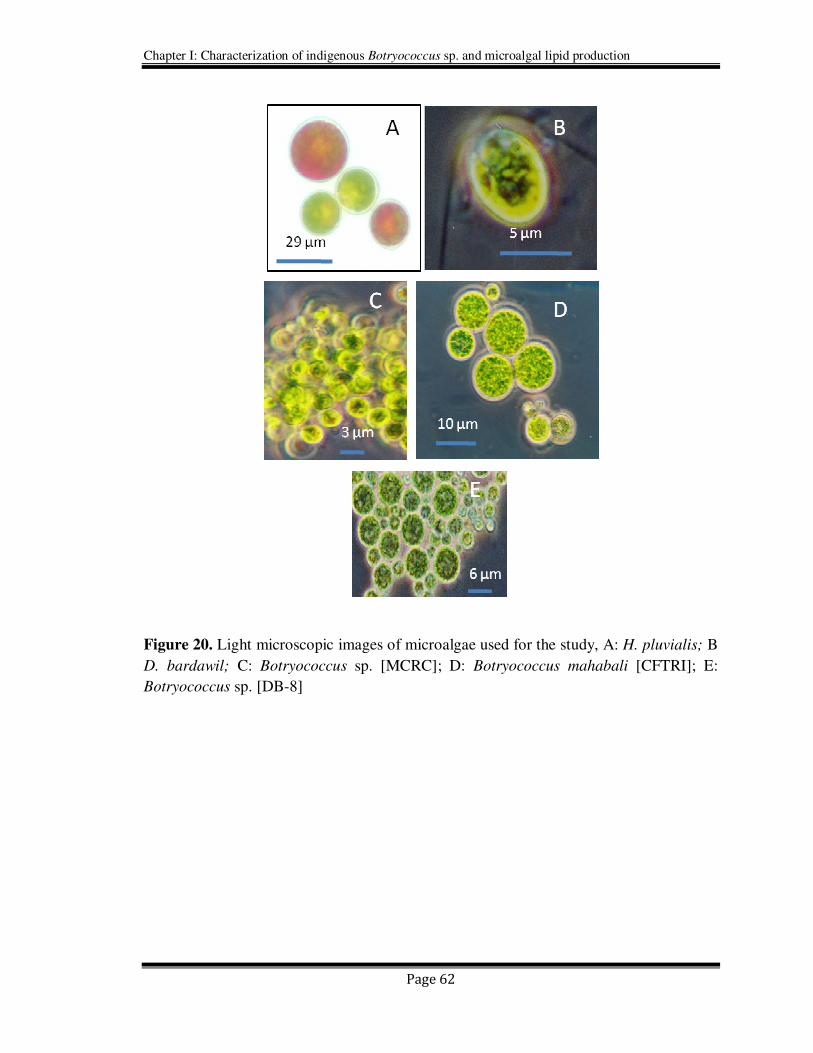
All the three indigenous strains Botryococcus sp. (DB-8), Botryococcus sp.(MCRC) and
the new CFTRI isolate Botryococcus mahabali (indigenous strains were shown in Figure
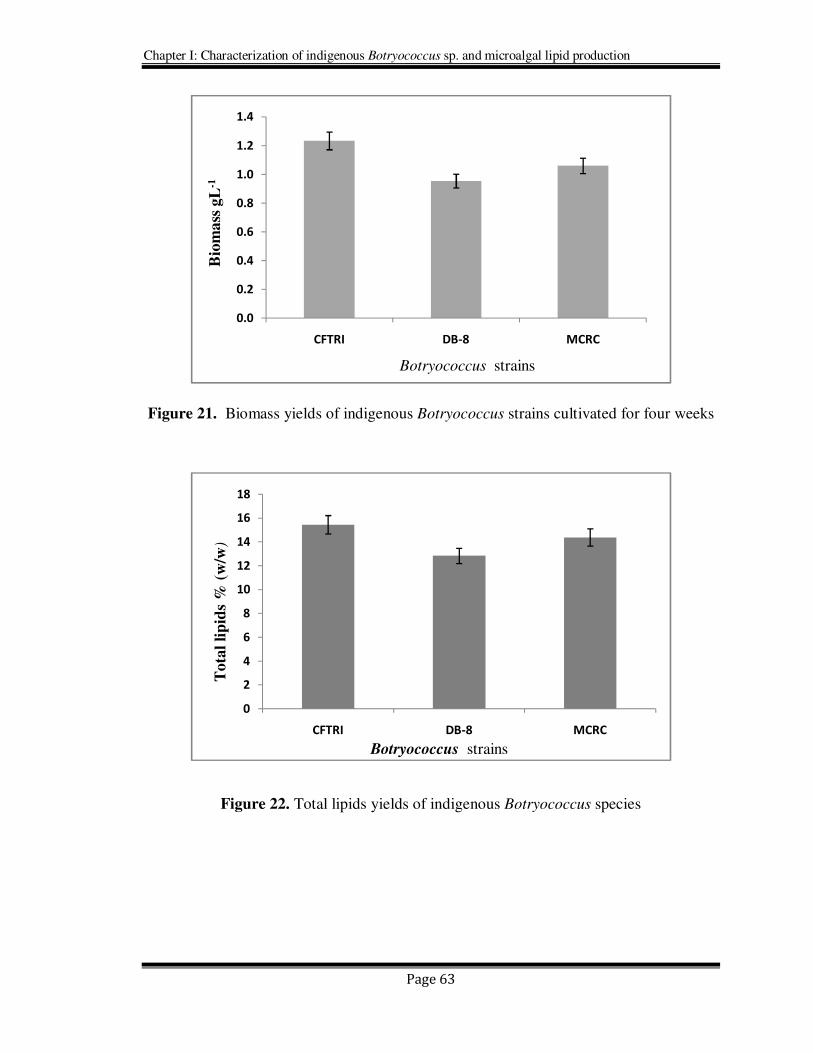
20) were evaluated for their total lipid and biomass productivities (Figure 21 & 22) after
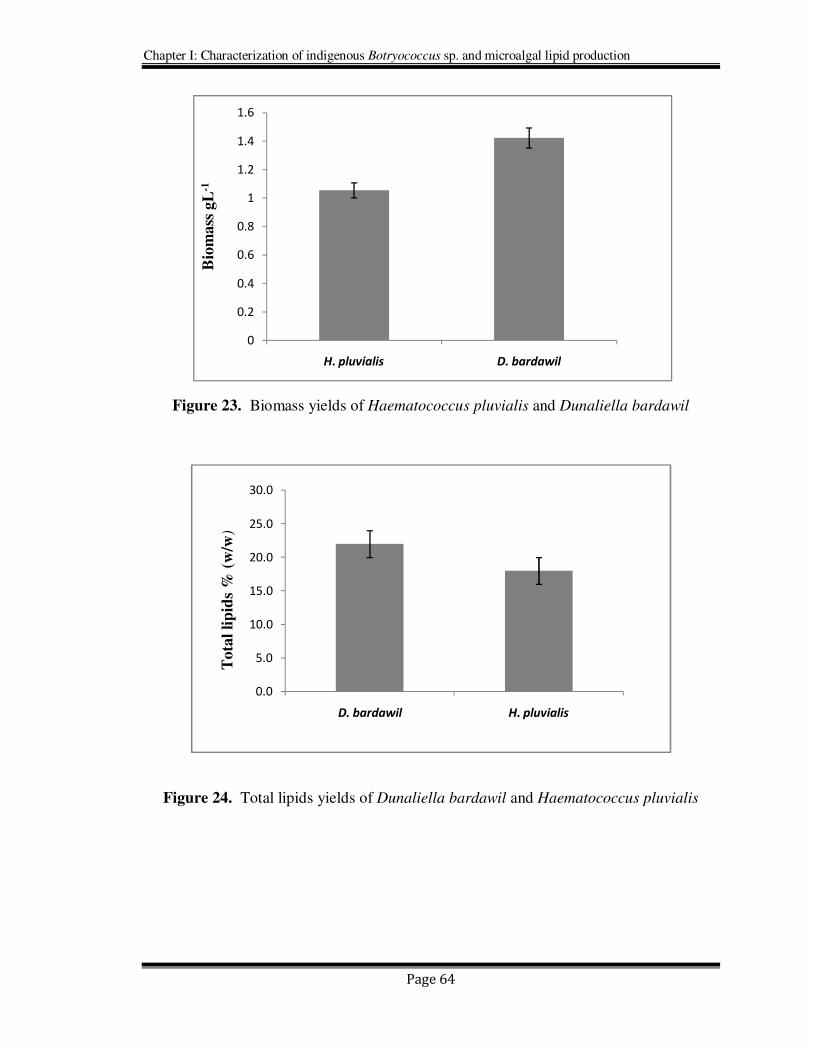
their growth in modified Chu 13 medium for four weeks. Similarly other two
commercially important green microalgal species Dunaliella bardawil and
Haematococcus pluvialis (Figure 20) were grown for four weeks and evaluated for their
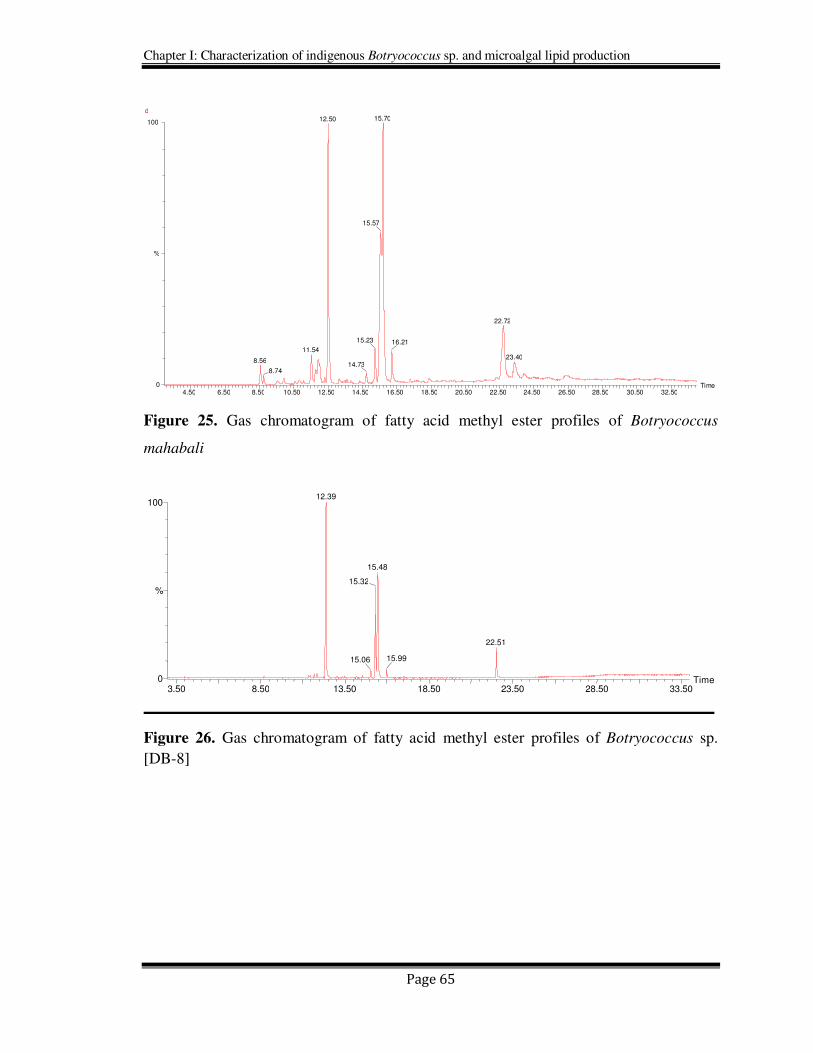
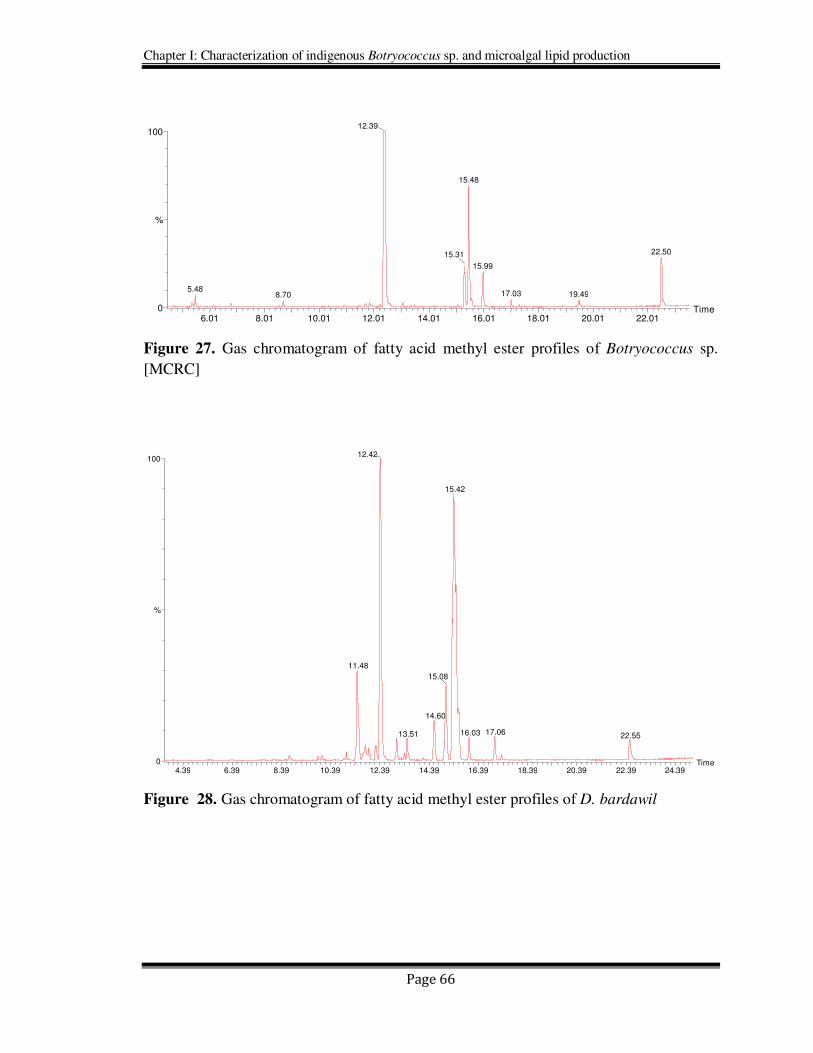
lipid contents and biomass yields (Figures 23 & 24). The gas chromatographams of their
respective fatty acid methyl esters were shown in Figures 25-29. Representative mass
spectra for few major microalgal fatty acid methyl esters are shown in Figure 30.
Chapter I: Characterization of indigenous Botryococcus sp. and microalgal lipid production
Page 62
Figure 20. Light microscopic images of microalgae used for the study, A: H. pluvialis; B
D. bardawil; C: Botryococcus sp. [MCRC]; D: Botryococcus mahabali [CFTRI]; E:
Botryococcus sp. [DB-8]
Chapter I: Characterization of indigenous Botryococcus sp. and microalgal lipid production
Page 63
Figure 21. Biomass yields of indigenous Botryococcus strains cultivated for four weeks
Figure 22. Total lipids yields of indigenous Botryococcus species
0.0
0.2
0.4
0.6
0.8
1.0
1.2
1.4
CFTRI DB-8 MCRC
Botryococcus strains
Bio
mass
gL
-1
0
2
4
6
8
10
12
14
16
18
CFTRI DB-8 MCRC
Botryococcus strains
Tota
l li
pid
s %
(w
/w)
Chapter I: Characterization of indigenous Botryococcus sp. and microalgal lipid production
Page 64
Figure 23. Biomass yields of Haematococcus pluvialis and Dunaliella bardawil
Figure 24. Total lipids yields of Dunaliella bardawil and Haematococcus pluvialis
0
0.2
0.4
0.6
0.8
1
1.2
1.4
1.6
H. pluvialis D. bardawil
Bio
mass
gL
-1
0.0
5.0
10.0
15.0
20.0
25.0
30.0
D. bardawil H. pluvialis
Tota
l li
pid
s %
(w
/w)
Chapter I: Characterization of indigenous Botryococcus sp. and microalgal lipid production
Page 65
Figure 25. Gas chromatogram of fatty acid methyl ester profiles of Botryococcus
mahabali
Figure 26. Gas chromatogram of fatty acid methyl ester profiles of Botryococcus sp.
[DB-8]
3.50 8.50 13.50 18.50 23.50 28.50 33.50
Time 0
100
%
12.39
15.48
15.32
15.06
22.51
15.99
4.50 6.50 8.50 10.50 12.50 14.50 16.50 18.50 20.50 22.50 24.50 26.50 28.50 30.50 32.50 Time0
100
%
d
15.7012.50
11.54
8.56
8.74
15.57
15.23
14.73
22.72
16.21
23.40
Chapter I: Characterization of indigenous Botryococcus sp. and microalgal lipid production
Page 66
Figure 27. Gas chromatogram of fatty acid methyl ester profiles of Botryococcus sp.
[MCRC]
Figure 28. Gas chromatogram of fatty acid methyl ester profiles of D. bardawil
6.01 8.01 10.01 12.01 14.01 16.01 18.01 20.01 22.01
Time 0
100
%
12.39
5.488.70
15.48
15.31 22.50
15.99
17.03 19.49
4.39 6.39 8.39 10.39 12.39 14.39 16.39 18.39 20.39 22.39 24.39
Time0
100
%
12.42
11.48
15.42
15.08
14.60
13.51 17.0616.03 22.55
Chapter I: Characterization of indigenous Botryococcus sp. and microalgal lipid production
Page 67
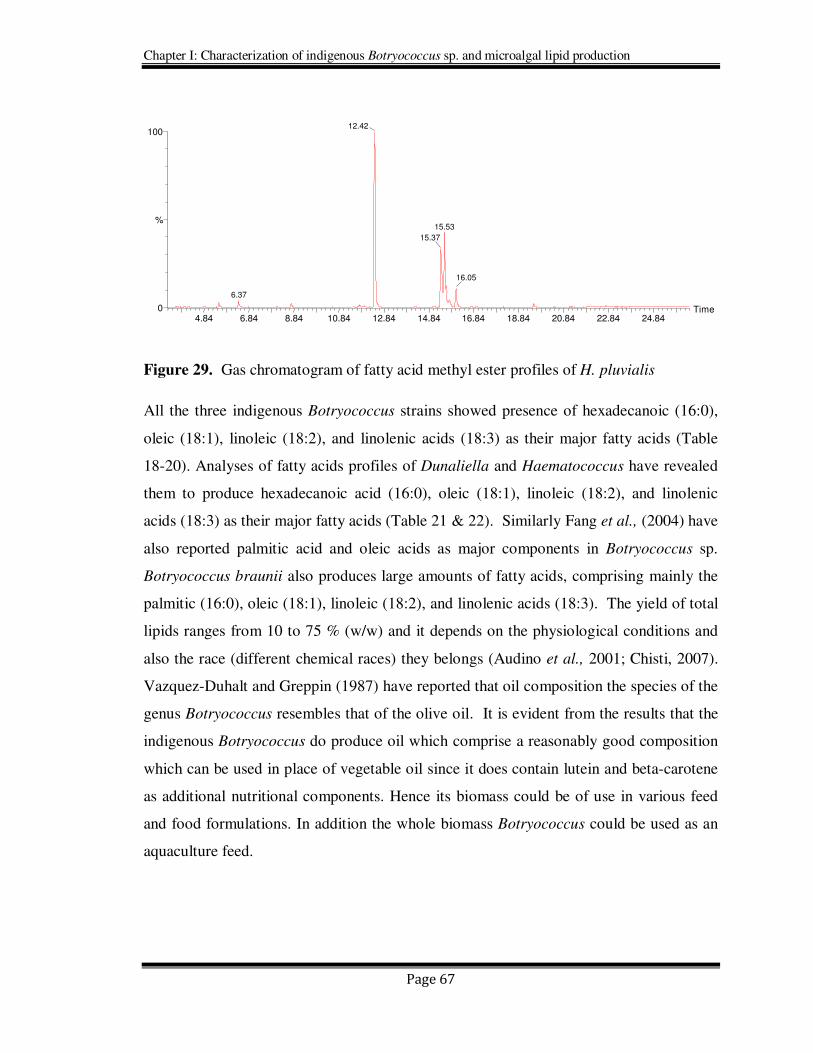
Figure 29. Gas chromatogram of fatty acid methyl ester profiles of H. pluvialis
All the three indigenous Botryococcus strains showed presence of hexadecanoic (16:0),
oleic (18:1), linoleic (18:2), and linolenic acids (18:3) as their major fatty acids (Table
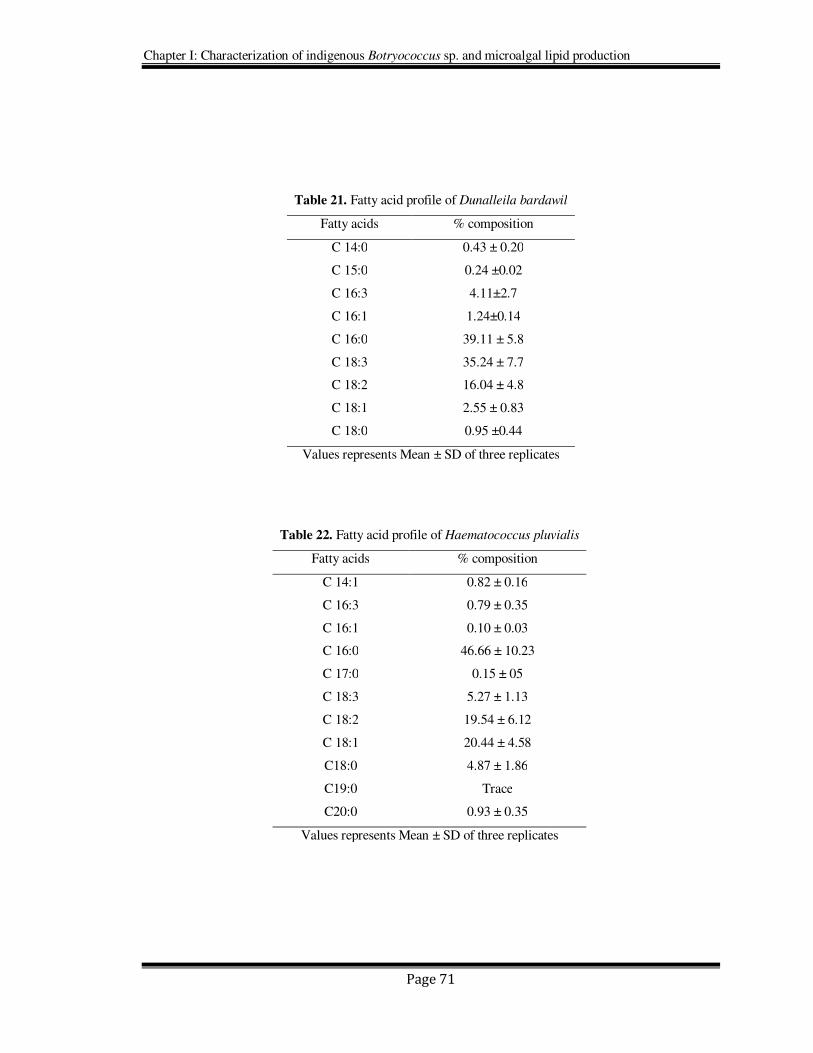
18-20). Analyses of fatty acids profiles of Dunaliella and Haematococcus have revealed
them to produce hexadecanoic acid (16:0), oleic (18:1), linoleic (18:2), and linolenic
acids (18:3) as their major fatty acids (Table 21 & 22). Similarly Fang et al., (2004) have
also reported palmitic acid and oleic acids as major components in Botryococcus sp.
Botryococcus braunii also produces large amounts of fatty acids, comprising mainly the
palmitic (16:0), oleic (18:1), linoleic (18:2), and linolenic acids (18:3). The yield of total
lipids ranges from 10 to 75 % (w/w) and it depends on the physiological conditions and
also the race (different chemical races) they belongs (Audino et al., 2001; Chisti, 2007).
Vazquez-Duhalt and Greppin (1987) have reported that oil composition the species of the
genus Botryococcus resembles that of the olive oil. It is evident from the results that the
indigenous Botryococcus do produce oil which comprise a reasonably good composition
which can be used in place of vegetable oil since it does contain lutein and beta-carotene
as additional nutritional components. Hence its biomass could be of use in various feed
and food formulations. In addition the whole biomass Botryococcus could be used as an
aquaculture feed.
4.84 6.84 8.84 10.84 12.84 14.84 16.84 18.84 20.84 22.84 24.84 Time 0
100
%
12.42
6.37
15.53
15.37
16.05
Chapter I: Characterization of indigenous Botryococcus sp. and microalgal lipid production
Page 68
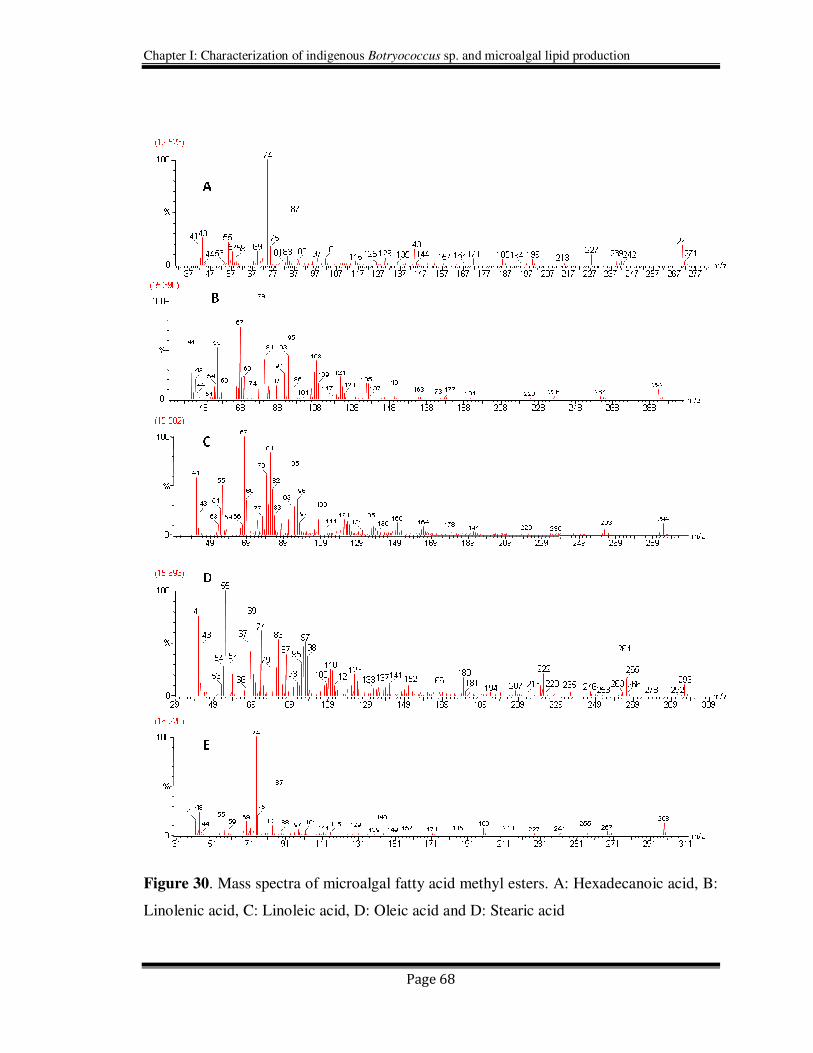
Figure 30. Mass spectra of microalgal fatty acid methyl esters. A: Hexadecanoic acid, B:
Linolenic acid, C: Linoleic acid, D: Oleic acid and D: Stearic acid
Chapter I: Characterization of indigenous Botryococcus sp. and microalgal lipid production
Page 69
Dunaliella and Haematococcus are known for their ability to accumulate very high levels
of beta–carotene and astaxanthin and are presently used for various applications from
food to medicine. In view of this Dunaliella bardawil was evaluated for its fatty acid
composition and has exhibited a very high level of unsaturated fatty acids than the
saturated ones and similarly H. pluvialis also exhibited similar profile which is rich in
unsaturated fatty acids oleic (18:1), linoleic (18:2), and linolenic acids (18:3). Similar
results were reported for both Dunaliella and Haematococcus species by various
researchers (Borowitzka and Borowitzka, 1988; Lamers et al., 2010; Zhekisheva et al.,
2002; Danmiani et al., 2010). All the three indigenous species of Botryococcus, D.
bardawil and H. pluvialis produced appreciable amounts of lipids with relatively good
quality fatty acid profiles which could be of use from food to fuel in the nearing future.
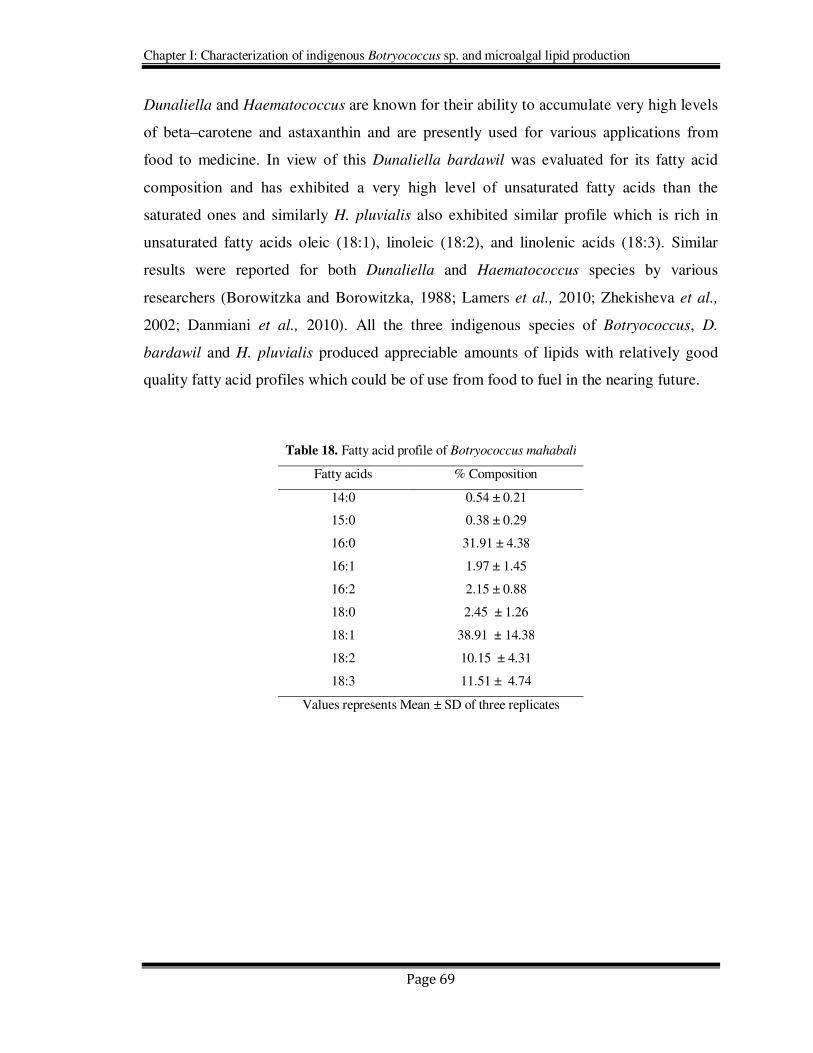
Table 18. Fatty acid profile of Botryococcus mahabali
Fatty acids % Composition
14:0 0.54 ± 0.21
15:0 0.38 ± 0.29
16:0 31.91 ± 4.38
16:1 1.97 ± 1.45
16:2 2.15 ± 0.88
18:0 2.45 ± 1.26
18:1 38.91 ± 14.38
18:2 10.15 ± 4.31
18:3 11.51 ± 4.74
Values represents Mean ± SD of three replicates
Chapter I: Characterization of indigenous Botryococcus sp. and microalgal lipid production
Page 70
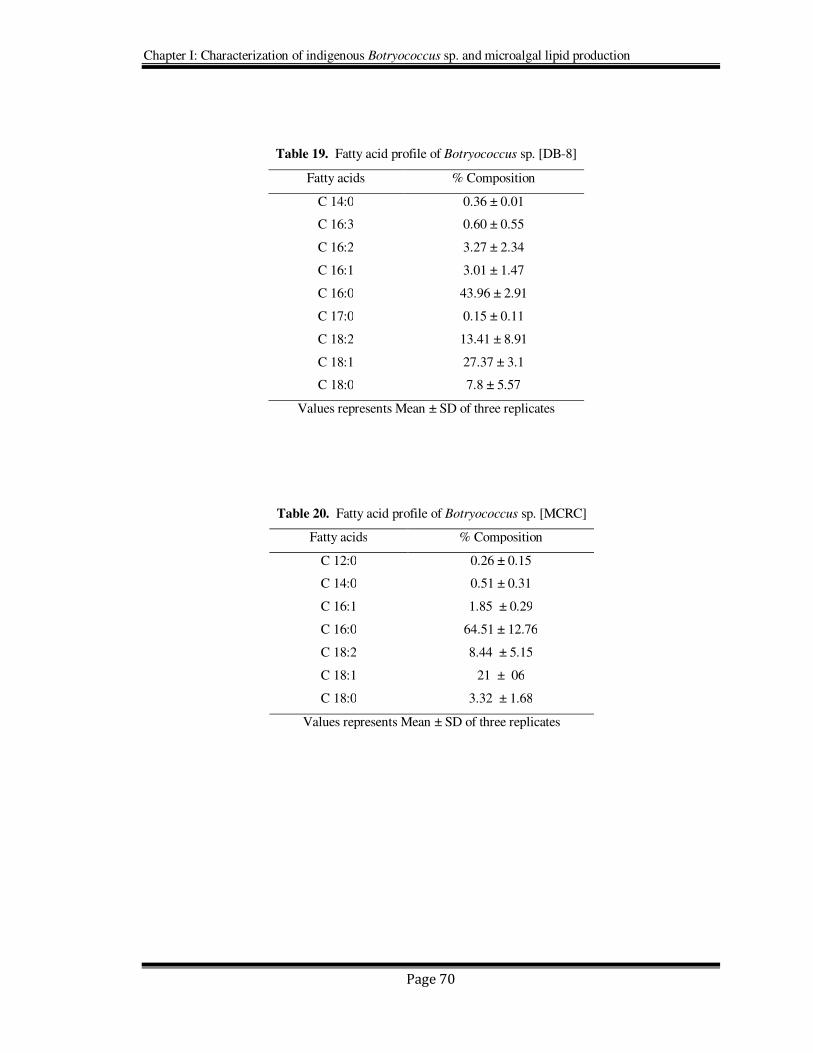
Table 19. Fatty acid profile of Botryococcus sp. [DB-8]
Fatty acids % Composition
C 14:0 0.36 ± 0.01
C 16:3 0.60 ± 0.55
C 16:2 3.27 ± 2.34
C 16:1 3.01 ± 1.47
C 16:0 43.96 ± 2.91
C 17:0 0.15 ± 0.11
C 18:2 13.41 ± 8.91
C 18:1 27.37 ± 3.1
C 18:0 7.8 ± 5.57
Values represents Mean ± SD of three replicates
Table 20. Fatty acid profile of Botryococcus sp. [MCRC]
Fatty acids % Composition
C 12:0 0.26 ± 0.15
C 14:0 0.51 ± 0.31
C 16:1 1.85 ± 0.29
C 16:0 64.51 ± 12.76
C 18:2 8.44 ± 5.15
C 18:1 21 ± 06
C 18:0 3.32 ± 1.68
Values represents Mean ± SD of three replicates
Chapter I: Characterization of indigenous Botryococcus sp. and microalgal lipid production
Page 71
Table 21. Fatty acid profile of Dunalleila bardawil
Fatty acids % composition
C 14:0 0.43 ± 0.20
C 15:0 0.24 ±0.02
C 16:3 4.11±2.7
C 16:1 1.24±0.14
C 16:0 39.11 ± 5.8
C 18:3 35.24 ± 7.7
C 18:2 16.04 ± 4.8
C 18:1 2.55 ± 0.83
C 18:0 0.95 ±0.44
Values represents Mean ± SD of three replicates
Table 22. Fatty acid profile of Haematococcus pluvialis
Fatty acids % composition
C 14:1 0.82 ± 0.16
C 16:3 0.79 ± 0.35
C 16:1 0.10 ± 0.03
C 16:0 46.66 ± 10.23
C 17:0 0.15 ± 05
C 18:3 5.27 ± 1.13
C 18:2 19.54 ± 6.12
C 18:1 20.44 ± 4.58
C18:0 4.87 ± 1.86
C19:0 Trace
C20:0 0.93 ± 0.35
Values represents Mean ± SD of three replicates


![Potency of Botryococcus braunii cultivated on palm oil ... · can provide the mixotrophic mode for microalgae medium to due the content of organic carbon [11]. The biomass of . Botryococcus](https://img.pdfslide.us/doc/110x75/5ced7a3088c993660a8c24e5/potency-of-botryococcus-braunii-cultivated-on-palm-oil-can-provide-the-mixotrophic.jpg)


![Light Acclimation of the Colonial Green Alga Botryococcus ... · Light Acclimation of the Colonial Green Alga Botryococcus braunii Strain Showa1[OPEN] Tomas E. van den Berg,a Volha](https://img.pdfslide.us/doc/110x75/5f267e03b4e13a27a03c2dcc/light-acclimation-of-the-colonial-green-alga-botryococcus-light-acclimation.jpg)