Embed Size (px)
Citation preview
CHAPTER I FINANCES OF THE
STATE GOVERNMENT

1
CHAPTER I
FINANCES OF THE STATE GOVERNMENT
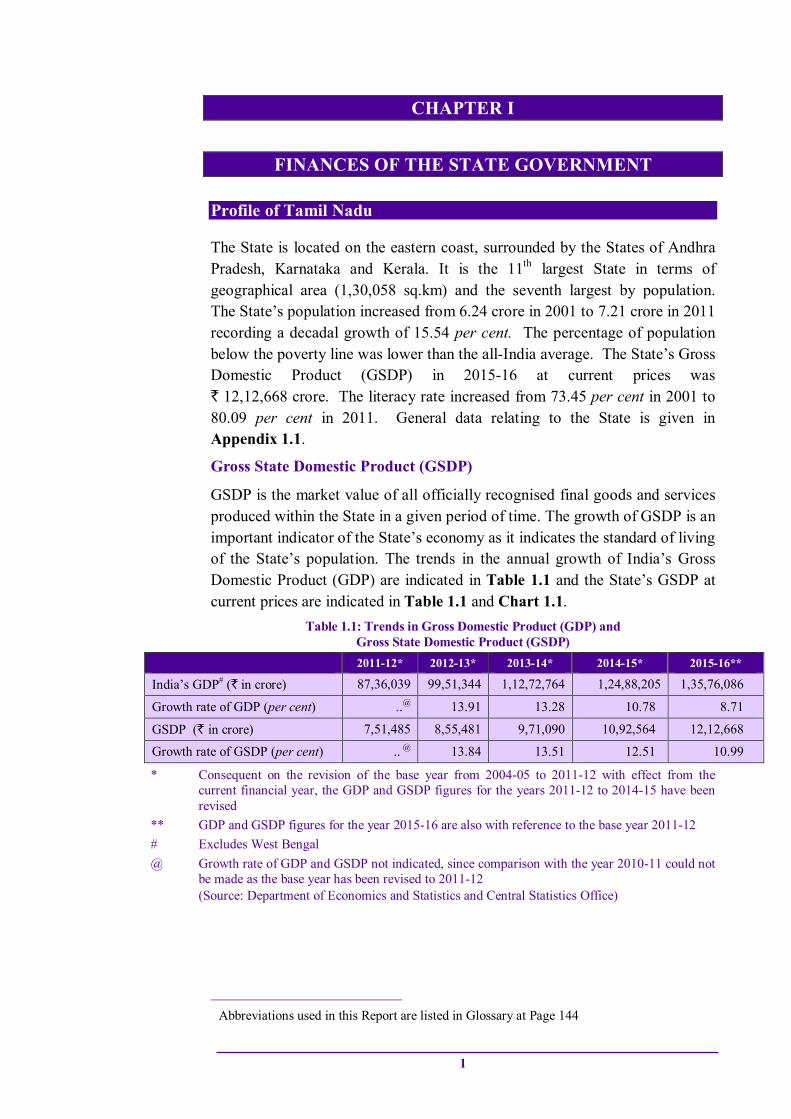
Profile of Tamil Nadu
The State is located on the eastern coast, surrounded by the States of Andhra Pradesh, Karnataka and Kerala. It is the 11th largest State in terms of geographical area (1,30,058 sq.km) and the seventh largest by population. The State’s population increased from 6.24 crore in 2001 to 7.21 crore in 2011 recording a decadal growth of 15.54 per cent. The percentage of population below the poverty line was lower than the all-India average. The State’s Gross Domestic Product (GSDP) in 2015-16 at current prices was ` 12,12,668 crore. The literacy rate increased from 73.45 per cent in 2001 to 80.09 per cent in 2011. General data relating to the State is given in Appendix 1.1.
Gross State Domestic Product (GSDP)
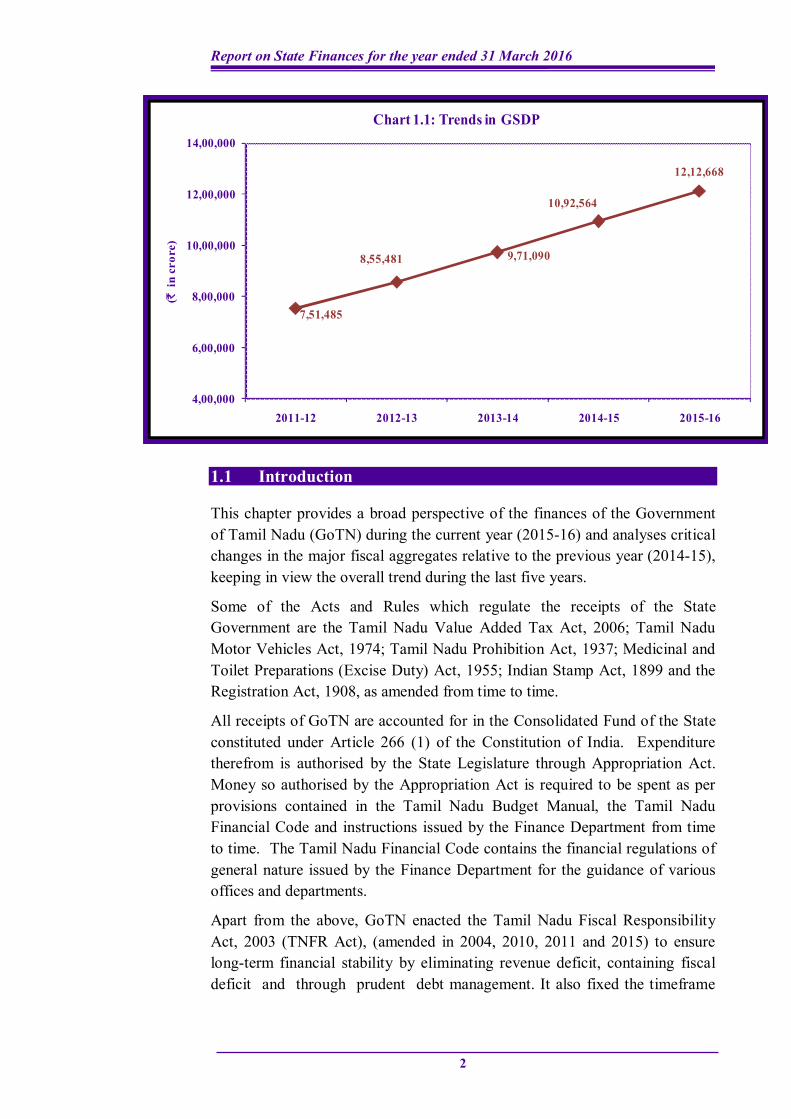
GSDP is the market value of all officially recognised final goods and services produced within the State in a given period of time. The growth of GSDP is an important indicator of the State’s economy as it indicates the standard of living of the State’s population. The trends in the annual growth of India’s Gross Domestic Product (GDP) are indicated in Table 1.1 and the State’s GSDP at current prices are indicated in Table 1.1 and Chart 1.1.
Table 1.1: Trends in Gross Domestic Product (GDP) and Gross State Domestic Product (GSDP)
2011-12* 2012-13* 2013-14* 2014-15* 2015-16**
India’s GDP# (` in crore) 87,36,039 99,51,344 1,12,72,764 1,24,88,205 1,35,76,086
Growth rate of GDP (per cent) ..@ 13.91 13.28 10.78 8.71
GSDP (` in crore) 7,51,485 8,55,481 9,71,090 10,92,564 12,12,668
Growth rate of GSDP (per cent) .. @ 13.84 13.51 12.51 10.99
* Consequent on the revision of the base year from 2004-05 to 2011-12 with effect from the current financial year, the GDP and GSDP figures for the years 2011-12 to 2014-15 have been revised
** GDP and GSDP figures for the year 2015-16 are also with reference to the base year 2011-12 # Excludes West Bengal @ Growth rate of GDP and GSDP not indicated, since comparison with the year 2010-11 could not
be made as the base year has been revised to 2011-12 (Source: Department of Economics and Statistics and Central Statistics Office)
Abbreviations used in this Report are listed in Glossary at Page 144
Report on State Finances for the year ended 31 March 2016
2
1.1 Introduction
This chapter provides a broad perspective of the finances of the Government of Tamil Nadu (GoTN) during the current year (2015-16) and analyses critical changes in the major fiscal aggregates relative to the previous year (2014-15), keeping in view the overall trend during the last five years.
Some of the Acts and Rules which regulate the receipts of the State Government are the Tamil Nadu Value Added Tax Act, 2006; Tamil Nadu Motor Vehicles Act, 1974; Tamil Nadu Prohibition Act, 1937; Medicinal and Toilet Preparations (Excise Duty) Act, 1955; Indian Stamp Act, 1899 and the Registration Act, 1908, as amended from time to time.
All receipts of GoTN are accounted for in the Consolidated Fund of the State constituted under Article 266 (1) of the Constitution of India. Expenditure therefrom is authorised by the State Legislature through Appropriation Act. Money so authorised by the Appropriation Act is required to be spent as per provisions contained in the Tamil Nadu Budget Manual, the Tamil Nadu Financial Code and instructions issued by the Finance Department from time to time. The Tamil Nadu Financial Code contains the financial regulations of general nature issued by the Finance Department for the guidance of various offices and departments.
Apart from the above, GoTN enacted the Tamil Nadu Fiscal Responsibility Act, 2003 (TNFR Act), (amended in 2004, 2010, 2011 and 2015) to ensure long-term financial stability by eliminating revenue deficit, containing fiscal deficit and through prudent debt management. It also fixed the timeframe
7,51,485
8,55,481 9,71,090
10,92,564
12,12,668
4,00,000
6,00,000
8,00,000
10,00,000
12,00,000
14,00,000
2011-12 2012-13 2013-14 2014-15 2015-16
(`in
cro
re)
Chart 1.1: Trends in GSDP
Chapter I - Finances of the State Government
3
for achieving the fiscal targets set. The salient features of the TNFR Act, 2003 (as amended till April 2015) are given in Appendix 1.3 - Part B.
The structure of Government Accounts and the layout of Finance Accounts are shown in Appendix 1.2. The methodology adopted for assessment of the fiscal position of the State is given in Appendix 1.3 - Part A. A time series data on the State Government finances is given in Appendix 1.4.
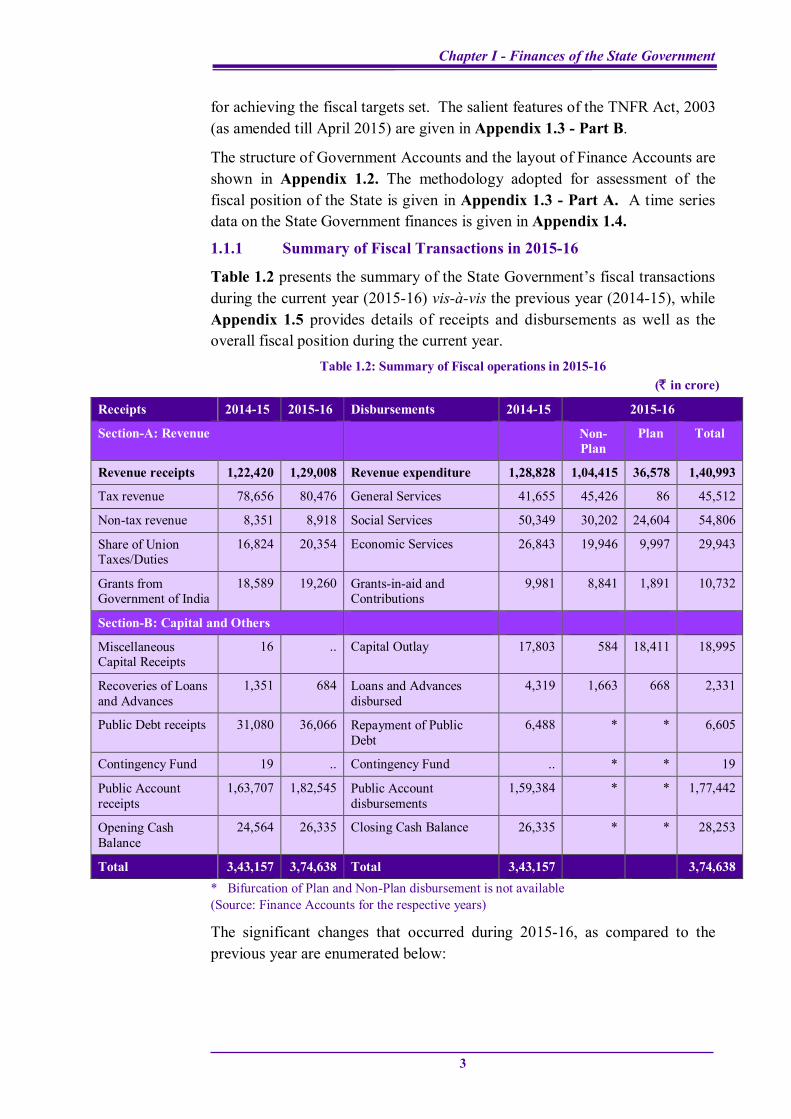
1.1.1 Summary of Fiscal Transactions in 2015-16
Table 1.2 presents the summary of the State Government’s fiscal transactions during the current year (2015-16) vis-à-vis the previous year (2014-15), while Appendix 1.5 provides details of receipts and disbursements as well as the overall fiscal position during the current year.
Table 1.2: Summary of Fiscal operations in 2015-16 (` in crore)
Receipts 2014-15 2015-16 Disbursements 2014-15 2015-16
Section-A: Revenue Non- Plan
Plan Total
Revenue receipts 1,22,420 1,29,008 Revenue expenditure 1,28,828 1,04,415 36,578 1,40,993
Tax revenue 78,656 80,476 General Services 41,655 45,426 86 45,512
Non-tax revenue 8,351 8,918 Social Services 50,349 30,202 24,604 54,806
Share of Union Taxes/Duties
16,824 20,354 Economic Services 26,843 19,946 9,997 29,943
Grants from Government of India
18,589 19,260 Grants-in-aid and Contributions
9,981 8,841 1,891 10,732
Section-B: Capital and Others
Miscellaneous Capital Receipts
16 .. Capital Outlay 17,803 584 18,411 18,995
Recoveries of Loans and Advances
1,351 684 Loans and Advances disbursed
4,319 1,663 668 2,331
Public Debt receipts 31,080 36,066 Repayment of Public Debt
6,488 * * 6,605
Contingency Fund 19 .. Contingency Fund .. * * 19
Public Account receipts
1,63,707 1,82,545 Public Account disbursements
1,59,384 * * 1,77,442
Opening Cash Balance
24,564 26,335 Closing Cash Balance 26,335 * * 28,253
Total 3,43,157 3,74,638 Total 3,43,157 3,74,638 * Bifurcation of Plan and Non-Plan disbursement is not available (Source: Finance Accounts for the respective years)
The significant changes that occurred during 2015-16, as compared to the previous year are enumerated below:
Report on State Finances for the year ended 31 March 2016
4
Revenue receipts of the State increased by ` 6,588 crore (5.38 per cent) over the previous year. This was due to increase in the State’s own tax revenue (` 1,820 crore), share of Union taxes/duties (` 3,530 crore) and grants from Government of India (GoI) (` 671 crore).
Revenue expenditure increased by ` 12,165 crore (9.44 per cent) over the previous year due to increase in expenditure on General Services (` 3,857 crore), Social Services (` 4,457 crore), Economic Services (` 3,100 crore) and Grants-in-aid and contributions (` 751 crore).
The expenditure on General Services, Social Services and Economic Services registered an increase of 9.26 per cent, 8.85 per cent and 11.55 per cent respectively in 2015-16 as against 16.59 per cent, 11.2 per cent and 36.65 per cent respectively in 2014-15.
Capital expenditure increased by ` 1,192 crore (6.7 per cent) over the previous year. The increase in capital expenditure during the year was mainly under Education, Sports, Art & Culture and Agriculture & Allied Activities, Water Supply, Sanitation, Housing & Urban Development and Rural Development.
Recoveries of loans and advances during the year decreased by ` 667 crore (49.37 per cent) mainly due to decrease in recoveries under “Loans for power projects”, partly offset by increase in recoveries under Water Supply, Sanitation, Housing & Urban Development and Agriculture & Allied activities.
Public Account receipts and disbursements increased by ` 18,838 crore (11.51 per cent) and ` 18,058 crore (11.33 per cent) respectively. Net receipts under Public Account increased by ` 780 crore over the previous year.
The net impact of these transactions led to an increase of ` 1,918 crore in the cash balance at the end of the year over the previous year.
1.1.2 Review of the fiscal situation
In compliance with the targets prescribed in the TNFR Act, the State was to eliminate revenue deficit by the end of 2016-17 and contain the fiscal deficit as a percentage of GSDP within three per cent, by 2011-12 and adhere to it thereafter. In compliance with the provisions of TNFR Act, the State Government prepared a Medium Term Fiscal Plan (MTFP) for the period 2015-16 wherein the State was projected to have a revenue surplus.
Chapter I - Finances of the State Government
5
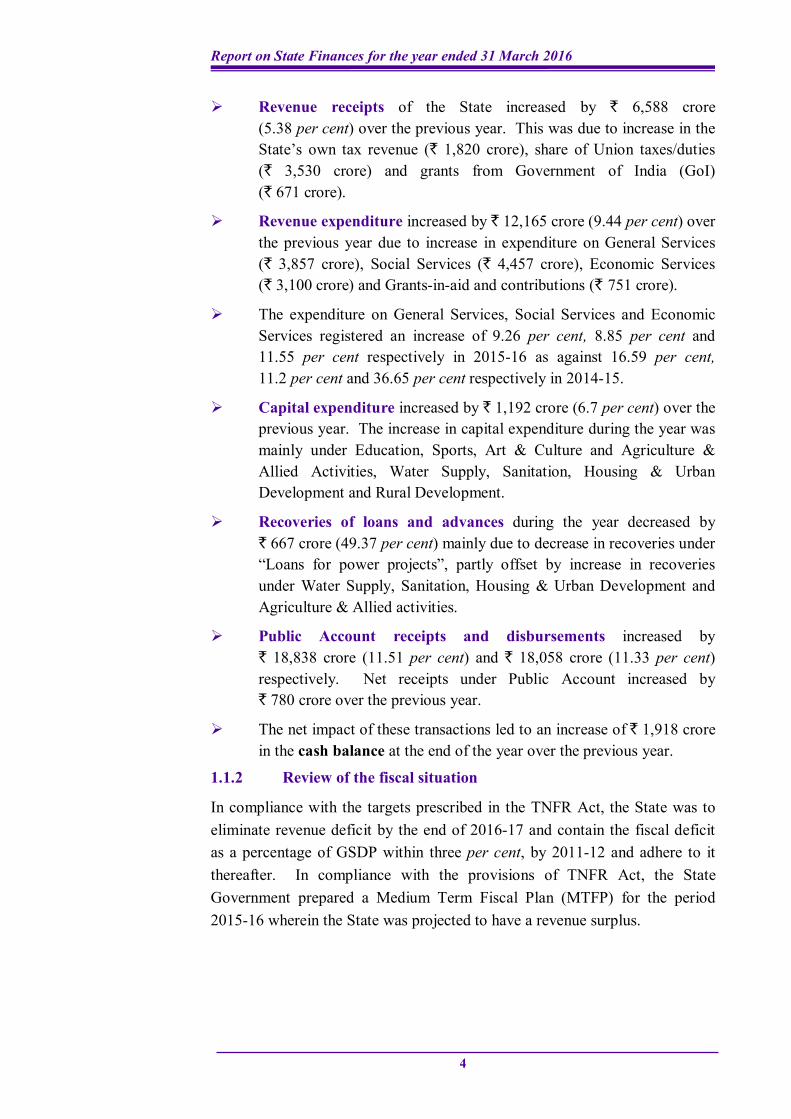
Major fiscal variables provided in the budget based on recommendations of the Fourteenth Finance Commission (FFC) and as targeted in the TNFR Act along with actuals thereof are given in Table 1.3.
Table 1.3: Major targeted and projected fiscal variables and actuals of the State
Fiscal variables 2015-16 Actuals
FFC targets for the State
Targets as prescribed in
TNFR Act
Targets proposed in the Budget
Projections made in MTFP
Revenue Deficit (-) / Surplus (+) (` in crore)
.. Eliminate revenue deficit by 2016-17 and adhere to it thereafter
(-) 4,616.02 783.43 (-) 11,985
Fiscal Deficit/GSDP (in per cent)
3 3 2.89 2.70 2.69
Ratio of total outstanding debt of the Government to GSDP (in per cent)
20.78 25.2 19.23 Well within the limits prescribed in FFC
18.39
(Source: (i) FFC recommendations; (ii) TNFR Act; (iii) State’s MTFP and (iv) Budget Speech - 2015-16)
The State was able to achieve revenue surplus during 2011-12 and continued to maintain it during 2012-13. However, from 2013-14 onwards the State had become revenue deficit. The revenue deficit of the State was ` 11,985 crore (0.99 per cent of GSDP) during 2015-16. During 2015-16, the State not only failed to achieve revenue surplus as projected in the MTFP, but also failed to contain its revenue deficit within the target proposed in the Budget. The State could, however, contain the fiscal deficit as a percentage of GSDP to 2.69 per cent during 2015-16, which was within the target of three per cent of GSDP as envisaged under the TNFR Act, the projections made in MTFP and FFC target.
The Revenue deficit of ` 11,985 crore and fiscal deficit of ` 32,627 crore were understated by ` 1,318.48 crore due to short contribution to Sinking Fund (` 851.85 crore), short contribution to Guarantee Redemption Fund (` 258.49 crore), short transfer to Reserve Funds (` 123.25 crore) and short contribution to Defined Contributory Pension Scheme (` 94.80 crore).
1.1.3 Budget estimates and actuals
The budget papers presented by the State Government provide descriptions of projections or estimations of revenue and expenditure for a particular fiscal year. The importance of accuracy in the estimation of revenue and expenditure is widely accepted in the context of effective implementation of fiscal policies for overall economic management. Deviations from the Budget
Report on State Finances for the year ended 31 March 2016
6
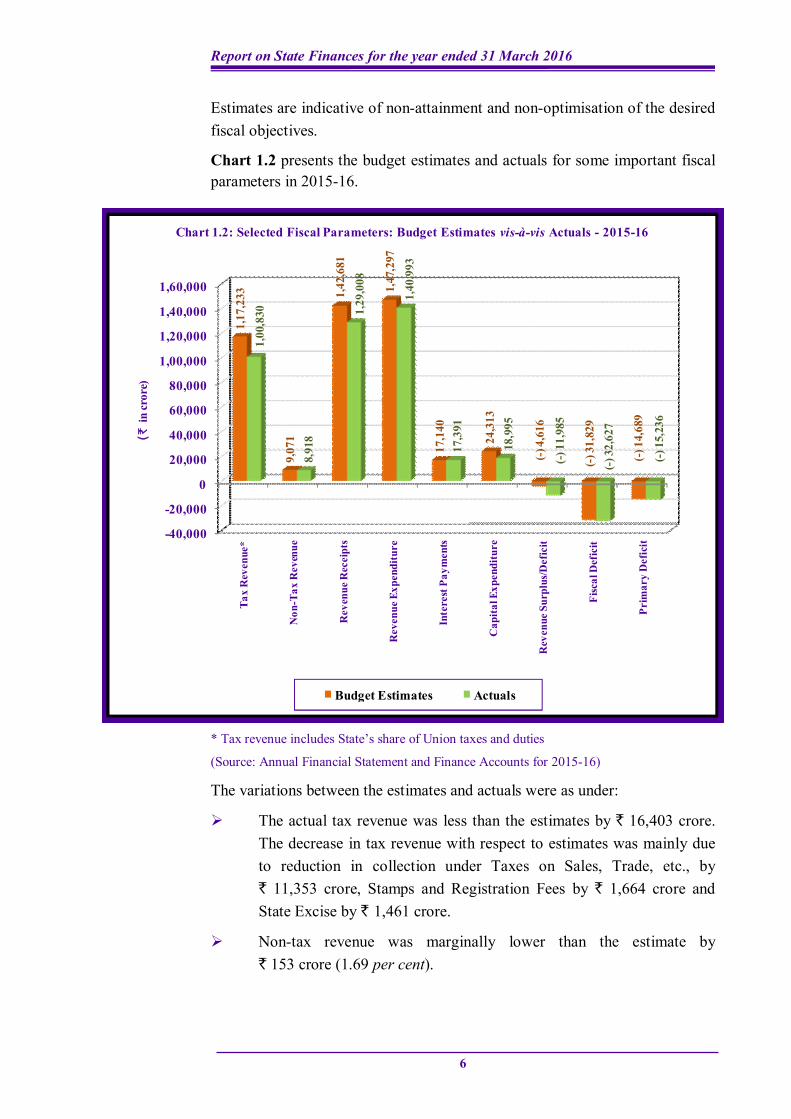
Estimates are indicative of non-attainment and non-optimisation of the desired fiscal objectives.
Chart 1.2 presents the budget estimates and actuals for some important fiscal parameters in 2015-16.
* Tax revenue includes State’s share of Union taxes and duties
(Source: Annual Financial Statement and Finance Accounts for 2015-16)
The variations between the estimates and actuals were as under:
The actual tax revenue was less than the estimates by ` 16,403 crore. The decrease in tax revenue with respect to estimates was mainly due to reduction in collection under Taxes on Sales, Trade, etc., by ` 11,353 crore, Stamps and Registration Fees by ` 1,664 crore and State Excise by ` 1,461 crore.
Non-tax revenue was marginally lower than the estimate by ` 153 crore (1.69 per cent).
-40,000
-20,000
0
20,000
40,000
60,000
80,000
1,00,000
1,20,000
1,40,000
1,60,000
Tax
Rev
enue
*
Non
-Tax
Rev
enue
Rev
enue
Rec
eipt
s
Rev
enue
Exp
endi
ture
Inte
rest
Pay
men
ts
Cap
ital E
xpen
ditu
re
Rev
enue
Sur
plus
/Def
icit
Fisc
al D
efic
it
Prim
ary
Def
icit
1,17
,233
9,07
1
1,42
,681
1,47
,297
17,1
40
24,3
13
(-) 4
,616
(-) 3
1,82
9
(-) 1
4,68
9
1,00
,830
8,91
8
1,29
,008
1,40
,993
17,3
91
18,9
95
(-) 1
1,98
5
(-) 3
2,62
7
(-) 1
5,23
6
(`in
cror
e)
Chart 1.2: Selected Fiscal Parameters: Budget Estimates vis-à-vis Actuals - 2015-16
Budget Estimates Actuals
Chapter I - Finances of the State Government
7
Capital expenditure was less than the estimate by ` 5,318 crore (21.87 per cent).
The actual fiscal deficit was more than the budget estimate mainly due to increase in revenue deficit as compared to Budget Estimate.
1.1.4 Non-implementation of Major Policy initiatives
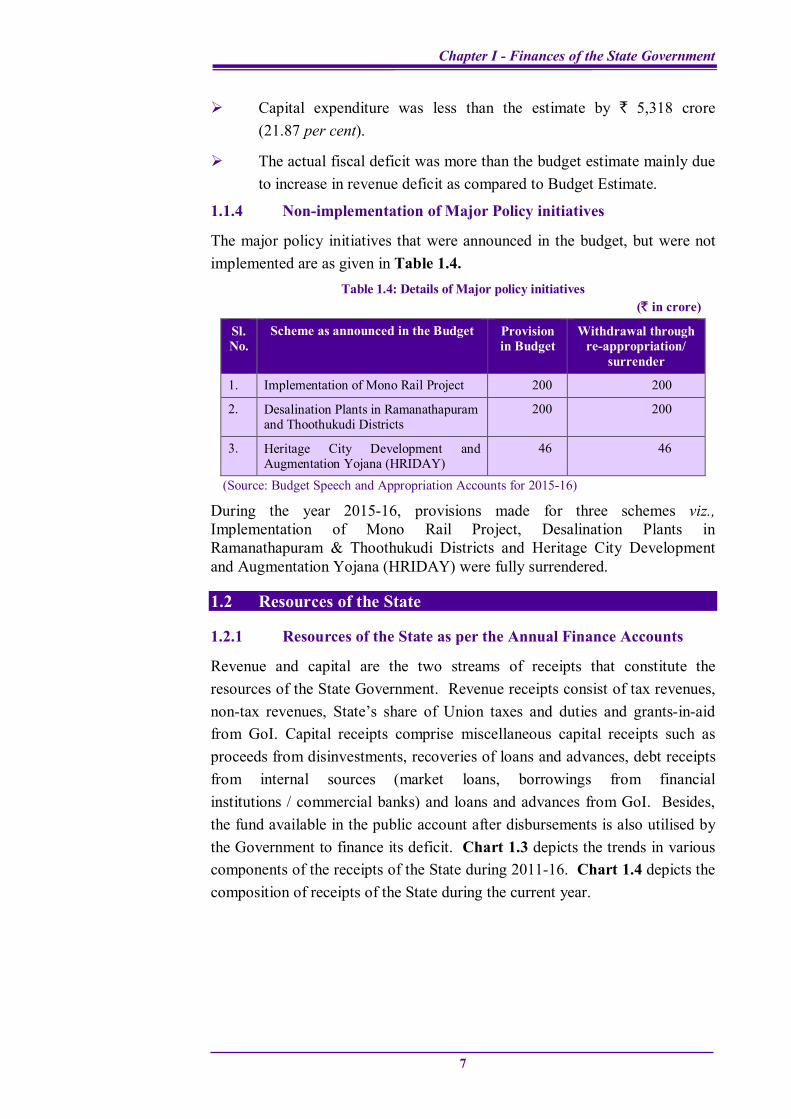
The major policy initiatives that were announced in the budget, but were not implemented are as given in Table 1.4.
Table 1.4: Details of Major policy initiatives (` in crore)
Sl. No.
Scheme as announced in the Budget Provision in Budget
Withdrawal through re-appropriation/
surrender
1. Implementation of Mono Rail Project 200 200
2. Desalination Plants in Ramanathapuram and Thoothukudi Districts
200 200
3. Heritage City Development and Augmentation Yojana (HRIDAY)
46 46
(Source: Budget Speech and Appropriation Accounts for 2015-16)
During the year 2015-16, provisions made for three schemes viz., Implementation of Mono Rail Project, Desalination Plants in Ramanathapuram & Thoothukudi Districts and Heritage City Development and Augmentation Yojana (HRIDAY) were fully surrendered.
1.2 Resources of the State
1.2.1 Resources of the State as per the Annual Finance Accounts
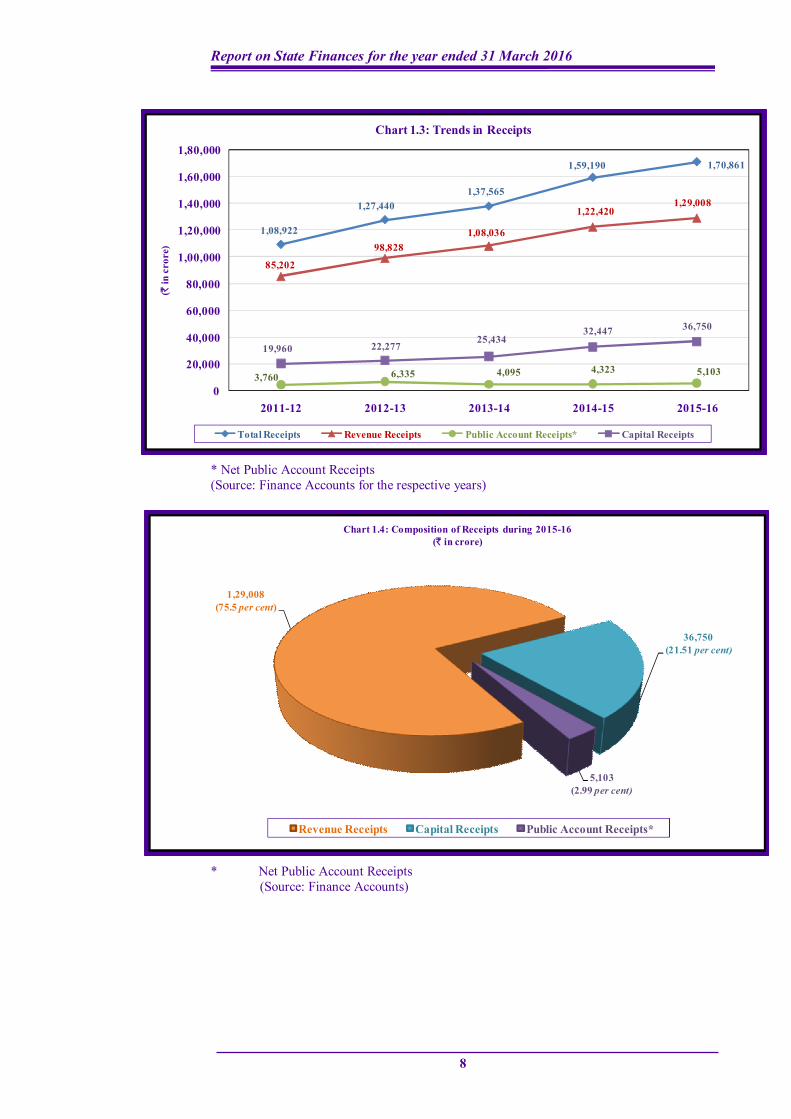
Revenue and capital are the two streams of receipts that constitute the resources of the State Government. Revenue receipts consist of tax revenues, non-tax revenues, State’s share of Union taxes and duties and grants-in-aid from GoI. Capital receipts comprise miscellaneous capital receipts such as proceeds from disinvestments, recoveries of loans and advances, debt receipts from internal sources (market loans, borrowings from financial institutions / commercial banks) and loans and advances from GoI. Besides, the fund available in the public account after disbursements is also utilised by the Government to finance its deficit. Chart 1.3 depicts the trends in various components of the receipts of the State during 2011-16. Chart 1.4 depicts the composition of receipts of the State during the current year.
Report on State Finances for the year ended 31 March 2016
8
* Net Public Account Receipts (Source: Finance Accounts for the respective years)
* Net Public Account Receipts (Source: Finance Accounts)
1,29,008(75.5 per cent)
36,750(21.51 per cent)
5,103(2.99 per cent)
Chart 1.4: Composition of Receipts during 2015-16(` in crore)
Revenue Receipts Capital Receipts Public Account Receipts*
1,08,922
1,27,4401,37,565
1,59,190 1,70,861
85,202
98,8281,08,036
1,22,4201,29,008
3,760 6,335 4,095 4,323 5,103
19,960 22,27725,434
32,447 36,750
0
20,000
40,000
60,000
80,000
1,00,000
1,20,000
1,40,000
1,60,000
1,80,000
2011-12 2012-13 2013-14 2014-15 2015-16
(`in
cro
re)
Chart 1.3: Trends in Receipts
Total Receipts Revenue Receipts Public Account Receipts* Capital Receipts
Chapter I - Finances of the State Government
9
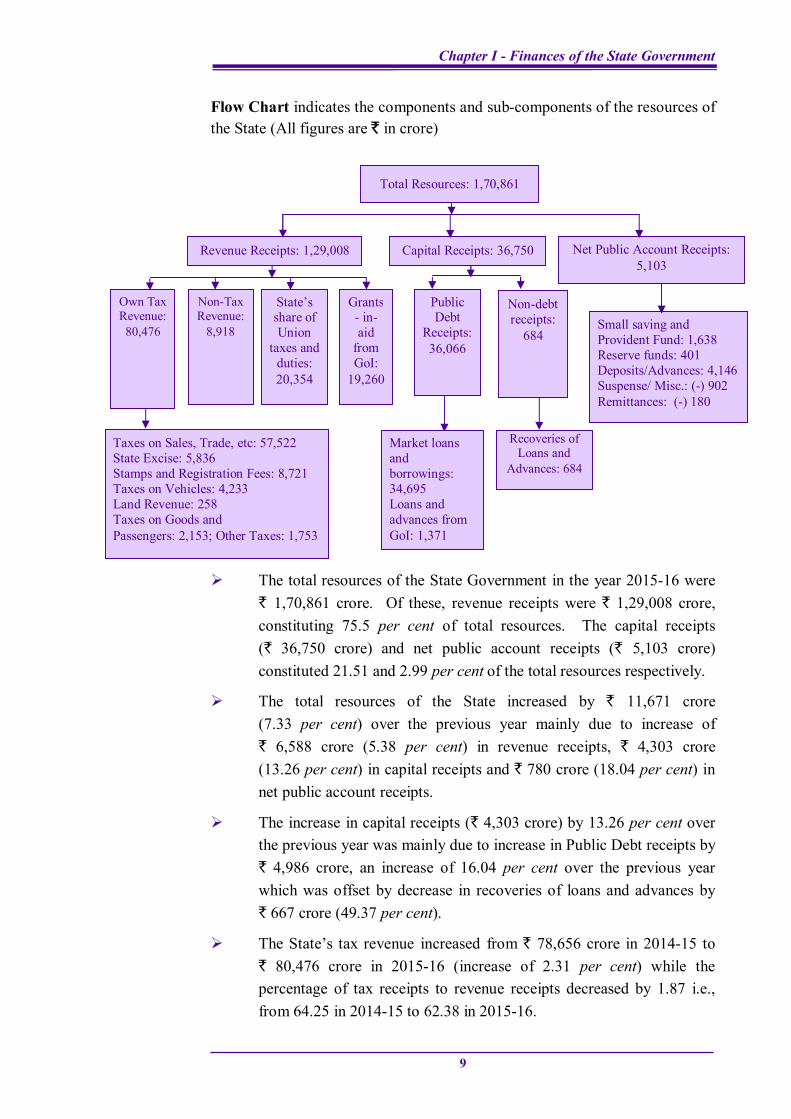
Flow Chart indicates the components and sub-components of the resources of the State (All figures are ` in crore)
The total resources of the State Government in the year 2015-16 were ` 1,70,861 crore. Of these, revenue receipts were ` 1,29,008 crore, constituting 75.5 per cent of total resources. The capital receipts (` 36,750 crore) and net public account receipts (` 5,103 crore) constituted 21.51 and 2.99 per cent of the total resources respectively.
The total resources of the State increased by ` 11,671 crore (7.33 per cent) over the previous year mainly due to increase of ` 6,588 crore (5.38 per cent) in revenue receipts, ` 4,303 crore (13.26 per cent) in capital receipts and ` 780 crore (18.04 per cent) in net public account receipts.
The increase in capital receipts (` 4,303 crore) by 13.26 per cent over the previous year was mainly due to increase in Public Debt receipts by ` 4,986 crore, an increase of 16.04 per cent over the previous year which was offset by decrease in recoveries of loans and advances by ` 667 crore (49.37 per cent).
The State’s tax revenue increased from ` 78,656 crore in 2014-15 to ` 80,476 crore in 2015-16 (increase of 2.31 per cent) while the percentage of tax receipts to revenue receipts decreased by 1.87 i.e., from 64.25 in 2014-15 to 62.38 in 2015-16.
Revenue Receipts: 1,29,008 Capital Receipts: 36,750 Net Public Account Receipts: 5,103
Own Tax Revenue:
80,476
Non-Tax Revenue:
8,918
State’s share of Union
taxes and duties: 20,354
Grants- in-aid
from GoI:
19,260
Public Debt
Receipts: 36,066
Non-debt receipts:
684
Recoveries of Loans and
Advances: 684
Market loans and borrowings: 34,695 Loans and advances from GoI: 1,371
Taxes on Sales, Trade, etc: 57,522 State Excise: 5,836 Stamps and Registration Fees: 8,721 Taxes on Vehicles: 4,233 Land Revenue: 258 Taxes on Goods and Passengers: 2,153; Other Taxes: 1,753
Total Resources: 1,70,861
Small saving and Provident Fund: 1,638 Reserve funds: 401 Deposits/Advances: 4,146 Suspense/ Misc.: (-) 902 Remittances: (-) 180
Report on State Finances for the year ended 31 March 2016
10
The increase in tax revenue (` 1,820 crore) in 2015-16 when compared to the previous year was mainly due to increase under (i) Taxes on vehicles: ` 404.45 crore, (ii) Stamps and Registration fees: ` 359.12 crore, (iii) Taxes on Sales, Trade etc: ` 331.23 crore, (iv) Taxes on goods and passengers: ` 244.57 crore and (v) Taxes and Duties on Electricity: ` 209 crore.
State’s share of Union taxes and duties increased by ` 3,530 crore (20.98 per cent) over the previous year, mainly due to increase in percentage of tax devolution recommended by FFC.
1.3 Revenue Receipts
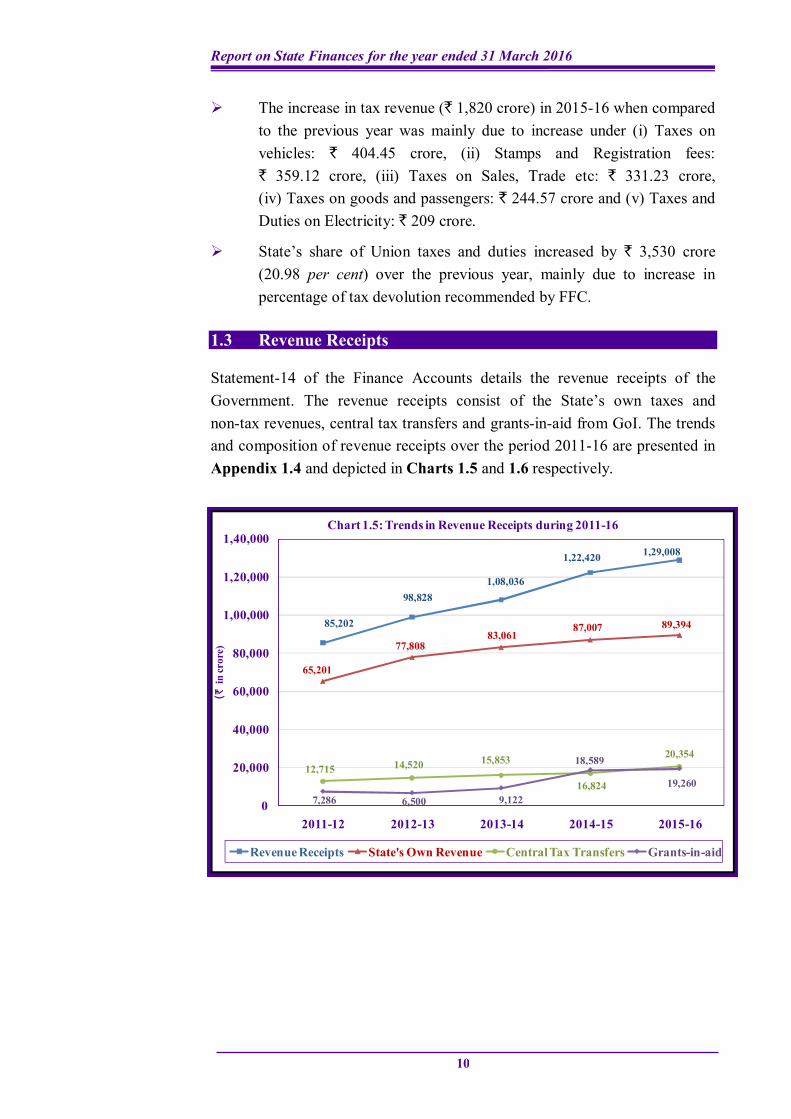
Statement-14 of the Finance Accounts details the revenue receipts of the Government. The revenue receipts consist of the State’s own taxes and non-tax revenues, central tax transfers and grants-in-aid from GoI. The trends and composition of revenue receipts over the period 2011-16 are presented in Appendix 1.4 and depicted in Charts 1.5 and 1.6 respectively.
85,202
98,8281,08,036
1,22,420 1,29,008
65,201
77,80883,061
87,007 89,394
12,715 14,520 15,853
16,824
20,354
7,286 6,500 9,122
18,589
19,260
0
20,000
40,000
60,000
80,000
1,00,000
1,20,000
1,40,000
2011-12 2012-13 2013-14 2014-15 2015-16
(`in
cror
e)
Chart 1.5: Trends in Revenue Receipts during 2011-16
Revenue Receipts State's Own Revenue Central Tax Transfers Grants-in-aid
Chapter I - Finances of the State Government
11
(Source: Finance Accounts for the respective years)
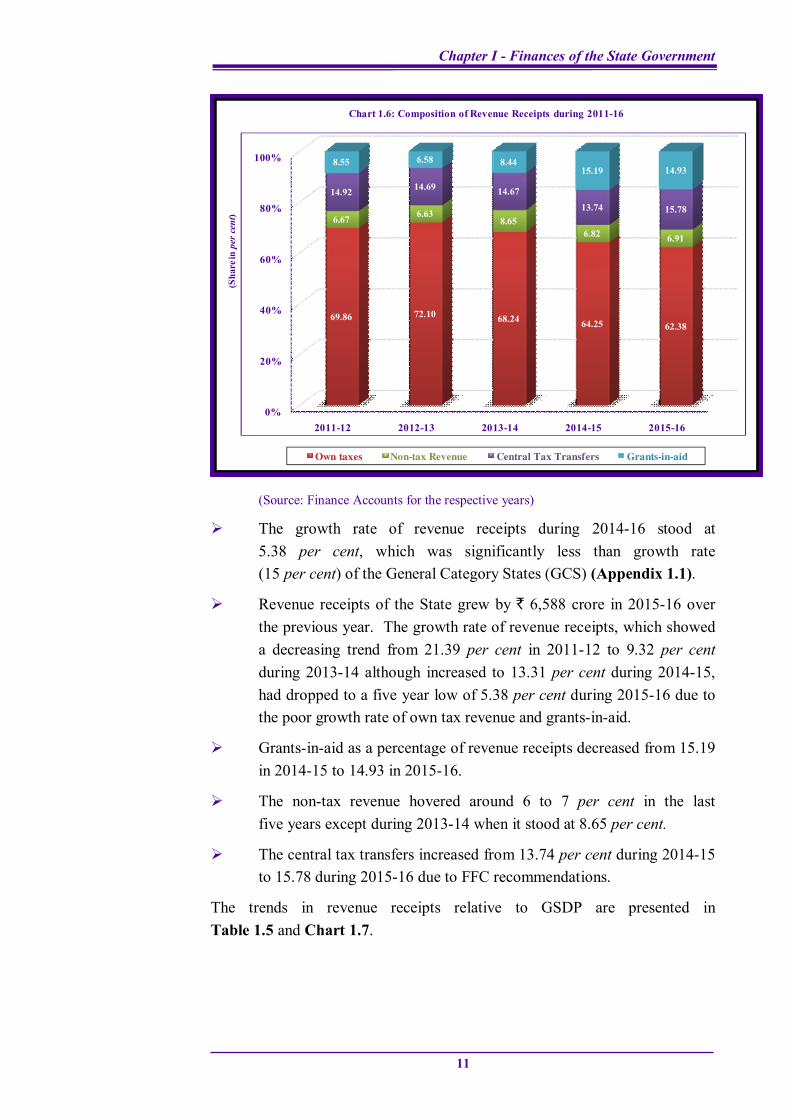
The growth rate of revenue receipts during 2014-16 stood at 5.38 per cent, which was significantly less than growth rate (15 per cent) of the General Category States (GCS) (Appendix 1.1).
Revenue receipts of the State grew by ` 6,588 crore in 2015-16 over the previous year. The growth rate of revenue receipts, which showed a decreasing trend from 21.39 per cent in 2011-12 to 9.32 per cent during 2013-14 although increased to 13.31 per cent during 2014-15, had dropped to a five year low of 5.38 per cent during 2015-16 due to the poor growth rate of own tax revenue and grants-in-aid.
Grants-in-aid as a percentage of revenue receipts decreased from 15.19 in 2014-15 to 14.93 in 2015-16.
The non-tax revenue hovered around 6 to 7 per cent in the last five years except during 2013-14 when it stood at 8.65 per cent.
The central tax transfers increased from 13.74 per cent during 2014-15 to 15.78 during 2015-16 due to FFC recommendations.
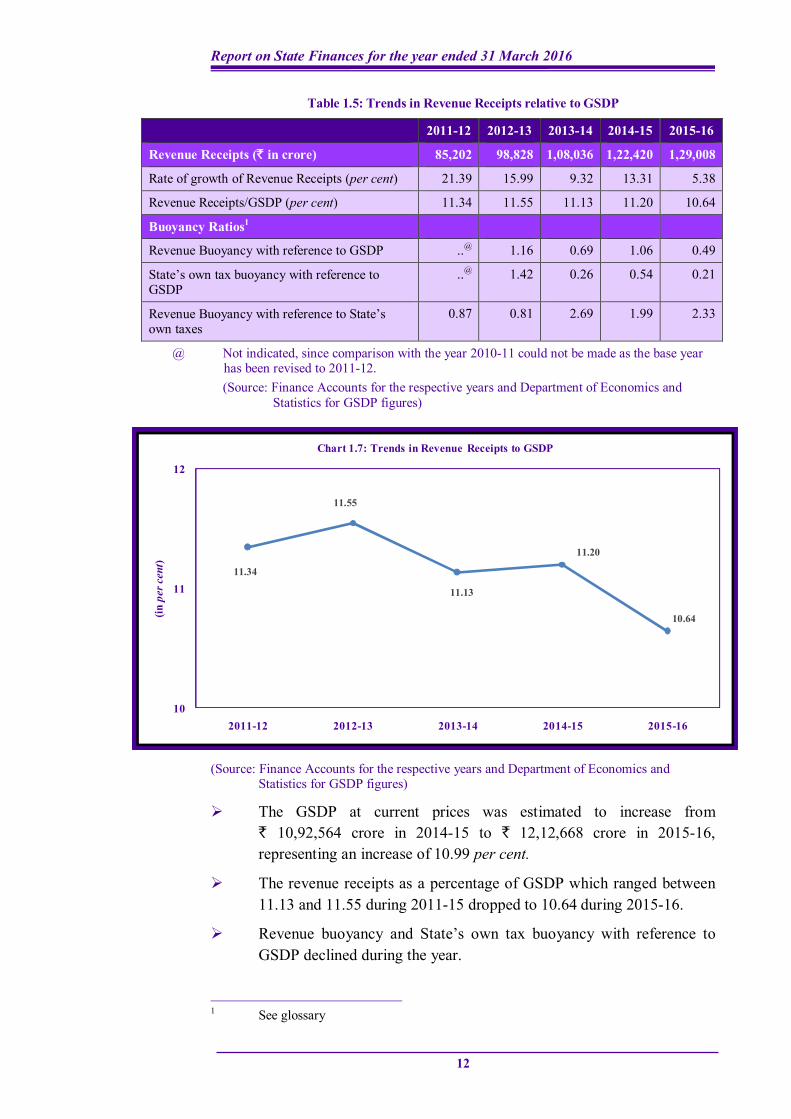
The trends in revenue receipts relative to GSDP are presented in Table 1.5 and Chart 1.7.
0%
20%
40%
60%
80%
100%
2011-12 2012-13 2013-14 2014-15 2015-16
69.86 72.10 68.24 64.25 62.38
6.67 6.638.65
6.82 6.91
14.92 14.69 14.67
13.74 15.78
8.55 6.58 8.4415.19 14.93
(Sha
re in
per
cen
t)
Chart 1.6: Composition of Revenue Receipts during 2011-16
Report on State Finances for the year ended 31 March 2016
12
Table 1.5: Trends in Revenue Receipts relative to GSDP
2011-12 2012-13 2013-14 2014-15 2015-16
Revenue Receipts (` in crore) 85,202 98,828 1,08,036 1,22,420 1,29,008
Rate of growth of Revenue Receipts (per cent) 21.39 15.99 9.32 13.31 5.38
Revenue Receipts/GSDP (per cent) 11.34 11.55 11.13 11.20 10.64
Buoyancy Ratios1
Revenue Buoyancy with reference to GSDP ..@ 1.16 0.69 1.06 0.49
State’s own tax buoyancy with reference to GSDP
..@ 1.42 0.26 0.54 0.21
Revenue Buoyancy with reference to State’s own taxes
0.87 0.81 2.69 1.99 2.33
@ Not indicated, since comparison with the year 2010-11 could not be made as the base year has been revised to 2011-12.
(Source: Finance Accounts for the respective years and Department of Economics and Statistics for GSDP figures)
(Source: Finance Accounts for the respective years and Department of Economics and Statistics for GSDP figures)
The GSDP at current prices was estimated to increase from ` 10,92,564 crore in 2014-15 to ` 12,12,668 crore in 2015-16, representing an increase of 10.99 per cent.
The revenue receipts as a percentage of GSDP which ranged between 11.13 and 11.55 during 2011-15 dropped to 10.64 during 2015-16.
Revenue buoyancy and State’s own tax buoyancy with reference to GSDP declined during the year.
1 See glossary
11.34
11.55
11.13
11.20
10.64
10
11
12
2011-12 2012-13 2013-14 2014-15 2015-16
(in p
er c
ent)
Chart 1.7: Trends in Revenue Receipts to GSDP
Chapter I - Finances of the State Government
13
Though rate of growth of own taxes decreased from 6.7 per cent in 2014-15 to 2.31 per cent in 2015-16, the revenue buoyancy with reference to State’s own taxes increased from 1.99 in 2014-15 to 2.33 in 2015-16 because of increase in growth rate of central tax transfers.
1.3.1 State’s Own Resources
As the State’s share in central taxes and grants-in-aid are determined on the basis of recommendations of the Finance Commission, the State’s performance in mobilisation of resources was assessed in terms of its own resources comprising own tax and non-tax sources. The State’s tax and non-tax receipts for the year 2015-16 vis-a-vis assessment made by FFC, its Budget and MTFP are given in the Table 1.6.
Table 1.6: State’s Actual Tax and Non-tax Revenue Receipts (` in crore)
FFC targets for the State
Targets proposed in the Budget
Projections made in MTFP
Actuals
Tax Revenue 1,11,551 96,083 1,03,893 80,476
Non-tax Revenue 10,030 9,072 8,267 8,918
(Source: FFC recommendations and Budget Speech - 2015-16)
While the tax receipts during 2015-16 fell short of the targets and projections made, the non-tax receipts exceeded the MTFP projections, but did not meet the targets fixed under the Budget and FFC.
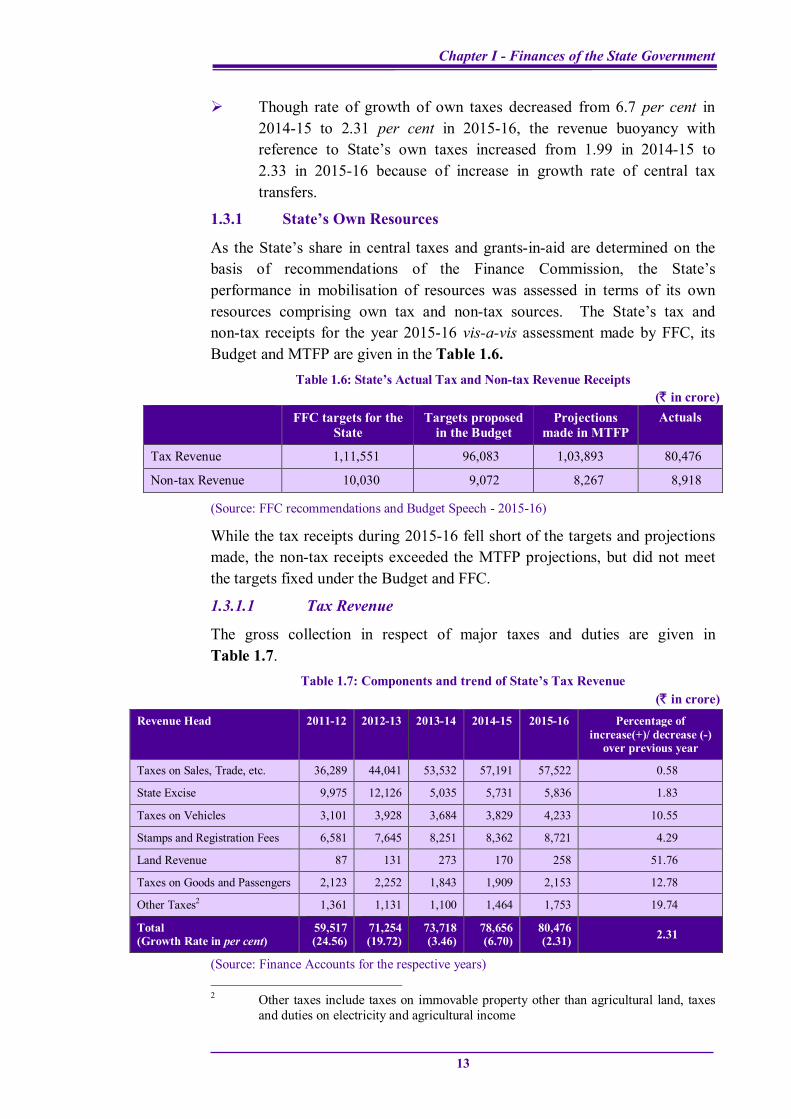
1.3.1.1 Tax Revenue
The gross collection in respect of major taxes and duties are given in Table 1.7.
Table 1.7: Components and trend of State’s Tax Revenue (` in crore)
Revenue Head 2011-12 2012-13 2013-14 2014-15 2015-16 Percentage of increase(+)/ decrease (-)
over previous year
Taxes on Sales, Trade, etc. 36,289 44,041 53,532 57,191 57,522 0.58
State Excise 9,975 12,126 5,035 5,731 5,836 1.83
Taxes on Vehicles 3,101 3,928 3,684 3,829 4,233 10.55
Stamps and Registration Fees 6,581 7,645 8,251 8,362 8,721 4.29
Land Revenue 87 131 273 170 258 51.76
Taxes on Goods and Passengers 2,123 2,252 1,843 1,909 2,153 12.78
Other Taxes2 1,361 1,131 1,100 1,464 1,753 19.74
Total (Growth Rate in per cent)
59,517 (24.56)
71,254 (19.72)
73,718 (3.46)
78,656 (6.70)
80,476 (2.31) 2.31
(Source: Finance Accounts for the respective years) 2 Other taxes include taxes on immovable property other than agricultural land, taxes
and duties on electricity and agricultural income
Report on State Finances for the year ended 31 March 2016
14
The growth rate of own tax revenue during 2014-16 stood at 2.31 per cent, which was significantly less than the average (13.28 per cent) of GCS (Appendix 1.1).
The own tax revenue of the State increased by ` 1,820 crore over the previous year. The growth rate of State’s own tax revenue, which was at 24.56 per cent in 2011-12, declined to a five year low of 2.31 per cent in 2015-16.
The increase in growth rate of own tax revenue over the previous year was mainly due to increase in collection of Land Revenue (51.76 per cent), Taxes on Goods and Passengers (12.78 per cent), Taxes on vehicles (10.55 per cent) and Other taxes (19.74 per cent).
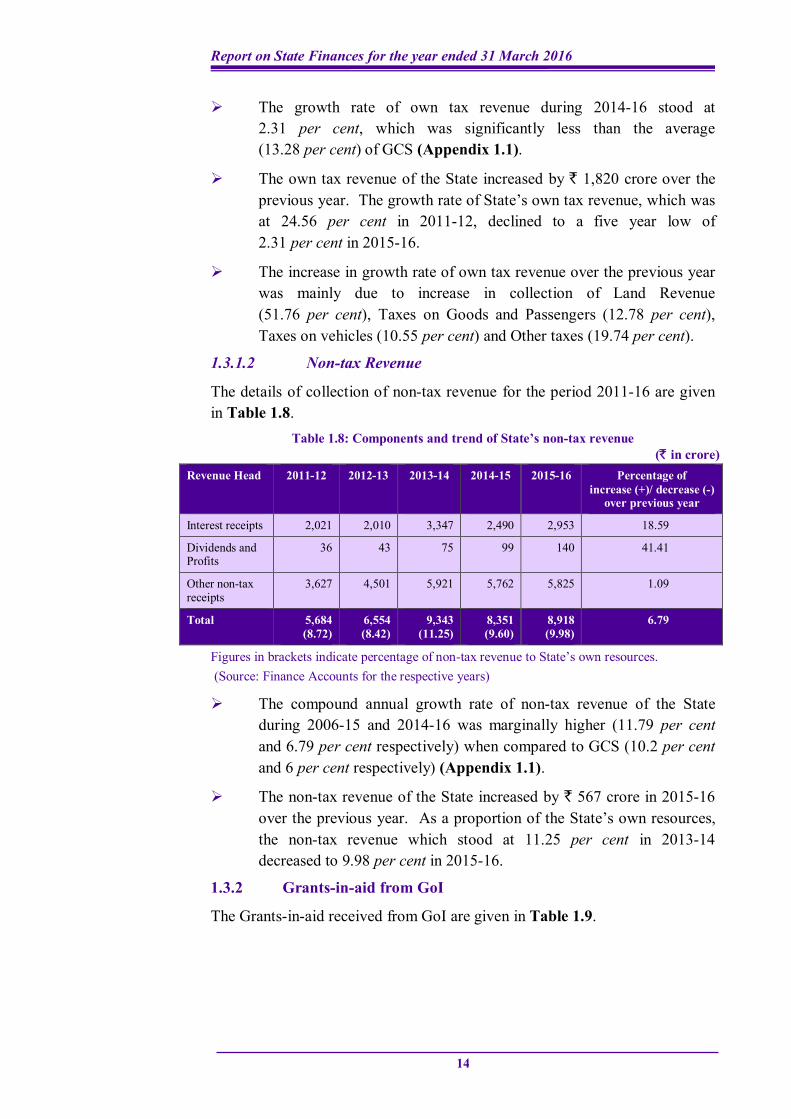
1.3.1.2 Non-tax Revenue
The details of collection of non-tax revenue for the period 2011-16 are given in Table 1.8.
Table 1.8: Components and trend of State’s non-tax revenue (` in crore)
Revenue Head 2011-12 2012-13 2013-14 2014-15 2015-16 Percentage of increase (+)/ decrease (-)
over previous year
Interest receipts 2,021 2,010 3,347 2,490 2,953 18.59
Dividends and Profits
36 43 75 99 140 41.41
Other non-tax receipts
3,627 4,501 5,921 5,762 5,825 1.09
Total 5,684 (8.72)
6,554 (8.42)
9,343 (11.25)
8,351 (9.60)
8,918 (9.98)
6.79
Figures in brackets indicate percentage of non-tax revenue to State’s own resources. (Source: Finance Accounts for the respective years)
The compound annual growth rate of non-tax revenue of the State during 2006-15 and 2014-16 was marginally higher (11.79 per cent and 6.79 per cent respectively) when compared to GCS (10.2 per cent and 6 per cent respectively) (Appendix 1.1).
The non-tax revenue of the State increased by ` 567 crore in 2015-16 over the previous year. As a proportion of the State’s own resources, the non-tax revenue which stood at 11.25 per cent in 2013-14 decreased to 9.98 per cent in 2015-16.
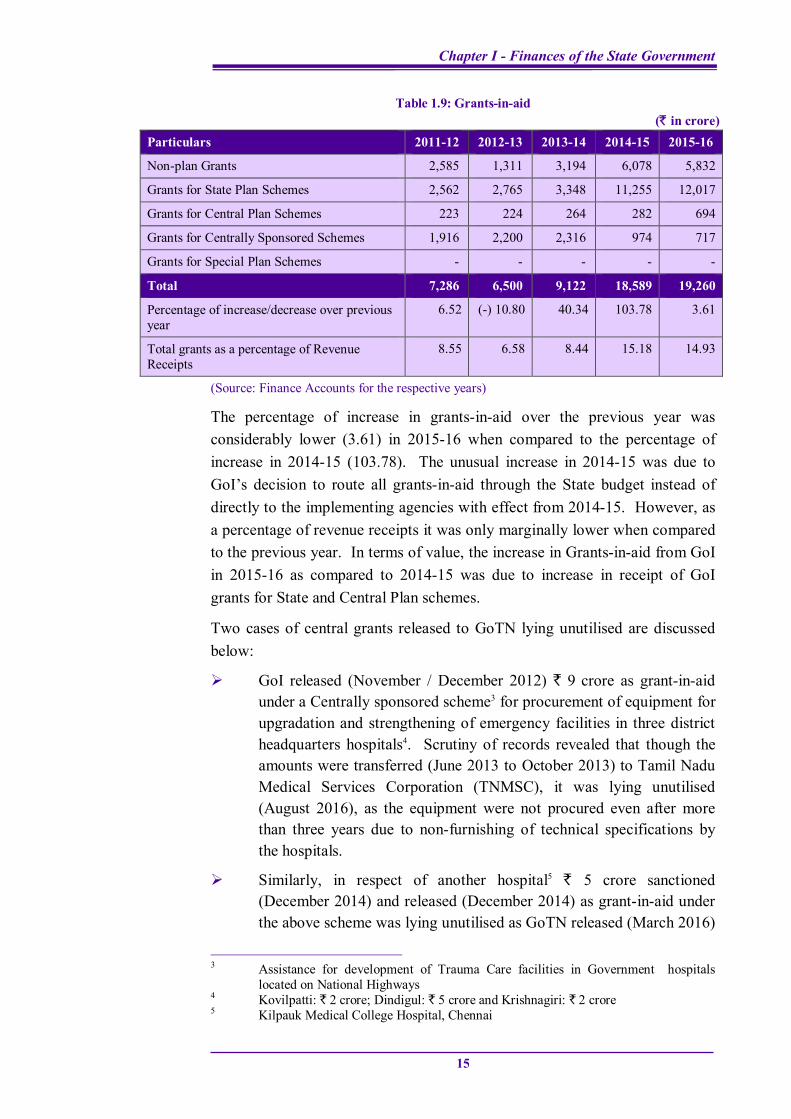
1.3.2 Grants-in-aid from GoI
The Grants-in-aid received from GoI are given in Table 1.9.
Chapter I - Finances of the State Government
15
Table 1.9: Grants-in-aid (` in crore)
Particulars 2011-12 2012-13 2013-14 2014-15 2015-16
Non-plan Grants 2,585 1,311 3,194 6,078 5,832
Grants for State Plan Schemes 2,562 2,765 3,348 11,255 12,017
Grants for Central Plan Schemes 223 224 264 282 694
Grants for Centrally Sponsored Schemes 1,916 2,200 2,316 974 717
Grants for Special Plan Schemes - - - - -
Total 7,286 6,500 9,122 18,589 19,260
Percentage of increase/decrease over previous year
6.52 (-) 10.80 40.34 103.78 3.61
Total grants as a percentage of Revenue Receipts
8.55 6.58 8.44 15.18 14.93
(Source: Finance Accounts for the respective years)
The percentage of increase in grants-in-aid over the previous year was considerably lower (3.61) in 2015-16 when compared to the percentage of increase in 2014-15 (103.78). The unusual increase in 2014-15 was due to GoI’s decision to route all grants-in-aid through the State budget instead of directly to the implementing agencies with effect from 2014-15. However, as a percentage of revenue receipts it was only marginally lower when compared to the previous year. In terms of value, the increase in Grants-in-aid from GoI in 2015-16 as compared to 2014-15 was due to increase in receipt of GoI grants for State and Central Plan schemes.
Two cases of central grants released to GoTN lying unutilised are discussed below:
GoI released (November / December 2012) ` 9 crore as grant-in-aid under a Centrally sponsored scheme3 for procurement of equipment for upgradation and strengthening of emergency facilities in three district headquarters hospitals4. Scrutiny of records revealed that though the amounts were transferred (June 2013 to October 2013) to Tamil Nadu Medical Services Corporation (TNMSC), it was lying unutilised (August 2016), as the equipment were not procured even after more than three years due to non-furnishing of technical specifications by the hospitals.
Similarly, in respect of another hospital5 ` 5 crore sanctioned (December 2014) and released (December 2014) as grant-in-aid under the above scheme was lying unutilised as GoTN released (March 2016)
3 Assistance for development of Trauma Care facilities in Government hospitals
located on National Highways 4 Kovilpatti: ` 2 crore; Dindigul: ` 5 crore and Krishnagiri: ` 2 crore 5 Kilpauk Medical College Hospital, Chennai
Report on State Finances for the year ended 31 March 2016
16
the amount to TNMSC, after a delay of 15 months and the procurement of equipment by TNMSC was only at the tender stage (August 2016).
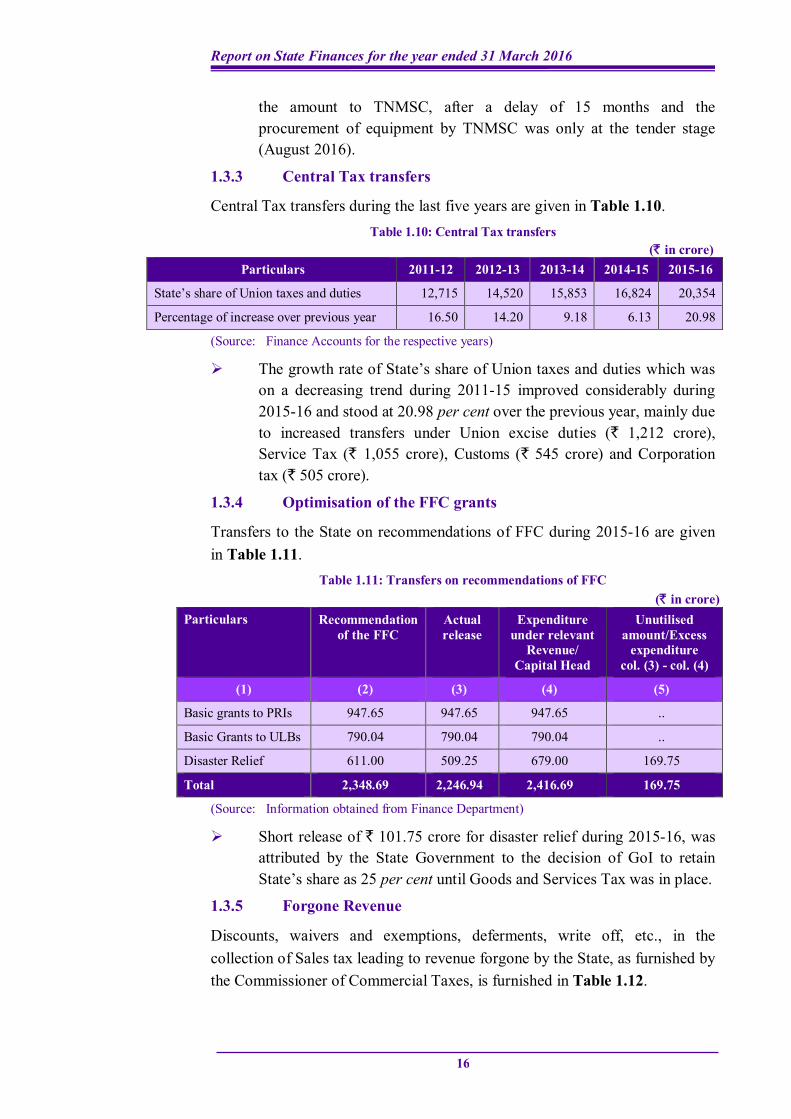
1.3.3 Central Tax transfers
Central Tax transfers during the last five years are given in Table 1.10. Table 1.10: Central Tax transfers
(` in crore) Particulars 2011-12 2012-13 2013-14 2014-15 2015-16
State’s share of Union taxes and duties 12,715 14,520 15,853 16,824 20,354
Percentage of increase over previous year 16.50 14.20 9.18 6.13 20.98
(Source: Finance Accounts for the respective years)
The growth rate of State’s share of Union taxes and duties which was on a decreasing trend during 2011-15 improved considerably during 2015-16 and stood at 20.98 per cent over the previous year, mainly due to increased transfers under Union excise duties (` 1,212 crore), Service Tax (` 1,055 crore), Customs (` 545 crore) and Corporation tax (` 505 crore).
1.3.4 Optimisation of the FFC grants
Transfers to the State on recommendations of FFC during 2015-16 are given in Table 1.11.
Table 1.11: Transfers on recommendations of FFC (` in crore)
Particulars Recommendation of the FFC
Actual release
Expenditure under relevant
Revenue/ Capital Head
Unutilised amount/Excess
expenditure col. (3) - col. (4)
(1) (2) (3) (4) (5)
Basic grants to PRIs 947.65 947.65 947.65 ..
Basic Grants to ULBs 790.04 790.04 790.04 ..
Disaster Relief 611.00 509.25 679.00 169.75
Total 2,348.69 2,246.94 2,416.69 169.75
(Source: Information obtained from Finance Department)
Short release of ` 101.75 crore for disaster relief during 2015-16, was attributed by the State Government to the decision of GoI to retain State’s share as 25 per cent until Goods and Services Tax was in place.
1.3.5 Forgone Revenue
Discounts, waivers and exemptions, deferments, write off, etc., in the collection of Sales tax leading to revenue forgone by the State, as furnished by the Commissioner of Commercial Taxes, is furnished in Table 1.12.

Chapter I - Finances of the State Government
17
Table 1.12: Discounts, waiver, exemption, deferment and write off in collection of Sales Tax
(` in crore)
Particulars 2011-12 2012-13 2013-14 2014-15 2015-16
Discount 103.02 25.83 Nil Nil Nil
Waiver 131.38 (2008-09 to 2012-13)
113.57 Nil 60.44
Exemption 11.29 21.68 0.01 8.48 4.00
Deferment 3,522.42 (2008-09 to 2012-13)
1,174.11 2,902.91 236.90
Write off Not available 448.32 Nil 461.39
(Source: Information furnished by the Commissioner of Commercial Taxes)
1.4 Capital Receipts
Public debt receipts, recoveries of loans and advances and miscellaneous capital receipts are the capital receipts of the Government. The trends in growth and composition of capital receipts are given in Table 1.13.
Table 1.13: Trends in growth and composition of capital receipts (` in crore)
Particulars 2011-12 2012-13 2013-14 2014-15 2015-16
Capital Receipts 19,960 22,277 25,434 32,447 36,750
Miscellaneous capital receipts
.. .. .. 16 ..
Recovery of loans and advances
3,180 1,057 620 1,351 684
Public debt receipts 16,780 21,220 24,814 31,080 36,066
Rate of growth of public debt receipts
15.79 26.46 16.94 25.25 16.04
Rate of growth of non-debt capital receipts
312.99 (-) 66.76 (-) 41.34 120.48 (-) 49.96
Rate of growth of GSDP ..@ 13.84 13.51 12.51 10.99
Rate of growth of capital receipts
30.78 11.61 14.17 27.57 13.26
@ Growth rate of GSDP not indicated, since comparison with the year 2010-11 could not be made as the base year has been revised to 2011-12
(Source: Finance Accounts for the respective years and Information on GSDP from Department of Economics and Statistics)
The recoveries of loans and advances which was high during 2011-12 declined drastically thereafter both in terms of value and rate of growth upto 2013-14. Though it increased during 2014-15, the recoveries again decreased by ` 667 crore (49.37 per cent) over the previous year.
While Public debt receipts in terms of value increased gradually from ` 16,780 crore during 2011-12 to ` 36,066 crore in 2015-16, its rate of
Report on State Finances for the year ended 31 March 2016
18
growth which kept fluctuating during the past five years decreased from 25.25 per cent during 2014-15 to 16.04 per cent in the current year.
The growth rate of non-debt capital receipts, which was 120.48 during 2014-15, decreased sharply and stood at (-) 49.96 during 2015-16.
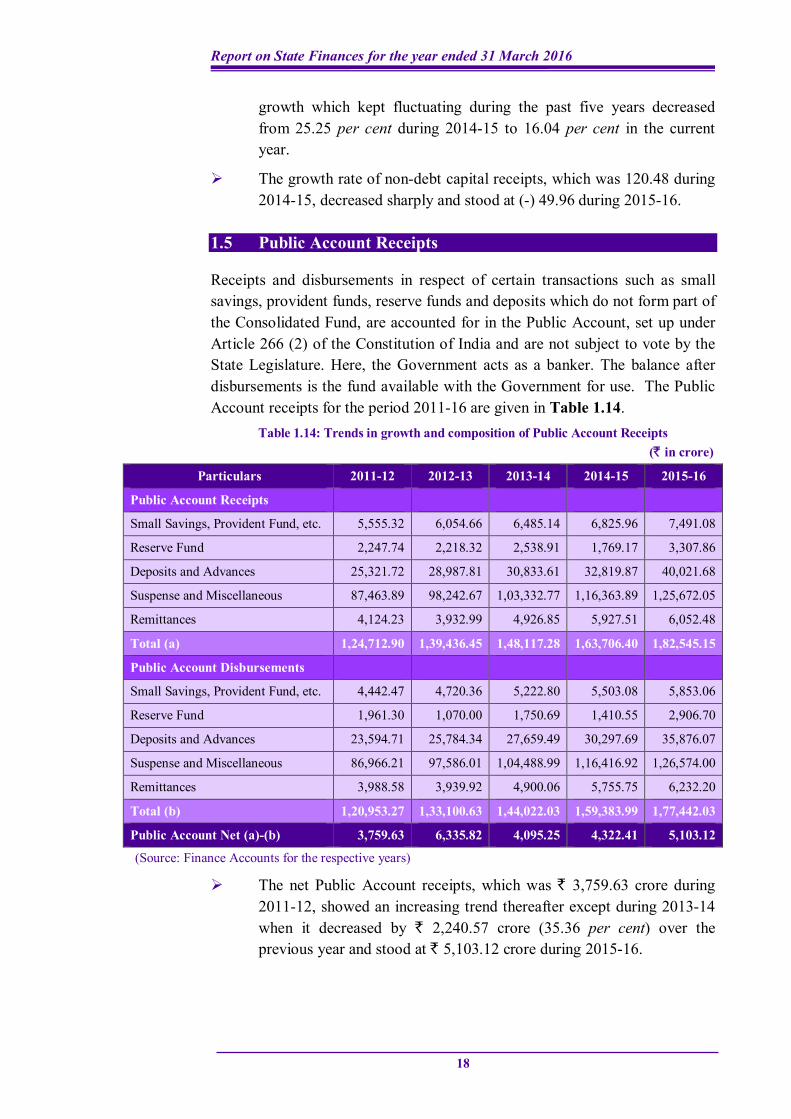
1.5 Public Account Receipts
Receipts and disbursements in respect of certain transactions such as small savings, provident funds, reserve funds and deposits which do not form part of the Consolidated Fund, are accounted for in the Public Account, set up under Article 266 (2) of the Constitution of India and are not subject to vote by the State Legislature. Here, the Government acts as a banker. The balance after disbursements is the fund available with the Government for use. The Public Account receipts for the period 2011-16 are given in Table 1.14.
Table 1.14: Trends in growth and composition of Public Account Receipts (` in crore)
Particulars 2011-12 2012-13 2013-14 2014-15 2015-16
Public Account Receipts
Small Savings, Provident Fund, etc. 5,555.32 6,054.66 6,485.14 6,825.96 7,491.08
Reserve Fund 2,247.74 2,218.32 2,538.91 1,769.17 3,307.86
Deposits and Advances 25,321.72 28,987.81 30,833.61 32,819.87 40,021.68
Suspense and Miscellaneous 87,463.89 98,242.67 1,03,332.77 1,16,363.89 1,25,672.05
Remittances 4,124.23 3,932.99 4,926.85 5,927.51 6,052.48
Total (a) 1,24,712.90 1,39,436.45 1,48,117.28 1,63,706.40 1,82,545.15
Public Account Disbursements
Small Savings, Provident Fund, etc. 4,442.47 4,720.36 5,222.80 5,503.08 5,853.06
Reserve Fund 1,961.30 1,070.00 1,750.69 1,410.55 2,906.70
Deposits and Advances 23,594.71 25,784.34 27,659.49 30,297.69 35,876.07
Suspense and Miscellaneous 86,966.21 97,586.01 1,04,488.99 1,16,416.92 1,26,574.00
Remittances 3,988.58 3,939.92 4,900.06 5,755.75 6,232.20
Total (b) 1,20,953.27 1,33,100.63 1,44,022.03 1,59,383.99 1,77,442.03
Public Account Net (a)-(b) 3,759.63 6,335.82 4,095.25 4,322.41 5,103.12
(Source: Finance Accounts for the respective years)
The net Public Account receipts, which was ` 3,759.63 crore during 2011-12, showed an increasing trend thereafter except during 2013-14 when it decreased by ` 2,240.57 crore (35.36 per cent) over the previous year and stood at ` 5,103.12 crore during 2015-16.
Chapter I - Finances of the State Government
19
1.6 Application of Resources
Analysis of the allocation of expenditure at the State Government level assumes significance since major expenditure responsibilities are entrusted with them. Within the framework of fiscal responsibility legislations, there are budgetary constraints in raising public expenditure financed by deficit or borrowings. It is, therefore, important to ensure that the ongoing fiscal correction and consolidation process at the State level is not at the cost of expenditure, especially the expenditure directed towards development of social sector.
1.6.1 Growth and Composition of Expenditure
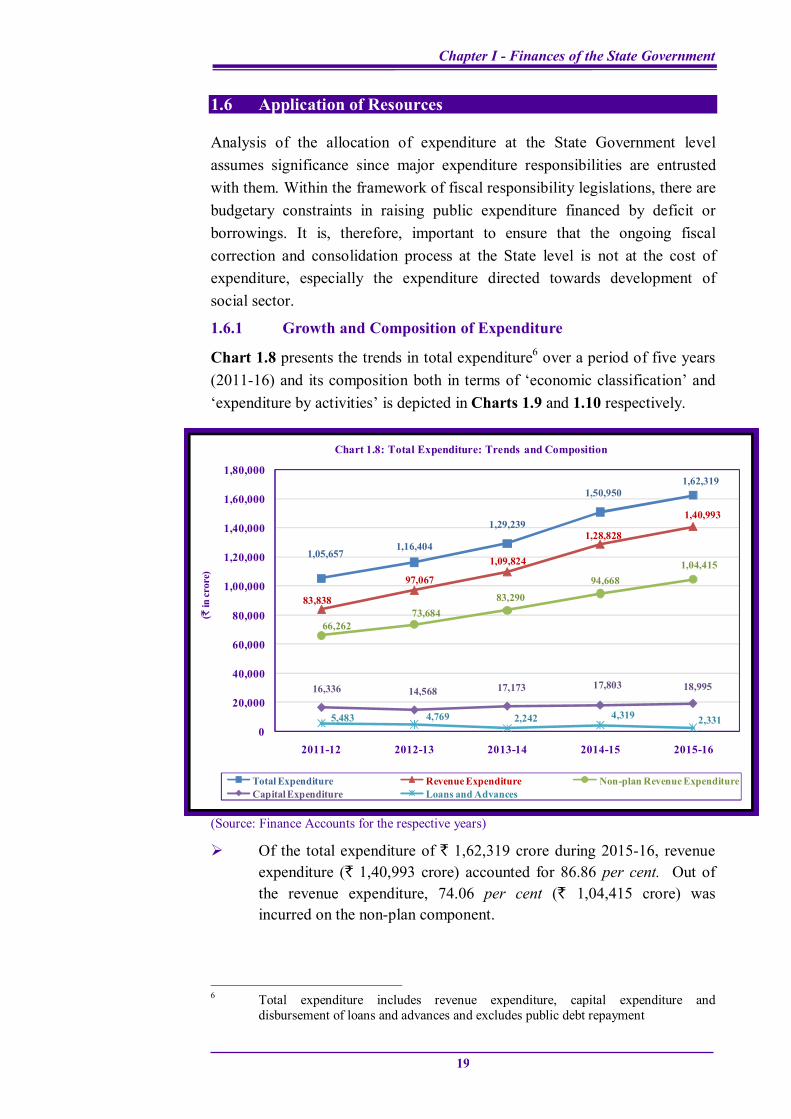
Chart 1.8 presents the trends in total expenditure6 over a period of five years (2011-16) and its composition both in terms of ‘economic classification’ and ‘expenditure by activities’ is depicted in Charts 1.9 and 1.10 respectively.
(Source: Finance Accounts for the respective years)
Of the total expenditure of ` 1,62,319 crore during 2015-16, revenue expenditure (` 1,40,993 crore) accounted for 86.86 per cent. Out of the revenue expenditure, 74.06 per cent (` 1,04,415 crore) was incurred on the non-plan component.
6 Total expenditure includes revenue expenditure, capital expenditure and
disbursement of loans and advances and excludes public debt repayment
1,05,6571,16,404
1,29,239
1,50,9501,62,319
83,838
97,067
1,09,824
1,28,828
1,40,993
66,26273,684
83,29094,668
1,04,415
16,336 14,568 17,173 17,803 18,995
5,483 4,769 2,242 4,319 2,3310
20,000
40,000
60,000
80,000
1,00,000
1,20,000
1,40,000
1,60,000
1,80,000
2011-12 2012-13 2013-14 2014-15 2015-16
(`in
cror
e)
Chart 1.8: Total Expenditure: Trends and Composition
Total Expenditure Revenue Expenditure Non-plan Revenue ExpenditureCapital Expenditure Loans and Advances
Report on State Finances for the year ended 31 March 2016
20
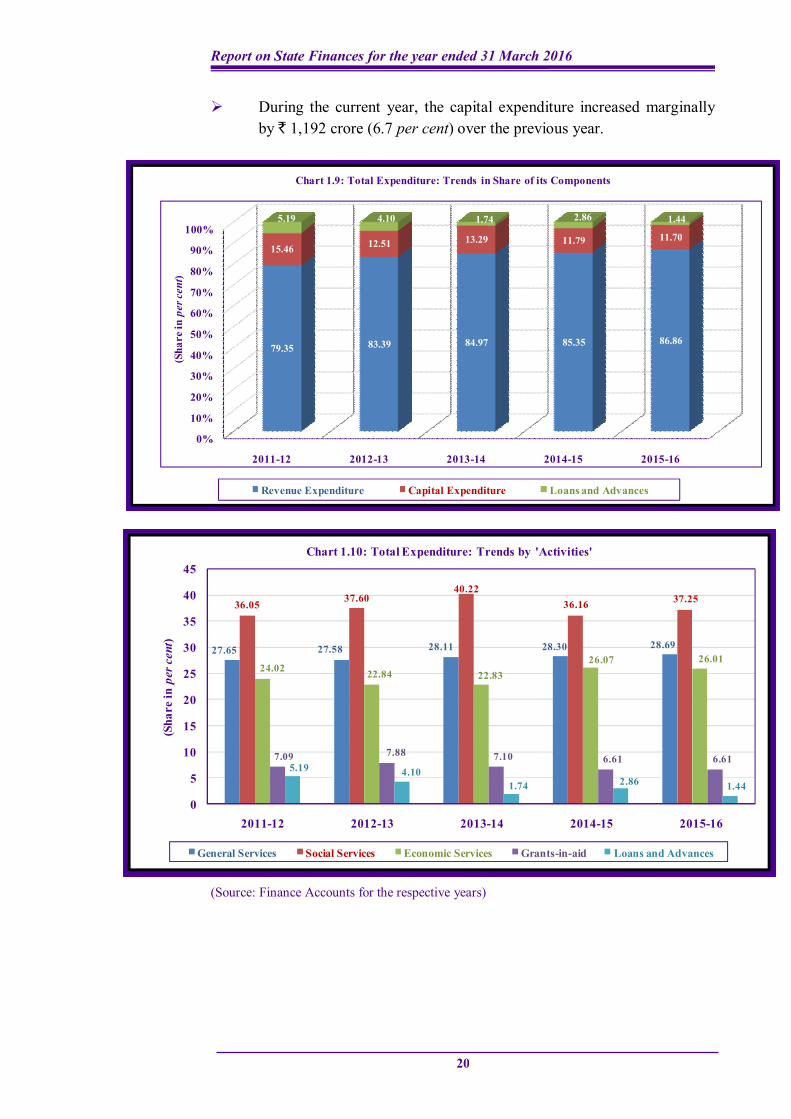
During the current year, the capital expenditure increased marginally by ` 1,192 crore (6.7 per cent) over the previous year.
(Source: Finance Accounts for the respective years)
0%
10%
20%
30%
40%
50%
60%
70%
80%
90%
100%
2011-12 2012-13 2013-14 2014-15 2015-16
79.35 83.39 84.97 85.35 86.86
15.46 12.51 13.29 11.79 11.70
5.19 4.10 1.74 2.86 1.44
(Sha
re in
per
cen
t)Chart 1.9: Total Expenditure: Trends in Share of its Components
Revenue Expenditure Capital Expenditure Loans and Advances
27.65 27.58 28.11 28.30 28.69
36.05 37.6040.22
36.16 37.25
24.02 22.84 22.8326.07 26.01
7.09 7.88 7.10 6.61 6.615.19 4.10
1.74 2.86 1.44
0
5
10
15
20
25
30
35
40
45
2011-12 2012-13 2013-14 2014-15 2015-16
(Sha
re in
per
cen
t)
Chart 1.10: Total Expenditure: Trends by 'Activities'
General Services Social Services Economic Services Grants-in-aid Loans and Advances
Chapter I - Finances of the State Government
21
The expenditure on General Services, Social Services and Economic Services during 2015-16 was 28.69, 37.25 and 26.01 per cent of the total expenditure and grew by 9.01, 10.78 and 7.31 per cent respectively over the previous year.
The higher growth rate of expenditure on Social Services in 2015-16 was mainly on account of increased spending of ` 3,188.90 crore on Social Welfare and Nutrition, ` 864.46 crore on Health and Family Welfare and ` 771.88 crore on Education, Sports, Art and Culture which was partly offset by reduction in expenditure (` 766.24 crore) on Water Supply, Sanitation, Housing and Urban Development.
During 2011-16, while the ratio of expenditure on General Services and Economic Services to total expenditure remained more or less at the same levels, the expenditure on Social Services increased to 37.25 per cent of total expenditure during 2015-16, reversing the decline seen in 2014-15.
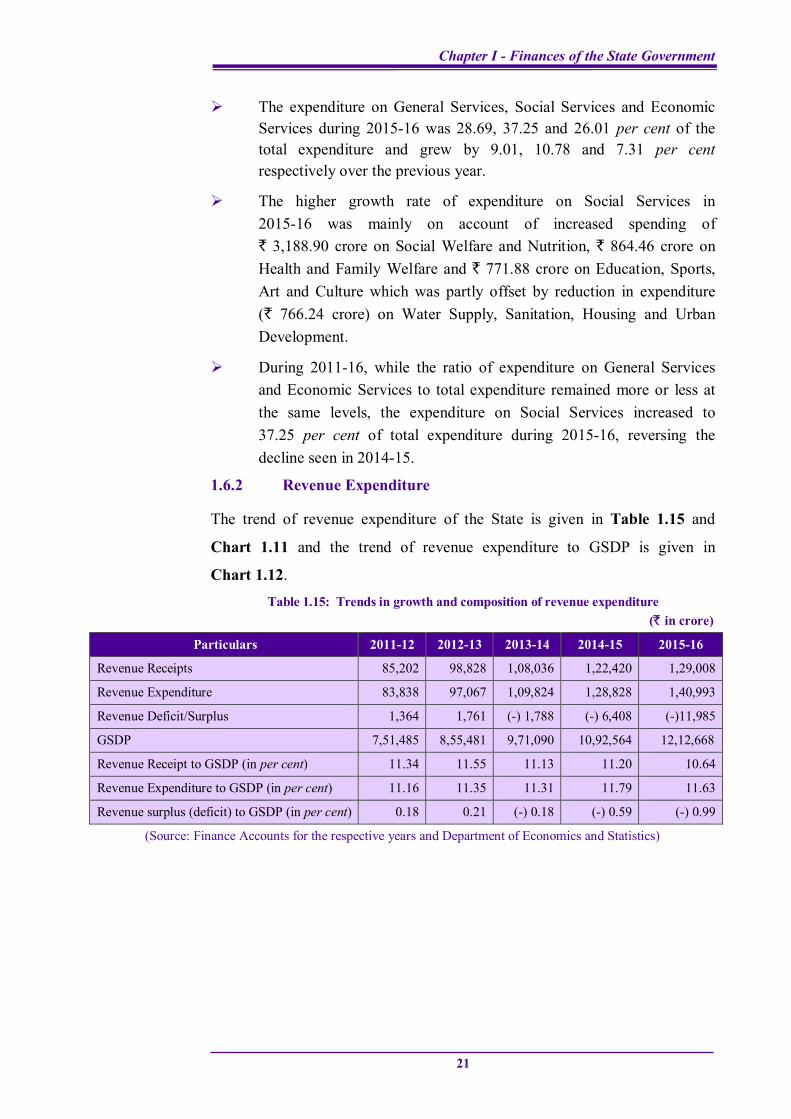
1.6.2 Revenue Expenditure
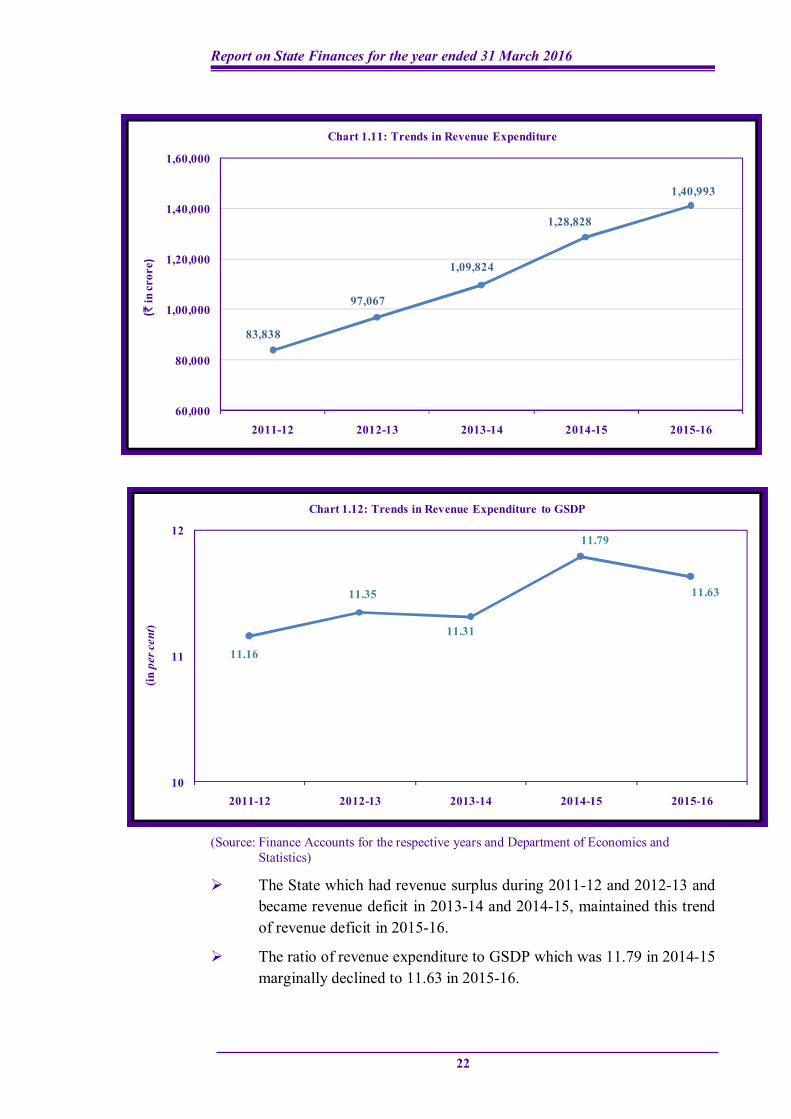
The trend of revenue expenditure of the State is given in Table 1.15 and
Chart 1.11 and the trend of revenue expenditure to GSDP is given in
Chart 1.12. Table 1.15: Trends in growth and composition of revenue expenditure
(` in crore)
Particulars 2011-12 2012-13 2013-14 2014-15 2015-16
Revenue Receipts 85,202 98,828 1,08,036 1,22,420 1,29,008
Revenue Expenditure 83,838 97,067 1,09,824 1,28,828 1,40,993
Revenue Deficit/Surplus 1,364 1,761 (-) 1,788 (-) 6,408 (-)11,985
GSDP 7,51,485 8,55,481 9,71,090 10,92,564 12,12,668
Revenue Receipt to GSDP (in per cent) 11.34 11.55 11.13 11.20 10.64
Revenue Expenditure to GSDP (in per cent) 11.16 11.35 11.31 11.79 11.63
Revenue surplus (deficit) to GSDP (in per cent) 0.18 0.21 (-) 0.18 (-) 0.59 (-) 0.99
(Source: Finance Accounts for the respective years and Department of Economics and Statistics)
Report on State Finances for the year ended 31 March 2016
22
(Source: Finance Accounts for the respective years and Department of Economics and Statistics)
The State which had revenue surplus during 2011-12 and 2012-13 and became revenue deficit in 2013-14 and 2014-15, maintained this trend of revenue deficit in 2015-16.
The ratio of revenue expenditure to GSDP which was 11.79 in 2014-15 marginally declined to 11.63 in 2015-16.
83,838
97,067
1,09,824
1,28,828
1,40,993
60,000
80,000
1,00,000
1,20,000
1,40,000
1,60,000
2011-12 2012-13 2013-14 2014-15 2015-16
(`in
cror
e)Chart 1.11: Trends in Revenue Expenditure
11.16
11.35
11.31
11.79
11.63
10
11
12
2011-12 2012-13 2013-14 2014-15 2015-16
(in p
er c
ent)
Chart 1.12: Trends in Revenue Expenditure to GSDP
Chapter I - Finances of the State Government
23
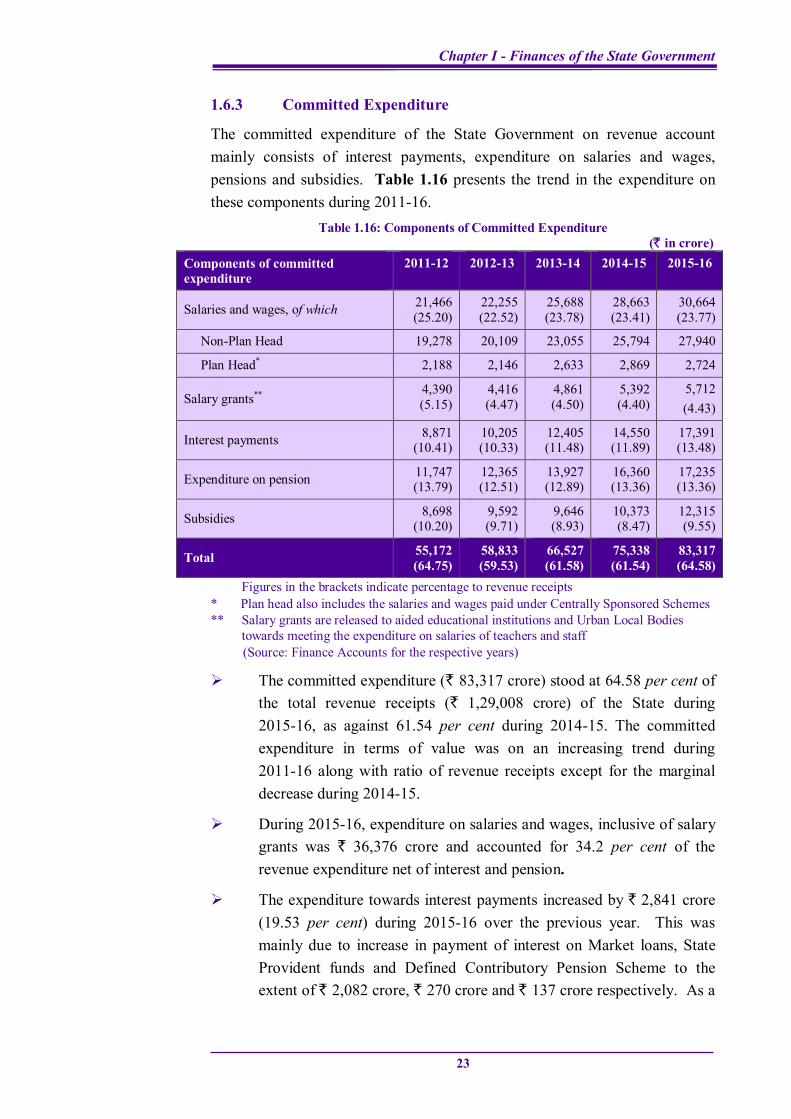
1.6.3 Committed Expenditure
The committed expenditure of the State Government on revenue account mainly consists of interest payments, expenditure on salaries and wages, pensions and subsidies. Table 1.16 presents the trend in the expenditure on these components during 2011-16.
Table 1.16: Components of Committed Expenditure (` in crore)
Components of committed expenditure
2011-12 2012-13 2013-14 2014-15 2015-16
Salaries and wages, of which 21,466 (25.20)
22,255 (22.52)
25,688 (23.78)
28,663 (23.41)
30,664 (23.77)
Non-Plan Head 19,278 20,109 23,055 25,794 27,940
Plan Head* 2,188 2,146 2,633 2,869 2,724
Salary grants** 4,390 (5.15)
4,416 (4.47)
4,861 (4.50)
5,392 (4.40)
5,712 (4.43)
Interest payments 8,871 (10.41)
10,205 (10.33)
12,405 (11.48)
14,550 (11.89)
17,391 (13.48)
Expenditure on pension 11,747 (13.79)
12,365 (12.51)
13,927 (12.89)
16,360 (13.36)
17,235 (13.36)
Subsidies 8,698 (10.20)
9,592 (9.71)
9,646 (8.93)
10,373 (8.47)
12,315 (9.55)
Total 55,172 (64.75)
58,833 (59.53)
66,527 (61.58)
75,338 (61.54)
83,317 (64.58)
Figures in the brackets indicate percentage to revenue receipts * Plan head also includes the salaries and wages paid under Centrally Sponsored Schemes ** Salary grants are released to aided educational institutions and Urban Local Bodies
towards meeting the expenditure on salaries of teachers and staff (Source: Finance Accounts for the respective years)
The committed expenditure (` 83,317 crore) stood at 64.58 per cent of the total revenue receipts (` 1,29,008 crore) of the State during 2015-16, as against 61.54 per cent during 2014-15. The committed expenditure in terms of value was on an increasing trend during 2011-16 along with ratio of revenue receipts except for the marginal decrease during 2014-15.
During 2015-16, expenditure on salaries and wages, inclusive of salary grants was ` 36,376 crore and accounted for 34.2 per cent of the revenue expenditure net of interest and pension.
The expenditure towards interest payments increased by ` 2,841 crore (19.53 per cent) during 2015-16 over the previous year. This was mainly due to increase in payment of interest on Market loans, State Provident funds and Defined Contributory Pension Scheme to the extent of ` 2,082 crore, ` 270 crore and ` 137 crore respectively. As a
Report on State Finances for the year ended 31 March 2016
24
percentage of non-plan revenue expenditure, it was on an increasing trend from 2012-13 and stood at 16.66 in 2015-16.
Subsidies
In a welfare State, it is not uncommon to provide subsidies/subventions to disadvantaged sections of the society. Subsidies are dispensed not only explicitly but also implicitly by providing subsidised public service to the people. Budgetary support to financial institutions, inadequate return on investments, poor recovery of user charges, assistance in cash/kind to individuals, etc., fall under the category of implicit subsidies7.
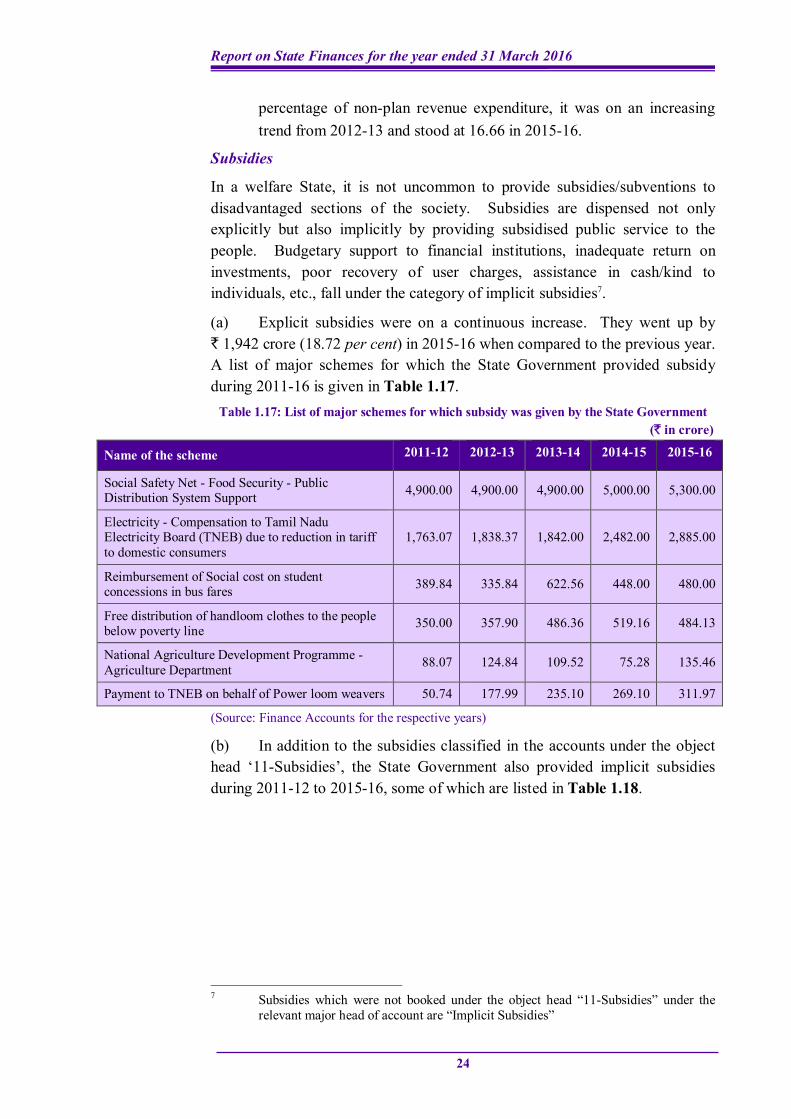
(a) Explicit subsidies were on a continuous increase. They went up by ` 1,942 crore (18.72 per cent) in 2015-16 when compared to the previous year. A list of major schemes for which the State Government provided subsidy during 2011-16 is given in Table 1.17.
Table 1.17: List of major schemes for which subsidy was given by the State Government (` in crore)
Name of the scheme 2011-12 2012-13 2013-14 2014-15 2015-16
Social Safety Net - Food Security - Public Distribution System Support 4,900.00 4,900.00 4,900.00 5,000.00 5,300.00
Electricity - Compensation to Tamil Nadu Electricity Board (TNEB) due to reduction in tariff to domestic consumers
1,763.07 1,838.37 1,842.00 2,482.00 2,885.00
Reimbursement of Social cost on student concessions in bus fares 389.84 335.84 622.56 448.00 480.00
Free distribution of handloom clothes to the people below poverty line 350.00 357.90 486.36 519.16 484.13
National Agriculture Development Programme - Agriculture Department 88.07 124.84 109.52 75.28 135.46
Payment to TNEB on behalf of Power loom weavers 50.74 177.99 235.10 269.10 311.97
(Source: Finance Accounts for the respective years)
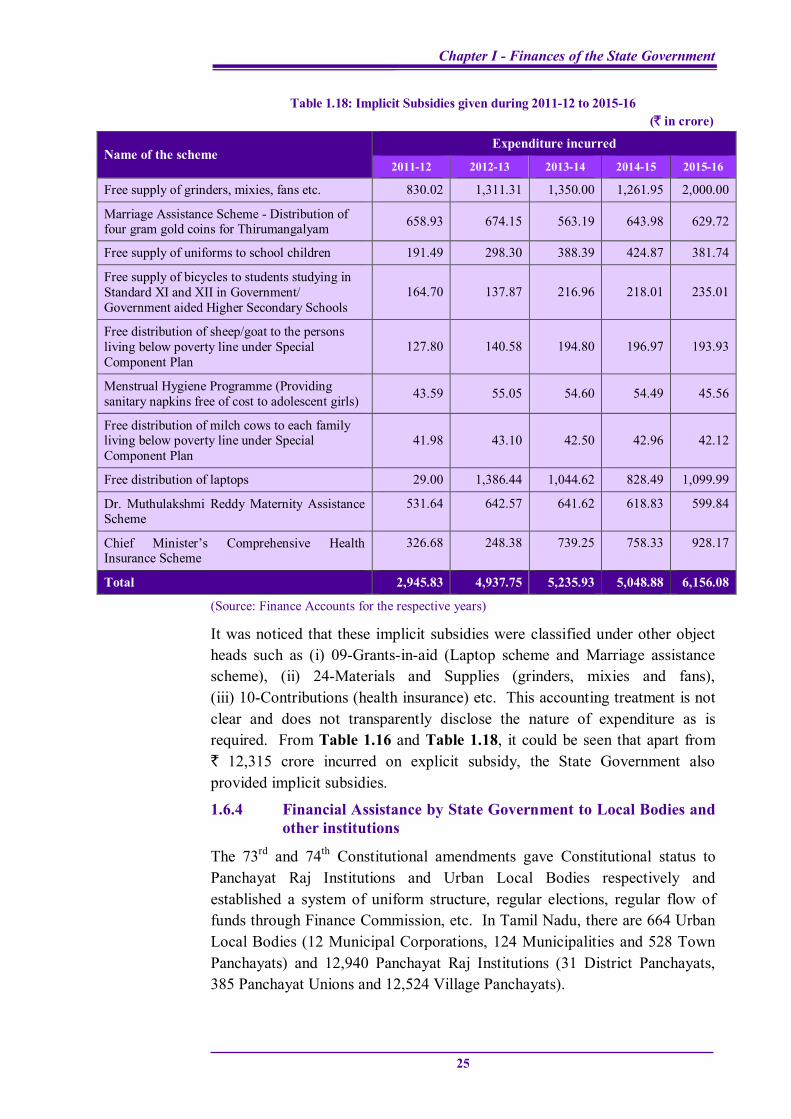
(b) In addition to the subsidies classified in the accounts under the object head ‘11-Subsidies’, the State Government also provided implicit subsidies during 2011-12 to 2015-16, some of which are listed in Table 1.18.
7 Subsidies which were not booked under the object head “11-Subsidies” under the
relevant major head of account are “Implicit Subsidies”
Chapter I - Finances of the State Government
25
Table 1.18: Implicit Subsidies given during 2011-12 to 2015-16 (` in crore)
Name of the scheme Expenditure incurred
2011-12 2012-13 2013-14 2014-15 2015-16
Free supply of grinders, mixies, fans etc. 830.02 1,311.31 1,350.00 1,261.95 2,000.00
Marriage Assistance Scheme - Distribution of four gram gold coins for Thirumangalyam 658.93 674.15 563.19 643.98 629.72
Free supply of uniforms to school children 191.49 298.30 388.39 424.87 381.74
Free supply of bicycles to students studying in Standard XI and XII in Government/ Government aided Higher Secondary Schools
164.70 137.87 216.96 218.01 235.01
Free distribution of sheep/goat to the persons living below poverty line under Special Component Plan
127.80 140.58 194.80 196.97 193.93
Menstrual Hygiene Programme (Providing sanitary napkins free of cost to adolescent girls) 43.59 55.05 54.60 54.49 45.56
Free distribution of milch cows to each family living below poverty line under Special Component Plan
41.98 43.10 42.50 42.96 42.12
Free distribution of laptops 29.00 1,386.44 1,044.62 828.49 1,099.99
Dr. Muthulakshmi Reddy Maternity Assistance Scheme
531.64 642.57 641.62 618.83 599.84
Chief Minister’s Comprehensive Health Insurance Scheme
326.68 248.38 739.25 758.33 928.17
Total 2,945.83 4,937.75 5,235.93 5,048.88 6,156.08
(Source: Finance Accounts for the respective years)
It was noticed that these implicit subsidies were classified under other object heads such as (i) 09-Grants-in-aid (Laptop scheme and Marriage assistance scheme), (ii) 24-Materials and Supplies (grinders, mixies and fans), (iii) 10-Contributions (health insurance) etc. This accounting treatment is not clear and does not transparently disclose the nature of expenditure as is required. From Table 1.16 and Table 1.18, it could be seen that apart from ` 12,315 crore incurred on explicit subsidy, the State Government also provided implicit subsidies.
1.6.4 Financial Assistance by State Government to Local Bodies and other institutions
The 73rd and 74th Constitutional amendments gave Constitutional status to Panchayat Raj Institutions and Urban Local Bodies respectively and established a system of uniform structure, regular elections, regular flow of funds through Finance Commission, etc. In Tamil Nadu, there are 664 Urban Local Bodies (12 Municipal Corporations, 124 Municipalities and 528 Town Panchayats) and 12,940 Panchayat Raj Institutions (31 District Panchayats, 385 Panchayat Unions and 12,524 Village Panchayats).
Report on State Finances for the year ended 31 March 2016
26
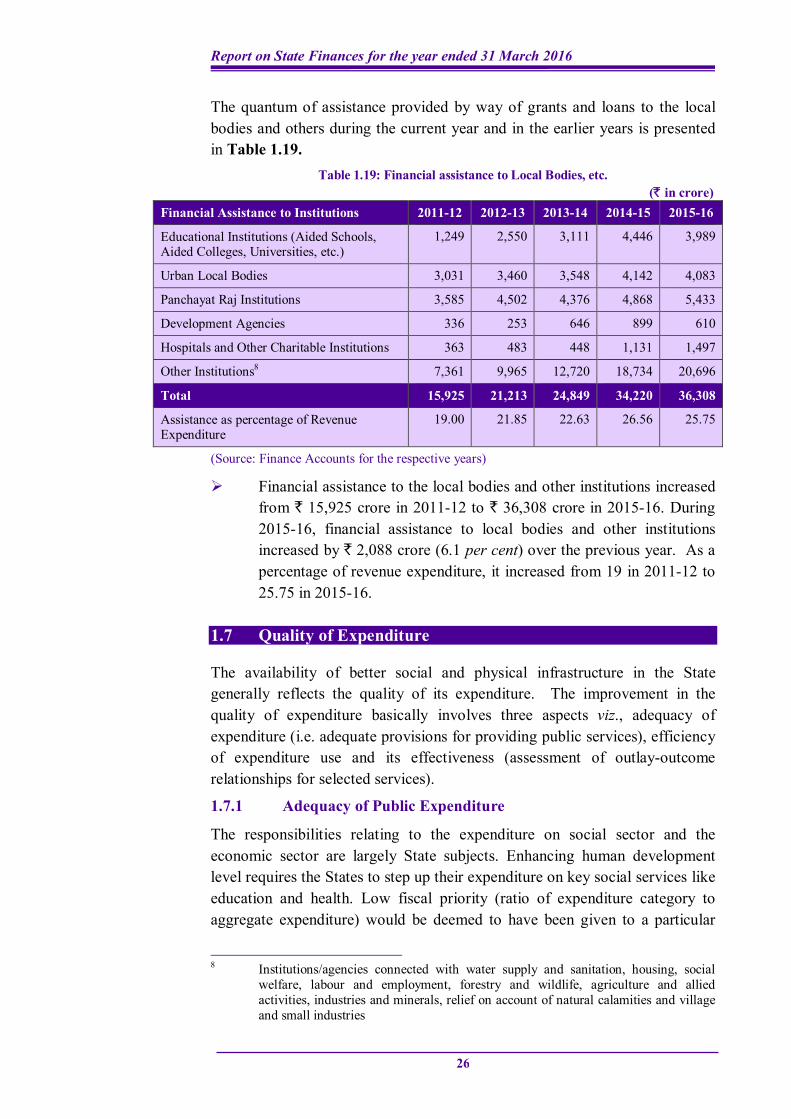
The quantum of assistance provided by way of grants and loans to the local bodies and others during the current year and in the earlier years is presented in Table 1.19.
Table 1.19: Financial assistance to Local Bodies, etc. (` in crore)
Financial Assistance to Institutions 2011-12 2012-13 2013-14 2014-15 2015-16
Educational Institutions (Aided Schools, Aided Colleges, Universities, etc.)
1,249 2,550 3,111 4,446 3,989
Urban Local Bodies 3,031 3,460 3,548 4,142 4,083
Panchayat Raj Institutions 3,585 4,502 4,376 4,868 5,433
Development Agencies 336 253 646 899 610
Hospitals and Other Charitable Institutions 363 483 448 1,131 1,497
Other Institutions8 7,361 9,965 12,720 18,734 20,696
Total 15,925 21,213 24,849 34,220 36,308
Assistance as percentage of Revenue Expenditure
19.00 21.85 22.63 26.56 25.75
(Source: Finance Accounts for the respective years)
Financial assistance to the local bodies and other institutions increased from ` 15,925 crore in 2011-12 to ` 36,308 crore in 2015-16. During 2015-16, financial assistance to local bodies and other institutions increased by ` 2,088 crore (6.1 per cent) over the previous year. As a percentage of revenue expenditure, it increased from 19 in 2011-12 to 25.75 in 2015-16.
1.7 Quality of Expenditure
The availability of better social and physical infrastructure in the State generally reflects the quality of its expenditure. The improvement in the quality of expenditure basically involves three aspects viz., adequacy of expenditure (i.e. adequate provisions for providing public services), efficiency of expenditure use and its effectiveness (assessment of outlay-outcome relationships for selected services).
1.7.1 Adequacy of Public Expenditure
The responsibilities relating to the expenditure on social sector and the economic sector are largely State subjects. Enhancing human development level requires the States to step up their expenditure on key social services like education and health. Low fiscal priority (ratio of expenditure category to aggregate expenditure) would be deemed to have been given to a particular
8 Institutions/agencies connected with water supply and sanitation, housing, social
welfare, labour and employment, forestry and wildlife, agriculture and allied activities, industries and minerals, relief on account of natural calamities and village and small industries
Chapter I - Finances of the State Government
27
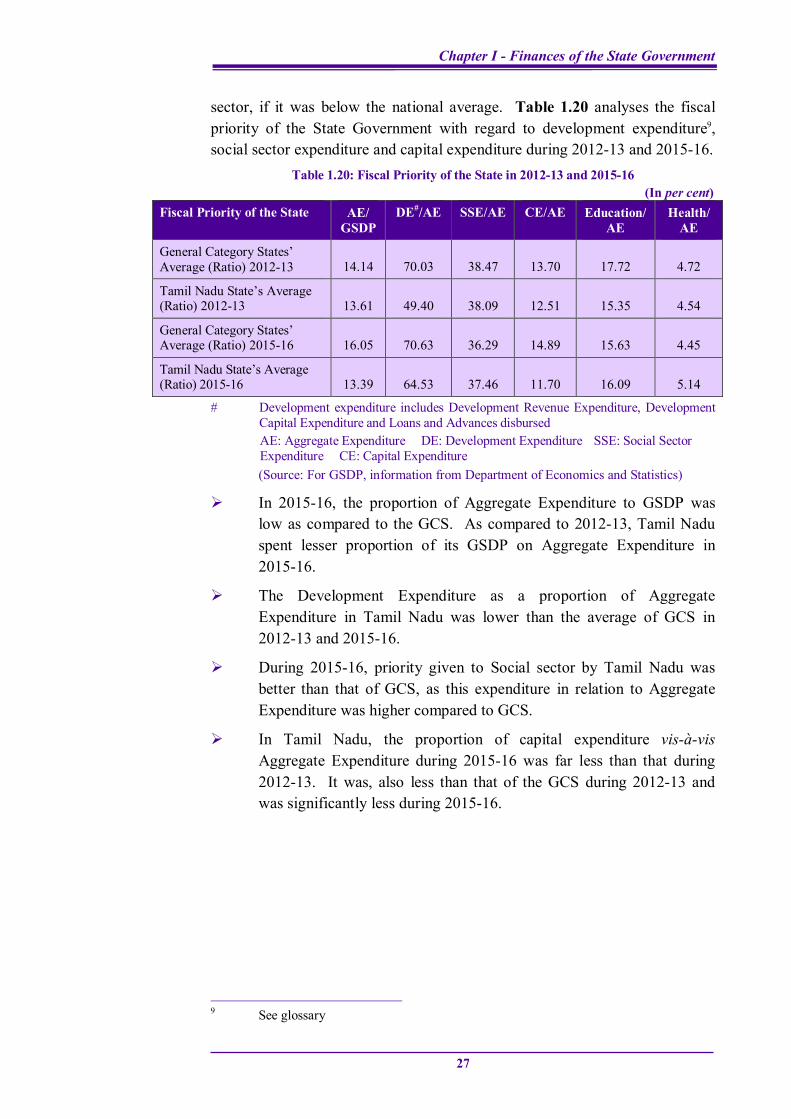
sector, if it was below the national average. Table 1.20 analyses the fiscal priority of the State Government with regard to development expenditure9, social sector expenditure and capital expenditure during 2012-13 and 2015-16.
Table 1.20: Fiscal Priority of the State in 2012-13 and 2015-16 (In per cent)
Fiscal Priority of the State AE/ GSDP
DE#/AE SSE/AE CE/AE Education/AE
Health/ AE
General Category States’ Average (Ratio) 2012-13 14.14 70.03 38.47 13.70 17.72 4.72
Tamil Nadu State’s Average (Ratio) 2012-13 13.61 49.40 38.09 12.51 15.35 4.54
General Category States’ Average (Ratio) 2015-16 16.05 70.63 36.29 14.89 15.63 4.45
Tamil Nadu State’s Average (Ratio) 2015-16 13.39 64.53 37.46 11.70 16.09 5.14
# Development expenditure includes Development Revenue Expenditure, Development Capital Expenditure and Loans and Advances disbursed AE: Aggregate Expenditure DE: Development Expenditure SSE: Social Sector Expenditure CE: Capital Expenditure (Source: For GSDP, information from Department of Economics and Statistics)
In 2015-16, the proportion of Aggregate Expenditure to GSDP was low as compared to the GCS. As compared to 2012-13, Tamil Nadu spent lesser proportion of its GSDP on Aggregate Expenditure in 2015-16.
The Development Expenditure as a proportion of Aggregate Expenditure in Tamil Nadu was lower than the average of GCS in 2012-13 and 2015-16.
During 2015-16, priority given to Social sector by Tamil Nadu was better than that of GCS, as this expenditure in relation to Aggregate Expenditure was higher compared to GCS.
In Tamil Nadu, the proportion of capital expenditure vis-à-vis Aggregate Expenditure during 2015-16 was far less than that during 2012-13. It was, also less than that of the GCS during 2012-13 and was significantly less during 2015-16.
9 See glossary
Report on State Finances for the year ended 31 March 2016
28
1.7.2 Efficiency of Expenditure Use
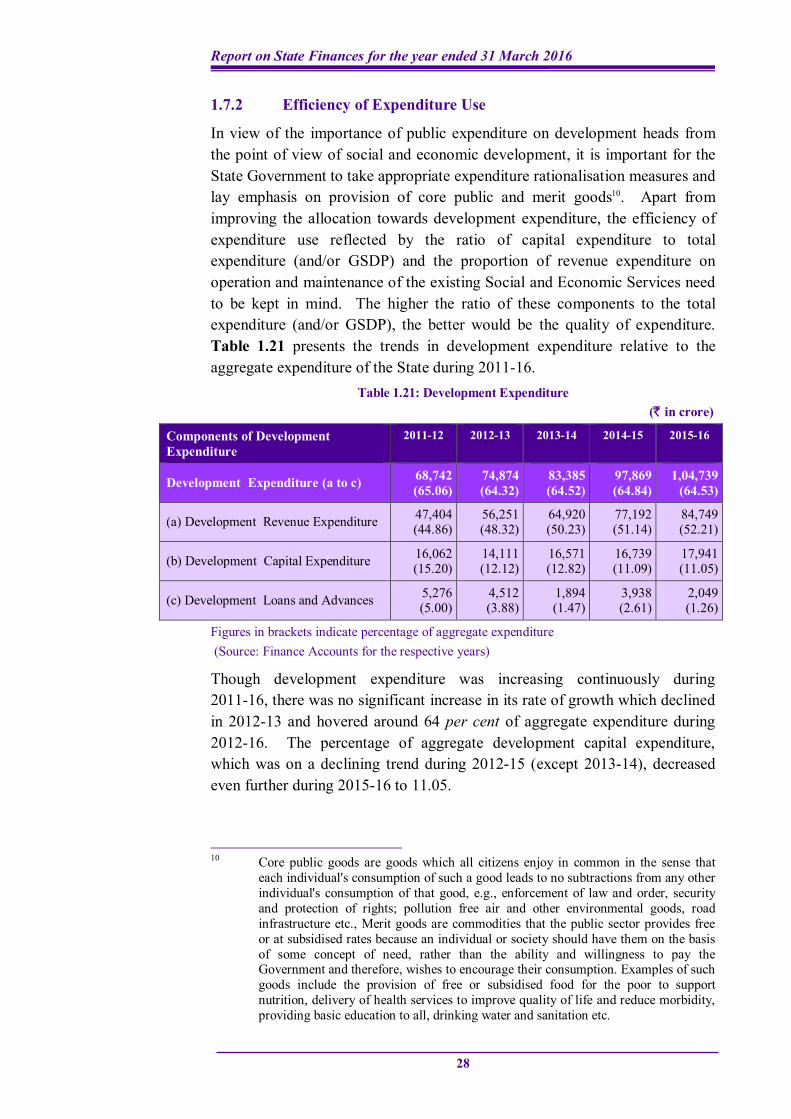
In view of the importance of public expenditure on development heads from the point of view of social and economic development, it is important for the State Government to take appropriate expenditure rationalisation measures and lay emphasis on provision of core public and merit goods10. Apart from improving the allocation towards development expenditure, the efficiency of expenditure use reflected by the ratio of capital expenditure to total expenditure (and/or GSDP) and the proportion of revenue expenditure on operation and maintenance of the existing Social and Economic Services need to be kept in mind. The higher the ratio of these components to the total expenditure (and/or GSDP), the better would be the quality of expenditure. Table 1.21 presents the trends in development expenditure relative to the aggregate expenditure of the State during 2011-16.
Table 1.21: Development Expenditure (` in crore)
Components of Development Expenditure
2011-12 2012-13 2013-14 2014-15 2015-16
Development Expenditure (a to c) 68,742 (65.06)
74,874 (64.32)
83,385 (64.52)
97,869 (64.84)
1,04,739 (64.53)
(a) Development Revenue Expenditure 47,404 (44.86)
56,251 (48.32)
64,920 (50.23)
77,192 (51.14)
84,749 (52.21)
(b) Development Capital Expenditure 16,062 (15.20)
14,111 (12.12)
16,571 (12.82)
16,739 (11.09)
17,941 (11.05)
(c) Development Loans and Advances 5,276 (5.00)
4,512 (3.88)
1,894 (1.47)
3,938 (2.61)
2,049 (1.26)
Figures in brackets indicate percentage of aggregate expenditure (Source: Finance Accounts for the respective years)
Though development expenditure was increasing continuously during 2011-16, there was no significant increase in its rate of growth which declined in 2012-13 and hovered around 64 per cent of aggregate expenditure during 2012-16. The percentage of aggregate development capital expenditure, which was on a declining trend during 2012-15 (except 2013-14), decreased even further during 2015-16 to 11.05.
10 Core public goods are goods which all citizens enjoy in common in the sense that
each individual's consumption of such a good leads to no subtractions from any other individual's consumption of that good, e.g., enforcement of law and order, security and protection of rights; pollution free air and other environmental goods, road infrastructure etc., Merit goods are commodities that the public sector provides free or at subsidised rates because an individual or society should have them on the basis of some concept of need, rather than the ability and willingness to pay the Government and therefore, wishes to encourage their consumption. Examples of such goods include the provision of free or subsidised food for the poor to support nutrition, delivery of health services to improve quality of life and reduce morbidity, providing basic education to all, drinking water and sanitation etc.
Chapter I - Finances of the State Government
29
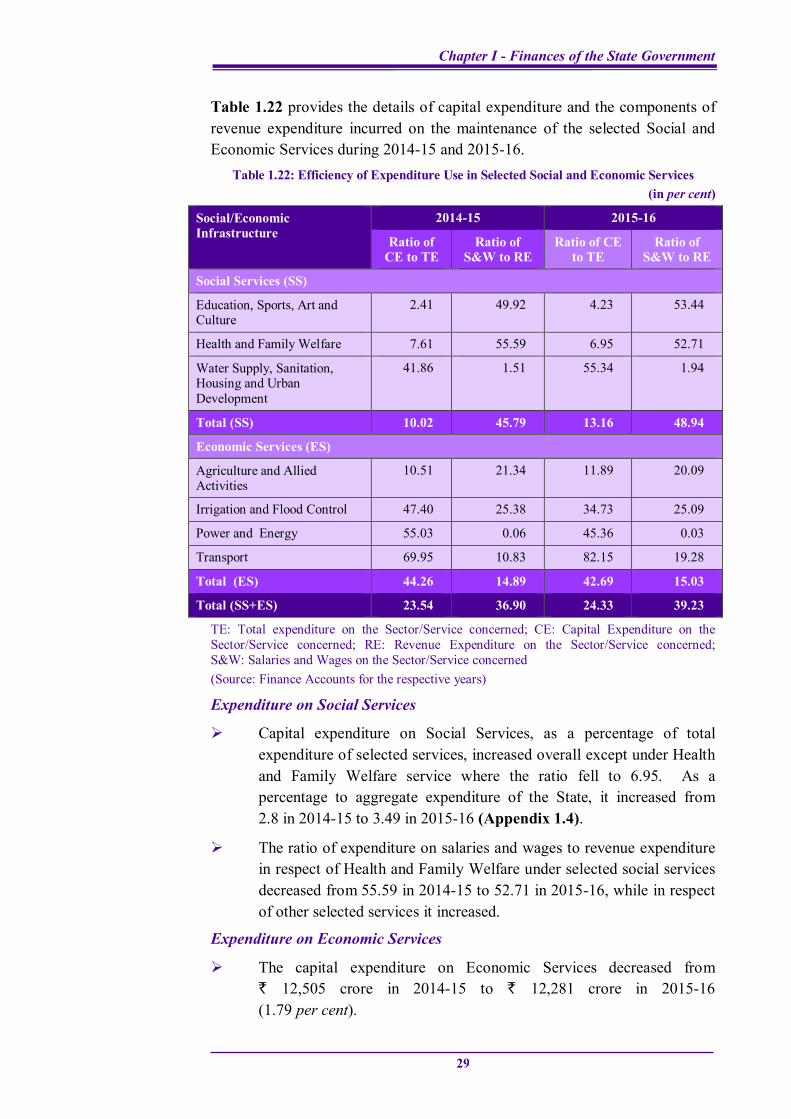
Table 1.22 provides the details of capital expenditure and the components of revenue expenditure incurred on the maintenance of the selected Social and Economic Services during 2014-15 and 2015-16.
Table 1.22: Efficiency of Expenditure Use in Selected Social and Economic Services (in per cent)
Social/Economic Infrastructure
2014-15 2015-16
Ratio of CE to TE
Ratio of S&W to RE
Ratio of CE to TE
Ratio of S&W to RE
Social Services (SS)
Education, Sports, Art and Culture
2.41 49.92 4.23 53.44
Health and Family Welfare 7.61 55.59 6.95 52.71
Water Supply, Sanitation, Housing and Urban Development
41.86 1.51 55.34 1.94
Total (SS) 10.02 45.79 13.16 48.94
Economic Services (ES)
Agriculture and Allied Activities
10.51 21.34 11.89 20.09
Irrigation and Flood Control 47.40 25.38 34.73 25.09
Power and Energy 55.03 0.06 45.36 0.03
Transport 69.95 10.83 82.15 19.28
Total (ES) 44.26 14.89 42.69 15.03
Total (SS+ES) 23.54 36.90 24.33 39.23
TE: Total expenditure on the Sector/Service concerned; CE: Capital Expenditure on the Sector/Service concerned; RE: Revenue Expenditure on the Sector/Service concerned; S&W: Salaries and Wages on the Sector/Service concerned (Source: Finance Accounts for the respective years)
Expenditure on Social Services
Capital expenditure on Social Services, as a percentage of total expenditure of selected services, increased overall except under Health and Family Welfare service where the ratio fell to 6.95. As a percentage to aggregate expenditure of the State, it increased from 2.8 in 2014-15 to 3.49 in 2015-16 (Appendix 1.4).
The ratio of expenditure on salaries and wages to revenue expenditure in respect of Health and Family Welfare under selected social services decreased from 55.59 in 2014-15 to 52.71 in 2015-16, while in respect of other selected services it increased.
Expenditure on Economic Services
The capital expenditure on Economic Services decreased from ` 12,505 crore in 2014-15 to ` 12,281 crore in 2015-16 (1.79 per cent).
Report on State Finances for the year ended 31 March 2016
30
There was only a marginal variation in the ratio of expenditure on salaries and wages to revenue expenditure under selected economic services except transport where it increased from 10.83 in 2014-15 to 19.28 in 2015-16.
1.8 Financial Analysis of Government Expenditure and Investments
In the post-Fiscal Responsibility and Budget Management framework, the State is expected to keep its fiscal deficit (and borrowings) at low levels without compromising its capital expenditure/investment (including loans and advances) requirements. In addition, in a transition to dependence on market-based resources, the State Government needs to initiate measures to earn adequate return on its investments, recover its cost of borrowed funds rather than bearing the same on its budget in the form of implicit subsidies and take requisite steps to infuse transparency in financial operations. This section presents a broad financial analysis of investments and other capital expenditure undertaken by the Government during the current year vis-à-vis the previous years.
1.8.1 Financial Results of Irrigation projects
Ensuring the commercial viability of irrigation projects through realisation of adequate revenue by way of user charges would be prudent on the part of Government. However, it was observed that the revenue from irrigation projects (` 42.16 crore) during 2015-16 was only 3.33 per cent of the maintenance expenditure (` 1,264.27 crore).
The financial results of five major and 47 medium irrigation projects are depicted in Appendix VIII of the Finance Accounts. The revenue realised from these projects during 2015-16 was ` 14.24 crore. After meeting the working and maintenance expenditure (` 326.54 crore) and interest charges (` 122.34 crore), these 52 projects suffered a net loss of ` 434.64 crore during 2015-16.
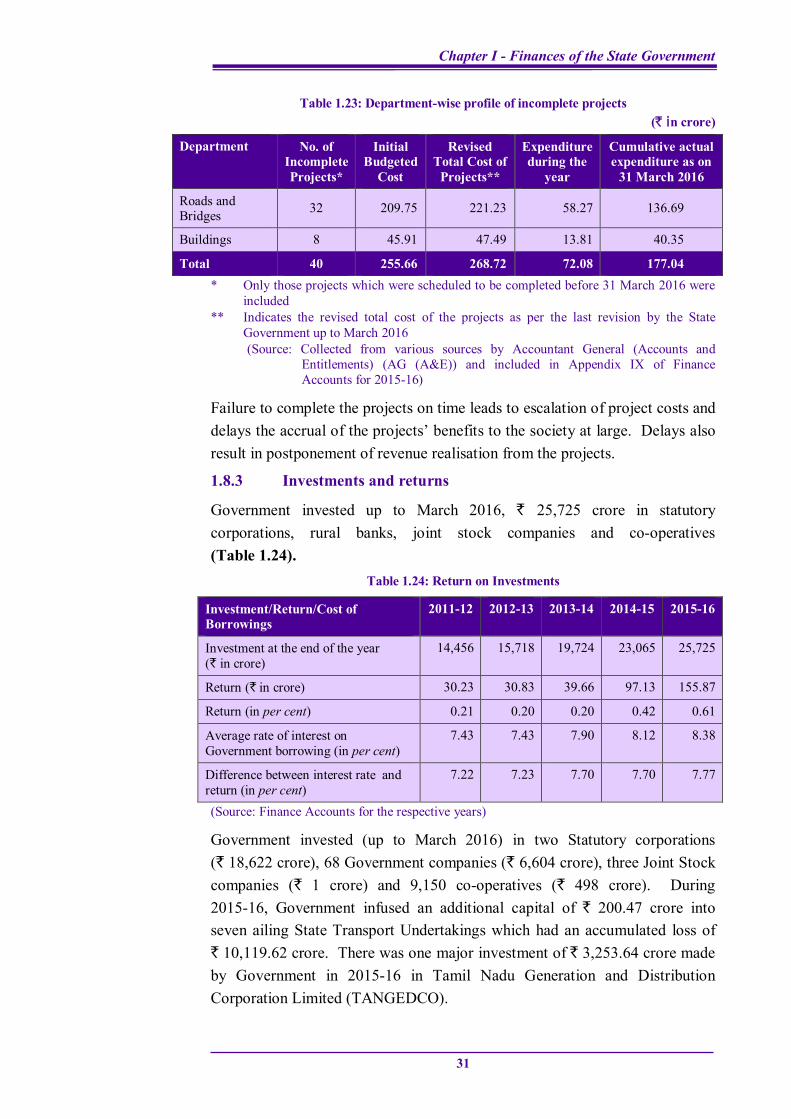
1.8.2 Incomplete projects
The department-wise information pertaining to incomplete projects as on 31 March 2016 is given in Table 1.23.
Chapter I - Finances of the State Government
31
Table 1.23: Department-wise profile of incomplete projects (` in crore)
Department No. of Incomplete Projects*
Initial Budgeted
Cost
Revised Total Cost of
Projects**
Expenditure during the
year
Cumulative actual expenditure as on
31 March 2016
Roads and Bridges 32 209.75 221.23 58.27 136.69
Buildings 8 45.91 47.49 13.81 40.35
Total 40 255.66 268.72 72.08 177.04 * Only those projects which were scheduled to be completed before 31 March 2016 were
included ** Indicates the revised total cost of the projects as per the last revision by the State
Government up to March 2016 (Source: Collected from various sources by Accountant General (Accounts and
Entitlements) (AG (A&E)) and included in Appendix IX of Finance Accounts for 2015-16)
Failure to complete the projects on time leads to escalation of project costs and delays the accrual of the projects’ benefits to the society at large. Delays also result in postponement of revenue realisation from the projects.
1.8.3 Investments and returns
Government invested up to March 2016, ` 25,725 crore in statutory corporations, rural banks, joint stock companies and co-operatives (Table 1.24).
Table 1.24: Return on Investments
Investment/Return/Cost of Borrowings
2011-12 2012-13 2013-14 2014-15 2015-16
Investment at the end of the year (` in crore)
14,456 15,718 19,724 23,065 25,725
Return (` in crore) 30.23 30.83 39.66 97.13 155.87
Return (in per cent) 0.21 0.20 0.20 0.42 0.61
Average rate of interest on Government borrowing (in per cent)
7.43 7.43 7.90 8.12 8.38
Difference between interest rate and return (in per cent)
7.22 7.23 7.70 7.70 7.77
(Source: Finance Accounts for the respective years)
Government invested (up to March 2016) in two Statutory corporations (` 18,622 crore), 68 Government companies (` 6,604 crore), three Joint Stock companies (` 1 crore) and 9,150 co-operatives (` 498 crore). During 2015-16, Government infused an additional capital of ` 200.47 crore into seven ailing State Transport Undertakings which had an accumulated loss of ` 10,119.62 crore. There was one major investment of ` 3,253.64 crore made by Government in 2015-16 in Tamil Nadu Generation and Distribution Corporation Limited (TANGEDCO).
Report on State Finances for the year ended 31 March 2016
32
Though the average rate of return increased from 0.21 per cent in 2011-12 to 0.61 per cent in 2015-16, the return on investment during 2011-16 was meagre. On the other hand, Government paid interest at an average rate of 8.38 per cent on its borrowings during 2015-16.
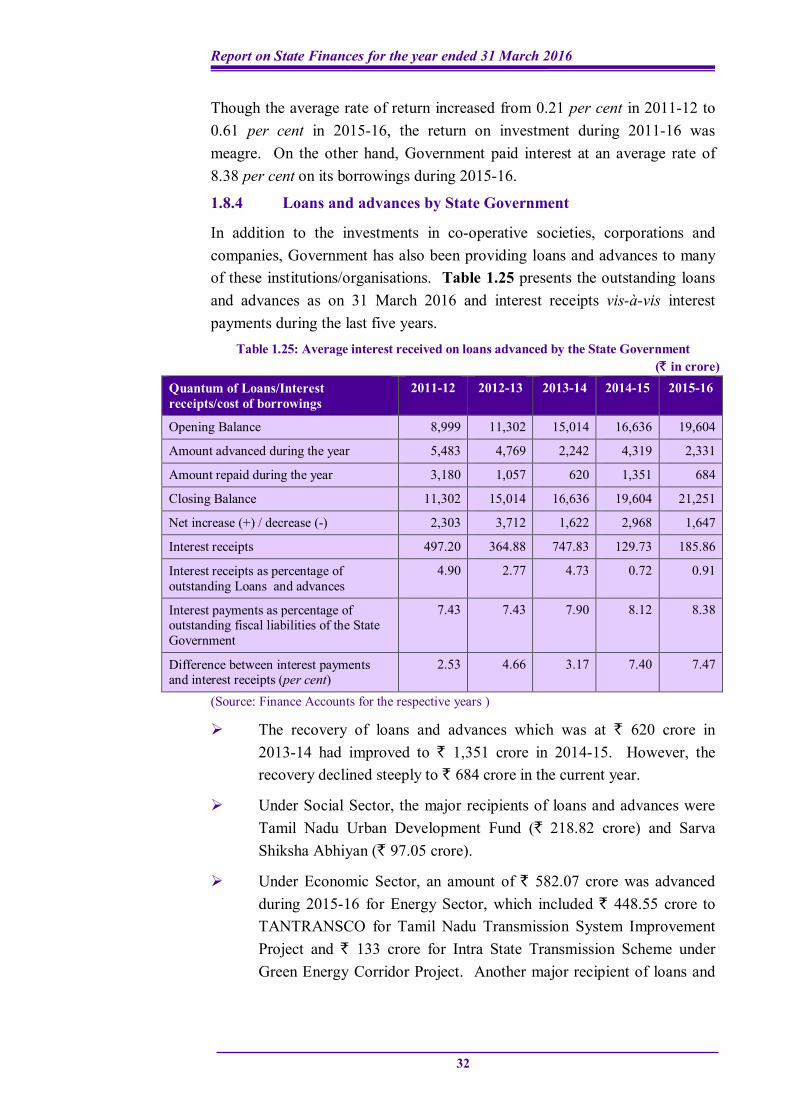
1.8.4 Loans and advances by State Government
In addition to the investments in co-operative societies, corporations and companies, Government has also been providing loans and advances to many of these institutions/organisations. Table 1.25 presents the outstanding loans and advances as on 31 March 2016 and interest receipts vis-à-vis interest payments during the last five years.
Table 1.25: Average interest received on loans advanced by the State Government (` in crore)
Quantum of Loans/Interest receipts/cost of borrowings
2011-12 2012-13 2013-14 2014-15 2015-16
Opening Balance 8,999 11,302 15,014 16,636 19,604
Amount advanced during the year 5,483 4,769 2,242 4,319 2,331
Amount repaid during the year 3,180 1,057 620 1,351 684
Closing Balance 11,302 15,014 16,636 19,604 21,251
Net increase (+) / decrease (-) 2,303 3,712 1,622 2,968 1,647
Interest receipts 497.20 364.88 747.83 129.73 185.86
Interest receipts as percentage of outstanding Loans and advances
4.90 2.77 4.73 0.72 0.91
Interest payments as percentage of outstanding fiscal liabilities of the State Government
7.43 7.43 7.90 8.12 8.38
Difference between interest payments and interest receipts (per cent)
2.53 4.66 3.17 7.40 7.47
(Source: Finance Accounts for the respective years )
The recovery of loans and advances which was at ` 620 crore in 2013-14 had improved to ` 1,351 crore in 2014-15. However, the recovery declined steeply to ` 684 crore in the current year.
Under Social Sector, the major recipients of loans and advances were Tamil Nadu Urban Development Fund (` 218.82 crore) and Sarva Shiksha Abhiyan (` 97.05 crore).
Under Economic Sector, an amount of ` 582.07 crore was advanced during 2015-16 for Energy Sector, which included ` 448.55 crore to TANTRANSCO for Tamil Nadu Transmission System Improvement Project and ` 133 crore for Intra State Transmission Scheme under Green Energy Corridor Project. Another major recipient of loans and
Chapter I - Finances of the State Government
33
advances under this sector was State Transport Undertakings (` 601 crore).
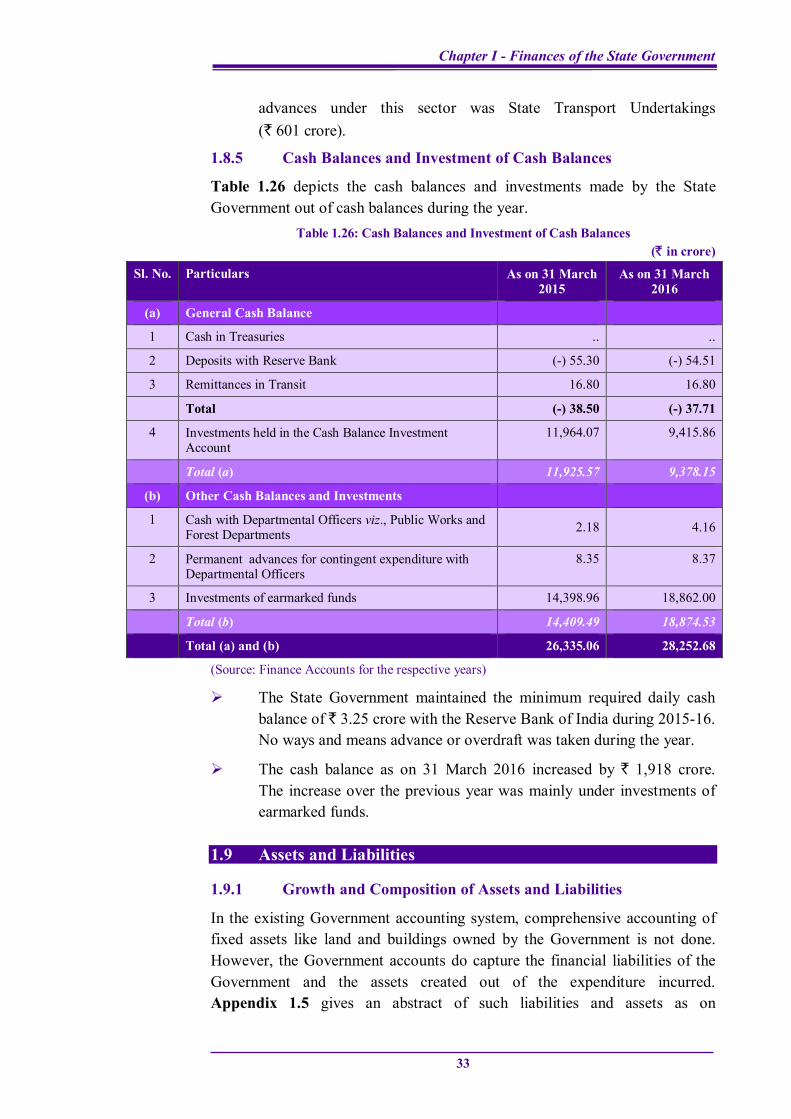
1.8.5 Cash Balances and Investment of Cash Balances
Table 1.26 depicts the cash balances and investments made by the State Government out of cash balances during the year.
Table 1.26: Cash Balances and Investment of Cash Balances (` in crore)
Sl. No. Particulars As on 31 March 2015
As on 31 March 2016
(a) General Cash Balance
1 Cash in Treasuries .. ..
2 Deposits with Reserve Bank (-) 55.30 (-) 54.51
3 Remittances in Transit 16.80 16.80
Total (-) 38.50 (-) 37.71
4 Investments held in the Cash Balance Investment Account
11,964.07 9,415.86
Total (a) 11,925.57 9,378.15
(b) Other Cash Balances and Investments
1 Cash with Departmental Officers viz., Public Works and Forest Departments 2.18 4.16
2 Permanent advances for contingent expenditure with Departmental Officers
8.35 8.37
3 Investments of earmarked funds 14,398.96 18,862.00
Total (b) 14,409.49 18,874.53
Total (a) and (b) 26,335.06 28,252.68
(Source: Finance Accounts for the respective years)
The State Government maintained the minimum required daily cash balance of ` 3.25 crore with the Reserve Bank of India during 2015-16. No ways and means advance or overdraft was taken during the year.
The cash balance as on 31 March 2016 increased by ` 1,918 crore. The increase over the previous year was mainly under investments of earmarked funds.
1.9 Assets and Liabilities
1.9.1 Growth and Composition of Assets and Liabilities
In the existing Government accounting system, comprehensive accounting of fixed assets like land and buildings owned by the Government is not done. However, the Government accounts do capture the financial liabilities of the Government and the assets created out of the expenditure incurred. Appendix 1.5 gives an abstract of such liabilities and assets as on
Report on State Finances for the year ended 31 March 2016
34
31 March 2016, compared with the corresponding position on 31 March 2015. While the liabilities consist mainly of internal borrowings, loans and advances from GoI, receipts from the Public Account and Reserve funds, the assets comprise mainly the capital outlay, loans and advances given by the State Government and cash balances.
The TNFR Act defines the total liability of the State as ‘the liabilities under the Consolidated Fund of the State and the Public Account of the State’, which include loans and advances from the Central Government, open market borrowings, loans from financial institutions, Provident Fund balances of Government employees, Reserve funds, Deposits etc.
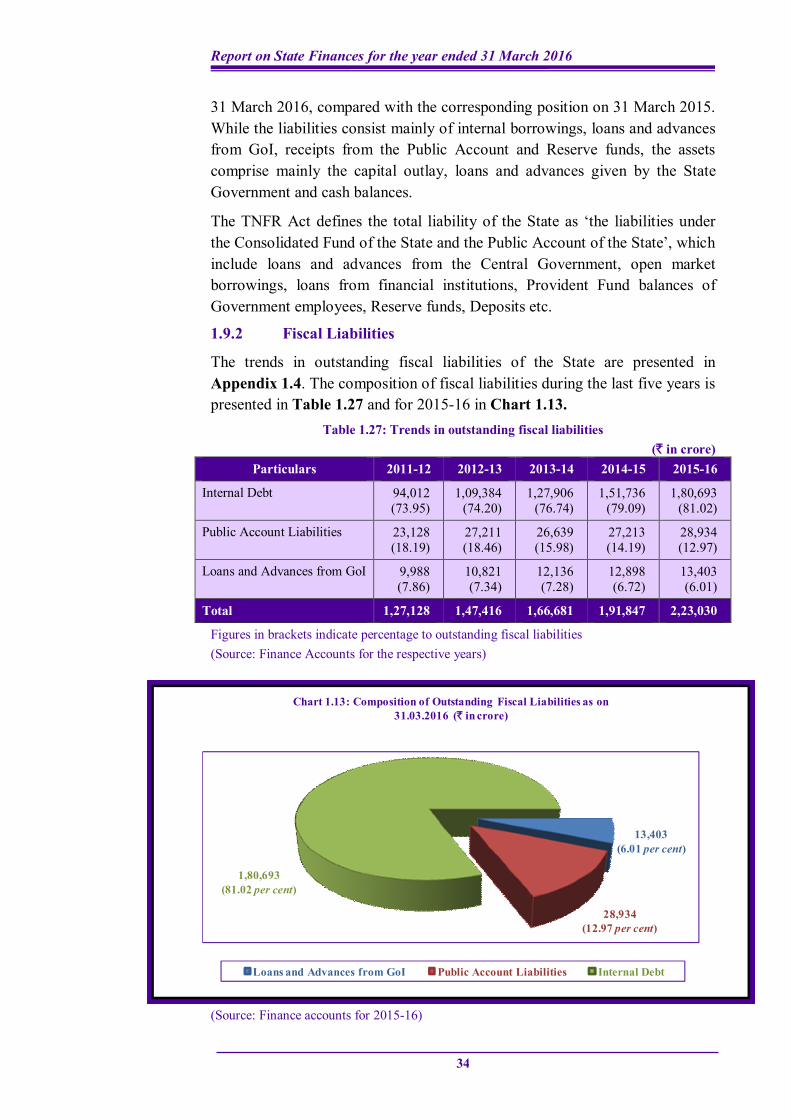
1.9.2 Fiscal Liabilities
The trends in outstanding fiscal liabilities of the State are presented in Appendix 1.4. The composition of fiscal liabilities during the last five years is presented in Table 1.27 and for 2015-16 in Chart 1.13.
Table 1.27: Trends in outstanding fiscal liabilities (` in crore)
Particulars 2011-12 2012-13 2013-14 2014-15 2015-16
Internal Debt 94,012 (73.95)
1,09,384 (74.20)
1,27,906 (76.74)
1,51,736 (79.09)
1,80,693 (81.02)
Public Account Liabilities 23,128 (18.19)
27,211 (18.46)
26,639 (15.98)
27,213 (14.19)
28,934 (12.97)
Loans and Advances from GoI 9,988 (7.86)
10,821 (7.34)
12,136 (7.28)
12,898 (6.72)
13,403 (6.01)
Total 1,27,128 1,47,416 1,66,681 1,91,847 2,23,030
Figures in brackets indicate percentage to outstanding fiscal liabilities (Source: Finance Accounts for the respective years)
(Source: Finance accounts for 2015-16)
13,403(6.01 per cent)
28,934(12.97 per cent)
1,80,693(81.02 per cent)
Chart 1.13: Composition of Outstanding Fiscal Liabilities as on 31.03.2016 (` in crore)
Loans and Advances from GoI Public Account Liabilities Internal Debt
Chapter I - Finances of the State Government
35
The share of internal debt, which constitutes a major component of outstanding fiscal liabilities has progressively increased both in value and as a percentage of outstanding fiscal liabilities i.e. from ` 94,012 crore (73.95 per cent) in 2011-12 to ` 1,80,693 crore (81.02 per cent) in 2015-16. In contrast, the share of Public Account Liabilities has been on a declining trend from 2012-13 and the share of Loans and Advances from GoI have been steadily declining from 2011-12.
The outstanding fiscal liabilities had increased from ` 1,91,847 crore at the end of 2014-15 to ` 2,23,030 crore at the end of 2015-16.
The fiscal liabilities at the end of 2015-16 represented 172.88 per cent of the revenue receipts during the year as against 156.71 per cent of the revenue receipts during 2014-15. However, the outstanding liabilities as a percentage of GSDP was 18.39, which was within the norm of 20.78 per cent prescribed for the year 2015-16 as per FFC.
Public Account liabilities as a percentage of the total fiscal liabilities decreased from 14.19 in 2014-15 to 12.97 in 2015-16. Internal debt at 81.02 per cent of the fiscal liabilities was higher than that of the previous year (79.09 per cent), whereas the percentage of outstanding loans and advances decreased from 6.72 in 2014-15 to 6.01 in 2015-16.
1.9.3 Transactions under Reserve Fund
There were 27 Reserve Funds earmarked for specific purposes, out of which five funds were inoperative for one year to ten years, two new funds had been opened and two Funds had been closed during this year. The total accumulated balance as on 31 March 2016 under Reserve Funds was ` 6,597.52 crore (` 6,394.10 crore in active funds and ` 203.42 crore in inoperative funds) out of which ` 5,294 crore (80.24 per cent) was invested. The balances (` 3.89 crore) of two Fund Accounts viz, (i) Rehabilitation Fund for prohibition offenders (` 0.66 crore) and (ii) State Agricultural Credit Relief and Guarantee Fund (` 3.23 crore) closed during 2015-16 have been brought to 8680-Miscellaneous Government Accounts as receipts.
There was also short transfer of ` 123.25 crore, which resulted in under-statement of Revenue and Fiscal Deficits to that extent. The short transfer which stood at ` 8.12 crore at the end of 2014-15 was revised as ` 26.73 crore due to inclusion of a fund (` 18.61 crore). This indicated that there was no system in place to reconcile figures with the Office of the AG (A&E). During Exit Conference (October 2016), the State Government assured that the balance short transfer would be remitted and a system would be put in place so that short transfers would be minimised in the coming years.
Report on State Finances for the year ended 31 March 2016
36
1.9.4 Contingent liabilities
Status of Guarantees
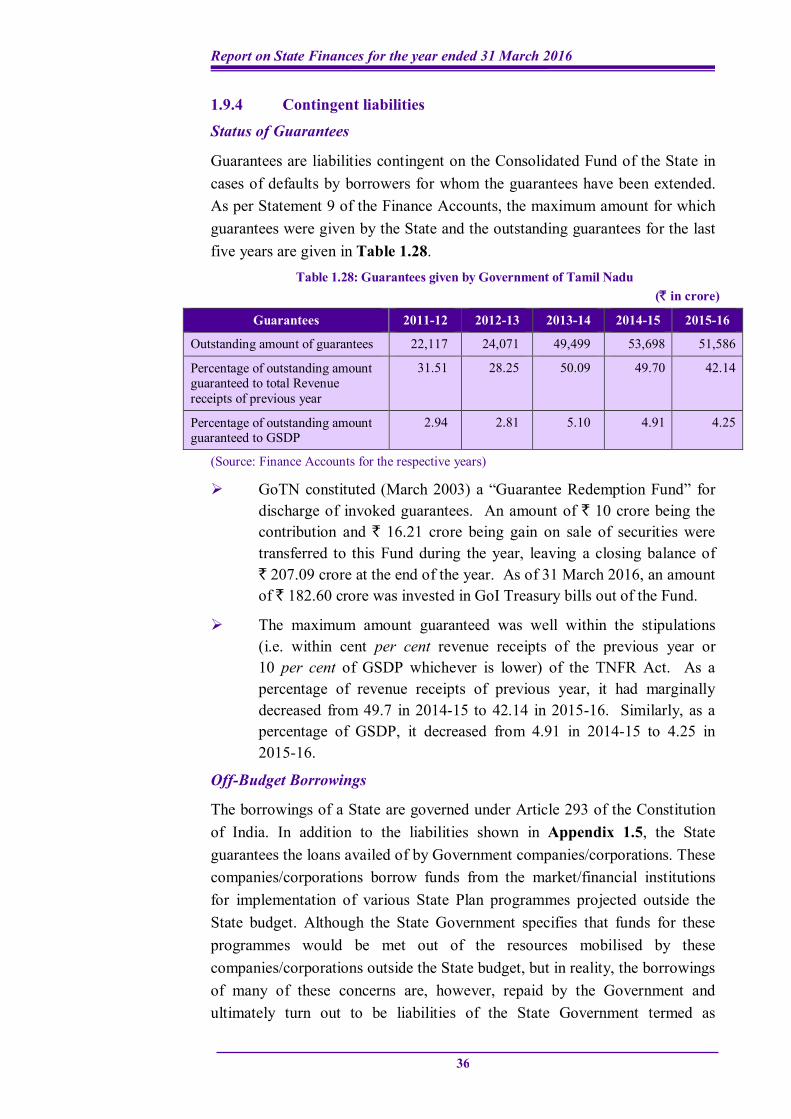
Guarantees are liabilities contingent on the Consolidated Fund of the State in cases of defaults by borrowers for whom the guarantees have been extended. As per Statement 9 of the Finance Accounts, the maximum amount for which guarantees were given by the State and the outstanding guarantees for the last five years are given in Table 1.28.
Table 1.28: Guarantees given by Government of Tamil Nadu (` in crore)
Guarantees 2011-12 2012-13 2013-14 2014-15 2015-16
Outstanding amount of guarantees 22,117 24,071 49,499 53,698 51,586
Percentage of outstanding amount guaranteed to total Revenue receipts of previous year
31.51 28.25 50.09 49.70 42.14
Percentage of outstanding amount guaranteed to GSDP
2.94 2.81 5.10 4.91 4.25
(Source: Finance Accounts for the respective years)
GoTN constituted (March 2003) a “Guarantee Redemption Fund” for discharge of invoked guarantees. An amount of ` 10 crore being the contribution and ` 16.21 crore being gain on sale of securities were transferred to this Fund during the year, leaving a closing balance of ` 207.09 crore at the end of the year. As of 31 March 2016, an amount of ` 182.60 crore was invested in GoI Treasury bills out of the Fund.
The maximum amount guaranteed was well within the stipulations (i.e. within cent per cent revenue receipts of the previous year or 10 per cent of GSDP whichever is lower) of the TNFR Act. As a percentage of revenue receipts of previous year, it had marginally decreased from 49.7 in 2014-15 to 42.14 in 2015-16. Similarly, as a percentage of GSDP, it decreased from 4.91 in 2014-15 to 4.25 in 2015-16.
Off-Budget Borrowings
The borrowings of a State are governed under Article 293 of the Constitution of India. In addition to the liabilities shown in Appendix 1.5, the State guarantees the loans availed of by Government companies/corporations. These companies/corporations borrow funds from the market/financial institutions for implementation of various State Plan programmes projected outside the State budget. Although the State Government specifies that funds for these programmes would be met out of the resources mobilised by these companies/corporations outside the State budget, but in reality, the borrowings of many of these concerns are, however, repaid by the Government and ultimately turn out to be liabilities of the State Government termed as
Chapter I - Finances of the State Government
37
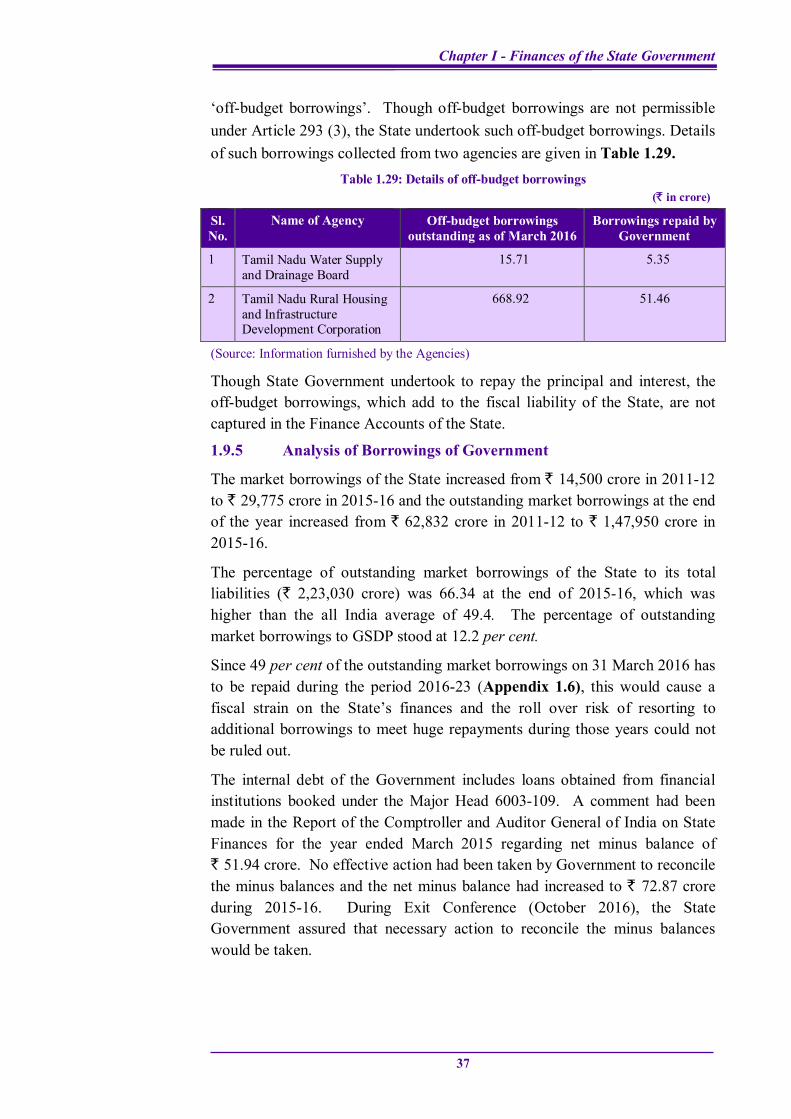
‘off-budget borrowings’. Though off-budget borrowings are not permissible under Article 293 (3), the State undertook such off-budget borrowings. Details of such borrowings collected from two agencies are given in Table 1.29.
Table 1.29: Details of off-budget borrowings (` in crore)
Sl. No.
Name of Agency Off-budget borrowings outstanding as of March 2016
Borrowings repaid by Government
1 Tamil Nadu Water Supply and Drainage Board
15.71 5.35
2 Tamil Nadu Rural Housing and Infrastructure Development Corporation
668.92 51.46
(Source: Information furnished by the Agencies)
Though State Government undertook to repay the principal and interest, the off-budget borrowings, which add to the fiscal liability of the State, are not captured in the Finance Accounts of the State.
1.9.5 Analysis of Borrowings of Government
The market borrowings of the State increased from ` 14,500 crore in 2011-12 to ` 29,775 crore in 2015-16 and the outstanding market borrowings at the end of the year increased from ` 62,832 crore in 2011-12 to ` 1,47,950 crore in 2015-16.
The percentage of outstanding market borrowings of the State to its total liabilities (` 2,23,030 crore) was 66.34 at the end of 2015-16, which was higher than the all India average of 49.4. The percentage of outstanding market borrowings to GSDP stood at 12.2 per cent.
Since 49 per cent of the outstanding market borrowings on 31 March 2016 has to be repaid during the period 2016-23 (Appendix 1.6), this would cause a fiscal strain on the State’s finances and the roll over risk of resorting to additional borrowings to meet huge repayments during those years could not be ruled out.
The internal debt of the Government includes loans obtained from financial institutions booked under the Major Head 6003-109. A comment had been made in the Report of the Comptroller and Auditor General of India on State Finances for the year ended March 2015 regarding net minus balance of ` 51.94 crore. No effective action had been taken by Government to reconcile the minus balances and the net minus balance had increased to ` 72.87 crore during 2015-16. During Exit Conference (October 2016), the State Government assured that necessary action to reconcile the minus balances would be taken.
Report on State Finances for the year ended 31 March 2016
38
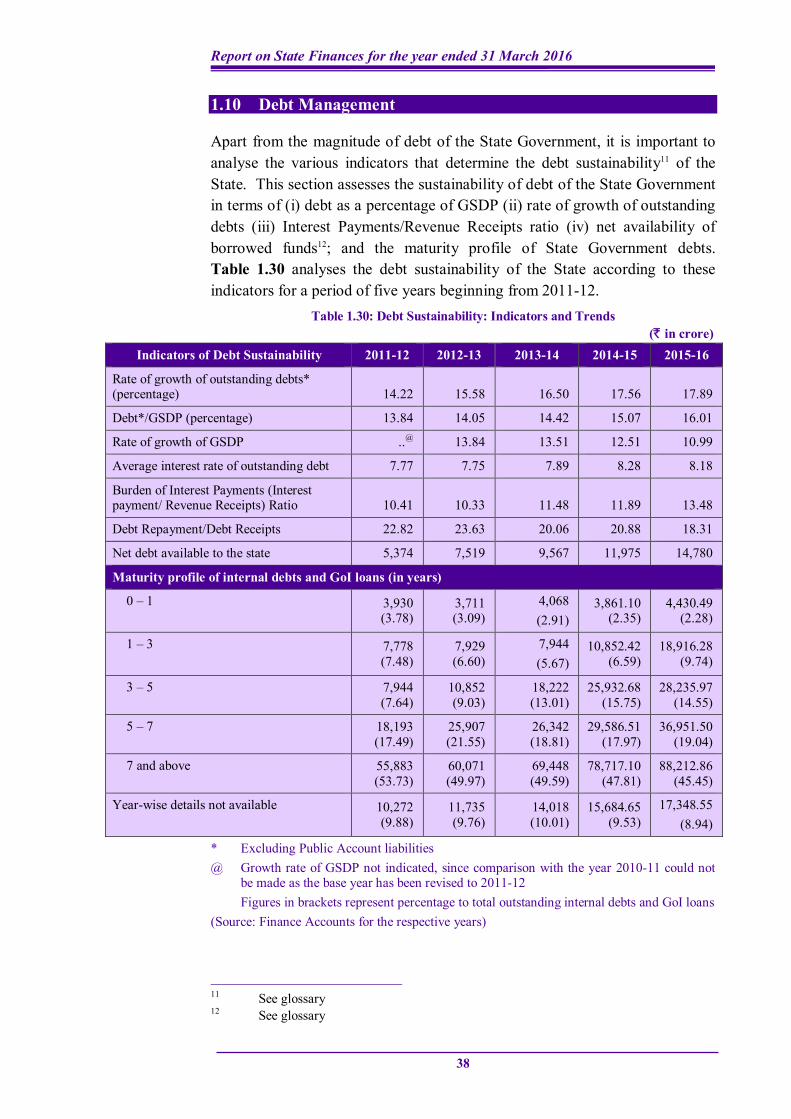
1.10 Debt Management
Apart from the magnitude of debt of the State Government, it is important to analyse the various indicators that determine the debt sustainability11 of the State. This section assesses the sustainability of debt of the State Government in terms of (i) debt as a percentage of GSDP (ii) rate of growth of outstanding debts (iii) Interest Payments/Revenue Receipts ratio (iv) net availability of borrowed funds12; and the maturity profile of State Government debts. Table 1.30 analyses the debt sustainability of the State according to these indicators for a period of five years beginning from 2011-12.
Table 1.30: Debt Sustainability: Indicators and Trends (` in crore)
Indicators of Debt Sustainability 2011-12 2012-13 2013-14 2014-15 2015-16
Rate of growth of outstanding debts* (percentage) 14.22 15.58 16.50 17.56 17.89
Debt*/GSDP (percentage) 13.84 14.05 14.42 15.07 16.01
Rate of growth of GSDP ..@ 13.84 13.51 12.51 10.99
Average interest rate of outstanding debt 7.77 7.75 7.89 8.28 8.18
Burden of Interest Payments (Interest payment/ Revenue Receipts) Ratio 10.41 10.33 11.48 11.89 13.48
Debt Repayment/Debt Receipts 22.82 23.63 20.06 20.88 18.31
Net debt available to the state 5,374 7,519 9,567 11,975 14,780
Maturity profile of internal debts and GoI loans (in years)
0 – 1 3,930 (3.78)
3,711 (3.09)
4,068 (2.91)
3,861.10 (2.35)
4,430.49 (2.28)
1 – 3 7,778 (7.48)
7,929 (6.60)
7,944 (5.67)
10,852.42 (6.59)
18,916.28 (9.74)
3 – 5 7,944 (7.64)
10,852 (9.03)
18,222 (13.01)
25,932.68 (15.75)
28,235.97 (14.55)
5 – 7 18,193 (17.49)
25,907 (21.55)
26,342 (18.81)
29,586.51 (17.97)
36,951.50 (19.04)
7 and above 55,883 (53.73)
60,071 (49.97)
69,448 (49.59)
78,717.10 (47.81)
88,212.86 (45.45)
Year-wise details not available 10,272 (9.88)
11,735 (9.76)
14,018 (10.01)
15,684.65 (9.53)
17,348.55 (8.94)
* Excluding Public Account liabilities @ Growth rate of GSDP not indicated, since comparison with the year 2010-11 could not
be made as the base year has been revised to 2011-12 Figures in brackets represent percentage to total outstanding internal debts and GoI loans
(Source: Finance Accounts for the respective years)
11 See glossary 12 See glossary
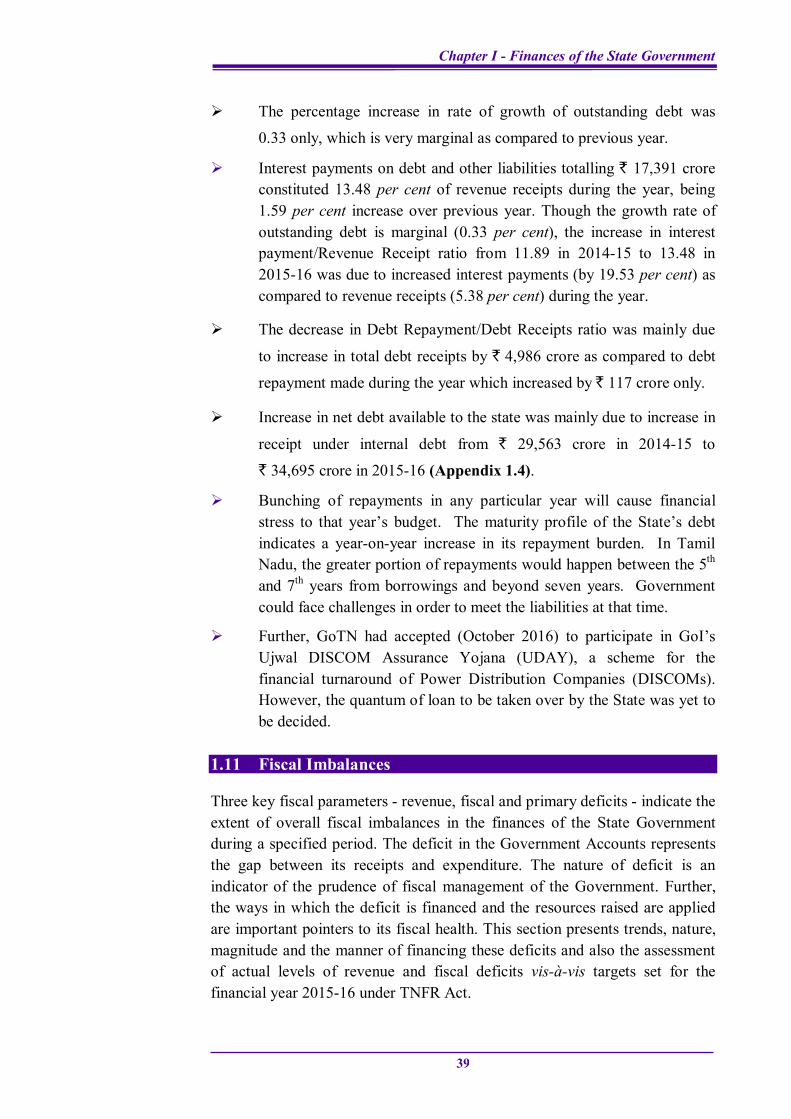
Chapter I - Finances of the State Government
39
The percentage increase in rate of growth of outstanding debt was
0.33 only, which is very marginal as compared to previous year.
Interest payments on debt and other liabilities totalling ` 17,391 crore constituted 13.48 per cent of revenue receipts during the year, being 1.59 per cent increase over previous year. Though the growth rate of outstanding debt is marginal (0.33 per cent), the increase in interest payment/Revenue Receipt ratio from 11.89 in 2014-15 to 13.48 in 2015-16 was due to increased interest payments (by 19.53 per cent) as compared to revenue receipts (5.38 per cent) during the year.
The decrease in Debt Repayment/Debt Receipts ratio was mainly due
to increase in total debt receipts by ` 4,986 crore as compared to debt
repayment made during the year which increased by ` 117 crore only.
Increase in net debt available to the state was mainly due to increase in
receipt under internal debt from ` 29,563 crore in 2014-15 to
` 34,695 crore in 2015-16 (Appendix 1.4).
Bunching of repayments in any particular year will cause financial stress to that year’s budget. The maturity profile of the State’s debt indicates a year-on-year increase in its repayment burden. In Tamil Nadu, the greater portion of repayments would happen between the 5th and 7th years from borrowings and beyond seven years. Government could face challenges in order to meet the liabilities at that time.
Further, GoTN had accepted (October 2016) to participate in GoI’s Ujwal DISCOM Assurance Yojana (UDAY), a scheme for the financial turnaround of Power Distribution Companies (DISCOMs). However, the quantum of loan to be taken over by the State was yet to be decided.
1.11 Fiscal Imbalances
Three key fiscal parameters - revenue, fiscal and primary deficits - indicate the extent of overall fiscal imbalances in the finances of the State Government during a specified period. The deficit in the Government Accounts represents the gap between its receipts and expenditure. The nature of deficit is an indicator of the prudence of fiscal management of the Government. Further, the ways in which the deficit is financed and the resources raised are applied are important pointers to its fiscal health. This section presents trends, nature, magnitude and the manner of financing these deficits and also the assessment of actual levels of revenue and fiscal deficits vis-à-vis targets set for the financial year 2015-16 under TNFR Act.
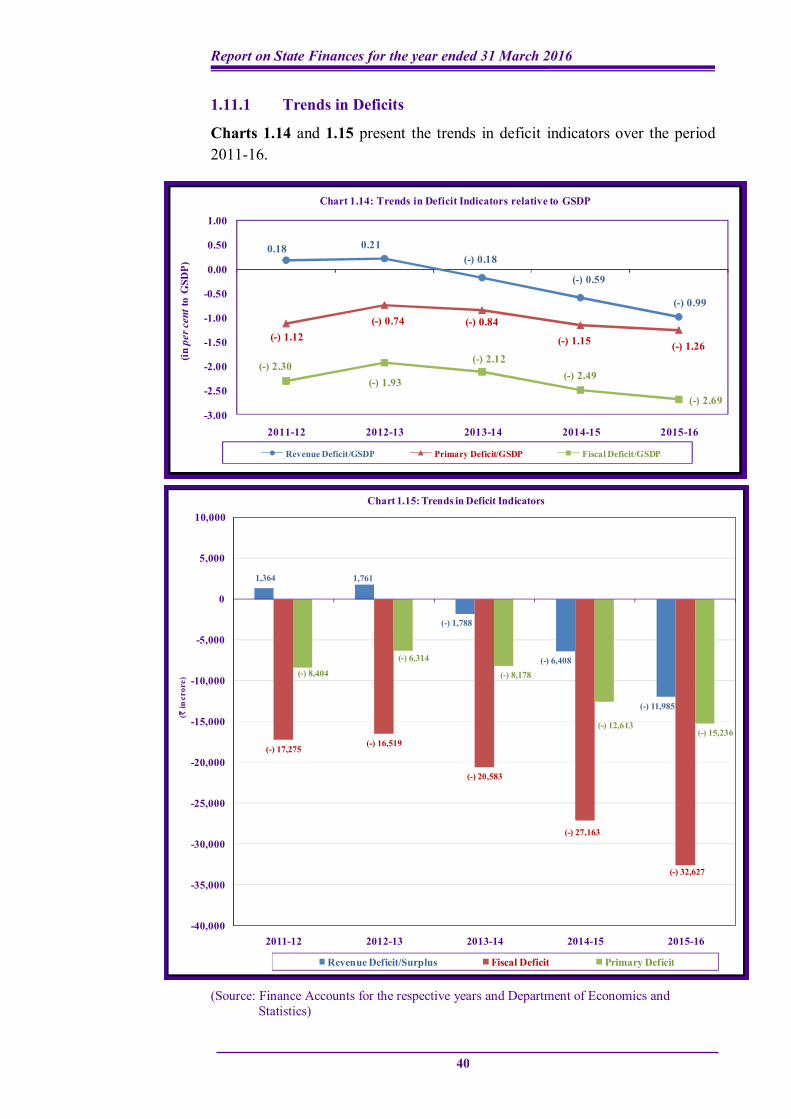
Report on State Finances for the year ended 31 March 2016
40
1.11.1 Trends in Deficits
Charts 1.14 and 1.15 present the trends in deficit indicators over the period 2011-16.
(Source: Finance Accounts for the respective years and Department of Economics and Statistics)
1,364 1,761
(-) 1,788
(-) 6,408
(-) 11,985
(-) 17,275(-) 16,519
(-) 20,583
(-) 27,163
(-) 32,627
(-) 8,404
(-) 6,314
(-) 8,178
(-) 12,613(-) 15,236
-40,000
-35,000
-30,000
-25,000
-20,000
-15,000
-10,000
-5,000
0
5,000
10,000
2011-12 2012-13 2013-14 2014-15 2015-16
(`in
cro
re)
Chart 1.15: Trends in Deficit Indicators
Revenue Deficit/Surplus Fiscal Deficit Primary Deficit
0.18 0.21(-) 0.18
(-) 0.59
(-) 0.99
(-) 1.12(-) 0.74 (-) 0.84
(-) 1.15 (-) 1.26
(-) 2.30(-) 1.93
(-) 2.12(-) 2.49
(-) 2.69-3.00
-2.50
-2.00
-1.50
-1.00
-0.50
0.00
0.50
1.00
2011-12 2012-13 2013-14 2014-15 2015-16
(in p
er c
entt
o G
SDP)
Chart 1.14: Trends in Deficit Indicators relative to GSDP
Revenue Deficit/GSDP Primary Deficit/GSDP Fiscal Deficit/GSDP
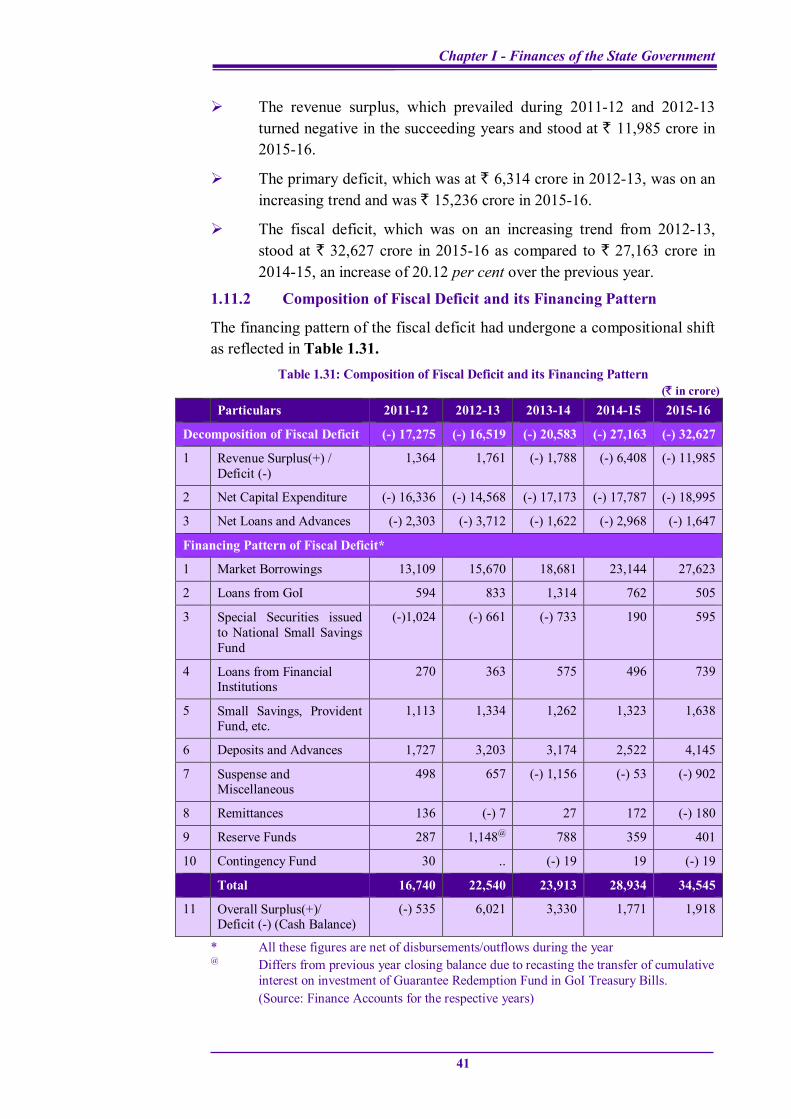
Chapter I - Finances of the State Government
41
The revenue surplus, which prevailed during 2011-12 and 2012-13 turned negative in the succeeding years and stood at ` 11,985 crore in 2015-16.
The primary deficit, which was at ` 6,314 crore in 2012-13, was on an increasing trend and was ` 15,236 crore in 2015-16.
The fiscal deficit, which was on an increasing trend from 2012-13, stood at ` 32,627 crore in 2015-16 as compared to ` 27,163 crore in 2014-15, an increase of 20.12 per cent over the previous year.
1.11.2 Composition of Fiscal Deficit and its Financing Pattern
The financing pattern of the fiscal deficit had undergone a compositional shift as reflected in Table 1.31.
Table 1.31: Composition of Fiscal Deficit and its Financing Pattern (` in crore)
Particulars 2011-12 2012-13 2013-14 2014-15 2015-16
Decomposition of Fiscal Deficit (-) 17,275 (-) 16,519 (-) 20,583 (-) 27,163 (-) 32,627
1 Revenue Surplus(+) / Deficit (-)
1,364 1,761 (-) 1,788 (-) 6,408 (-) 11,985
2 Net Capital Expenditure (-) 16,336 (-) 14,568 (-) 17,173 (-) 17,787 (-) 18,995
3 Net Loans and Advances (-) 2,303 (-) 3,712 (-) 1,622 (-) 2,968 (-) 1,647
Financing Pattern of Fiscal Deficit*
1 Market Borrowings 13,109 15,670 18,681 23,144 27,623
2 Loans from GoI 594 833 1,314 762 505
3 Special Securities issued to National Small Savings Fund
(-)1,024 (-) 661 (-) 733 190 595
4 Loans from Financial Institutions
270 363 575 496 739
5 Small Savings, Provident Fund, etc.
1,113 1,334 1,262 1,323 1,638
6 Deposits and Advances 1,727 3,203 3,174 2,522 4,145
7 Suspense and Miscellaneous
498 657 (-) 1,156 (-) 53 (-) 902
8 Remittances 136 (-) 7 27 172 (-) 180
9 Reserve Funds 287 1,148@ 788 359 401
10 Contingency Fund 30 .. (-) 19 19 (-) 19
Total 16,740 22,540 23,913 28,934 34,545
11 Overall Surplus(+)/ Deficit (-) (Cash Balance)
(-) 535 6,021 3,330 1,771 1,918
* All these figures are net of disbursements/outflows during the year @ Differs from previous year closing balance due to recasting the transfer of cumulative
interest on investment of Guarantee Redemption Fund in GoI Treasury Bills.
(Source: Finance Accounts for the respective years)
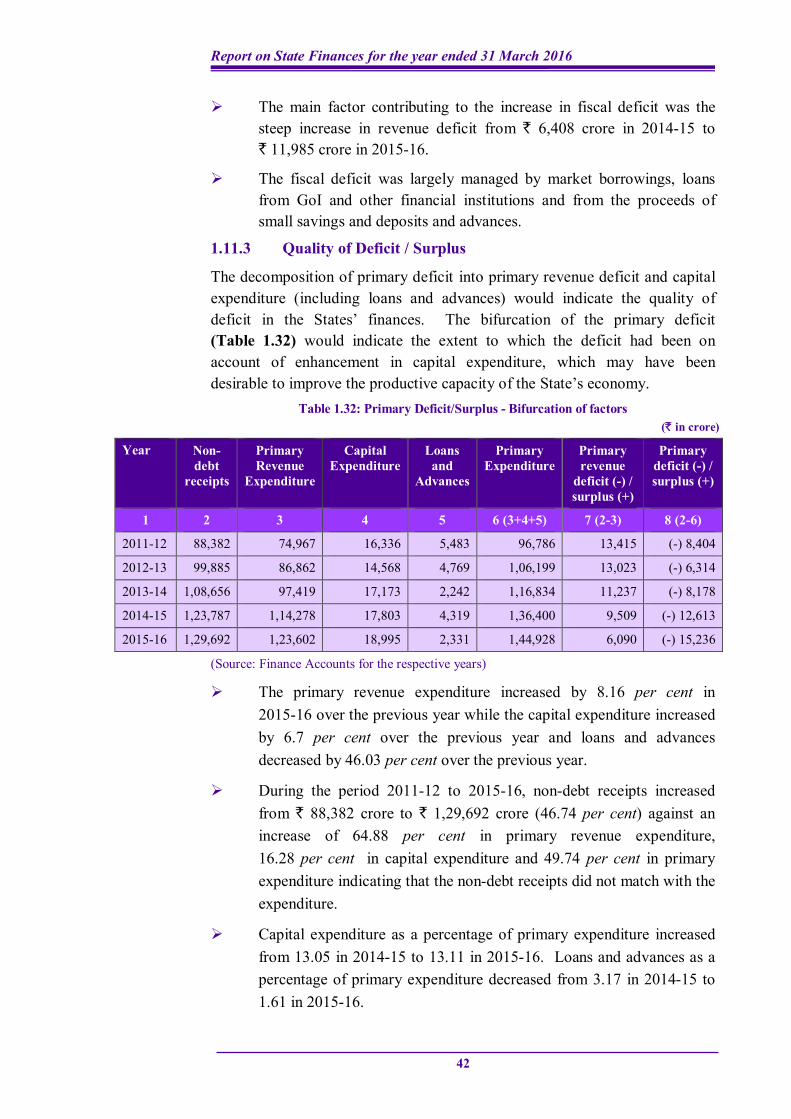
Report on State Finances for the year ended 31 March 2016
42
The main factor contributing to the increase in fiscal deficit was the steep increase in revenue deficit from ` 6,408 crore in 2014-15 to ` 11,985 crore in 2015-16.
The fiscal deficit was largely managed by market borrowings, loans from GoI and other financial institutions and from the proceeds of small savings and deposits and advances.
1.11.3 Quality of Deficit / Surplus
The decomposition of primary deficit into primary revenue deficit and capital expenditure (including loans and advances) would indicate the quality of deficit in the States’ finances. The bifurcation of the primary deficit (Table 1.32) would indicate the extent to which the deficit had been on account of enhancement in capital expenditure, which may have been desirable to improve the productive capacity of the State’s economy.
Table 1.32: Primary Deficit/Surplus - Bifurcation of factors (` in crore)
Year Non-debt
receipts
Primary Revenue
Expenditure
Capital Expenditure
Loans and
Advances
Primary Expenditure
Primary revenue
deficit (-) / surplus (+)
Primary deficit (-) / surplus (+)
1 2 3 4 5 6 (3+4+5) 7 (2-3) 8 (2-6)
2011-12 88,382 74,967 16,336 5,483 96,786 13,415 (-) 8,404
2012-13 99,885 86,862 14,568 4,769 1,06,199 13,023 (-) 6,314
2013-14 1,08,656 97,419 17,173 2,242 1,16,834 11,237 (-) 8,178
2014-15 1,23,787 1,14,278 17,803 4,319 1,36,400 9,509 (-) 12,613
2015-16 1,29,692 1,23,602 18,995 2,331 1,44,928 6,090 (-) 15,236
(Source: Finance Accounts for the respective years)
The primary revenue expenditure increased by 8.16 per cent in 2015-16 over the previous year while the capital expenditure increased by 6.7 per cent over the previous year and loans and advances decreased by 46.03 per cent over the previous year.
During the period 2011-12 to 2015-16, non-debt receipts increased from ` 88,382 crore to ` 1,29,692 crore (46.74 per cent) against an increase of 64.88 per cent in primary revenue expenditure, 16.28 per cent in capital expenditure and 49.74 per cent in primary expenditure indicating that the non-debt receipts did not match with the expenditure.
Capital expenditure as a percentage of primary expenditure increased from 13.05 in 2014-15 to 13.11 in 2015-16. Loans and advances as a percentage of primary expenditure decreased from 3.17 in 2014-15 to 1.61 in 2015-16.
Chapter I - Finances of the State Government
43
The non-debt receipts were not enough to meet the primary expenditure requirements from 2011-12 onwards, resulting in primary deficit, which increased from ` 8,404 crore in 2011-12 to ` 15,236 crore in 2015-16.
1.12 Follow-up action by State Government
In the Report of the Comptroller and Auditor General of India on State Finances for the year ended 31 March 2015, it was pointed out that an amount of ` 8 crore was pending to be transferred to various Reserve Funds. However, the receipts collected during 2015-16 were not transferred fully resulting in a short transfer of ` 123 crore during the year 2015-16. The deficiency in the system of reconciliation resulting in such short transfers was pointed out to State Government during the Exit Conference and the State Government has assured to initiate action in this regard.
Out of excess expenditure of ` 1,565.96 crore for the years 2005- 14 to be regularised as reported in the Report on State Finances for the year ended 31 March 2015, the Government has since regularised ` 794.25 crore relating to 2005-12, as discussed in Paragraph 2.3.2 of Chapter II of this Report.
Government took action to identify and pool Personal Deposit (PD) Accounts not authorised by AG (A&E), out of the 130 inoperative PD Accounts pointed out in 2014-15 as discussed in Paragraph 3.5 of Chapter III of this Report. However, ` 355.88 crore so pooled under a separate subhead - AC- Minor head - 106 under 8443 Civil Deposits is outside the Consolidated Fund and needs to be reviewed and reconciled by the Government.
Similarly, cases of misappropriation, shortage, theft and loss persisted despite being pointed out in earlier Audit Reports and final action by the State Government in this regard was pending as discussed in Paragraph 3.6 of Chapter III of this Report.
1.13 Conclusion
Fiscal position: The State, which had maintained revenue surplus during 2011-12 and 2012-13, registered a revenue deficit from 2013-14 onwards and it was on an increasing trend and stood at ` 11,985 crore in 2015-16. During 2015-16, the State not only failed to achieve the revenue surplus as projected in the MTFP, but also failed to contain its revenue deficit within the target proposed in the Budget. The State could, however, contain the fiscal deficit as a percentage of GSDP to 2.69 per cent during 2015-16, which was within the target of three per cent of GSDP as envisaged under the TNFR Act,
Report on State Finances for the year ended 31 March 2016
44
projections made in MTFP and FFC target. The main factor contributing to the increase in fiscal deficit was increase in revenue deficit during the year.
Accuracy of Revenue Deficit / Fiscal Deficit: The Revenue deficit of ` 11,985 crore and fiscal deficit of ` 32,627 crore were understated by ` 1,318.48 crore.
Revenue receipts: During the current year, the State’s revenue receipts (` 1,29,008 crore) increased by 5.38 per cent over the previous year. The growth rate of revenue receipts during 2014-16 stood at 5.38 per cent, which was significantly less than that of the General Category States (15 per cent). The growth rate of revenue receipts, which showed a decreasing trend from 21.39 per cent in 2011-12 to 9.32 per cent during 2013-14 although increased to 13.31 per cent during 2014-15, had dropped to a five year low of 5.38 per cent during 2015-16, due to the poor growth rate of own tax revenue and grants-in-aid. The State’s own tax revenue increased by ` 1,820 crore over the previous year and the growth rate, which was at 24.56 per cent in 2011-12, declined to a five year low of 2.31 per cent in 2015-16. The State’s revenue receipts, as a percentage of GSDP decreased from 11.2 in 2014-15 to 10.64 in 2015-16.
The non-tax revenue of the State increased by ` 567 crore in 2015-16 (6.79 per cent) over the previous year. As a proportion of the State’s own resources, the non-tax revenue which stood at 11.25 per cent in 2013-14 had decreased to 9.98 per cent in 2015-16.
Revenue expenditure: Of the total expenditure of ` 1,62,319 crore during 2015-16, revenue expenditure (` 1,40,993 crore) accounted for 86.86 per cent. Out of the revenue expenditure, 74.06 per cent (` 1,04,415 crore) was incurred on the non-plan component. The committed expenditure (` 83,817 crore) stood at 64.58 per cent of the total revenue receipts (` 1,29,008 crore) of the State during 2015-16, as against 61.54 per cent during 2014-15.
Capital expenditure: The capital expenditure (` 18,995 crore) during the current year increased by ` 1,192 crore (6.7 per cent) over the previous year due to more investment under Education, Sports, Art & Culture, Agriculture & Allied Activities, Water Supply, Sanitation, Housing & Urban Development and Rural Development.
Adequacy and priority of expenditure: In 2015-16, the proportion of Aggregate Expenditure to GSDP (13.39 per cent) was low as compared to the General Category States (16.05 per cent). Development expenditure as a proportion of aggregate expenditure in the State was lower (64.53 per cent) than the General Category States’ average (70.63 per cent).
Chapter I - Finances of the State Government
45
Investments and returns: The State invested ` 25,725 crore in various Government Companies and Corporations up to March 2016. While the Government paid interest at an average rate of 8.38 per cent on its borrowings during 2015-16, the average return on its investments was only 0.61 per cent.
Debt Management: The outstanding fiscal liabilities had increased from ` 1,91,847 crore at the end of 2014-15 to ` 2,23,030 crore at the end of 2015-16. These represented 172.88 per cent of the revenue receipts. However, the outstanding liabilities as a percentage of GSDP was 18.39, which was within the norm of 20.78 prescribed for the year 2015-16 as per FFC.