Embed Size (px)
Citation preview

39
CHAPTER FOUR: DATA ANALYSIS AND RESULTS
4.1 Introduction
In this chapter, detailed information acquired from the questionnaire survey is
presented and discussed in order to prove the research objective. This chapter consists
of five sections as follows:
Section 1: Demographic Analysis
Section 2: Preferred Brand Analysis
Section 3: Reliability and Factor Analysis of Measures
Section 4: Brand Equity Analysis
Section 5: Hypothesis Testing and Interpretation
4.2 Demographic Profile of Respondents
This survey was conducted for the present study. The total sample size is 165 (n =
165) and survey was conducted from the different places in Malaysia. Respondents‟
personal information obtained included gender, age, nationality, educational
qualification, occupation, and preferences to buy a particular sportswear brand. These
data have been shown in tables as follows:
Table 4.1: Gender analysis
Gender Frequency Percentage
Male 63 38.2
Female 102 61.8
Total 165 100.0

40
Gender Distribution
Male
38%
Female
62%
More female respondents than male responded in this study. Out of 165 respondents,
female respondents are 102, i.e. 62 percent and male respondents are 63, i.e. 38
percent of the total sample size. The ratio of male to female respondents is 1:1.6, as
compared to the actual gender ratio of Malaysia demographic of 1:1.01 (Statistics
Department of Malaysia, 2009). Thus, the respondents distribution according to age is
close enough representative of the exact Malaysian total population.
Table 4.2: Age Analysis
Age Frequency Percentage
below 21 years 31 19
21 - 30 years 64 39
31 - 40 years 47 28
41-50 years 23 14
Total 165 100
Age DistributionBelow 21
years
19%
21-30
years
39%
31-40
years
28%
41-50
years
14%
Chart 4.1 : Gender Distribution
Chart 4.2 : Age Distribution

41
The most respondents are from the age group of 21-30 years (64, i.e. 39%). This
could be due to a lot of questions were distributed in a private college and shopping
centers. Second to that is the 31-40 age group (47, i.e. 28%), third is the below 21 age
group (31, i.e. 19%) then only followed by the 41-50 age group (23, i.e. 14%). Two
age groups of 51-60 years and above 60 years had to be dropped from the study due to
zero respondents were received from this group. Comparing the no. of respondents to
the actual demographic of Malaysia in the table 4.21 below (Statistics Department of
Malaysia, 2009) the distribution of age respondents do not quite match the actual
demographic of Malaysia, which may not be good representation of the actual
Malaysian population.
Table 4.2.1 Actual demographic of Malaysia (source: Statistics Department of Malaysia)
Age Group Total %
0-14 years 32%
15-64 years 64%
65 and over 5%
Table 4.3: Nationality Analysis
Nationality Frequency Percentage
Malaysian 121 73
Non-Malaysian 44 27
Total 165 100
42
Nationality Distribution
Malaysian
73%
Non-
Malaysian
27%
In this survey, there were more Malaysian respondents than non-Malaysian
respondents. Table 4.3 shows that Malaysian respondents are 121, i.e. 73 percent of
the total sample size, and 44 non-Malaysian respondents, i.e. 27 percent of the total
sample size.
Table 4.4: Educational Qualification Analysis
Educational Level Frequency Percentage
Secondary School 7 4
Diploma 36 22
Bachelor Degree 66 40
Post Graduate Degree 46 28
Others 10 6
Total 165 100
Chart 4.3 : Nationality Distribution

43
Education Level DistributionSecondary
School
4.2% Diploma
21.8%
Bachelor
Degree
40.0%
PostG
Degree
27.9%
Others
6.1%
The two highest groups of respondents are from bachelor degree and post graduate
degree. 40 percent of the total respondents are from the bachelor degree group (66
numbers), while around 28% respondents are from the postgraduate degree group (46
numbers). This shows that the sample was representative of the study‟s intended
population of well-educated younger Malaysian consumers. Since this study is
conducted in Kuala Lumpur city area, which is the biggest city in Malaysia, thus the
education level of the respondents should be higher than the average education level
of total population of Malaysia.
Table 4.5: Occupation Analysis
Occupation Frequency Percentage
Professional 12 7
Manager/Executive 70 42
Clerical Staff 1 1
Full time student 70 42
Currently not working/ Retiree 9 6
Others 3 2
Total 165 100
Chart 4.4 : Education Level Distribution
44
Occupation Distribution
Professional
7%
Manager/Ex
ec
42%Clerical
Staff
1%
Full time
student
42%
Not working
6%
Others
2%
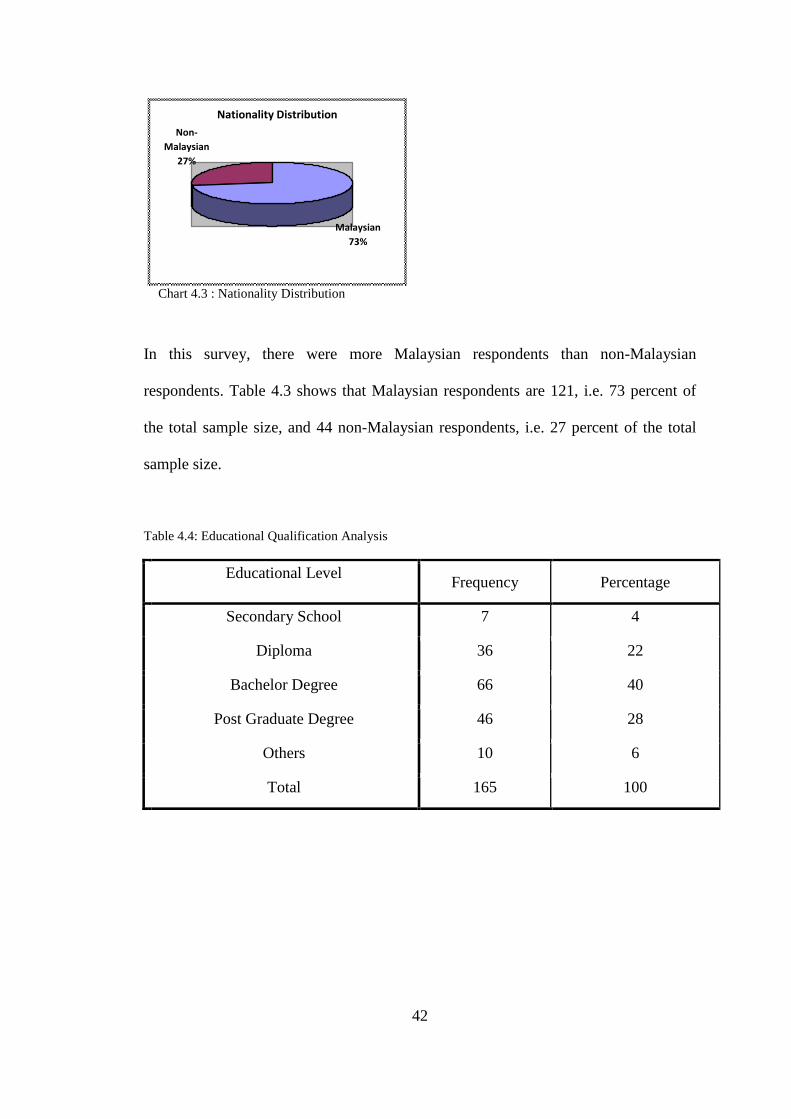
In this study, the occupation groups was chosen rather than the income level group
due to the simple fact that did not want to create any awkwardness for the respondents
in answering that part of question. The occupation level should already be a vague
representative of the income level earned. In this study, the group Manager/Executive
and Full Time Student had the same number of respondents, i.e. 70 which represent
42% respectively. This result tallied with the education level distribution as the most
respondents were in the Bachelor degree group. However, the technical staff group
had to be dropped from this analysis as there were zero respondents from this group.
Table 4.6: Preference to Buy Sportswear Brand Analysis
Brand Frequency Percentage
Nike 58 35
Adidas 26 16
Reebok 54 33
Puma 1 1
New Balance 21 13
Others 5 3
Total 165 100
Chart 4.5 : Occupation Distribution
45
Sportswear Brand Distribution
Adidas
16%
Reebok
33%
Puma
1%
New Balance
13% Others
3%Nike
35%
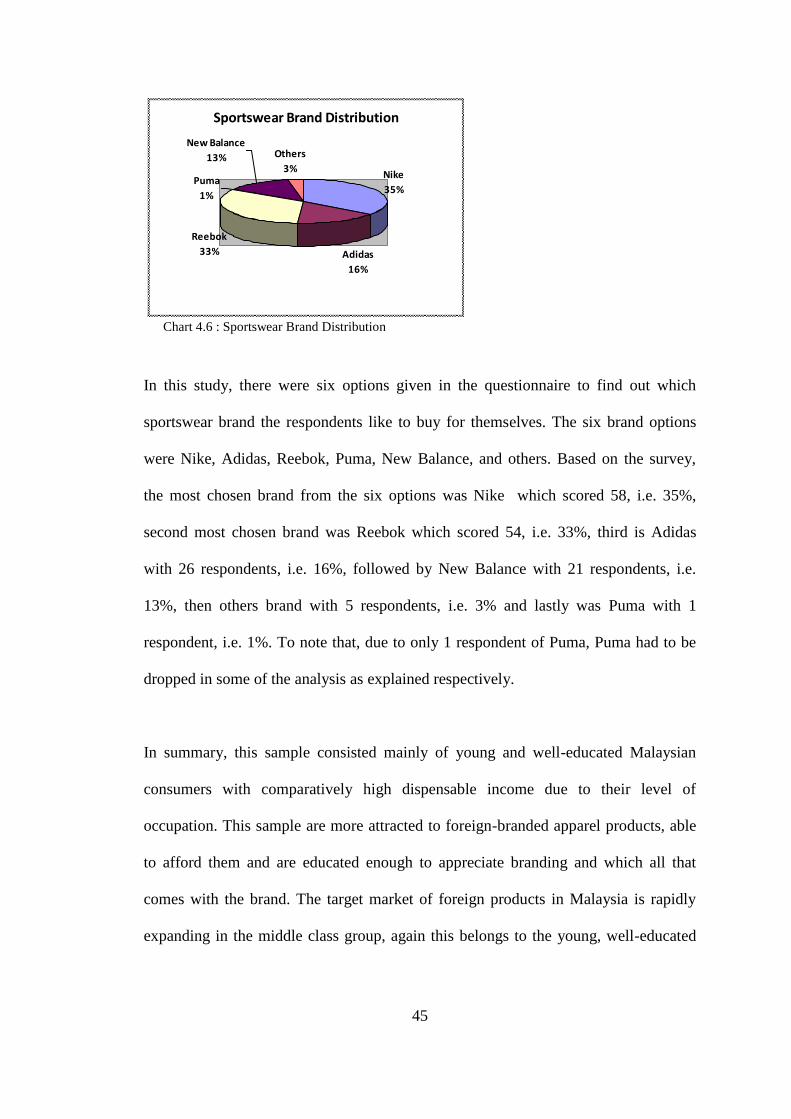
In this study, there were six options given in the questionnaire to find out which
sportswear brand the respondents like to buy for themselves. The six brand options
were Nike, Adidas, Reebok, Puma, New Balance, and others. Based on the survey,
the most chosen brand from the six options was Nike which scored 58, i.e. 35%,
second most chosen brand was Reebok which scored 54, i.e. 33%, third is Adidas
with 26 respondents, i.e. 16%, followed by New Balance with 21 respondents, i.e.
13%, then others brand with 5 respondents, i.e. 3% and lastly was Puma with 1
respondent, i.e. 1%. To note that, due to only 1 respondent of Puma, Puma had to be
dropped in some of the analysis as explained respectively.
In summary, this sample consisted mainly of young and well-educated Malaysian
consumers with comparatively high dispensable income due to their level of
occupation. This sample are more attracted to foreign-branded apparel products, able
to afford them and are educated enough to appreciate branding and which all that
comes with the brand. The target market of foreign products in Malaysia is rapidly
expanding in the middle class group, again this belongs to the young, well-educated
Chart 4.6 : Sportswear Brand Distribution
46
and high-income people in the Kuala Lumpur city. Therefore, this study sample well
represents the target consumers of foreign branded clothing in the Malaysian market.
4.2 Preferred Brand Analysis
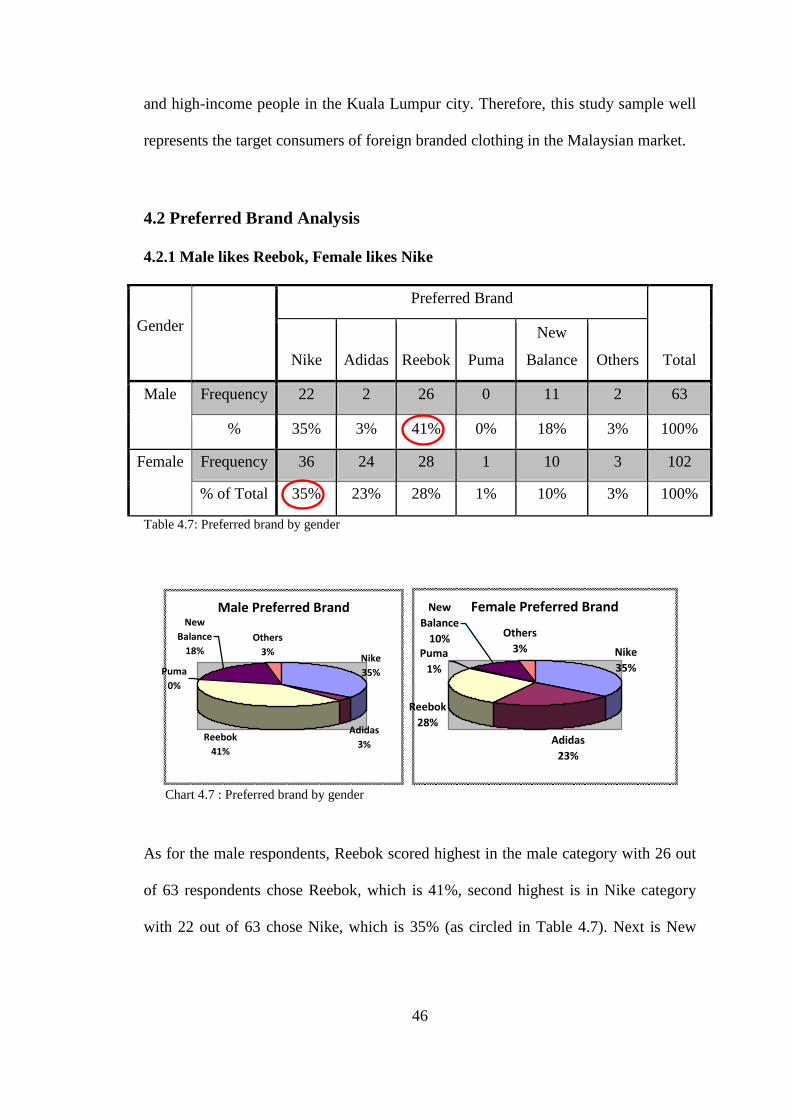
4.2.1 Male likes Reebok, Female likes Nike
Gender
Preferred Brand
Total Nike Adidas Reebok Puma
New
Balance Others
Male Frequency 22 2 26 0 11 2 63
% 35% 3% 41% 0% 18% 3% 100%
Female Frequency 36 24 28 1 10 3 102
% of Total 35% 23% 28% 1% 10% 3% 100%
Table 4.7: Preferred brand by gender
Male Preferred Brand
Nike
35%
Adidas
3%Reebok
41%
Puma
0%
New
Balance
18%
Others
3%
Female Preferred Brand
Adidas
23%
Reebok
28%
Others
3% Nike
35%Puma
1%
New
Balance
10%
As for the male respondents, Reebok scored highest in the male category with 26 out
of 63 respondents chose Reebok, which is 41%, second highest is in Nike category
with 22 out of 63 chose Nike, which is 35% (as circled in Table 4.7). Next is New
Chart 4.7 : Preferred brand by gender

47
Balance where 11 out of 63 chose New Balance, which is 18% and Adidas, 2 out of
63 chose Adidas, which is 3% and other brands, also 2 out of 63, which is 3%.
As for the female respondents, it was observed that the highest chosen brand is Nike
with 36 out of 102, i.e. 35%, second highest is Reebok with 28 out of 102, i.e. 28%.
Next is Adidas with 24 out of 102 respondents, i.e. 23%, followed by New Balance
with 10 out of 102, i.e. 10%, finally other brands and Puma are at 3 (3%) and 1 (1%)
respectively.
It can be concluded from the sample here that more females are in favour of Nike than
male, whereas more males are in favour of Reebok than female. What could be the
reasons behind this? Looking at one aspect of branding strategy of brand ambassador,
Nike‟s most famous ambassadors are Tiger Woods for Golf, Roger Federer for
Tennis, and Michael Jordon for Basketball. Whereas Reebok‟s famous ambassadors
are Bipasha Basu the Bollywood actress, and Scarlet Johansson the Hollywood
actress. This could have some influence over many other factors that male could be
attracted to the Reebok‟s brand endorser and female to Nike‟s. Research has shown
that there is gender based purchasing, which should be taken into account when
utilizing a celebrity endorser (Aiken, 1963; Gentry and Doering, 1977; Vitz and
Johnston, 1965). Previous empirical studies identified that sex appeal serves a number
of crucial roles in advertising including attracting initial attention (e.g. Reid and
Soley, 1983), enhancing recall (e.g. Steadman, 1969), evoking emotional responses
(e.g. Courtney and Whipple, 1983; Hoyer and MacInnis, 2001), and increasing
persuasion (e.g. La Tour, Pitts, and Snook-Luther, 1990; Saunders, 1996) as well as
48
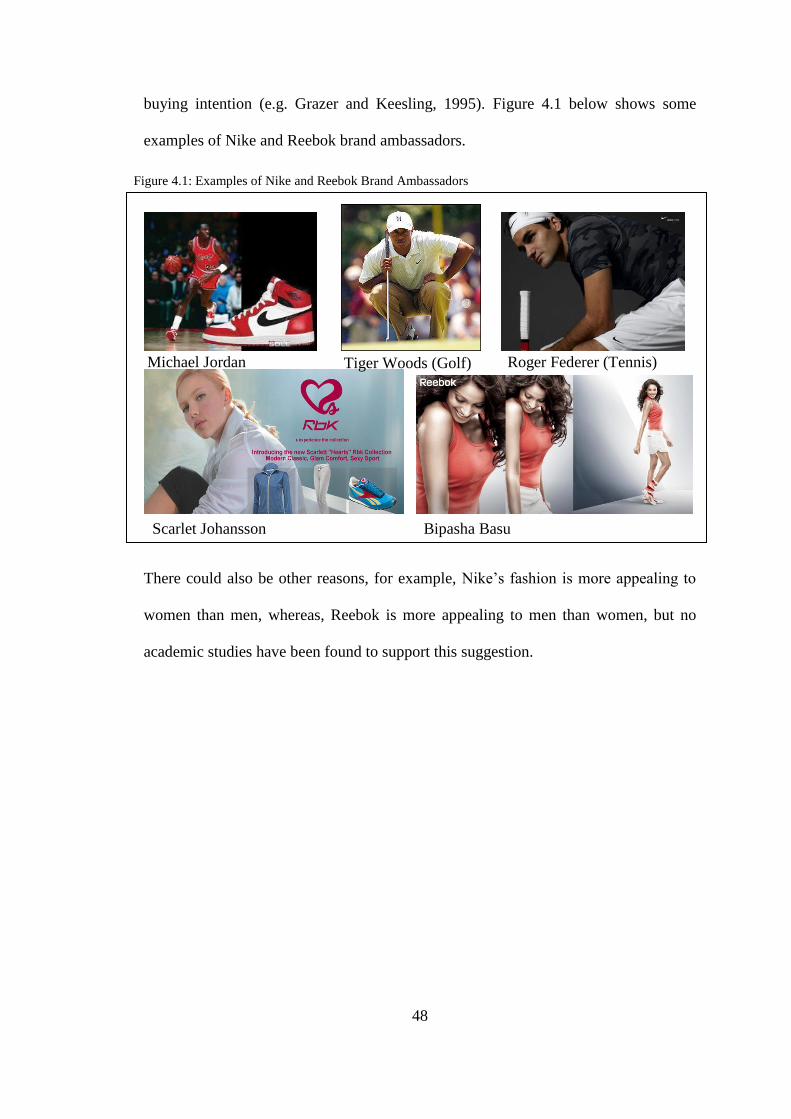
buying intention (e.g. Grazer and Keesling, 1995). Figure 4.1 below shows some
examples of Nike and Reebok brand ambassadors.
There could also be other reasons, for example, Nike‟s fashion is more appealing to
women than men, whereas, Reebok is more appealing to men than women, but no
academic studies have been found to support this suggestion.
Michael Jordan
(Basketball)
Tiger Woods (Golf) Roger Federer (Tennis)
Scarlet Johansson
(Hollywood)
Bipasha Basu
(Bollywood)
Figure 4.1: Examples of Nike and Reebok Brand Ambassadors
49
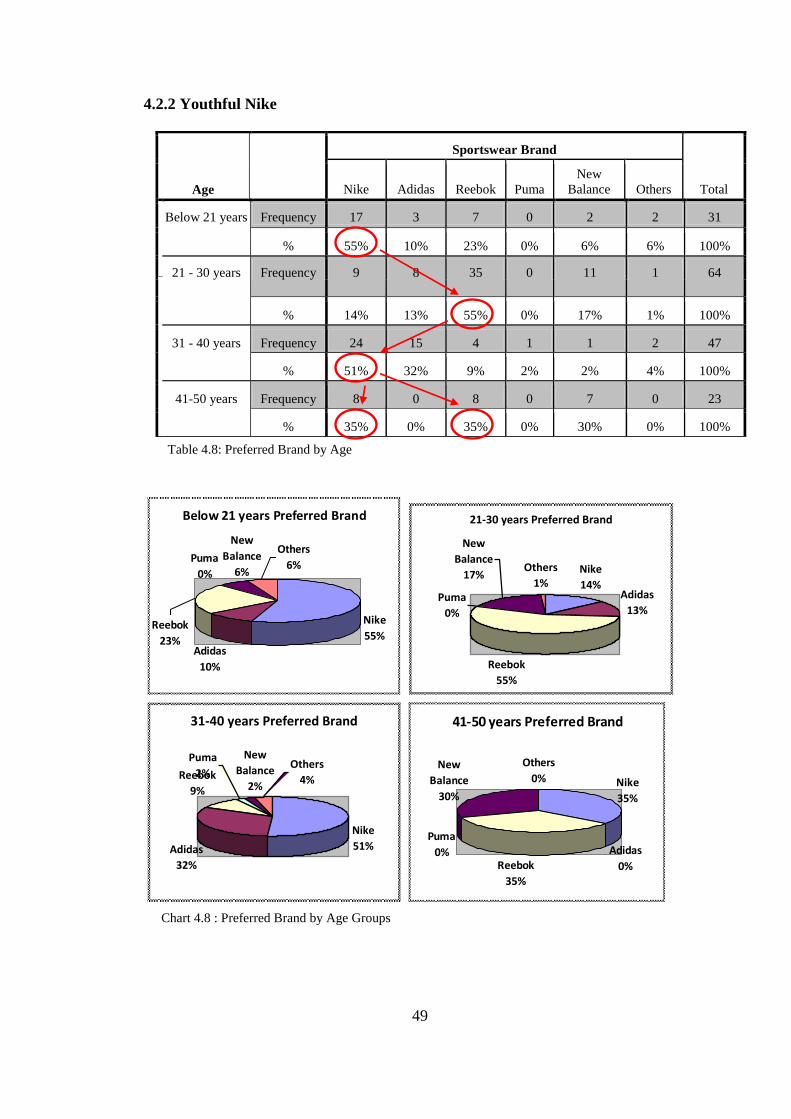
4.2.2 Youthful Nike
Age
Sportswear Brand
Total Nike Adidas Reebok Puma
New
Balance Others
Below 21 years Frequency 17 3 7 0 2 2 31
% 55% 10% 23% 0% 6% 6% 100%
21 - 30 years Frequency 9 8 35 0 11 1 64
% 14% 13% 55% 0% 17% 1% 100%
31 - 40 years Frequency 24 15 4 1 1 2 47
% 51% 32% 9% 2% 2% 4% 100%
41-50 years Frequency 8 0 8 0 7 0 23
% 35% 0% 35% 0% 30% 0% 100%
Below 21 years Preferred Brand
Nike
55%Adidas
10%
Puma
0%
Reebok
23%
New
Balance
6%
Others
6%
21-30 years Preferred Brand
Nike
14%Adidas
13%
Reebok
55%
Puma
0%
New
Balance
17%Others
1%
31-40 years Preferred Brand
Nike
51%Adidas
32%
Reebok
9%
Puma
2%
New
Balance
2%
Others
4%
41-50 years Preferred Brand
Nike
35%
Adidas
0%Reebok
35%
Puma
0%
New
Balance
30%
Others
0%
Chart 4.8 : Preferred Brand by Age Groups
Table 4.8: Preferred Brand by Age
50
It can be seen that the highest number of respondents preferring Nike and Adidas
come from ages 31-40 years, whereas most preferring Reebok and New Balance come
from ages 21-30 years. Teenagers prefer Nike to other brands, then the preference
shifts to Reebok at 21-30 years, then the preference goes back again to Nike at ages
31-40 years, then equal preference between Nike and Reebok in the 41-50 years
group. Many interesting factors could contribute to this phenomenon of changing
preferences of brands as the age progresses.
As teenagers are mostly living with their parents/family, thus according to Hite and
Hite (1994) argue that it is difficult to separate the dual influences, of parental
example and advertising, in encouraging your consumers toward repeated choices of
leading brands; and thus in affecting the development of young consumers brand
preferences and choices. Reflecting on child development theory it is suggested that
children‟s consumer behavior is absorbed at very young ages from familial examples.
If parents repeatedly choose a brand the child perceives it to be good. Thus, this
suggests that children have little influence over how much to spend, where to make
the purchase and the final decision (Beastty and Talpade, 1994). Relating back to the
preference findings above, these may have explained as to why the teenagers (below
21 years age) group have the same preference, i.e. Nike, with the 31-40 years group
and 41-50 years group, as the latter groups are their parental/familial group of people
that may have influenced the young preference.
Hogg, Bruce & Hill (1998) also found that the Nike “swoosh” and the three stripes
from Adidas logos are easily recognized by youngsters as brand names, thus brand
51
recognition, as compared to Reebok and other brands. This could be another reason to
explain the preferences found in this study.
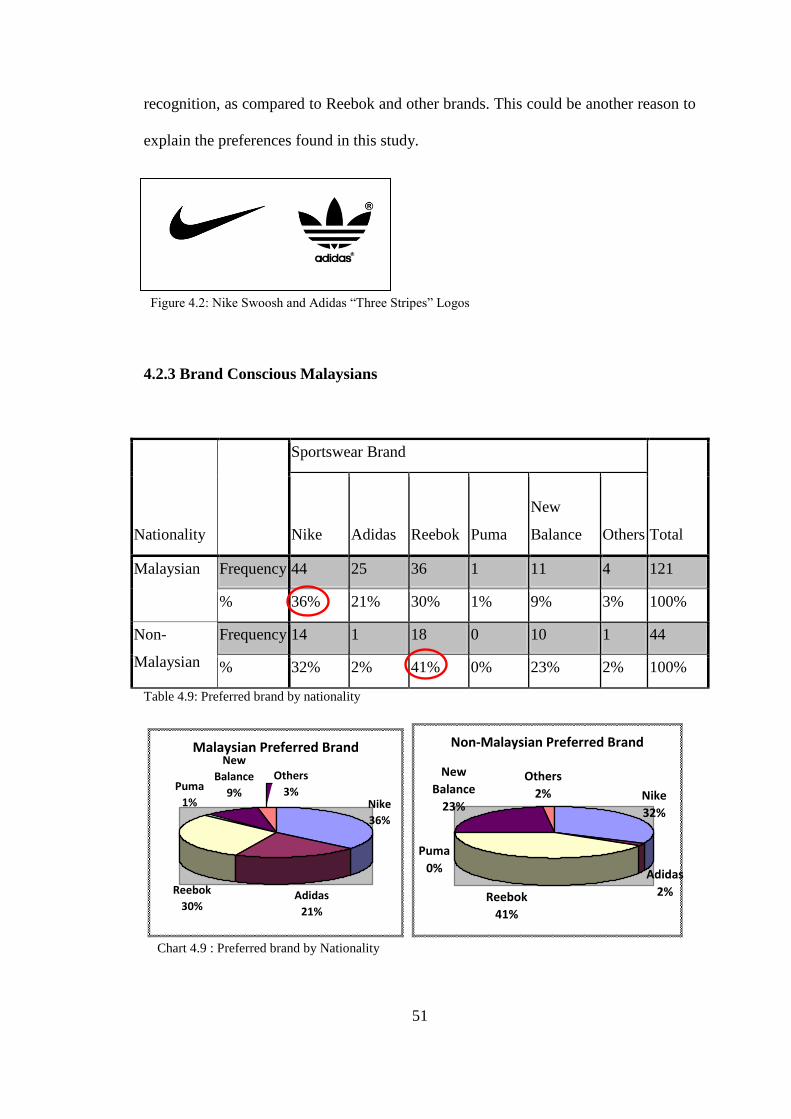
4.2.3 Brand Conscious Malaysians
Nationality
Sportswear Brand
Total Nike Adidas Reebok Puma
New
Balance Others
Malaysian Frequency 44 25 36 1 11 4 121
% 36% 21% 30% 1% 9% 3% 100%
Non-
Malaysian
Frequency 14 1 18 0 10 1 44
% 32% 2% 41% 0% 23% 2% 100%
Table 4.9: Preferred brand by nationality
Malaysian Preferred Brand
Nike
36%
Adidas
21%
Puma
1%
Others
3%
New
Balance
9%
Reebok
30%
Non-Malaysian Preferred Brand
Nike
32%
Adidas
2%Reebok
41%
Puma
0%
New
Balance
23%
Others
2%
Chart 4.9 : Preferred brand by Nationality
Figure 4.2: Nike Swoosh and Adidas “Three Stripes” Logos

52
It can be noted from the chart above that Malaysians prefer Nike (at 36%) than non-
Malaysian who prefer Reebok (at 41%). Although Nike‟s score are in the 30‟s for
both categories, but it is interesting to note here that Reebok dominates the Non-
Malaysian sample much more. Adidas scored very low for non-Malaysian but did
quite good with Malaysian. New Balance on the other hand is more popular for the
non-Malaysian as compared to Malaysian.
This finding may imply that Malaysian are more brand conscious as compared to non-
Malaysian as Nike is one of the top global brand. As the landscape of the global
economy has changed dramatically in Southeast Asia, particularly Malaysia, the
purchasing power of Southeast Asian consumers illustrates the extent to which some
of these once-small markets such as Malaysia have now become important players.
Described as “Asia‟s Tiger with a Vision” (Selvarajah, 1993), Malaysia is presently
classified as an upper-middle income county and considered as one of the most
developed of the developing countries. Among the notable impacts of Malaysia‟s
recent economic development is that Malaysian consumers are increasingly exposed
to international products and brands, and are selecting from a wider range of products,
brands, quality and prices than ever before. Mokhlis 2009 interpreted that young
Malaysian consumers who are fashion conscious derive pleasure from buying well-
known brands that are the latest in style and expensive at nice department and
specialty stores. According to Consumer Malaysia Info Site (2008), Malaysian
consumers are becoming more knowledgeable and discerning, and are not easily
influenced by advertisements and promotions. They are price conscious, but at the
same time desire brand quality. With the growing affluence and changing lifestyle,
53
consumers are becoming more demanding; not only of the quality of goods but also
the services they receive.
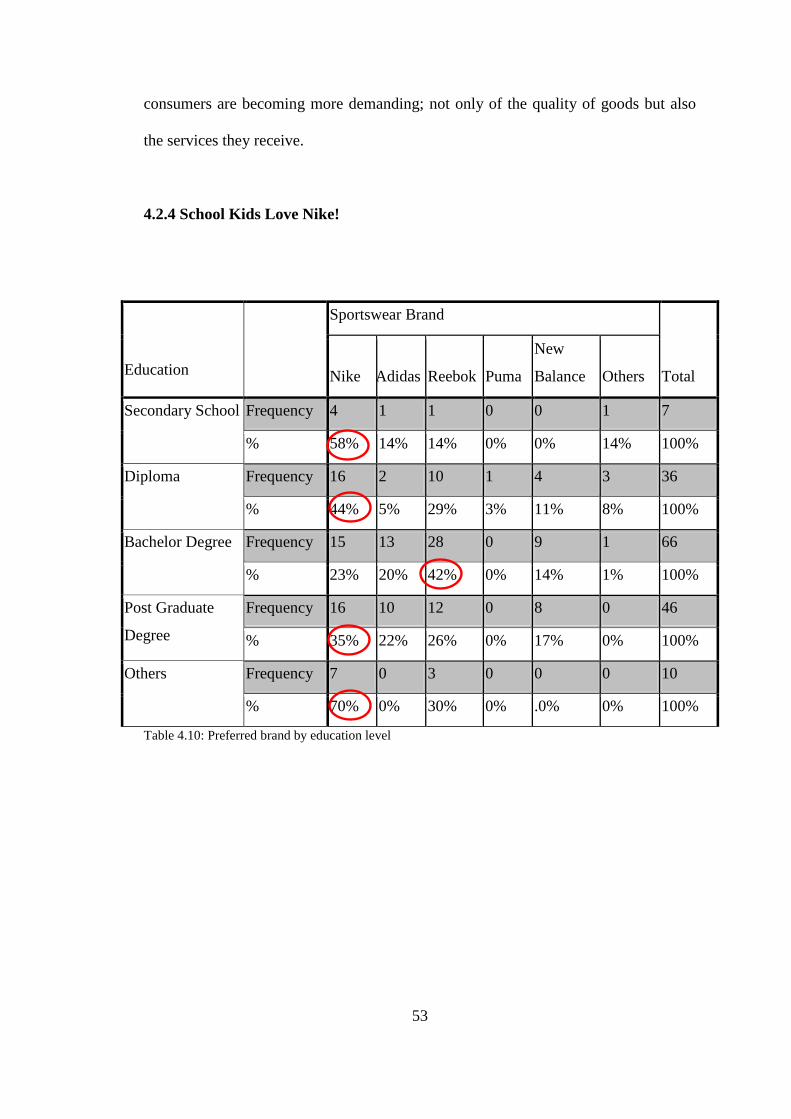
4.2.4 School Kids Love Nike!
Table 4.10: Preferred brand by education level
Education
Sportswear Brand
Total Nike Adidas Reebok Puma
New
Balance Others
Secondary School Frequency 4 1 1 0 0 1 7
% 58% 14% 14% 0% 0% 14% 100%
Diploma Frequency 16 2 10 1 4 3 36
% 44% 5% 29% 3% 11% 8% 100%
Bachelor Degree Frequency 15 13 28 0 9 1 66
% 23% 20% 42% 0% 14% 1% 100%
Post Graduate
Degree
Frequency 16 10 12 0 8 0 46
% 35% 22% 26% 0% 17% 0% 100%
Others Frequency 7 0 3 0 0 0 10
% 70% 0% 30% 0% .0% 0% 100%

54
4
161516
7
1 2
13
10
0 1
10
28
12
3
0 1 0 0 0 0
4
9 8
0 13
1 0 00
5
10
15
20
25
30
Nike Adidas Reebok Puma New Balance Others
Preferred Brand by Education Level
Secondary School Diploma Bachelor Degree Post Graduate Degree Others
From the result above, it is noted that both categories of school children and diploma
prefer Nike the most. As for bachelor degree group, Reebok is their preferred choice,
but the preference shifted to Nike again in post graduate group, and in other category
group Nike is also the most preferred brand. This is comparable to the result from
analysis between the age group and sportswear brand, which had Reebok scoring the
highest for the group 21-30 years and Nike highest for the age group of 31-40 years.
According to Achenreiner (2003), there is a growing interest in the role played by
brands in the everyday life of consumers, including that of younger consumers, brand
consciousness amongst children is on the increase, it has in fact become an integral
part of the way young consumers define themselves and how they would like others to
view them.
Chart 4.10 : Preferred Brand by Education Level

55
4.2.5 Nike Dominates Professionals and Full time student
Table 4.11: Preferred brand by occupation
9
20
0
27
20 1
19
04
20 1
24
1
25
21 0 0 0 0 01 1
7
0
12
10 0 0 1 2 210
10
20
30
Nike Adidas Reebok Puma New
Balance
Others
Preferred Brand by Occupation
Professional Manager/Exec Clerical Staff Full time stud Not Working Others
Occupation
Sportswear Brand
Total Nike Adidas
Reebo
k Puma
New
Balance Others
Professional Frequency 9 1 1 0 1 0 12
% 75% 8% 8% 0% 8% 0% 100%
Manager/Executive Frequency 20 19 24 0 7 0 70
% of Total 29% 27% 34% 0% 10% 0% 100%
Clerical Staff Frequency 0 0 1 0 0 0 1
% of Total 0% 0% 100% 0% 0% 0% 100%
Full time student Frequency 27 4 25 0 12 2 70
% of Total 39% 6% 36% 0% 17% 3% 100%
Currently not
working/
Retiree
Frequency 2 2 2 0 1 2 9
% of Total 22% 22% 22% 0% 11% 22% 100%
Others Frequency 0 0 1 1 0 1 3
% of Total 0% 0% 33% 33% 0% 34% 100%
Chart 4.11 : Preferred brand by occupation
56
It can be observed that 34% of Manager/Executive group chose Reebok, followed by
Nike at 29%, and followed by Adidas 27%. As for full-time student group, 39% chose
Nike, 36% Reebok and 17% New Balance. As for the professional group, 75% chose
Nike, followed by Adidas, Reebok and New Balance at 8% each. In this analysis, the
groups clerical staff and others had very small respondents, so can be abandoned. This
suggests that Nike is more favorable to the professional and full-time student group,
Reebok is more favorable to the Manager/Executive group.
4.3 Reliability and Factor Analysis of Measures
4.3.1 Reliability Analysis
According to Malhotra and Birks (1999, p. 313), reliability refers to the extent to
which measurements of the particular test are repeatable. This means that the
outcomes of the measurement, in repeated sequences of measuring, must be
consistent. The greater the level of consistency in repeated sequences the greater the
reliability.
Reliability analysis using Cronbach‟s Alpha was conducted for both dimensions. The
value range of this coefficient is between 0 and 1. The value of the coefficient is
closer to 1 indicates the greater reliability.
In this study, Cronbach‟s alpha coefficients are used to examine the internal
consistency of the items, and items with adequate Cronbach‟s alphas are retained for
the scales.

57
The values of the coefficients calculated by using SPSS reliability procedure are
presented in Table 4.12.
Table 4.12: Reliability brand equity dimensions (Cronbach‟s Alpha)
Brand Equity Dimension Cronbach‟s Alpha Score
Perceived Quality 0.829
Brand Awareness 0.709
Brand Association 0.722
Brand Loyalty 0.829
Overall Brand Equity 0.686
The value of Cronbach‟s alpha for “overall brand equity” is calculated as a score of
0.686, which was very close to the traditional acceptable value of 0.70. Four other
constructs meet the recommended cut-off value. As a result, all of the constructs are
acceptable and a total of eighteen items are retained for the five constructs in the
study. More tables about reliability test (Chronbach‟s alpha) are shown in Appendix
B.
4.3.2 Factor Analysis
Factor analysis, a class of procedures primarily used for data reduction and
summarization (Malhotra and Birks, 1999, p. 760), is used to examine discriminant
validity. Factor loadings were obtained using SPSS factor analysis procedure in order
to create constructs.
58
The questionnaire was developed from a theoretical framework that was derived from
an extensive literature review.
This study was applied factor analysis procedure to test the variable to reconfirm
convergent of the entire factor adopted from the previous questionnaire (Tong and
Halwey, 2009).
The value of factor loadings indicates the strength of the relationship between the
item and the factor. The minimum requirements for the value of factor loadings is 0.3;
one should take into account all factor loadings with the value above 0.4 as important,
while those which have the value above 0.5 are considered significant (Sharma, 1996,
p. 111). Therefore, higher the factor loading, the claim that the item is represented by
the factor which is assigned to it, is more reliable.
Product brand equity consists of four factors: perceived quality, brand awareness,
brand association, and brand loyalty. The purpose of this section is to explain how the
scales for each of the constructs were developed.
The following are the value of factor loading of particular question consists in the
questionnaire which shown in the Table 4.13.
59
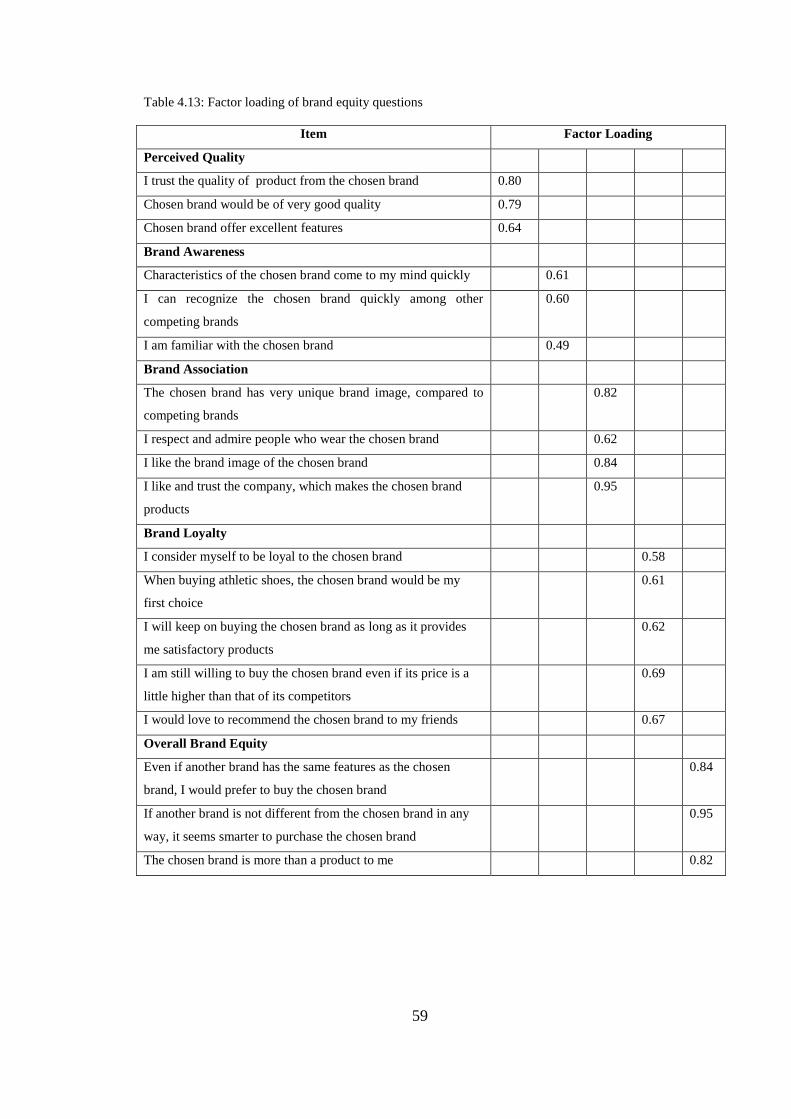
Table 4.13: Factor loading of brand equity questions
Item Factor Loading
Perceived Quality
I trust the quality of product from the chosen brand 0.80
Chosen brand would be of very good quality 0.79
Chosen brand offer excellent features 0.64
Brand Awareness
Characteristics of the chosen brand come to my mind quickly 0.61
I can recognize the chosen brand quickly among other
competing brands
0.60
I am familiar with the chosen brand 0.49
Brand Association
The chosen brand has very unique brand image, compared to
competing brands
0.82
I respect and admire people who wear the chosen brand 0.62
I like the brand image of the chosen brand 0.84
I like and trust the company, which makes the chosen brand
products
0.95
Brand Loyalty
I consider myself to be loyal to the chosen brand 0.58
When buying athletic shoes, the chosen brand would be my
first choice
0.61
I will keep on buying the chosen brand as long as it provides
me satisfactory products
0.62
I am still willing to buy the chosen brand even if its price is a
little higher than that of its competitors
0.69
I would love to recommend the chosen brand to my friends 0.67
Overall Brand Equity
Even if another brand has the same features as the chosen
brand, I would prefer to buy the chosen brand
0.84
If another brand is not different from the chosen brand in any
way, it seems smarter to purchase the chosen brand
0.95
The chosen brand is more than a product to me 0.82
60
Perceived quality: This factor is measured by three items of question included in the
questionnaire. Perceived quality refers to the extent to which consumers perceive the
quality of product. Factor loading scores are presented in Table 4.13. As one can see
all factor loadings for Perceived Quality construct are highly significant (above 0.50).
The highest factor loading is for the 1st item = 0.80 and the lowest factor loading is for
the 3rd item = 0.64 (above 0.50). Therefore, all items formed the perceived quality.
Brand awareness: This component consists of three items of question included in the
questionnaire. This construct measures how consumers aware on brand in question. It
can be seen in Table 4.13 that loadings on this factor are highly significant except
one. The highest factor loading is = 0.61 and the lowest is the factor loading is = 0.49
which is very close to 0.50. Therefore, all three items included formed the brand
awareness scale.
Brand association: This factor consists of four items of question included in the
questionnaire. This construct measures the extent to which the consumers perceive the
brand association as positive. Factor loadings on this factor are presented in Table
4.13, and it can be seen that factor loadings are highly significant (above 0.50). The
highest factor loading is the 4th
item = 0.95 and the lowest factor loading is the 2nd
item = 0.62. Therefore, all five items formed the brand association scale.
Brand loyalty: This component consists of five items of question included in the
questionnaire. This construct measures how consumers loyalty on the brand in
question. It can be seen in Table 4.13 that loadings on this factor are highly significant
(above 0.50). The highest factor loading is the 4th
item = 0.69 and the lowest is the
61
factor loading is the 1st item = 0.59. Therefore, all five items included formed the
brand loyalty scale.
Overall brand equity: This factor consists of three items of question included in the
questionnaire. This construct measures the extent to which the consumers perceive
regarding the overall brand equity as positive. Factor loadings on this factor are
presented in Table 4.13, and it can be seen that factor loadings are highly significant
(above 0.50). The highest factor loading is the 2nd
item = 0.95 and the lowest factor
loading is the 3rd
item = 0.82. Therefore, all five items formed the overall brand equity
scale.
4.4 Brand Equity Analysis by Brand
In a likert scale, usually above 3.00 mean represents agree, and our comment will be
based on the mean value. In the Table 4.14 shows the respondents‟ opinions on the
level of agreement of brand equity factors to the respondents.
Table 4.14: The analysis of brand equity perception
Brand equity factor Mean S.D. Level of
Agreement
Perceived Quality
I trust the quality of product from the chosen brand 4.05 0.656 Agree
Chosen brand would be of very good quality 3.94 0.722 Agree
Chosen brand offer excellent features 3.94 0.621 Agree
Total 3.94 0.621 Agree
Brand Awareness
Characteristics of the chosen brand come to my mind quickly 3.87 0.700 Agree
I can recognize the chosen brand quickly among other
competing brands
3.99 0.855 Agree
I am familiar with the chosen brand 3.96 0.811 Agree
Total 3.94 0.628 Agree
62
Brand Association
The chosen brand has very unique brand image, compared to
competing brands
3.62 0.799 Agree
I respect and admire people who wear the chosen brand 3.06 0.935 Neutral
I like the brand image of the chosen brand 3.65 0.779 Agree
I like and trust the company, which makes the chosen brand
products
3.61 0.786 Agree
Total 3.48 0.611 Agree
Brand Loyalty
I consider myself to be loyal to the chosen brand 3.32 0.950 Agree
When buying athletic shoes, the chosen brand would be my
first choice
3.62 0.906 Agree
I will keep on buying the chosen brand as long as it provides
me satisfied products
3.83 0.888 Agree
I am still willing to buy the chosen brand even if its price is a
little higher than that of its competitors
3.36 1.059 Agree
I would love to recommend the chosen brand to my friends 3.53 0.927 Agree
Total 3.53 0.730 Agree
Overall Brand Equity
Even if another brand has the same features as the chosen
brand, I would prefer to buy the chosen brand
3.65 0.779 Agree
If another brand is not different from the chosen brand in any
way, it seems smarter to purchase the chosen brand
3.61 0.786 Agree
The chosen brand is more than a product to me 3.62 0.799 Agree
Total 3.62 0.617 Agree
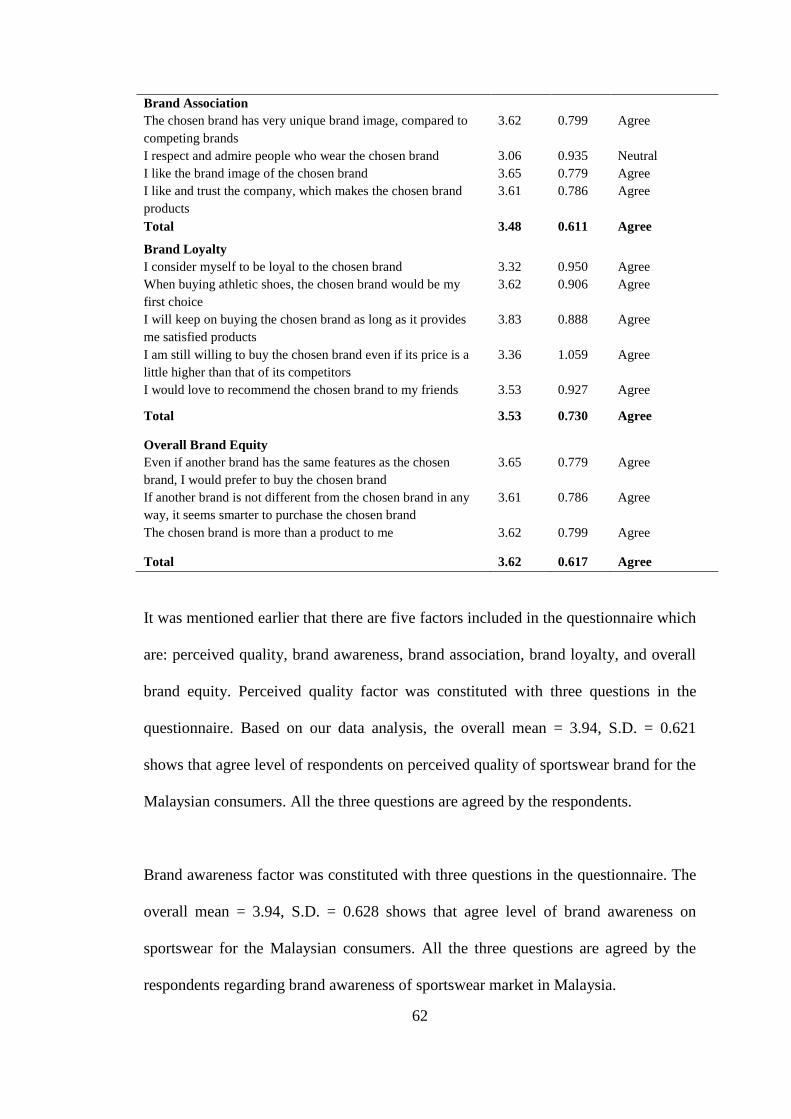
It was mentioned earlier that there are five factors included in the questionnaire which
are: perceived quality, brand awareness, brand association, brand loyalty, and overall
brand equity. Perceived quality factor was constituted with three questions in the
questionnaire. Based on our data analysis, the overall mean = 3.94, S.D. = 0.621
shows that agree level of respondents on perceived quality of sportswear brand for the
Malaysian consumers. All the three questions are agreed by the respondents.
Brand awareness factor was constituted with three questions in the questionnaire. The
overall mean = 3.94, S.D. = 0.628 shows that agree level of brand awareness on
sportswear for the Malaysian consumers. All the three questions are agreed by the
respondents regarding brand awareness of sportswear market in Malaysia.
63
Brand association factor was constituted with four questions in the questionnaire. The
overall mean = 3.48, S.D. = 0.611 shows that agree level of brand association on
sportswear market for the Malaysian consumers. The question no.2 shows the neutral
level and the question no.1, 3, and 4 shows agree level regarding brand association of
sportswear market in Malaysia.
Brand loyalty factor was constituted with five questions in the questionnaire. The
overall mean = 3.53, S.D. = 0.730 shows the agree level of brand loyalty on
sportswear for the Malaysian consumers. All five questions of brand loyalty shows
that agree level regarding brand loyalty of sportswear market in Malaysia.
Overall brand equity factor was constituted with three questions in the questionnaire.
The overall mean = 3.62, S.D. = 0.617 shows the agree level of overall brand equity
on sportswear product for the Malaysian consumers. All the three questions are
agreed by the respondents regarding overall brand equity of sportswear market in
Malaysia.
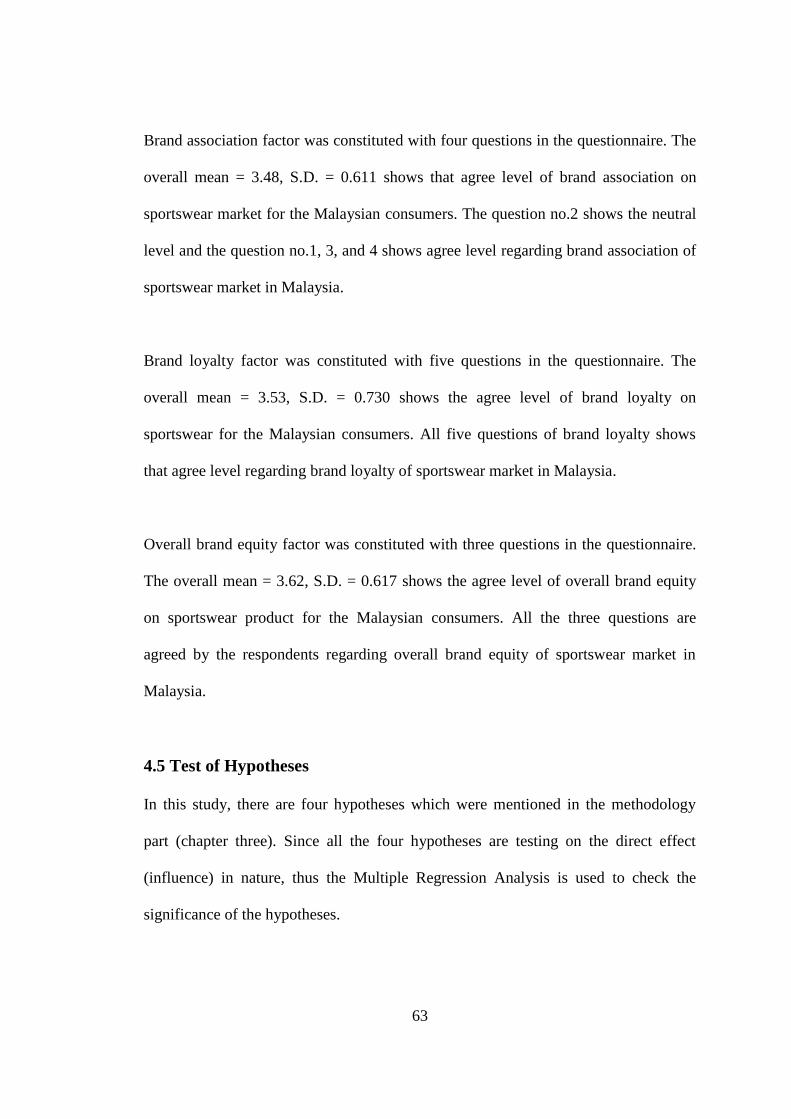
4.5 Test of Hypotheses
In this study, there are four hypotheses which were mentioned in the methodology
part (chapter three). Since all the four hypotheses are testing on the direct effect
(influence) in nature, thus the Multiple Regression Analysis is used to check the
significance of the hypotheses.
64
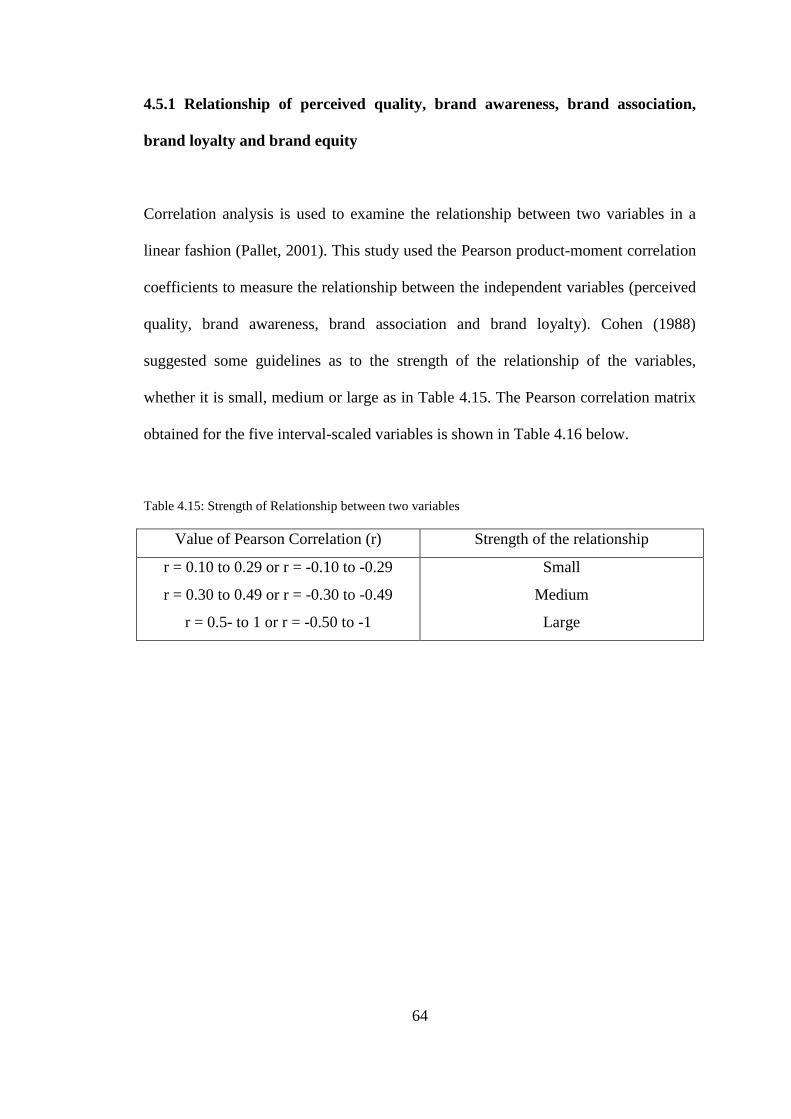
4.5.1 Relationship of perceived quality, brand awareness, brand association,
brand loyalty and brand equity
Correlation analysis is used to examine the relationship between two variables in a
linear fashion (Pallet, 2001). This study used the Pearson product-moment correlation
coefficients to measure the relationship between the independent variables (perceived
quality, brand awareness, brand association and brand loyalty). Cohen (1988)
suggested some guidelines as to the strength of the relationship of the variables,
whether it is small, medium or large as in Table 4.15. The Pearson correlation matrix
obtained for the five interval-scaled variables is shown in Table 4.16 below.
Table 4.15: Strength of Relationship between two variables
Value of Pearson Correlation (r) Strength of the relationship
r = 0.10 to 0.29 or r = -0.10 to -0.29
r = 0.30 to 0.49 or r = -0.30 to -0.49
r = 0.5- to 1 or r = -0.50 to -1
Small
Medium
Large
65
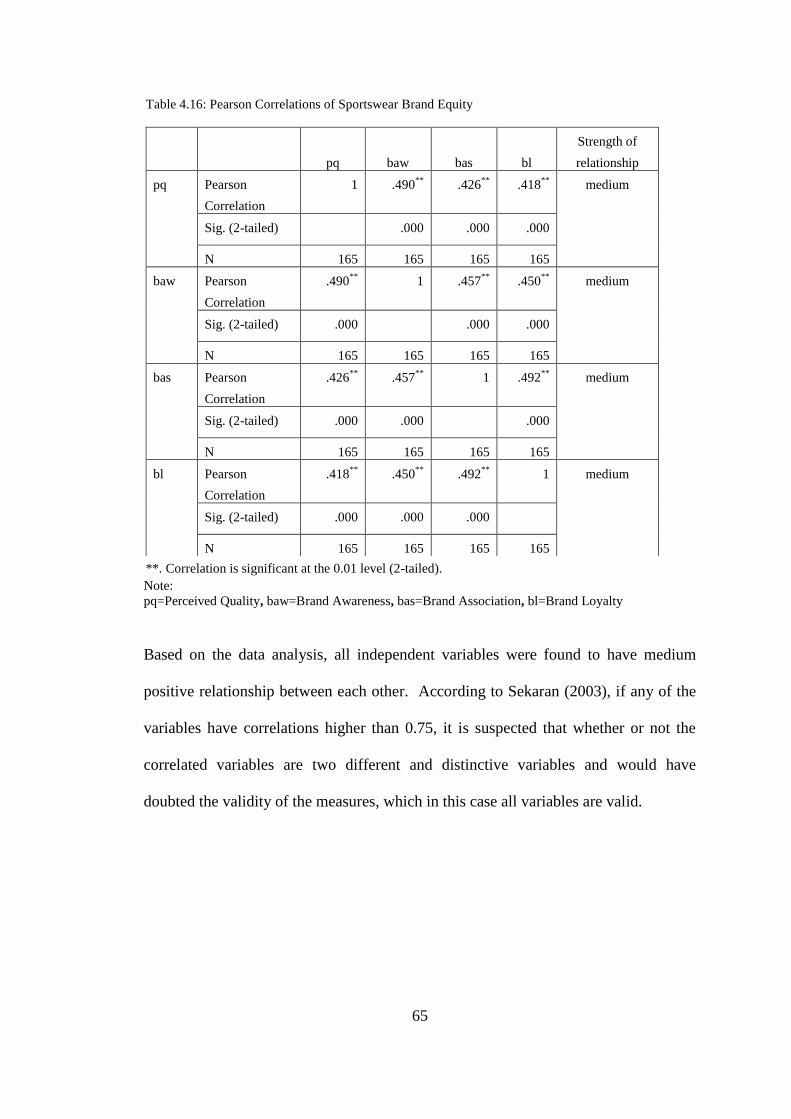
Table 4.16: Pearson Correlations of Sportswear Brand Equity
pq baw bas bl
Strength of
relationship
pq Pearson
Correlation
1 .490**
.426**
.418**
medium
Sig. (2-tailed)
.000 .000 .000
N 165 165 165 165
baw Pearson
Correlation
.490**
1 .457**
.450**
medium
Sig. (2-tailed) .000
.000 .000
N 165 165 165 165
bas Pearson
Correlation
.426**
.457**
1 .492**
medium
Sig. (2-tailed) .000 .000
.000
N 165 165 165 165
bl Pearson
Correlation
.418**
.450**
.492**
1 medium
Sig. (2-tailed) .000 .000 .000
N 165 165 165 165
**. Correlation is significant at the 0.01 level (2-tailed).
Note:
pq=Perceived Quality, baw=Brand Awareness, bas=Brand Association, bl=Brand Loyalty
Based on the data analysis, all independent variables were found to have medium
positive relationship between each other. According to Sekaran (2003), if any of the
variables have correlations higher than 0.75, it is suspected that whether or not the
correlated variables are two different and distinctive variables and would have
doubted the validity of the measures, which in this case all variables are valid.
66
4.5.2 Multiple Regression Analysis
Multiple regression analysis is done to examine the simultaneous effects of several
independent variables on a dependant variable that is interval scaled (Sekaran, 2003).
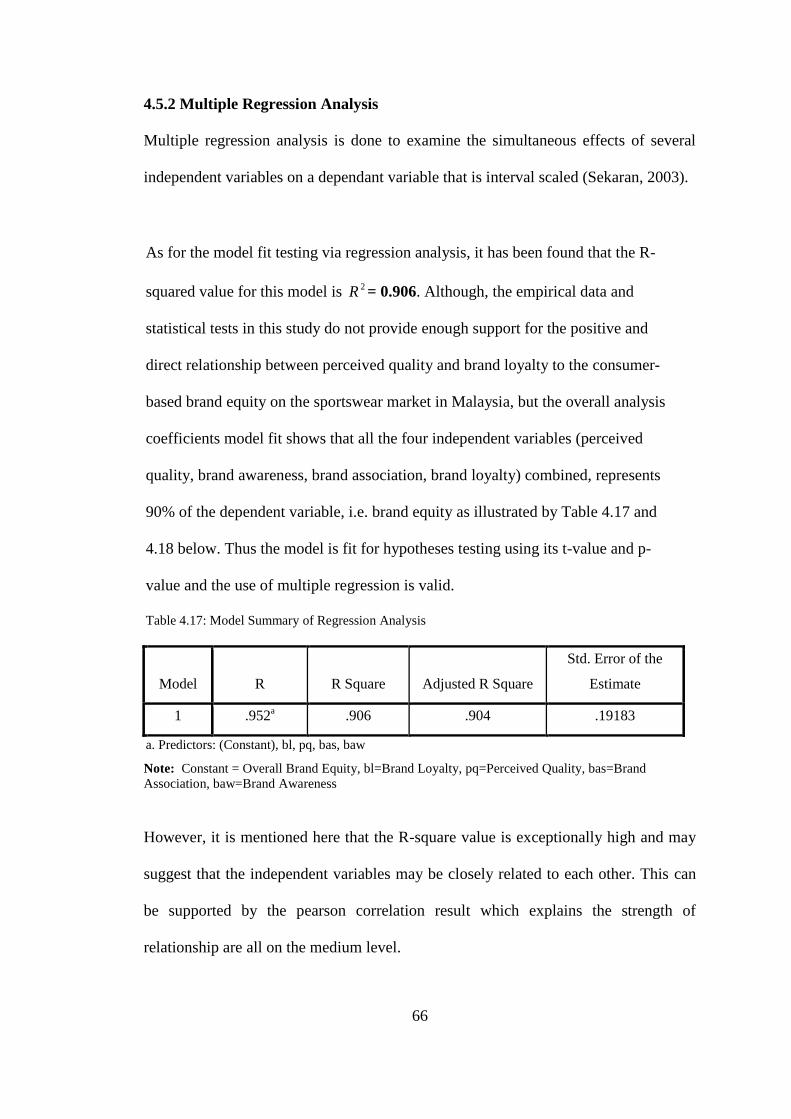
As for the model fit testing via regression analysis, it has been found that the R-
squared value for this model is 2R = 0.906. Although, the empirical data and
statistical tests in this study do not provide enough support for the positive and
direct relationship between perceived quality and brand loyalty to the consumer-
based brand equity on the sportswear market in Malaysia, but the overall analysis
coefficients model fit shows that all the four independent variables (perceived
quality, brand awareness, brand association, brand loyalty) combined, represents
90% of the dependent variable, i.e. brand equity as illustrated by Table 4.17 and
4.18 below. Thus the model is fit for hypotheses testing using its t-value and p-
value and the use of multiple regression is valid.
Table 4.17: Model Summary of Regression Analysis
Model R R Square Adjusted R Square
Std. Error of the
Estimate
1 .952a .906 .904 .19183
a. Predictors: (Constant), bl, pq, bas, baw
Note: Constant = Overall Brand Equity, bl=Brand Loyalty, pq=Perceived Quality, bas=Brand
Association, baw=Brand Awareness
However, it is mentioned here that the R-square value is exceptionally high and may
suggest that the independent variables may be closely related to each other. This can
be supported by the pearson correlation result which explains the strength of
relationship are all on the medium level.
67
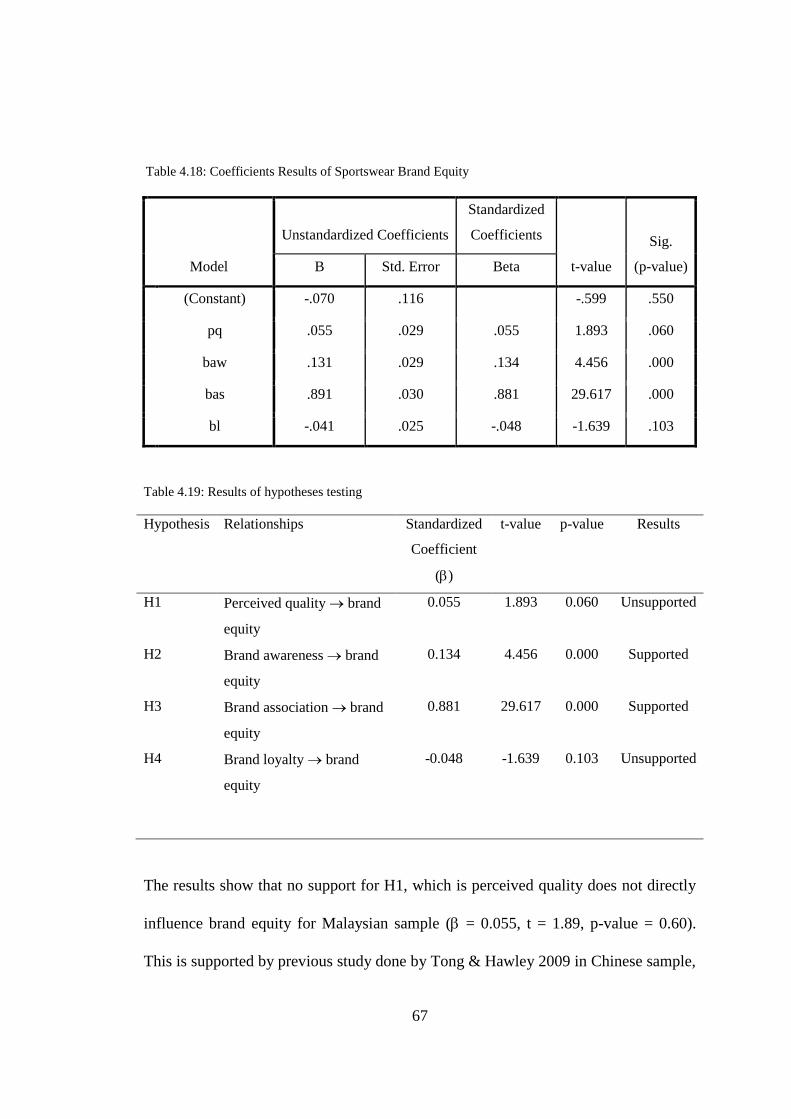
Table 4.18: Coefficients Results of Sportswear Brand Equity
Model
Unstandardized Coefficients
Standardized
Coefficients
t-value
Sig.
(p-value) B Std. Error Beta
(Constant) -.070 .116 -.599 .550
pq .055 .029 .055 1.893 .060
baw .131 .029 .134 4.456 .000
bas .891 .030 .881 29.617 .000
bl -.041 .025 -.048 -1.639 .103
Table 4.19: Results of hypotheses testing
Hypothesis Relationships Standardized
Coefficient
()
t-value p-value Results
H1 Perceived quality brand
equity
0.055 1.893 0.060 Unsupported
H2 Brand awareness brand
equity
0.134 4.456 0.000 Supported
H3 Brand association brand
equity
0.881 29.617 0.000 Supported
H4 Brand loyalty brand
equity
-0.048 -1.639 0.103 Unsupported
The results show that no support for H1, which is perceived quality does not directly
influence brand equity for Malaysian sample ( = 0.055, t = 1.89, p-value = 0.60).
This is supported by previous study done by Tong & Hawley 2009 in Chinese sample,
68
which also indicated that perceived quality did not influence brand equity. As for H2,
the result showed strong support for brand awareness influencing brand equity ( =
0.134, t = 4.45, p-value = 0.00) as also supported by study done by (Kim, K. H., Kim,
K. S., Kim, D. Y., Kim, J. H. & Kang, S. H., 2008), which found brand awareness
positively affect brand equity for hospital marketing in Korea.
Next is for brand association, H3, the result showed that there is strong support that
brand association has direct effect on brand equity ( = 0.881, t = 29.61, p-value =
0.00), as also supported by the finding from Tong and Hawley 2009 in China.
However for H4, the result showed that there is no support for brand loyalty
influencing brand equity ( = -0.048, t = -1.639, p-value = 0.103). This finding is
supported by the study done by (Kim et. al.. 2008) but contradicts with the study done
by Tong and Hawley (2009) which indicated that brand loyalty had influence in brand
equity.
The results above indicate that brand awareness and brand association are the two
most important components of brand equity, as the foundation to brand equity. This
suggests that one must be aware of the brand and want to be associated to the brand
before one decides whether the brand is worth buying or not. According to Chen
(2001), brand association is the core asset for the building strong brand equity
compared to three other assets of Aaker‟s –brand awareness, brand loyality, and
perceived quality. He addressed several reasons for his argument. First, brand
awareness is a necessary asset but not sufficient for building strong brand equity.
Second, the other brand equity dimensions enhance brand loyalty. The perceived
quality, the association, and the well-known name can provide reasons to buy and
69
affect user satisfaction, which results to brand loyalty. Nevertheless, brand loyalty is
sometimes excluded from the conceptualization of brand equity. This is because
consumers may be in the habit of buying a particular brand without really thinking
much about why. Finally, the perceived quality is one kind of brand association. The
concept of brand knowledge also focuses on the association network.
It is not surprising to find that perceived quality and brand loyalty do not affect brand
equity as much as brand awareness and brand association. Although according to
Aaker, 1996, perceived quality is one of the key dimensions of brand equity –it is the
core construct in the total research approach to measuring brand equity, Malaysian
market is not applicable such. Brand equity is highly associated with key brand equity
measures, including specific functional benefit variables. Hence, perceived quality
only provides a surrogate variable for other more specific elements of brand equity
(Aaker, 1996)
As for brand loyalty, according to Brexendorf et al. (2009), sustaining brand loyalty is
a key challenge in increasingly competitive markets. Brand loyalty generates
numerous benefits like erecting barriers to competitors, generating greater sales and
revenues, reducing customer acquisition costs, and inhibiting customers' susceptibility
to marketing efforts of competitors. They also mentioned that brand loyalty is the
central concern of brand equity. Building brand loyalty requires investments in
marketing programs that target current and potential consumer. Through the
marketing programs brand loyalty can influence to the consumers' mindset and may
influence the result in a number of different outcomes, such as brand awareness,
brand associations, attitude and behavior towards the brand. However, it can be

70
concluded here that Malaysian consumers are not ready to be brand loyal to a
particular brand, as there are many suggested attributes that can co-influence this
factor.
It is interesting to look at the brand loyalty result whereby Malaysian and Korean
sample showed no influence with brand equity whereas the Chinese sample showed
there is influence. Why brand loyalty has negative relationship with sportswear brand
equity particularly in Malaysia? There are many reasons why brand loyalty has
negative relationship with brand equity. To name a few:
Price
Brand style
Store environment
Service quality
Religion and cultural affect
Price:
Price is probably the most important consideration for the average consumer.
Consumers with high brand loyalty are willing to pay a premium price for their
favored brand, so, their purchase intention is not easily affected by price (Cadogan
and Foster, 2000).
According to Bucklin et al. (1998), price significantly influences consumer choice
and incidence of purchase. They highlighted that discount pricing makes households
switch brands and buy products earlier than needed. Price is described as the quantity
of payment or compensation for something. It indicates price as an exchange ratio

71
between goods that pay for each other. Price also communicates to the market the
company‟s intended value positioning of its product or brand.
Bases on above discussion it can be understood that price has strong impact on brand
loyalty. If sportswear brand price is high, then consumers can switch to the alternative
brands which brand price is lower than their favorite brand.
Brand style:
According to Sproles and Kendall (1986), fashion consciousness is generally defined
as an awareness of new styles, changing fashions, and attractive styling, as well as the
desire to buy something exciting and trendy.
Research conducted by Duff (1999) investigated the niche market in women‟s
sportswear, and the results showed that sportswear shoppers were becoming more
fashion conscious and were demanding products with more style; furthermore,
consumers have a tendency to wear different attires for different occasions. However,
if there is any problem in the style of sportswear brand, then consumers can lose
interest in buying their preferred brand.
Store Environment:
Store location, store internal environment and layout is very important to the brand
loyalty. If consumers find the store to be highly accessible during their shopping trip
and are satisfied with the store‟s assortment and services, these consumers may
become loyal afterwards (Evans et al., 1996). Thus, a store‟s atmosphere is one of the
factors that could influence consumer‟s decision making.
72
On the other hand, if consumers find the store to be difficult accessible due to the
poor store layout, noises, bad odour, high temperature in the store, narrow shelf space,
unclear signage, and poor colors (Abraham and Littrell, 1995), which may affect
consumers loyalty to that particular brand.
Service Quality:
The impact of salespeople-consumer relationships will generally result in long term
orientation of consumers towards the store or brand. Trust in salespeople appears to
relate to overall perceptions of the store‟s service quality, and results in the consumer
being totally satisfied with the stores in the end. Additionally, personalization (i.e.
reliability, and responsiveness) significantly influence consumers‟ experience and
evaluation of service, and in turn, affects the brand loyalty of consumers (Yee and
Sidek 2008). However, if brand service quality is poor, then consumers can lost their
faith on their preferable brand and they try to find some other alternative brands
which service quality is better than previous brand.
Religion and Cultural Affect:
Religion and cultural affect is one of the important factors for the brand loyalty in the
sportswear market. Different country has different religion and different culture. Due
to the different culture and religion consumer has different faith on the different
brand. For example, China and Malaysia country has different culture and different
religion. The majority of Chinese consumers are Buddhist, whereas Malaysian
consumers are Muslim. Due to the cultural difference and different religion faith,
Malaysian consumers may not have different ways of responding to the brands as
73
supposed to the Chinese. Many underlying reasons could be thought of but no study
has been properly done to compare between Malaysian and Chinese consumer
behavior basing on religion and cultural values.
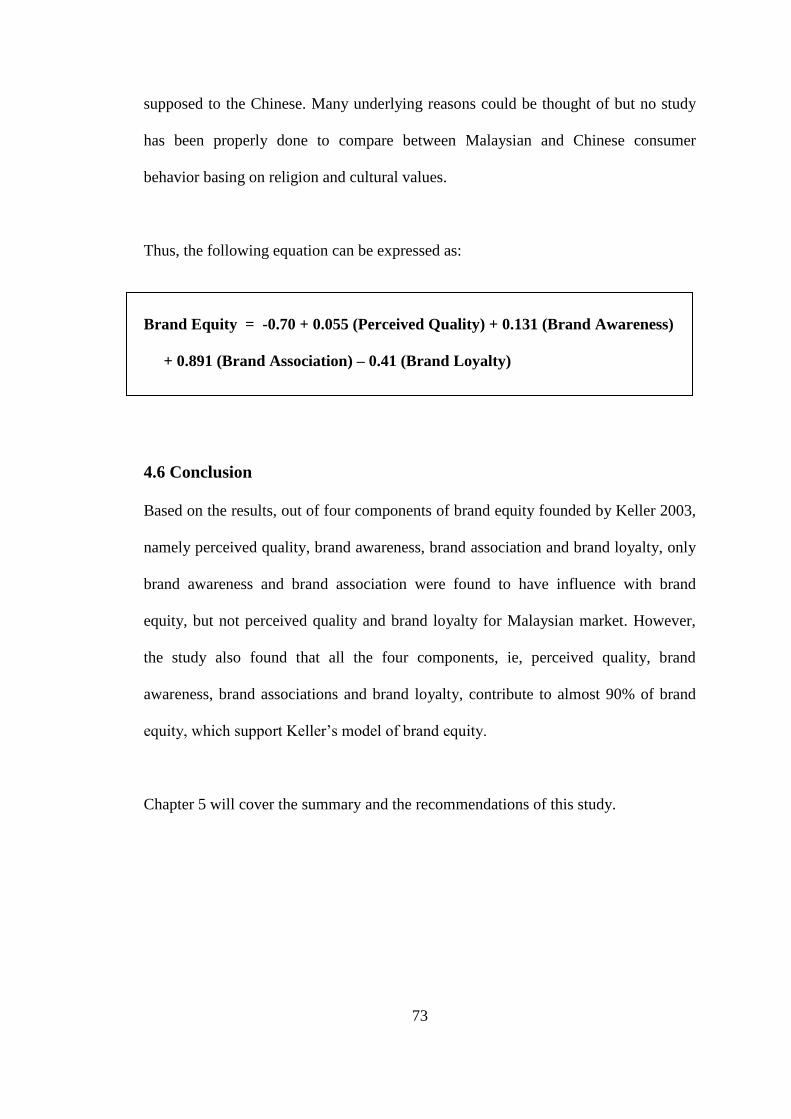
Thus, the following equation can be expressed as:
Brand Equity = -0.70 + 0.055 (Perceived Quality) + 0.131 (Brand Awareness)
+ 0.891 (Brand Association) – 0.41 (Brand Loyalty)
4.6 Conclusion
Based on the results, out of four components of brand equity founded by Keller 2003,
namely perceived quality, brand awareness, brand association and brand loyalty, only
brand awareness and brand association were found to have influence with brand
equity, but not perceived quality and brand loyalty for Malaysian market. However,
the study also found that all the four components, ie, perceived quality, brand
awareness, brand associations and brand loyalty, contribute to almost 90% of brand
equity, which support Keller‟s model of brand equity.
Chapter 5 will cover the summary and the recommendations of this study.


![The battle of Alcazar, 1597 [i.e. 1594]](https://img.pdfslide.us/doc/110x75/62af07cfb95ab3016872cd6c/the-battle-of-alcazar-1597-ie-1594.jpg)