Embed Size (px)
DESCRIPTION
Chapter Four. Cost Volume Profit Analysis. Cost Behavior. A cost is classified as either fixed or variable, according to whether the total amount of the cost changes as activity changes. - PowerPoint PPT Presentation
Citation preview
Chapter Four
Cost Volume Profit Analysis
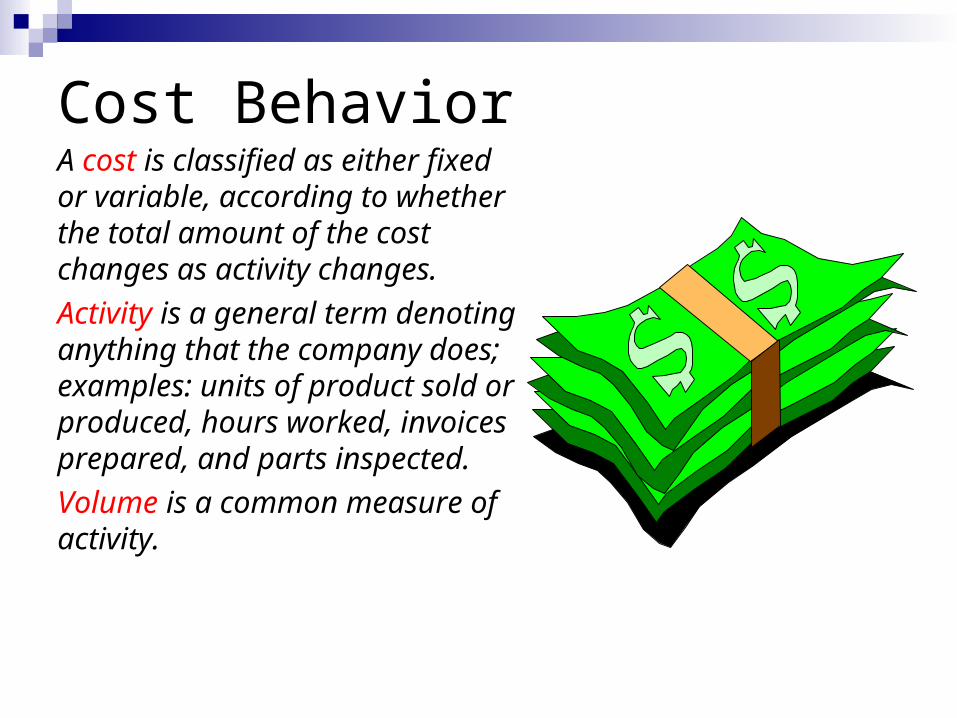
Cost BehaviorA cost is classified as either fixed or variable, according to whether the total amount of the cost changes as activity changes.
Activity is a general term denoting anything that the company does; examples: units of product sold or produced, hours worked, invoices prepared, and parts inspected.
Volume is a common measure of activity.
Definitions
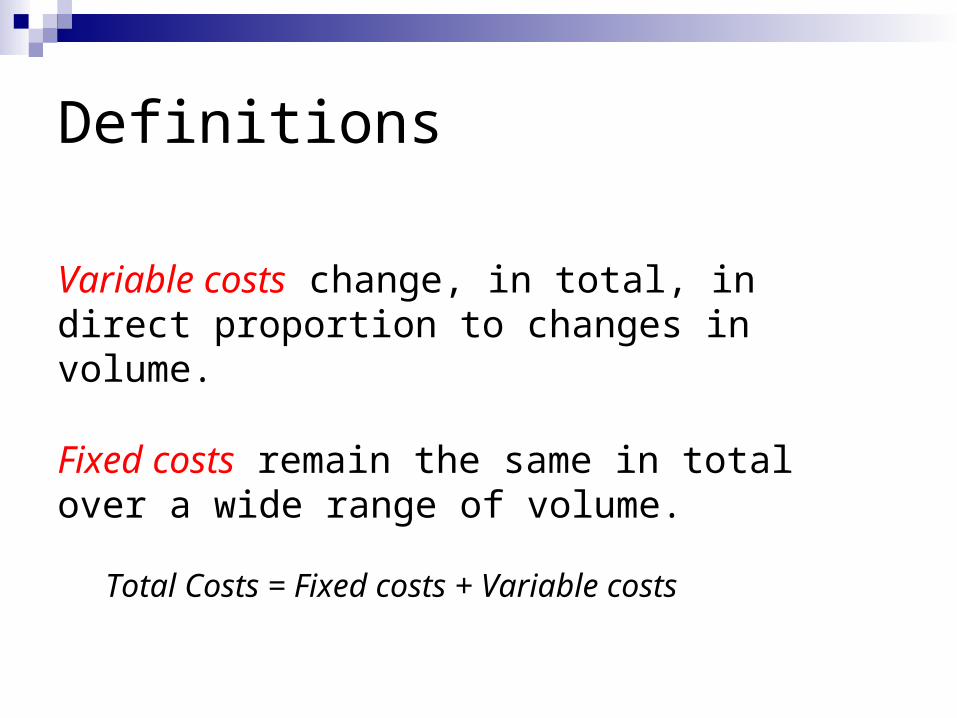
Variable costs change, in total, in direct proportion to changes in volume.
Fixed costs remain the same in total over a wide range of volume.
Total Costs = Fixed costs + Variable costs
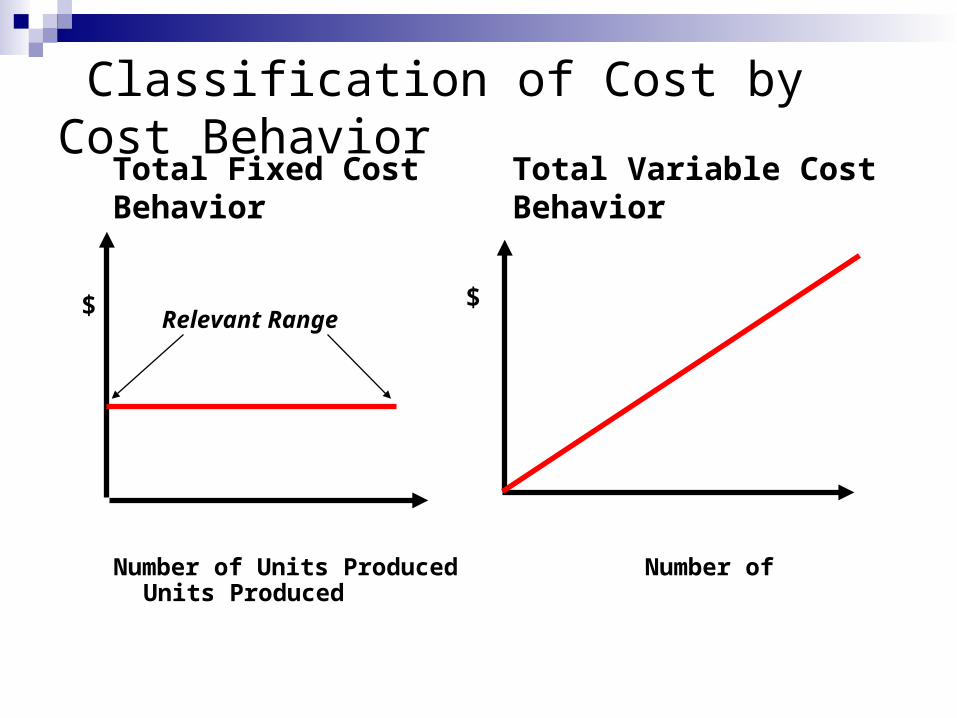
Classification of Cost by Cost BehaviorTotal Fixed Cost Behavior
Total Variable Cost Behavior
$$ Relevant Range
Number of Units Produced Number of Units Produced
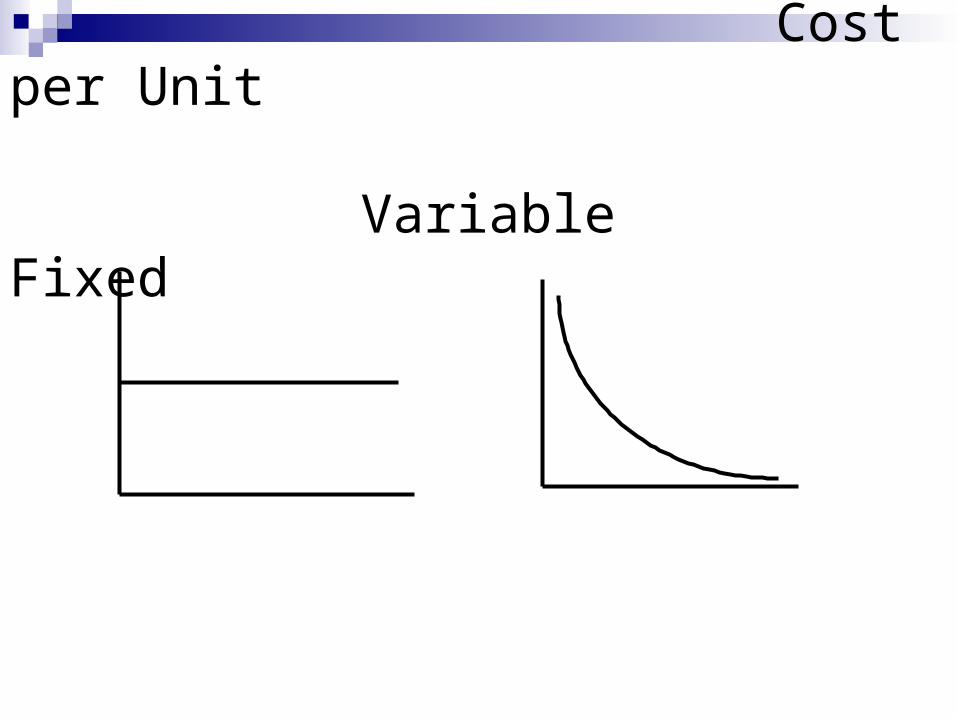
Cost per Unit
Variable Fixed
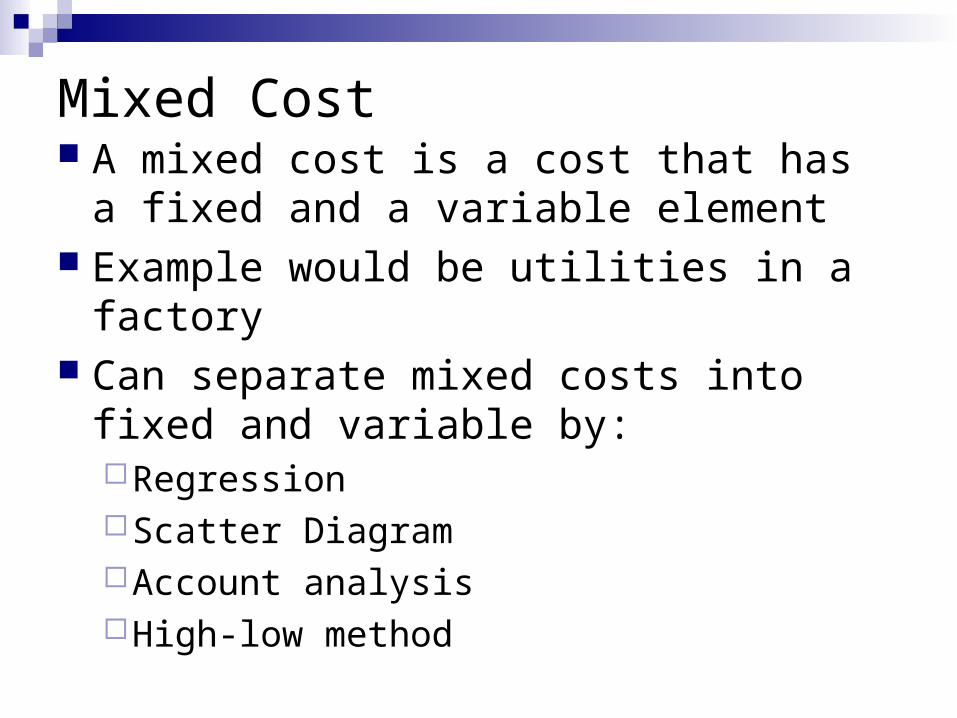
Mixed Cost A mixed cost is a cost that has a fixed and
a variable element Example would be utilities in a factory Can separate mixed costs into fixed and
variable by:RegressionScatter DiagramAccount analysisHigh-low method
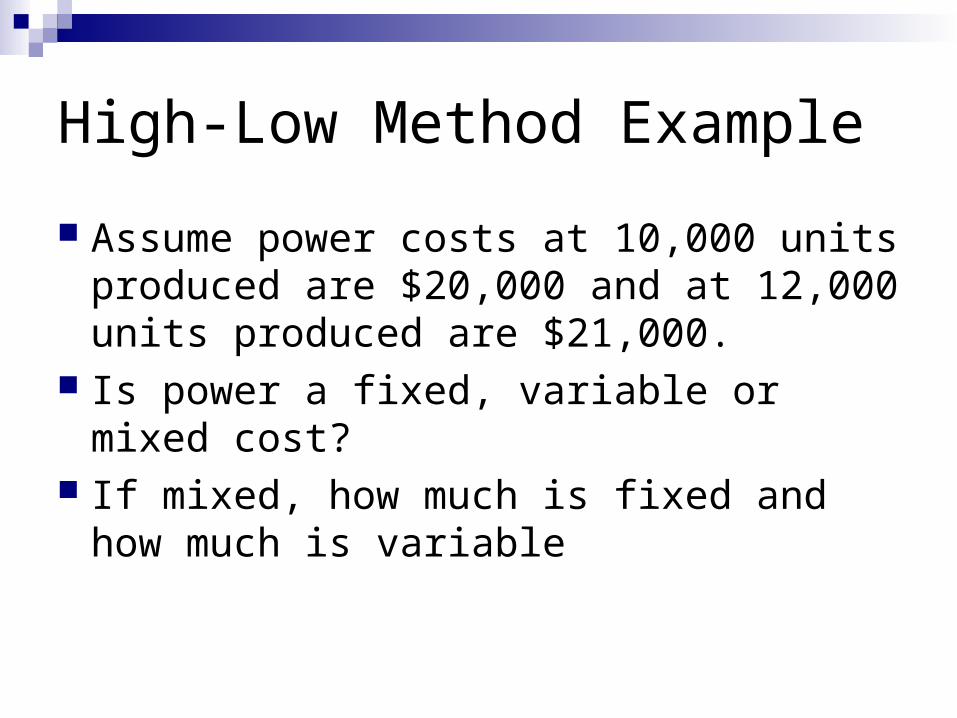
High-Low Method Example
Assume power costs at 10,000 units produced are $20,000 and at 12,000 units produced are $21,000.
Is power a fixed, variable or mixed cost? If mixed, how much is fixed and how much
is variable
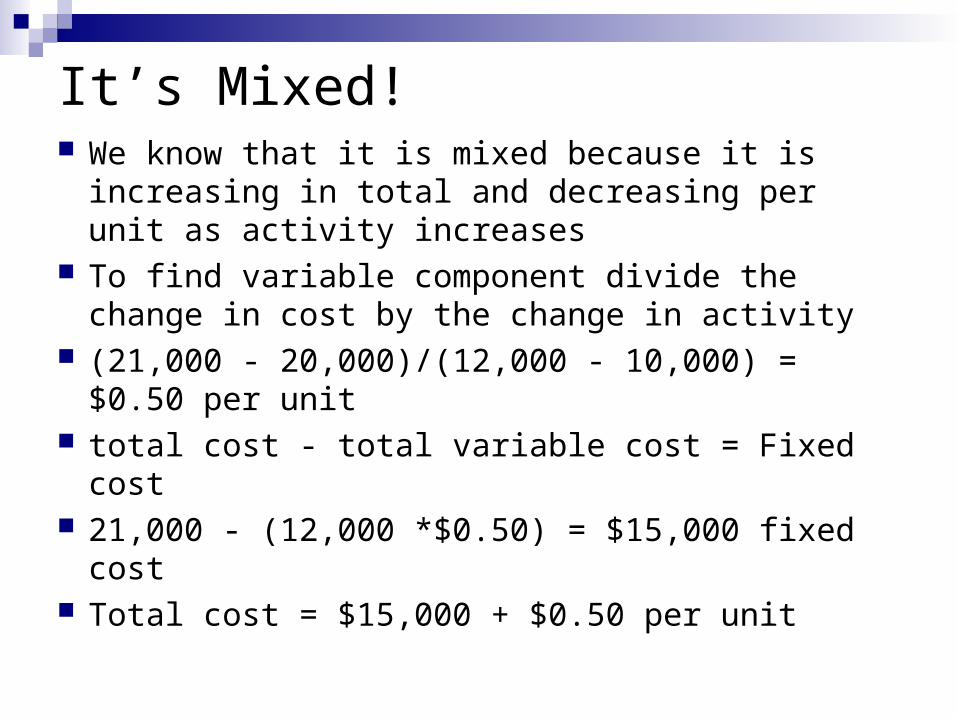
It’s Mixed! We know that it is mixed because it is increasing
in total and decreasing per unit as activity increases
To find variable component divide the change in cost by the change in activity
(21,000 - 20,000)/(12,000 - 10,000) = $0.50 per unit
total cost - total variable cost = Fixed cost 21,000 - (12,000 *$0.50) = $15,000 fixed cost Total cost = $15,000 + $0.50 per unit
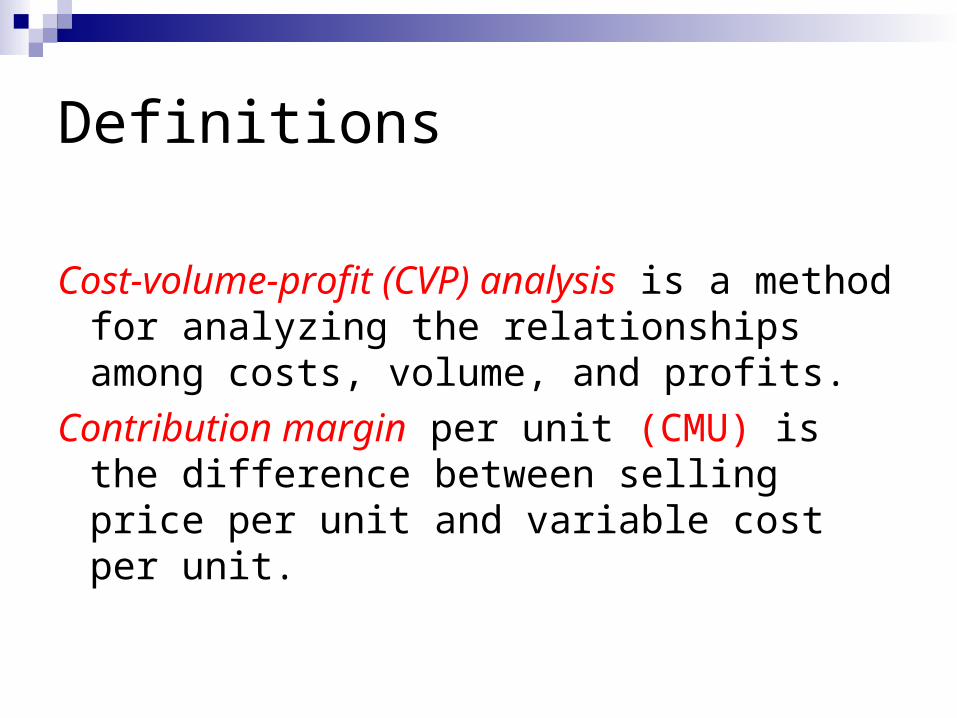
Definitions
Cost-volume-profit (CVP) analysis is a method for analyzing the relationships among costs, volume, and profits.
Contribution margin per unit (CMU) is the difference between selling price per unit and variable cost per unit.
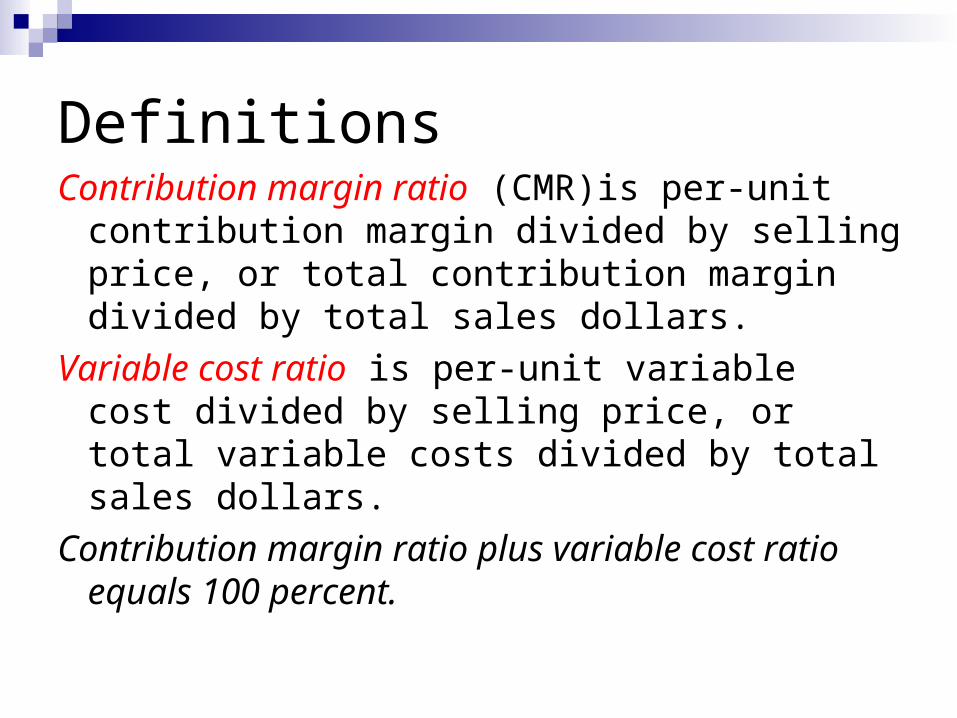
DefinitionsContribution margin ratio (CMR)is per-unit
contribution margin divided by selling price, or total contribution margin divided by total sales dollars.
Variable cost ratio is per-unit variable cost divided by selling price, or total variable costs divided by total sales dollars.
Contribution margin ratio plus variable cost ratio equals 100 percent.
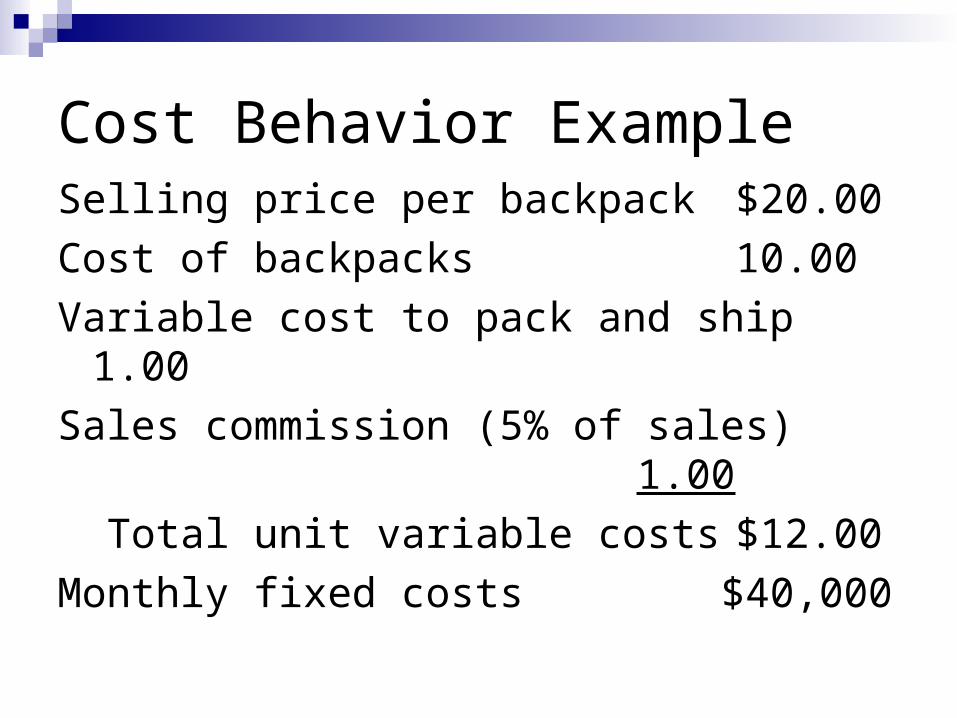
Cost Behavior ExampleSelling price per backpack $20.00
Cost of backpacks 10.00
Variable cost to pack and ship 1.00
Sales commission (5% of sales) 1.00
Total unit variable costs $12.00
Monthly fixed costs $40,000
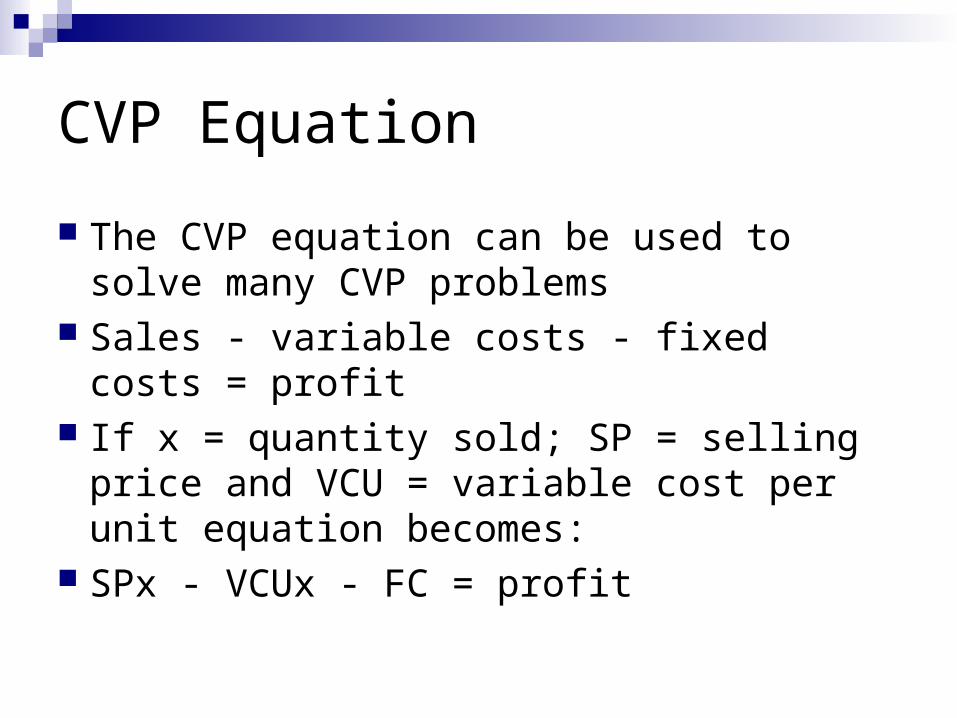
CVP Equation
The CVP equation can be used to solve many CVP problems
Sales - variable costs - fixed costs = profit If x = quantity sold; SP = selling price and
VCU = variable cost per unit equation becomes:
SPx - VCUx - FC = profit
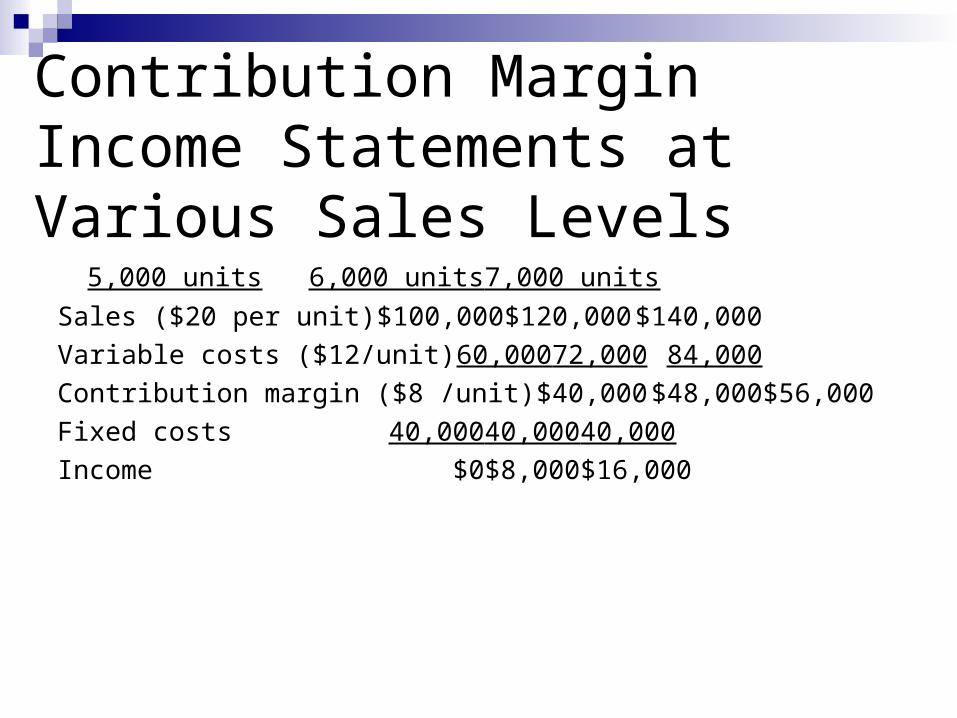
Contribution Margin Income Statements at Various Sales Levels
5,000 units 6,000 units 7,000 units
Sales ($20 per unit) $100,000 $120,000 $140,000
Variable costs ($12/unit) 60,000 72,000 84,000
Contribution margin ($8 /unit)$40,000 $48,000 $56,000
Fixed costs 40,000 40,000 40,000
Income $0 $8,000 $16,000
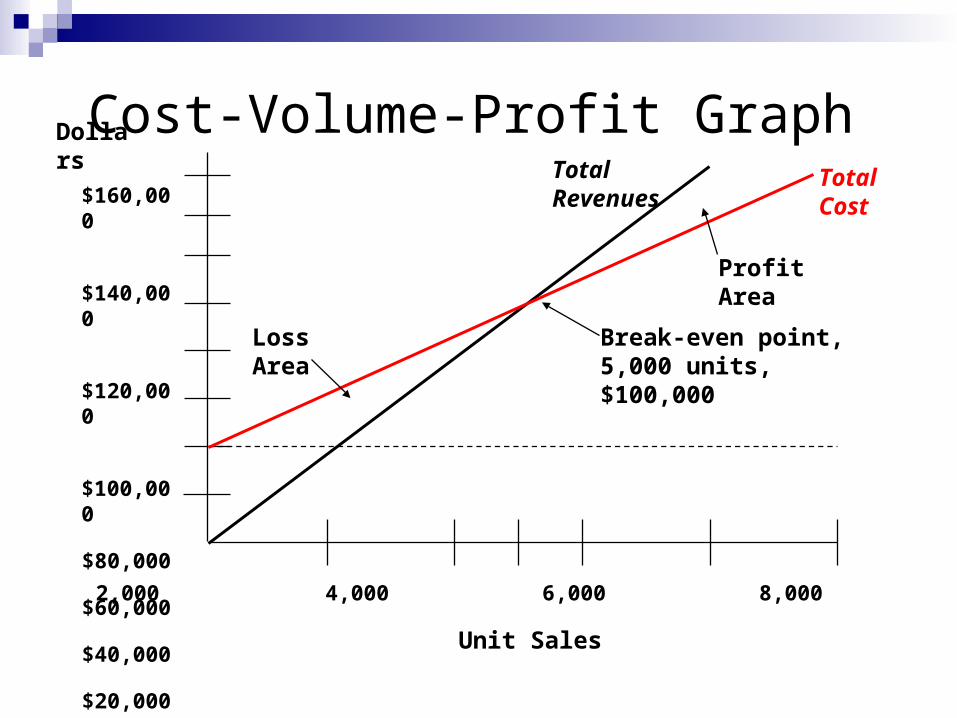
Cost-Volume-Profit Graph$160,000
$140,000
$120,000
$100,000
$80,000
$60,000
$40,000
$20,000
$0
2,000 4,000 6,000 8,000 10,000
Unit Sales
Dollars
Break-even point,5,000 units, $100,000
TotalCost
TotalRevenues
LossArea
Profit Area
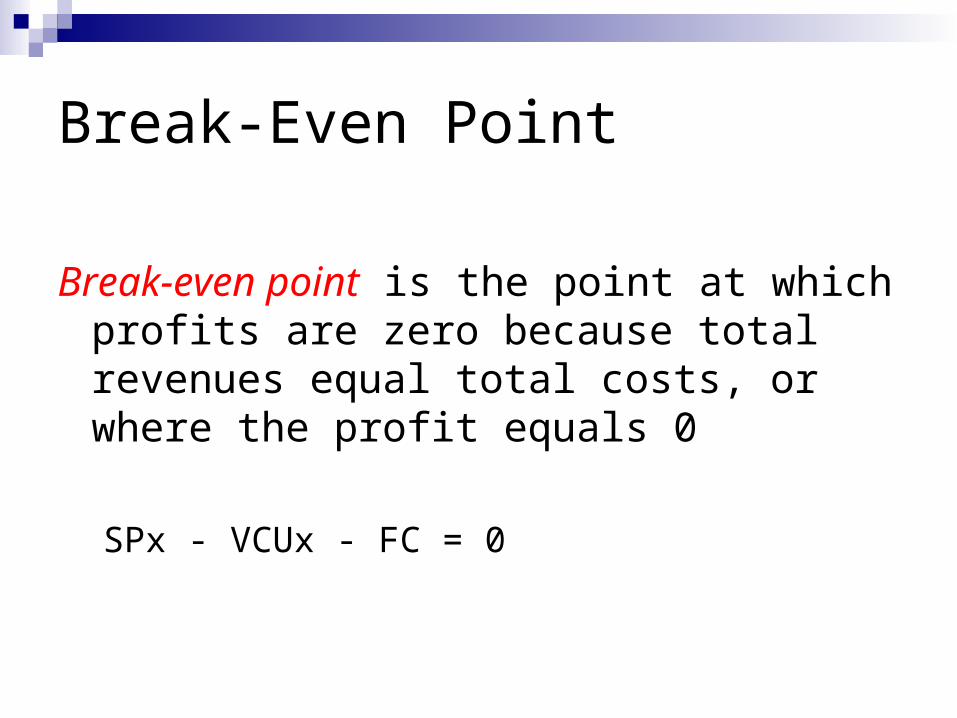
Break-Even Point
Break-even point is the point at which profits are zero because total revenues equal total costs, or where the profit equals 0
SPx - VCUx - FC = 0
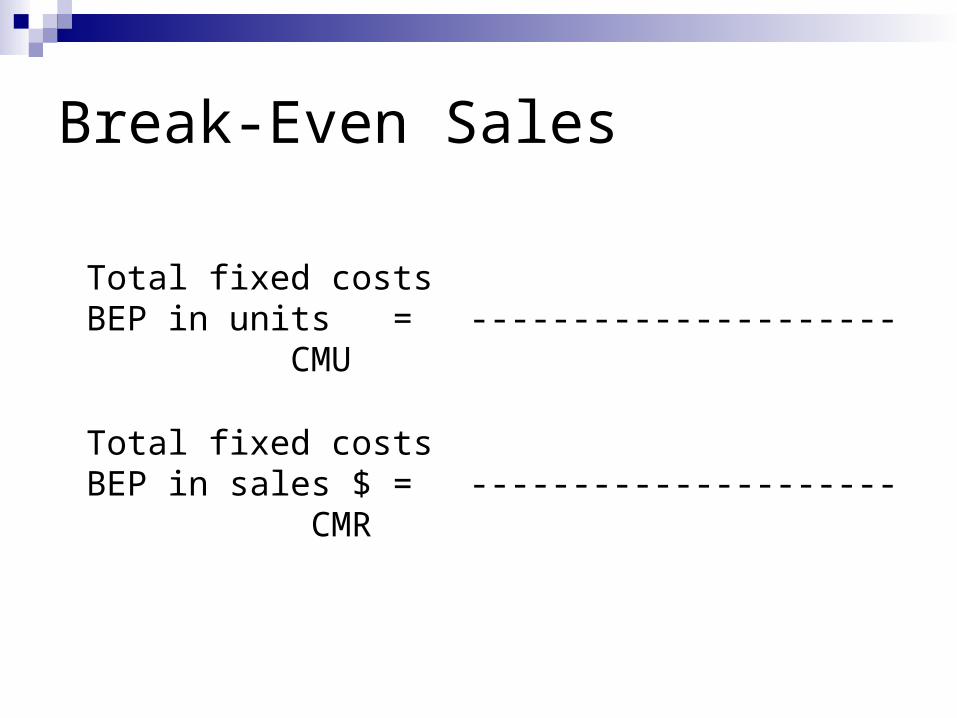
Break-Even Sales
Total fixed costsBEP in units = ---------------------
CMU
Total fixed costsBEP in sales $ = ---------------------
CMR
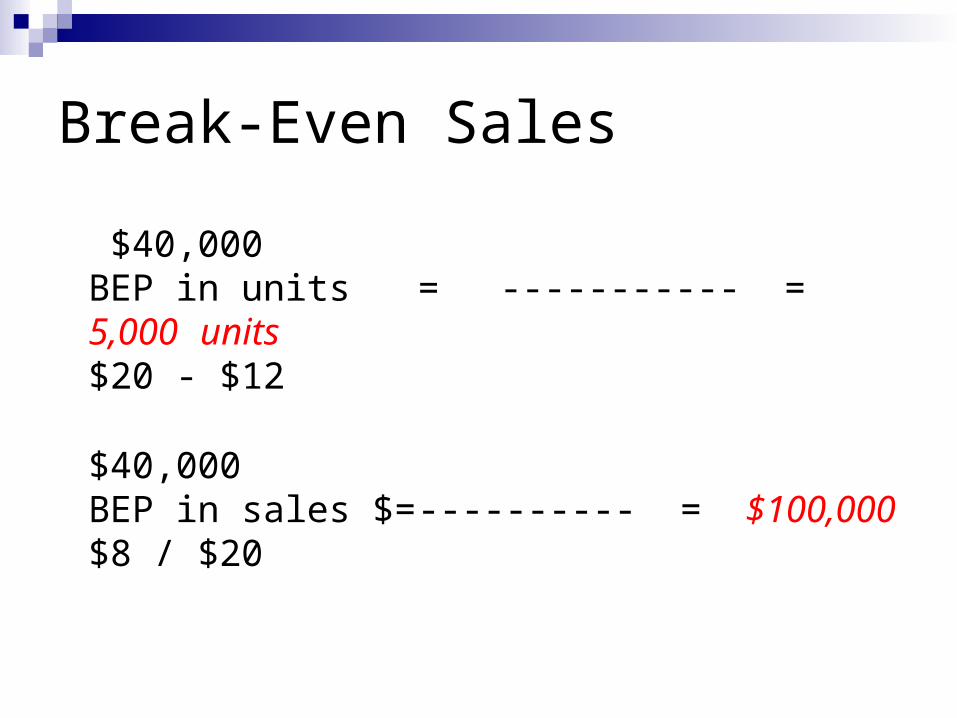
Break-Even Sales
$40,000BEP in units = ----------- = 5,000 units$20 - $12
$40,000BEP in sales $= ---------- = $100,000$8 / $20
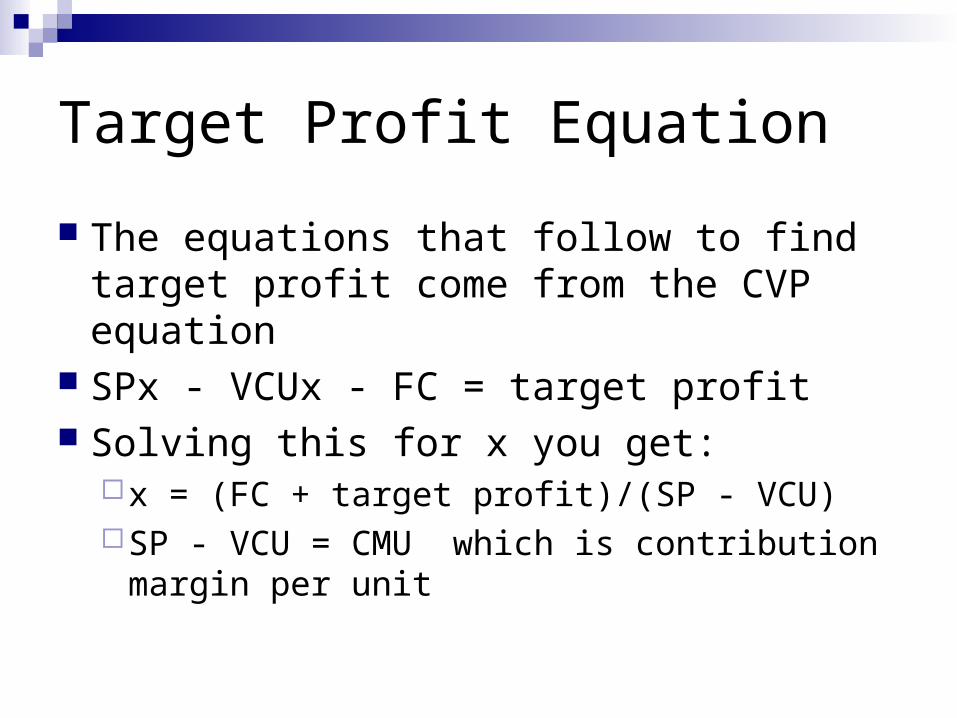
Target Profit Equation
The equations that follow to find target profit come from the CVP equation
SPx - VCUx - FC = target profit Solving this for x you get:
x = (FC + target profit)/(SP - VCU)SP - VCU = CMU which is contribution
margin per unit
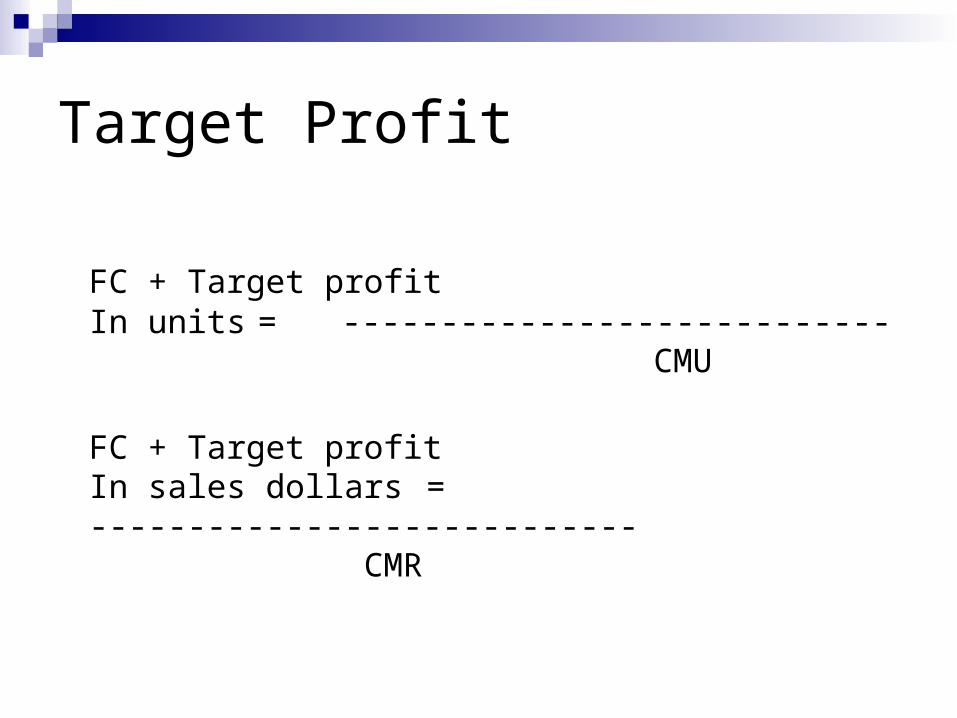
Target Profit
FC + Target profitIn units = ----------------------------
CMU
FC + Target profitIn sales dollars = ----------------------------
CMR
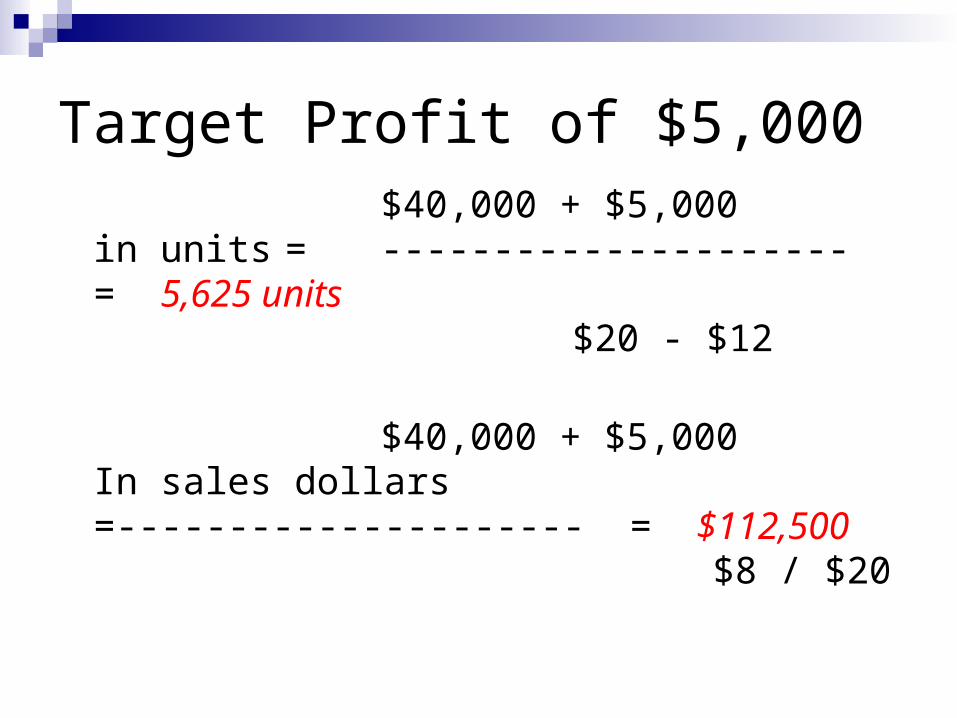
Target Profit of $5,000$40,000 + $5,000
in units = --------------------- = 5,625 units $20 - $12
$40,000 + $5,000In sales dollars =--------------------- = $112,500
$8 / $20
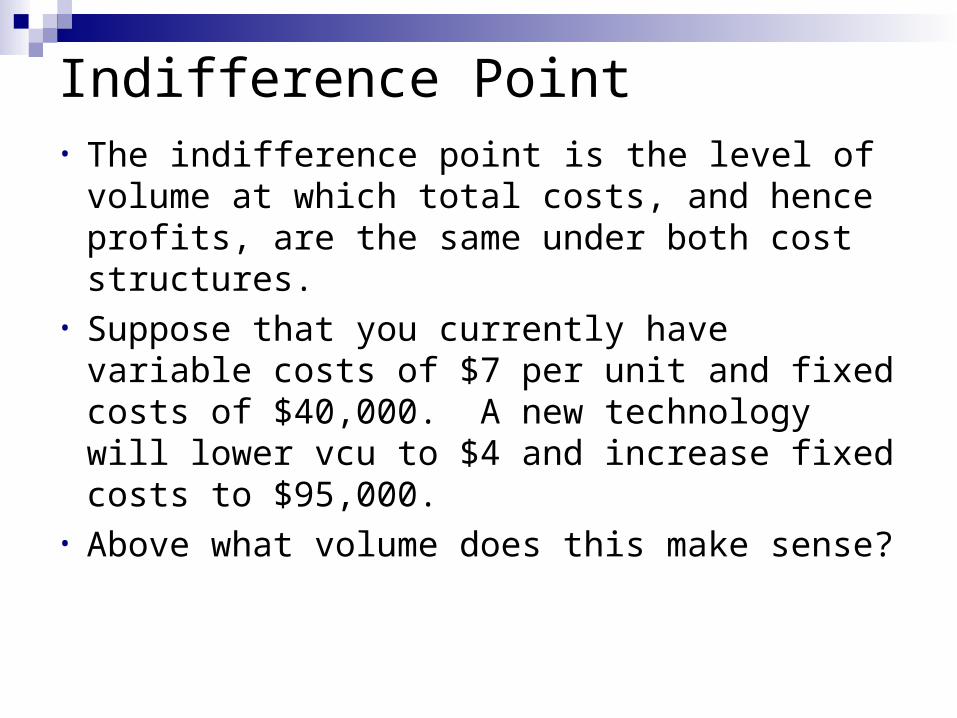
Indifference Point• The indifference point is the level of volume
at which total costs, and hence profits, are the same under both cost structures.
• Suppose that you currently have variable costs of $7 per unit and fixed costs of $40,000. A new technology will lower vcu to $4 and increase fixed costs to $95,000.
• Above what volume does this make sense?
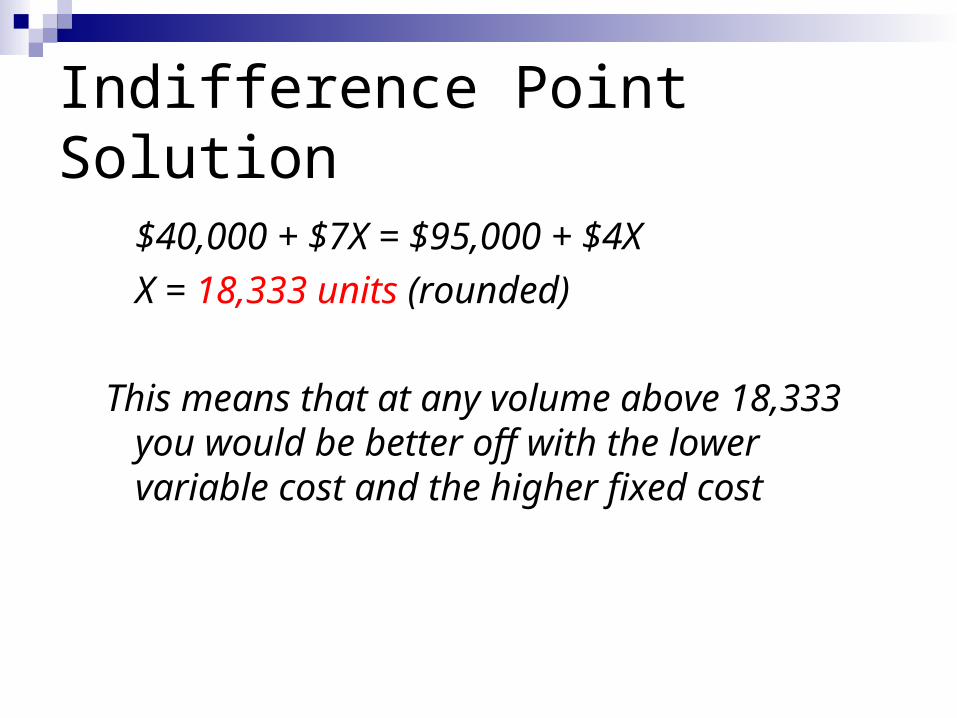
Indifference Point Solution
$40,000 + $7X = $95,000 + $4X
X = 18,333 units (rounded)
This means that at any volume above 18,333 you would be better off with the lower variable cost and the higher fixed cost
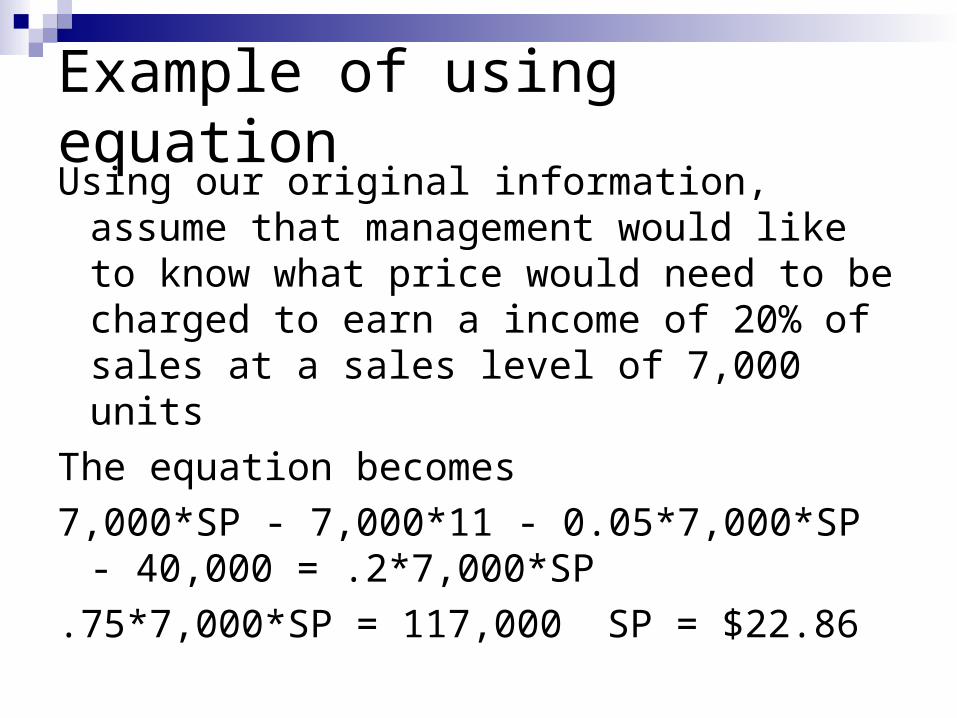
Example of using equationUsing our original information, assume that
management would like to know what price would need to be charged to earn a income of 20% of sales at a sales level of 7,000 units
The equation becomes
7,000*SP - 7,000*11 - 0.05*7,000*SP - 40,000 = .2*7,000*SP
.75*7,000*SP = 117,000 SP = $22.86
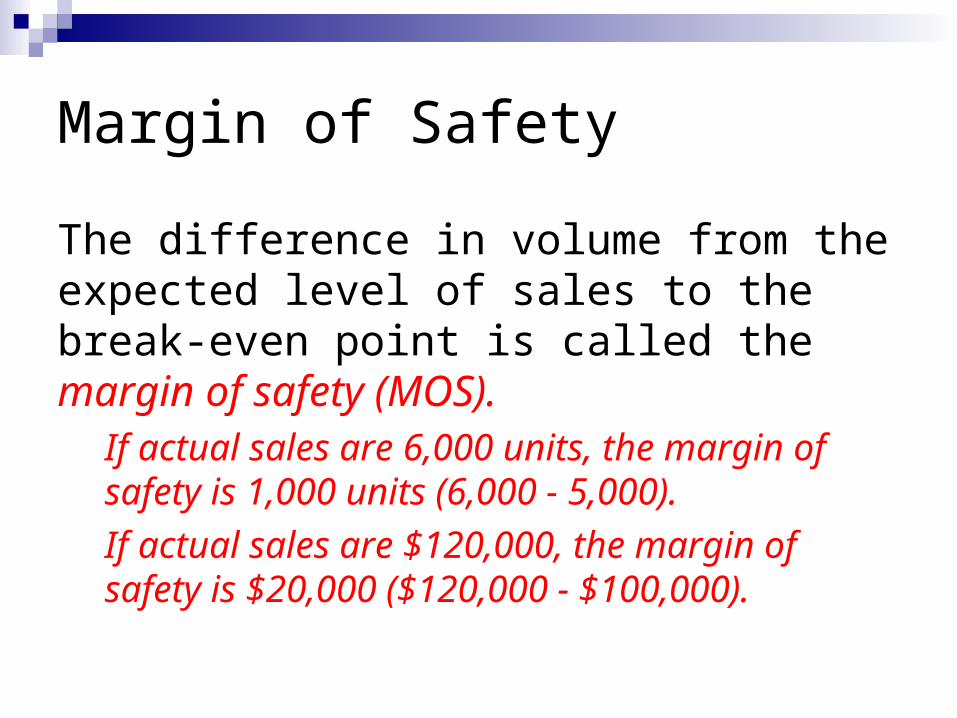
Margin of Safety
The difference in volume from the expected level of sales to the break-even point is called the margin of safety (MOS).
If actual sales are 6,000 units, the margin of safety is 1,000 units (6,000 - 5,000).
If actual sales are $120,000, the margin of safety is $20,000 ($120,000 - $100,000).
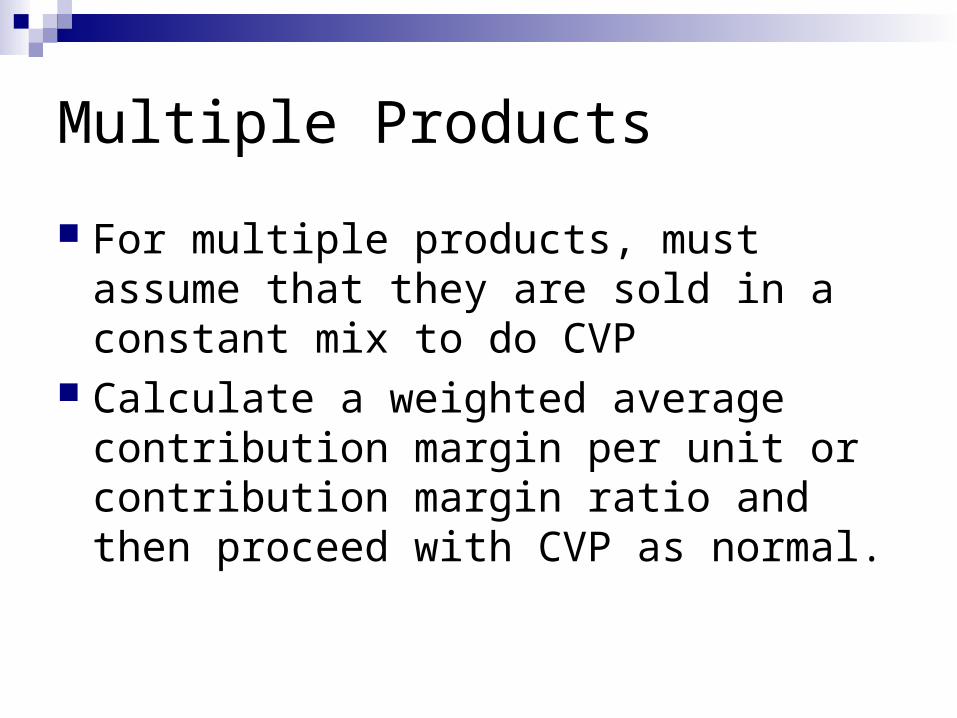
Multiple Products
For multiple products, must assume that they are sold in a constant mix to do CVP
Calculate a weighted average contribution margin per unit or contribution margin ratio and then proceed with CVP as normal.
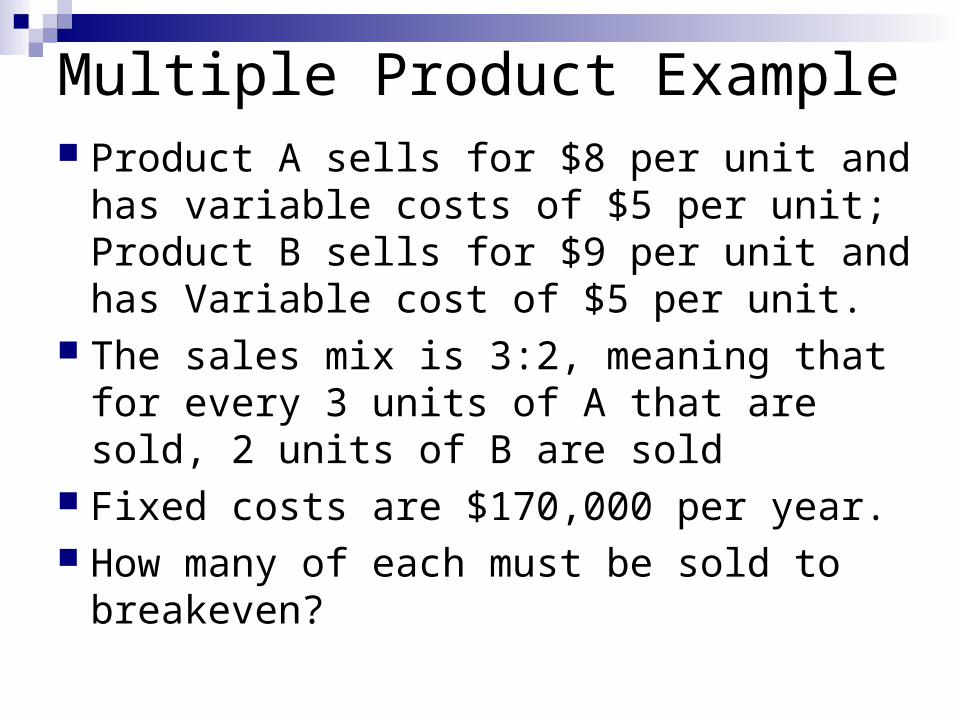
Multiple Product Example Product A sells for $8 per unit and has
variable costs of $5 per unit; Product B sells for $9 per unit and has Variable cost of $5 per unit.
The sales mix is 3:2, meaning that for every 3 units of A that are sold, 2 units of B are sold
Fixed costs are $170,000 per year. How many of each must be sold to
breakeven?
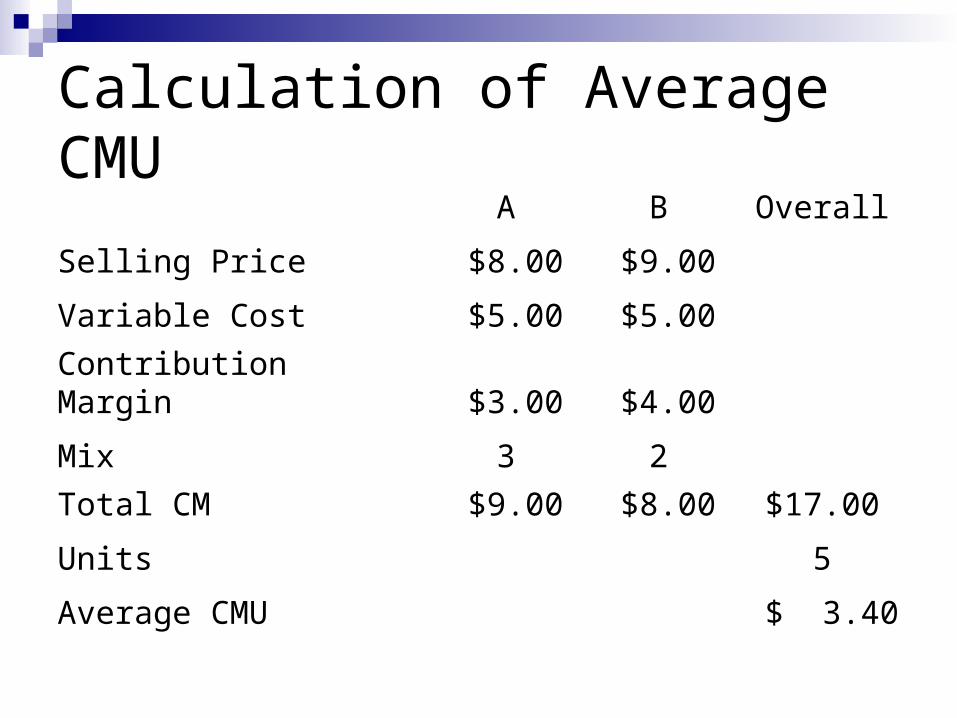
Calculation of Average CMUA B Overall
Selling Price $8.00 $9.00
Variable Cost $5.00 $5.00
Contribution Margin $3.00 $4.00
Mix 3 2
Total CM $9.00 $8.00 $17.00
Units 5
Average CMU $ 3.40
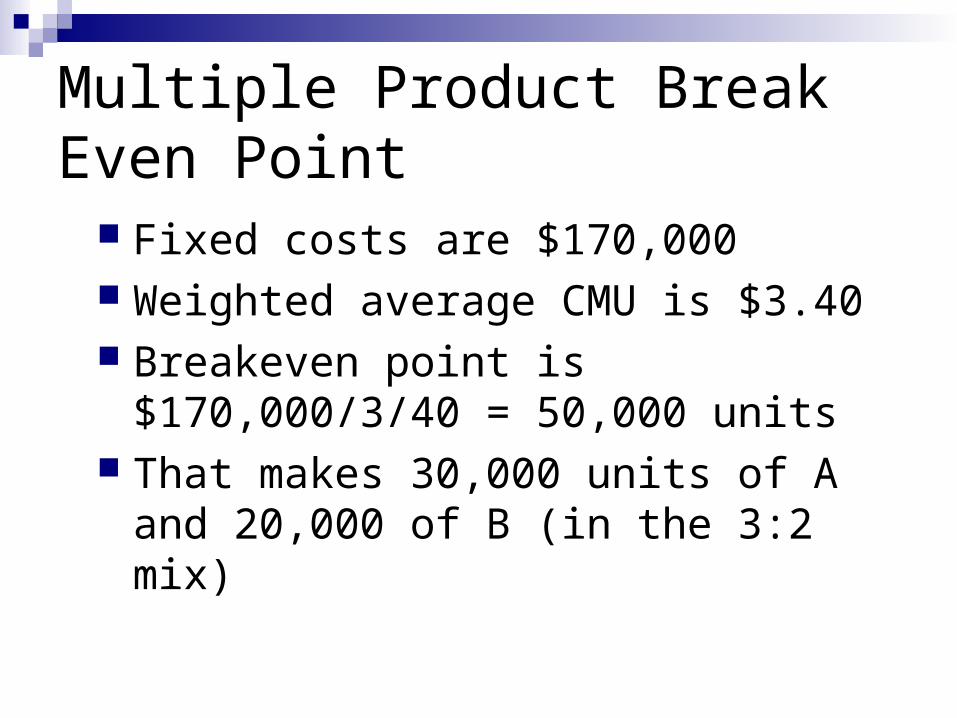
Multiple Product Break Even Point
Fixed costs are $170,000 Weighted average CMU is $3.40 Breakeven point is $170,000/3/40 =
50,000 units That makes 30,000 units of A and
20,000 of B (in the 3:2 mix)
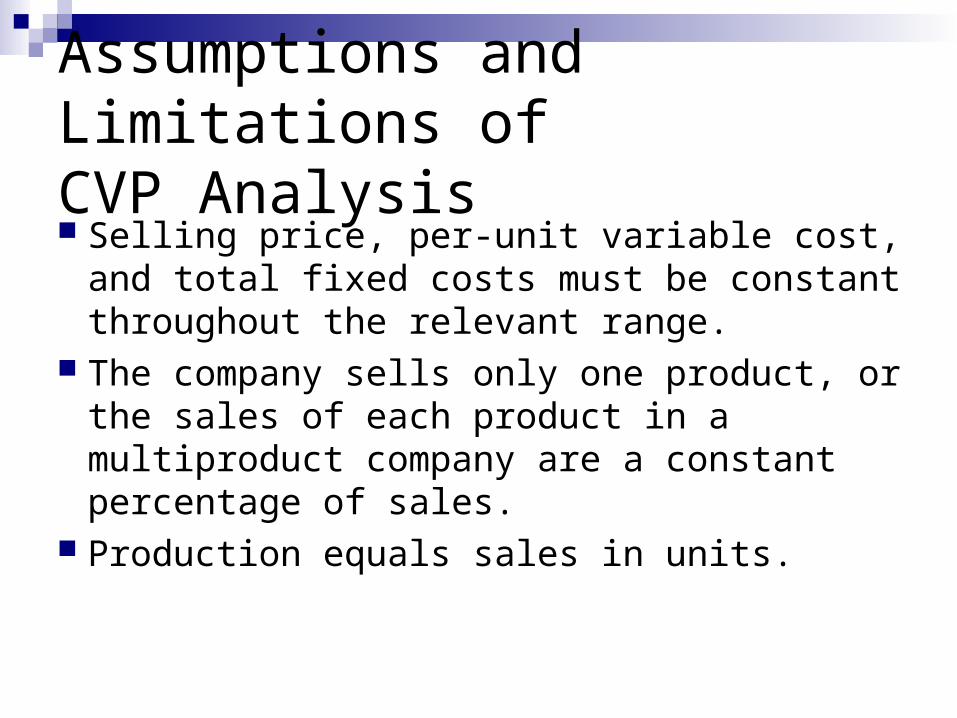
Assumptions and Limitations ofCVP Analysis Selling price, per-unit variable cost, and total
fixed costs must be constant throughout the relevant range.
The company sells only one product, or the sales of each product in a multiproduct company are a constant percentage of sales.
Production equals sales in units.
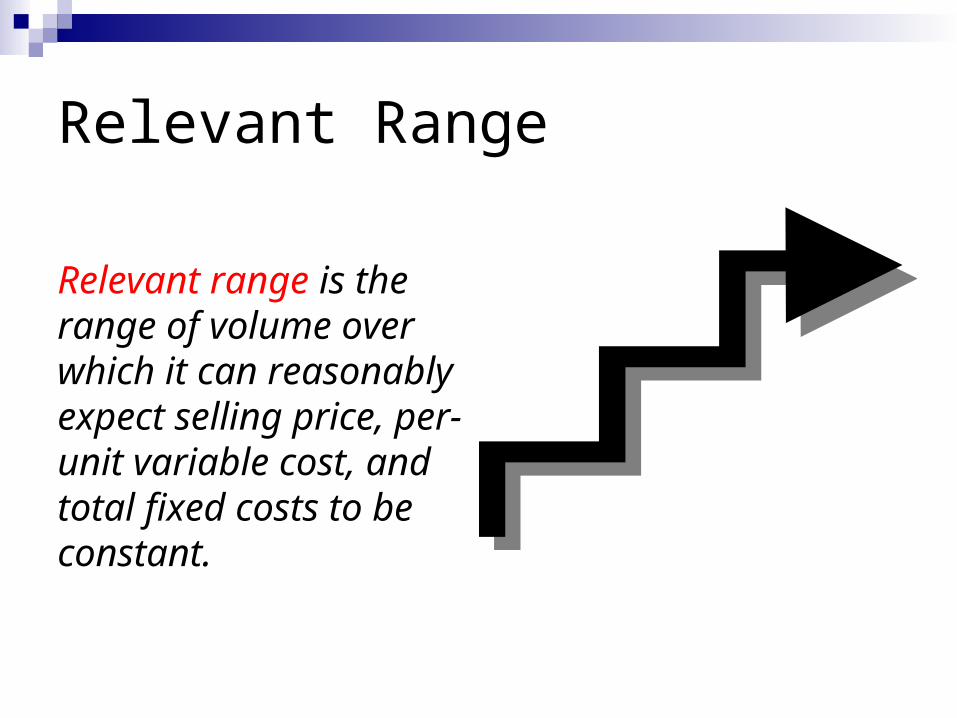
Relevant Range
Relevant range is the range of volume over which it can reasonably expect selling price, per-unit variable cost, and total fixed costs to be constant.
Do Fixed Costs Add Risk?
Fixed costs cannot be reduced quickly When sales fall off, fixed costs remain When sales rise, fixed costs also remain
the same Do fixed costs add risk?
Operating Leverage Firm’s with high levels of fixed costs are said to
have high operating leverage. Their profit will move faster (up or down) in
response to a change in sales. The ratio of CM/profit will tell you how many
multiples a % change in sales will have on profits
For example if a firm has CM of 30,000 and profit of 10,000, a 10% increase in sales gives a 30% increase in profits!! Try it out.
Constraints A constraint exists when a supply of a
resource (labor, material, processing time) is inadequate to meet demand
Demand itself is also a constraint Need to get the most out of each unit of a
constrained input Do this by calculating a contribution
margin per unit of the constrained resource
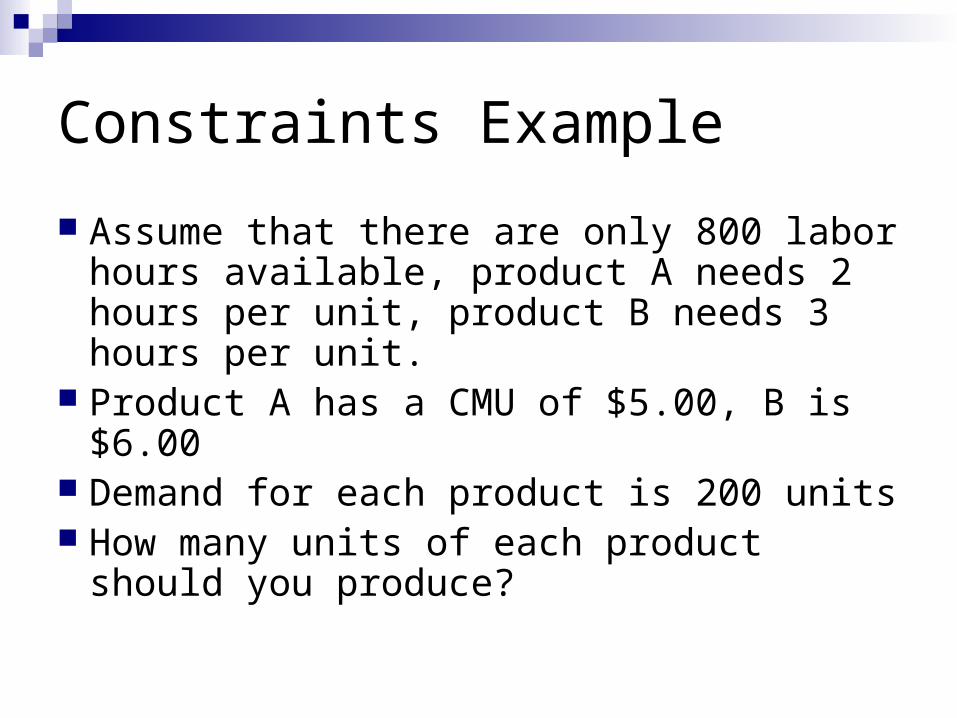
Constraints Example
Assume that there are only 800 labor hours available, product A needs 2 hours per unit, product B needs 3 hours per unit.
Product A has a CMU of $5.00, B is $6.00 Demand for each product is 200 units How many units of each product should
you produce?