Embed Size (px)
Citation preview
45
Chapter Five
FACTORS AFFECTING IMPLEMENTATION
The conceptual framework outlined in Chapter Two pointed to thepossible interrelationships between teacher background character-istics, school characteristics, district support, and assistance pro-vided by design teams and implementation of the key components ofdesigns. The previous chapter described a summary measure of im-plementation; however, as we noted, there is a great deal of variabil-ity in the overall indices across jurisdictions and design teams, aswell as within schools. The multivariate analyses presented in thischapter allow us to analyze this variation further by partitioning itinto within- and between-school components and relating thisvariation to a variety of teacher, school, and design team factors.1
VARIATION IN IMPLEMENTATION: MULTILEVEL ANALYSIS
Because the data are nested—that is, teachers are nested withinschools—we use multilevel modeling techniques to provide more ac-curate estimates of the relationships between the dependent and in-dependent measures (see Bryk and Raudenbush, 1992; Bryk, Rau-denbush, and Congdon, 1996; Singer, 1998).
______________ 1Recall that our overall core index is comprised of the following: parents and com-munity members are involved in the educational program; student assessments areexplicitly linked to academic standards; teachers develop and monitor studentprogress with personalized, individualized learning programs; student grouping isfluid, multiage, or multiyear; teachers are continual learners and team membersthrough professional development, common planning, and collaboration; and per-formance expectations are made explicit to students so that they can track theirprogress over time.
46 Implementation in a Longitudinal Sample of New American Schools
First, we partition the variance in the dependent variables into theirwithin-school and between-school components. This provides in-formation about whether most of the variance in the dependent vari-able lies between schools or within schools. Next, we estimate a setof regression coefficients in each school (Level 1), and then the con-stant term in the first equation (Level 1) becomes an outcome tobe explained by school demographic and implementation factors(Level 2).
Specifically, for the implementation index, we estimate the followingmodels:
Individual Teacher Model (Level 1)
Yij = β0j + βιXij+ rij
where
• Yij is the dependent variable, the teacher-reported implementa-tion index;
• β0j is the constant term, and it is the average value of the depen-dent variable in the school j;
• βi is a vector of the Level 1 coefficients to be estimated withschool j for the listed independent variables;
• Xij is a vector of independent variables measured at the teacherlevel; and
• rij is the Level 1 random effect, assumed to be normally dis-tributed with a mean of zero and constant variance.
School Context Model (Level 2)
β0j = γ0 + γjZj + u
where
• β0j in this model is from the teacher level equation above;
Factors Affecting Implementation 47
• γ0 is the constant term;
• γ j is a vector of the Level 2 coefficients for the independentschool-level variables;
• Zj is a vector of the independent variables measured at the schoollevel; and
• u is a Level 2 random effect.
The multilevel models described above are simple “fixed coefficient”models (Kreft and DeLeeuw, 1998). In other words, the coefficientsestimating the Level 1 relationships between teacher characteristicsand implementation are held constant across schools. There are nocross-level interactions between teacher and school characteristics.Thus, between-school differences are limited to differences in inter-cepts. In other words, the intercept for each school is the sum of theoverall intercept and the sums of the school aggregate variablesweighted by the school-level regression coefficients, plus error. Theimplementation index of each teacher is then the sum of thatteacher’s school intercept and the sum of the teacher-level back-ground variables weighted by the teacher-level regression coeffi-cients, plus error (Koretz, McCaffrey, and Sullivan, 2001).
Caveat
It is important to remember that our sample of NAS schools is not arandom sample, but a sample of all those schools in the seven part-nering jurisdictions that reported implementation during 1997–1999and had survey information from teachers and principals. Despitethis not being a random sample, we use multilevel modelingtechniques to explore the relationships among variables at one pointin time—spring 1999. These provide a more accurate description ofthe relationships in these NAS schools for this particular point intime. We estimate the model using the longitudinal sample andexamine whether factors affecting implementation changed overtime, from 1998 to 1999. We then estimate the model on the com-bined sample and formally test for differences between the longitu-dinal and the combined samples.

48 Implementation in a Longitudinal Sample of New American Schools
OPERATIONALIZING THE VARIABLES AFFECTINGIMPLEMENTATION
The factors listed below are drawn from our conceptual framework.We describe the operationalization of each variable before showingits relationship with implementation in a multivariate framework.
Teacher Characteristics
Dummy variables for race-ethnicity (African American, Latino, other,vs. non-Hispanic white), educational degree (master’s vs. bachelor’s),total teaching experience (measured in years), and age (30 years orolder vs. less than 30).
In addition, we also include three measures of teacher perceptions oftheir students’ ability and readiness to learn (that to some degreemeasure teacher efficacy) and a variable that measures teacher per-ceptions of principal leadership:
• Lack of basic skills is a hindrance to your students’ academic suc-cess: Teachers ranked this on a scale of 1–4 with 1 = great hin-drance and 4 = not at all.
• Lack of student discipline and inadequate parent support for stu-dents is a hindrance to your students’ academic success: Thesetwo separate survey items were summed to create one index.Each was ranked on a scale of 1–4 with 1 = great hindrance and4 = not at all. We combined the two and obtained an averagevalue.
• Most of my students can learn with the school resources availableto them: This was measured on a four-point scale with 1 =strongly disagree and 4 = strongly agree.
• Principal leadership: Teachers were asked several questions re-garding the degree of support and leadership provided by theprincipal. These included communicating clearly what is ex-pected of teachers, supportive and encouraging behavior, gettingresources for the school, enforcing rules for student conduct,talking with teachers regarding instructional practices, having
Factors Affecting Implementation 49
confidence in the expertise of the teachers, and taking a personalinterest in the professional development of teachers. We com-bined these into a summative index of principal leadership; thealpha reliability for this index was 0.87, and the correlationsranged from 0.28 to 0.65. Unfortunately, these data were notavailable for Dade schools because we had to administer anattenuated survey in these schools.
School Characteristics
• Large school: This is a dummy variable equal to one if the schoolis large (i.e., 400 students or more), and equal to zero otherwise.
• Secondary school: This is a dummy variable equal to one if theschool is secondary, and equal to zero otherwise.
• Percent student mobility: This is a continuous variable measur-ing the overall student mobility reported by the principal.
• School poverty: This is a continuous variable measuring the per-centage of students receiving free/reduced price lunch.
• School minority composition: This is a continuous variable mea-suring the percentage of students who are non-white.
• Interaction between poverty and minority composition: This is acontinuous variable measuring the interaction between the twovariables.
• Principal leadership: We created a school-level mean based onthe sample of teachers in each school that measured principalleadership at the school level.
• Implementation index 1997: Because we are focusing on changeand have repeated measures of implementation, we introducethe school implementation level in 1997 as a control variable.While this is not an “explanatory” variable, it makes use of thelongitudinal nature of the data and allows us to see how progressin implementation is related to prior levels of implementation.

50 Implementation in a Longitudinal Sample of New American Schools
Designs and Design Team Assistance
Teacher Level
• Communication by designs to schools: measures the degree towhich individual teachers report that the design team clearlycommunicated the design so that it could be well implemented.Scores for this variable range from 1 = did not communicateclearly at all to 6 = definitely communicated clearly.
• Teacher support: measures the extent to which teachers reportedsupporting or opposing the design in their school. This variablewas measured on a 5-point scale, where 1 = strongly oppose and5 = strongly support.
School Level2
• Years implementing: is number of years the school has been im-plementing the design with a range from two to four or more(from principal interview).
• Communication by designs to schools: is a school-level meancreated from individual teacher reports regarding level of com-munication by design teams.
• Teacher support: is a school-level mean created from individualteacher reports; this captures the aggregated level of support in aschool.
• Set of dummy variables for designs: Because there may be un-measured characteristics of designs that may influence imple-mentation in addition to those mentioned above, we also in-cluded in some models a set of dummy variables that were equalto one if the school had adopted that particular design, zero oth-
______________ 2In analyses of earlier data, we had included a dummy variable equal to one if 60 per-cent or more of teachers actually voted to implement the design, zero otherwise. Themodels reported here did not include this variable for two reasons. First, it measuredsupport three years ago when the schools were considering the design and we hadmore direct measures of support. Second, given turnover, this variable may not cor-rectly reflect level of support in the spring of 1999.
Factors Affecting Implementation 51
erwise (RW is the reference category because of its relatively highlevels of implementation discussed earlier).
In addition to these variables, we also created an index that mea-sured the availability of resources at the school level to implementthe designs.3 This variable was correlated with principal leadershipand was statistically insignificant when both variables were includedin the model. In the interest of parsimony, it was omitted from thefinal model.
District Support
The models include one of the two measures of district support:
• Index of district support: We ranked jurisdictions along a varietyof key dimensions based on Bodilly’s earlier work (1998) as wellas additional interviews with districts in 1998. As we mentionedearlier, Bodilly identified several district and institutional factorsthat contributed to implementation: leadership backing andstability; centrality of effort; lack of crises; history of trust andcooperation; resource support; school autonomy; union support;and aligned assessment. Jurisdictions were ranked on thesedimensions; the various rankings were then summed into anoverall summative index of district support. The alpha reliability
______________ 3Resources Index was a school measure based on aggregated teacher reports aboutwhether the school had sufficient resources to implement the designs. Teachers couldrespond to several questions using a 5-point scale ranging from “no resources areavailable” to “all are available.” The resources index is a combination of a number ofquestions that asked the extent to which the teacher’s school had the resourcesneeded to implement the major elements of the design. These questions included:
• Materials to describe the program;
• Materials to support instruction;
• Professional development for teachers;
• Time for planning, collaboration, and development;
• Staff or consultant to mentor, advise, and provide ongoing support;
• Technology; and
• Funds and funding flexibility.
The alpha reliability of this scale was 0.92 (correlations among these items rangedfrom 0.50 to .090).
52 Implementation in a Longitudinal Sample of New American Schools
of this index was 0.85, and the correlations ranged from 0.16 to0.77.
• Set of dummy variables for each jurisdiction: Because the aboveindex is open to criticism both on the grounds of being largelyjudgmental as well as being dated (based on data collected dur-ing the 1996–1997 school year), we also used the set of separatedummy variables for each jurisdiction, which was used in theearlier chapter, to test in the multilevel analyses (Memphis is thereference category). Another reason for using this set of dummyindicators rather than the index is to capture dimensions of dis-trict support that have perhaps not been captured or only par-tially captured by the district index.
THE ANALYSIS SAMPLE
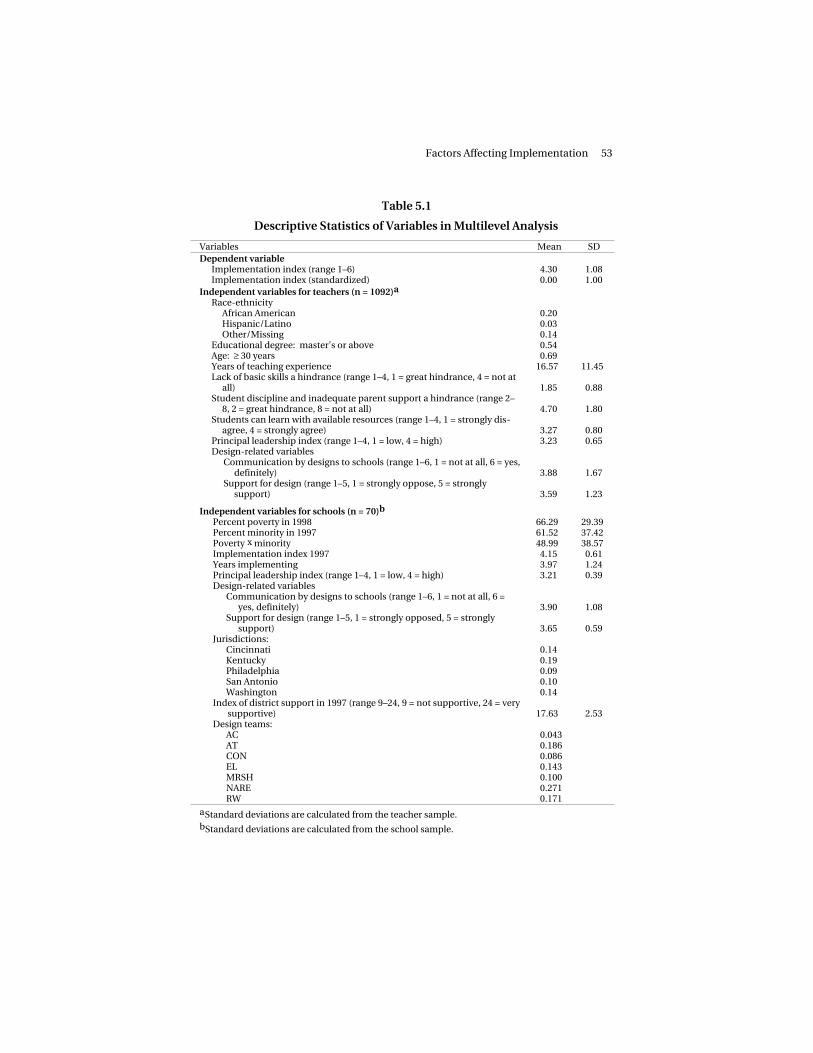
Table 5.1 provides the means and standard deviations (SDs) for thevariables in the models. The implementation index which had amean of around 4.3 on a 1–6 scale was standardized to a mean ofzero and SD = 1 in the estimated models. The analysis sampleconsists of about 1,200 teachers and 70 schools.4
Teacher Characteristics
About 63 percent of the teachers were non-Hispanic white, a littleover one-fifth were African American, and about 3 percent were His-panic. Less than 2 percent of the sample reported their race/ethnicity as “other,” and about 12 percent were missing data on race/ethnicity. These latter two categories were combined into an “other/missing” category. The remaining 60–62 percent were non-Hispanicwhite. About half the sample had a master’s degree or higher andover two-thirds were 30 years or older (a good proportion were 40 orolder). They had been teaching about 16 years on average.
A large proportion of the sample felt that lack of basic skills was ahindrance to their students’ academic success. This was reflected in
______________ 4Note that the sample of schools is 70, not 71. We dropped the one school in Dade forreasons explained later in this section.
Factors Affecting Implementation 53
Table 5.1
Descriptive Statistics of Variables in Multilevel Analysis
Variables Mean SDDependent variable
Implementation index (range 1–6) 4.30 1.08Implementation index (standardized) 0.00 1.00
Independent variables for teachers (n = 1092)aRace-ethnicity
African American 0.20Hispanic/Latino 0.03Other/Missing 0.14
Educational degree: master’s or above 0.54Age: ≥ 30 years 0.69Years of teaching experience 16.57 11.45Lack of basic skills a hindrance (range 1–4, 1 = great hindrance, 4 = not at
all) 1.85 0.88Student discipline and inadequate parent support a hindrance (range 2–
8, 2 = great hindrance, 8 = not at all) 4.70 1.80Students can learn with available resources (range 1–4, 1 = strongly dis-
agree, 4 = strongly agree) 3.27 0.80Principal leadership index (range 1–4, 1 = low, 4 = high) 3.23 0.65Design-related variables
Communication by designs to schools (range 1–6, 1 = not at all, 6 = yes,definitely) 3.88 1.67
Support for design (range 1–5, 1 = strongly oppose, 5 = stronglysupport) 3.59 1.23
Independent variables for schools (n = 70)bPercent poverty in 1998 66.29 29.39Percent minority in 1997 61.52 37.42Poverty x minority 48.99 38.57Implementation index 1997 4.15 0.61Years implementing 3.97 1.24Principal leadership index (range 1–4, 1 = low, 4 = high) 3.21 0.39Design-related variables
Communication by designs to schools (range 1–6, 1 = not at all, 6 =yes, definitely) 3.90 1.08
Support for design (range 1–5, 1 = strongly opposed, 5 = stronglysupport) 3.65 0.59
Jurisdictions:Cincinnati 0.14Kentucky 0.19Philadelphia 0.09San Antonio 0.10Washington 0.14
Index of district support in 1997 (range 9–24, 9 = not supportive, 24 = verysupportive) 17.63 2.53
Design teams:AC 0.043AT 0.186CON 0.086EL 0.143MRSH 0.100NARE 0.271RW 0.171
aStandard deviations are calculated from the teacher sample.bStandard deviations are calculated from the school sample.

54 Implementation in a Longitudinal Sample of New American Schools
the very low mean of around 1.8 for the sample. In terms of lack ofstudent discipline and inadequate parent support, the teachers ap-peared to be at the midpoint on this measure with a mean of 4.6–4.7on a scale that ranged from 2 to 8. Teachers were surprisinglypositive about their students’ ability to learn, given the availableresources. The mean was quite high (approximately 3.3) on a scale of1–4.
When considering whether design teams clearly communicated thedesign to school staff so that it could be well implemented, we foundthat the average score for this teacher-level measure was about 3.9–4.0, which was somewhat higher than the mid-range on a 6-pointscale ranging from not at all clear (1) to definitely clear (6). Therewas a great deal of variation around this mean as indicated by thestandard deviation of over 1.6. In terms of support for the design,teachers again were in the middle with a mean of 3.6–3.7 (SD = 1.2).
In 1998, about 70 percent of teachers had attended a design teamworkshop in the past twelve months; not surprisingly, this was muchlower in 1999.
School Characteristics
Poverty rate was measured as of 1998 and minority composition as of1997. The mean poverty rate for the sample was 66 percent and thestandard deviation was quite large, 29 percent. The schools also hadhigh proportions of minority students: the mean for the sample wasa little over 60 percent, with a standard deviation of 37 percent.
Given the constraints of our sample size (70 schools), we estimatedseveral versions of the model with combinations of school character-istics. School size, school level, and student mobility were consis-tently insignificant in these models with small estimated effects. As aresult, in the interests of parsimony and statistical power, we ex-cluded these from the models shown here.
On average, schools were in their fourth year of implementation by1999.
The mean school-level implementation index for 1997 was 4.15 witha standard deviation of 0.61. Note that the variability of this school-level index is much smaller than the teacher-level implementation
Factors Affecting Implementation 55
index, the dependent variable in the model, because of aggregationat the school level.
The mean for the principal leadership index was relatively high: 3.2–3.3 on a scale of 1–4 and the standard deviation was 0.4. The schoolsranged from 1.9 to 3.8 on this index. Recall that we do not have dataon this variable for Dade schools. Given the importance of this vari-able (as shown in our earlier report, Berends, Kirby, et al., 2001), andgiven that we only had one school in Dade, we decided to drop thisschool from our multivariate analyses.
The school-level mean for communication by the design team was3.90 on a scale of 1–6, with a large standard deviation of 1.08. Theschool-level mean for teacher support was 3.65 on a scale of 1–5.
The set of dummy indicators for jurisdictions shows the proportionof schools in our sample that were in particular jurisdictions. For ex-ample, 14 percent of our schools were in Cincinnati while 19 percentwere in Kentucky. The largest numbers of schools in our samplewere in Cincinnati, Kentucky, and Washington.
The index of district support was about 18 on a scale of 9–24.
The set of dummy variables for the design teams shows that ACschools were somewhat less well-represented in our sample, ac-counting for less than 4 percent of the sample. CON and MRSHschools comprised between 9 and 10 percent of the sample. Thelargest group was NARE schools, which constituted 27 percent of thesample, while other designs—AT, EL, RW—each accounted forbetween 14 and 19 percent of the sample.
MULTIVARIATE RESULTS5
In order to facilitate interpretation of the intercept term in the mod-els, we centered all variables that were unique to Level 1 or Level 2 attheir grand means. Centering is particularly important for the Level1 variables both for interpretation of the intercept as well as to ensure
______________ 5We are grateful to our reviewer, Robert Croninger, for several helpful suggestions re-garding the multilevel models presented here. This section benefited greatly from hisconstructive advice.
56 Implementation in a Longitudinal Sample of New American Schools
numerical stability (Bryk and Raudenbush, 1992: 25). Withoutcentering, one would interpret the intercept as the expected outcomefor a teacher in school j who has a value of zero on all the Level 1predictor variables, which often does not have meaning. With cen-tering, one can interpret the intercept as the expected outcome for ateacher in school j who is at the mean of all the predictor variables.Dummy variables were also grand-mean centered; thus the interceptterm is the adjusted mean outcome in school j, adjusted for differ-ences among units in the percentages of teachers with various char-acteristics. Centering the Level 2 variables simply adds to the con-venience, so that the intercept term can be interpreted as theexpected outcome for a school that is at the mean of the sample interms of school characteristics.
The variables that were included at both levels (communication bythe design team; teacher support; and principal’s leadership) weregroup-mean centered at the teacher level (by subtracting the schoolmean score from each individual teacher’s score) and the schoolmeans were then entered at Level 2 into the model. As Bryk andRaudenbush (1992) point out, this procedure avoids the assumptionthat the effects of variations in school means equals the effects ofdeviations within schools and makes the model’s coefficientstraightforward estimates of the within- and between-school effects.6
Variance Components of the Dependent Variable
Before examining the relationship between implementation andteacher and school characteristics, we begin by partitioning the vari-ance in the dependent measure into its between- and within-schoolcomponents, and examining the reliability of each school’s samplemean as an estimate of its true population mean.
______________ 6Cohen, Baldi, and Rathbun (1998) point out the importance of reintroducing theschool means when the Level 1 variables are group-mean centered: “A model inwhich the (Level 1) variables are centered around their school means sheds an impor-tant piece of information: the school mean of the variable. When the analyst fails tore-introduce this source of systematic variation appropriately elsewhere in the model,he or she posits that the actual value of the centered variable does not influence theoutcome, only the relative value (that is, relative to the school mean)” (1998: 18–19).
Factors Affecting Implementation 57
In 1999, we find that most of the variation in the dependent variableis at the teacher level, although a substantial proportion is betweenschools. For example, the estimated intraclass correlation, ̂ρ , thatmeasures the proportion of the variance in the dependent variablebetween schools, is 0.18. Thus between-school variance accounts for18 percent of the total variance in the dependent variable; thewithin-school variance accounts for the remaining 82 percent. Thebetween-school variance component has declined from 1998, whenit accounted for 27 percent of total variance, with a correspondingincrease in the within-school variance.
Such findings are not uncommon in analyses of school contextualeffects on student and teacher outcomes (see Lee and Bryk, 1989;Gamoran, 1992; Berends, Kirby, et al., 2001). However, because ofsuch differences within schools, educators, design teams, and poli-cymakers may need to think carefully about how to implementchanges throughout the school.
We can also derive an estimate of the reliability of the sample meanin any school j,
λ̂ j , by substituting the estimated variance compo-
nents into the following equation (Bryk and Raudenbush, 1992: 63):
λ̂ j = Reliability (School Meanj) =
{Estimated Between-School Variance/[Estimated Between-SchoolVariance + (Estimated Within-School Variance/Sample Sizej)]}
The reliability of the sample mean as an estimate of the true schoolmean varies from school to school, depending on sample size. How-ever, an overall measure of reliability can be obtained by averagingacross the school reliabilities. For our data, λ̂ j = 0.74, which, whilenot as high as one would prefer, indicates that the sample meanstend to be fairly reliable as indicators of the true school means.
Multivariate Results
We estimated three different models to examine the relationships be-tween the core implementation index and teacher, design team,school, and district factors:
58 Implementation in a Longitudinal Sample of New American Schools
• Model 1: includes teacher, school, and design team characteris-tics (excluding the design team dummy variables);
• Model 2: includes the full set of independent variables includedin Model 1, plus jurisdiction dummy variables;
• Model 3: includes the full set of independent variables includedin Model 1, plus design team dummy variables and an index ofdistrict support.
As mentioned earlier, in the multilevel regression models, the inter-cept is modeled as a random parameter, allowed to vary betweenschools. The teacher variables are included as fixed effects.
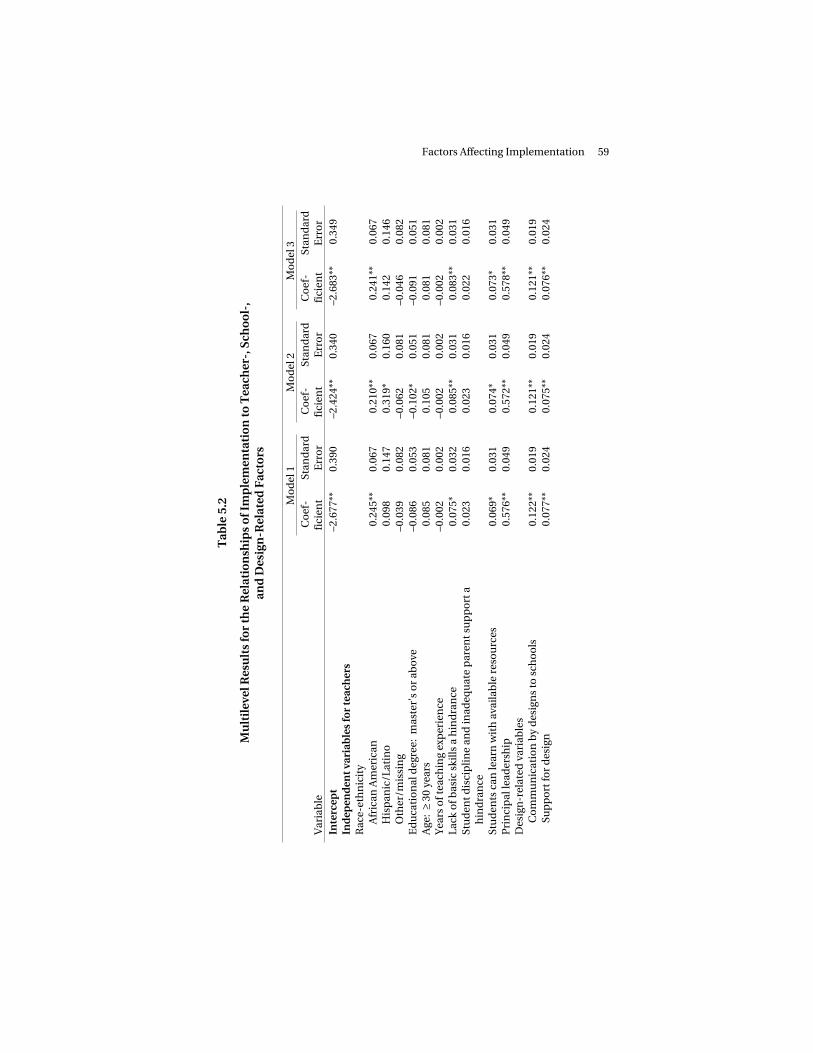
The results from the models are provided in Table 5.2.
Teacher-Level Effects
The strongest effect at the teacher level was teacher perceptions ofprincipal leadership. Teachers who ranked one point higher on theprincipal leadership scale relative to the school mean reported im-plementation levels that were over half a standard deviation higherthan teachers at the mean. This effect is statistically significant andconsistent across all three models.
We found some interesting differences in the level of implementa-tion reported by African American and Hispanic teachers vs. white,non-Hispanic teachers. African American teachers tended to reportsignificantly higher levels of implementation than white teachers(about 0.20 and 0.24 of a standard deviation higher). The coefficientfor Hispanic teachers is statistically significant only in Model 2,which controls for the jurisdiction dummy variables.
Among design-related variables, both clear communication andteacher support for the design were statistically significant. Teacherswho were one point higher than the school mean on both these indi-cators reported implementation levels that were between 0.08 and0.12 of a standard deviation higher. These effects were consistentacross the models.
The variables measuring teacher perceptions about students’ readi-ness and ability to learn were correlated with implementation. For
Uto
pia
R✺
❁❐
❆
Tab
le 5
.2
Mu
ltil
evel
Res
ult
s fo
r th
e R
elat
ion
ship
s o
f Im
ple
men
tati
on
to T
each
er-,
Sch
oo
l-,
and
Des
ign
-Rel
ated
Fac
tors
Mo
del
1M
od
el 2
Mo
del
3
Var
iab
leC
oef
-fi
cien
tSt
and
ard
Err
or
Co
ef-
fici
ent
Stan
dar
dE
rro
rC
oef
-fi
cien
tSt
and
ard
Err
or
Inte
rcep
t–2
.677
**0.
390
–2.4
24**
0.34
0–2
.683
**0.
349
Ind
epen
den
t var
iab
les
for
teac
her
sR
ace-
eth
nic
ity
Afr
ican
Am
eric
an0.
245*
*0.
067
0.21
0**
0.06
70.
241*
*0.
067
His
pan
ic/L
atin
o0.
098
0.14
70.
319*
0.16
00.
142
0.14
6O
ther
/mis
sin
g–0
.039
0.08
2–0
.062
0.08
1–0
.046
0.08
2E
du
cati
on
al d
egre
e: m
aste
r’s
or
abo
ve–0
.086
0.05
3–0
.102
*0.
051
–0.0
910.
051
Age
: ≥
30 y
ears
0.08
50.
081
0.10
50.
081
0.08
10.
081
Yea
rs o
f tea
chin
g ex
per
ien
ce–0
.002
0.00
2–0
.002
0.00
2–0
.002
0.00
2La
ck o
f bas
ic s
kills
a h
ind
ran
ce0.
075*
0.03
20.
085*
*0.
031
0.08
3**
0.03
1St
ud
ent d
isci
plin
e an
d in
adeq
uat
e p
aren
t su
pp
ort
ah
ind
ran
ce0.
023
0.01
60.
023
0.01
60.
022
0.01
6
Stu
den
ts c
an le
arn
wit
h a
vaila
ble
res
ou
rces
0.06
9*0.
031
0.07
4*0.
031
0.07
3*0.
031
Pri
nci
pal
lead
ersh
ip0.
576*
*0.
049
0.57
2**
0.04
90.
578*
*0.
049
Des
ign
-rel
ated
var
iab
les
Co
mm
un
icat
ion
by
des
ign
s to
sch
oo
ls0.
122*
*0.
019
0.12
1**
0.01
90.
121*
*0.
019
Sup
po
rt fo
r d
esig
n0.
077*
*0.
024
0.07
5**
0.02
40.
076*
*0.
024
Factors Affecting Implementation 59
Uto
pia
R✺
❁❐
❆
Tab
le 5
.2 (c
on
tin
ued
)
Mo
del
1M
od
el 2
Mo
del
3
Var
iab
leC
oef
-fi
cien
tSt
and
ard
Err
or
Co
ef-
fici
ent
Stan
dar
dE
rro
rC
oef
-fi
cien
tSt
and
ard
Err
or
Ind
epen
den
t var
iab
les
for
sch
oo
lsP
ove
rty
x m
ino
rity
–0.0
19**
0.00
5–0
.006
0.00
5–0
.017
**0.
004
Po
vert
y0.
012*
*0.
003
0.00
40.
003
0.01
2**
0.00
3M
ino
rity
0.01
1**
0.00
40.
002
0.00
40.
009*
*0.
003
Imp
lem
enta
tio
n in
dex
199
70.
223*
*0.
082
0.15
9*0.
075
0.18
6*0.
081
Yea
rs im
ple
men
tin
g0.
026
0.03
7–0
.024
0.03
40.
018
0.03
5P
rin
cip
al le
ader
ship
0.58
6**
0.10
10.
575*
*0.
090
0.55
5**
0.09
6D
esig
n-r
elat
ed v
aria
ble
sC
om
mu
nic
atio
n b
y d
esig
ns
to s
cho
ols
–0.0
050.
046
–0.0
610.
047
0.02
30.
051
Sup
po
rt fo
r d
esig
n 0
.223
**0.
077
0.26
2**
0.06
80.
215*
*0.
073
Juri
sdic
tio
nC
inci
nn
ati
—a
—a
0.0
28 0
.105
—a
—a
Ken
tuck
y—
a—
a–0
.077
0.1
35—
a—
a
Ph
ilad
elp
hia
—a
—a
–0.1
59 0
.121
—a
—a
San
An
ton
io—
a—
a–0
.613
** 0
.134
—a
—a
Was
hin
gto
n—
a—
a–0
.498
** 0
.178
—a
—a
Ind
ex o
f dis
tric
t su
pp
ort
—a
—a
—a
—a
0.00
10.
015
Des
ign
team
s:A
C—
a—
a—
a—
a 0
.312
*0.
144
AT
—a
—a
—a
—a
0.0
010.
114
CO
N—
a—
a—
a—
a 0
.287
*0.
130
EL
—a
—a
—a
—a
–0.1
290.
117
MR
SH—
a—
a—
a—
a–0
.223
0.12
7N
AR
E—
a—
a—
a—
a 0
.089
0.15
5Sa
mp
le s
ize
Tea
cher
sSc
ho
ols
1,09
270
1,09
270
1,09
270
*Sig
nif
ican
t at .
05 le
vel.
**Si
gnif
ican
t at .
01 le
vel.
aE
xclu
ded
fro
m th
e m
od
el.
60 Implementation in a Longitudinal Sample of New American Schools

Factors Affecting Implementation 61
example, teachers who were one point higher than the mean with re-spect to their perceptions of student readiness and ability to learnwere a little less than 1/10th of a standard deviation higher on theimplementation index. This reinforces earlier literature on the im-portance of teachers’ sense of efficacy in implementation (Fullan,1991).
Mirroring what we had found earlier, teacher age, experience, andeducation did not appear to be important factors in implementation,controlling for everything else. This is similar to what Datnow andCastellano (2000) found in their study, although different from whatHuberman (1989) reported. Teachers with a master’s degree tendedto report lower levels of implementation, although this is statisticallysignificant only in Model 2.
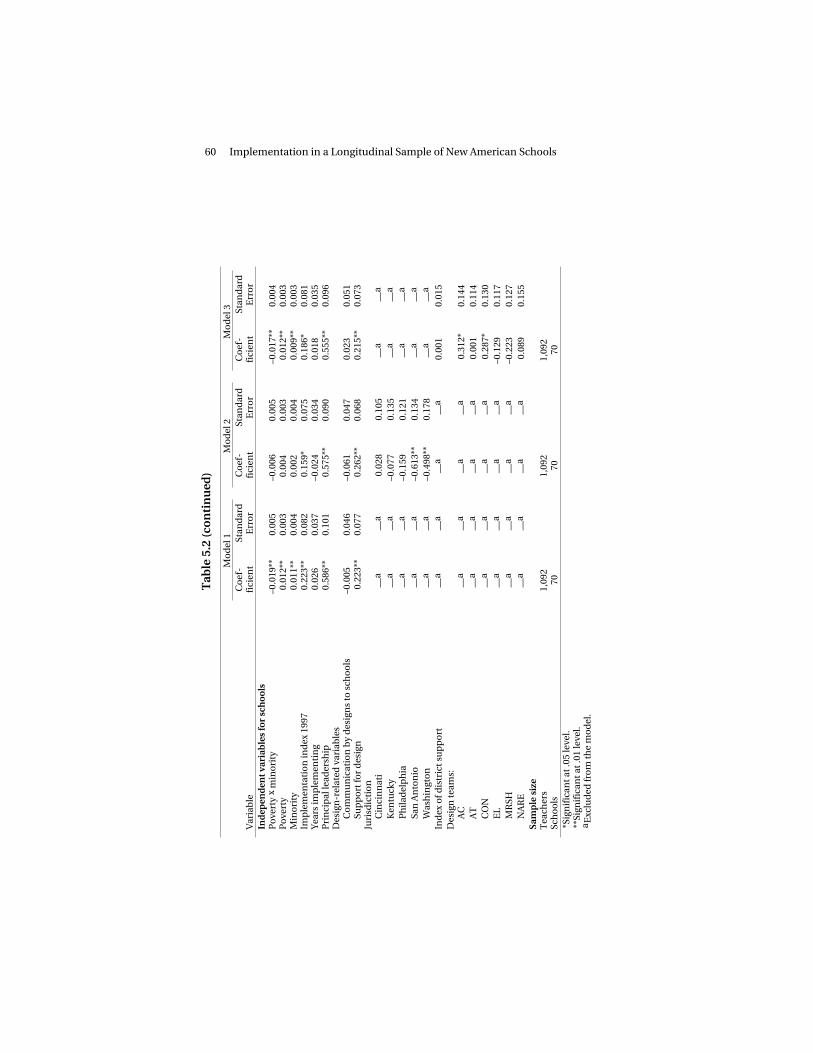
School-Level Effects
We had chosen to enter three variables at both the teacher level andthe school level, in order to be able to directly decompose the rela-tionship between these variables and implementation into its within-and between-school components. These variables were principalleadership, communication by design team, and teacher support forthe design. We discuss these first before commenting on the otherschool-level variables.
It is interesting that, at the school level, the effect of aggregatedprincipal leadership is the largest predictor of between-school vari-ance in implementation. A school that was one point higher on theschool-level principal leadership scale reported implementation thatwas over half a standard deviation higher than a school at the meanof the index.
Teacher support was also important at the school level; schools thatwere one point higher than the sample mean in terms of teachersupport were also likely to have implementation levels that were over2/10ths of a standard deviation higher than schools at the mean. Theeffect was almost three times as large as at the teacher level.
Communication by the design team aggregated at the school levelwas insignificant in all three models.
62 Implementation in a Longitudinal Sample of New American Schools
An interesting question that arises in models like these is to what ex-tent compositional or contextual effects are present. Such effects aresaid to occur when an aggregated school mean of a person-levelcharacteristic has an effect on the outcome, even after controlling forthe effect of the individual characteristic (Bryk and Raudenbush,1992: 121–122). Note that in the case of principal leadership, there isno compositional effect present because the school-level effect isequal to the person-level effect. However, we do find a sizable com-positional effect with respect to teacher support of approximately0.14–0.18 of a standard deviation, even larger than the individualperson effect.
As expected, the effect of prior implementation level was significantand tended to be dependent on whether jurisdiction or design teamfixed effects were included in the model. Schools that ranked onepoint higher than average on the 1997 implementation index werelikely to have implementation levels in 1999 that were about 0.15–0.22 of a standard deviation higher.
Some school demographics were significantly related to implemen-tation, notably poverty and minority composition, both of whichhave positive effects on implementation in the two models not con-trolling for jurisdiction effects.7 Schools that ranked 10 percentagepoints above the sample mean on either of these variables reportedlevels of implementation that were 1/10th of a standard deviationhigher than schools at the sample mean. It is interesting and promis-ing to find that schools serving largely poor or minority students re-port more success at whole-school reform. This may be largely aquestion of motivation or determination to succeed on the part ofthe teachers and principals in these schools. It also offers an indica-
______________ 7As mentioned earlier, we estimated several different versions of the models thatincluded school size, school level, and student mobility. These variables were largelyinsignificant and were dominated by poverty and minority composition and were ex-cluded from the final versions shown here. This is a change from our earlier results(Berends, Kirby, et al., 2001) that were based on a sample of 104 schools and 1998 data.In those models, school size, level, and student mobility did have significant effects onimplementation. One plausible hypothesis for the change might be that as schoolsmature and gain experience with the designs, these variables become less importantthan variables describing the composition of the student body. Alternately, it could bethat nonresponse in our panel data is leading to somewhat skewed results.

Factors Affecting Implementation 63
tion of the ability of some designs to help change these challengingschools.
Because poverty and minority composition are strongly correlated(the correlation coefficient is 0.76), we introduced an interactionterm to see whether the combined effect of high poverty and highminority composition was different from the effects of these twovariables separately. The estimated effect of the interaction term isequal to the coefficients on poverty and minority. On net, taking thecombined effect of poverty and minority composition, the effect ofthis variable largely washes out.
There was little difference in reported implementation by number ofyears schools had been implementing, net of the other variables.8
In Model 2, controlling for other variables, we find that among thejurisdiction dummy variables, the only two statistically significantvariables are those for San Antonio and Washington, both of whichrank significantly lower than Memphis, the reference category.
San Antonio schools are about 6/10ths of a standard deviation loweron the implementation scale than schools in Memphis (the omittedcategory), after controlling for other factors. This is not surprising.Concerned about high-stakes accountability testing, in addition tothe NAS designs, the district office introduced research-based in-structional programs that targeted the two most basic subjects,reading and mathematics in all schools. Thus, by 1997–1998, schoolswere spending a substantial portion of the day on district-mandatedcurricular programs, rather than on design team activities. Withinthis context, it is not surprising that our surveys reveal very low levelsof implementation of NAS designs in San Antonio.
Washington schools ranked about half a standard deviation lowerthan Memphis schools on the implementation index. Washingtontended to rank low on indicators of district support.
These results are somewhat different from those reported in our ear-lier study (Berends, Kirby, et al., 2001), in which the model with ju-risdiction dummy variables was dominated by the jurisdiction ef-
______________ 8A squared term to allow for nonlinearities in the relationship between years imple-menting and implementation was not significant in the model.
64 Implementation in a Longitudinal Sample of New American Schools
fects. These were all fairly sizable and mostly significant, even aftercontrolling for school and teacher characteristics. The differences inresults are due to the differences in the model specification and thesample. It is plausible to suggest that over time, in jurisdictions withhigher implementation (Cincinnati, Memphis, Kentucky), maturityand experience with the designs ensures that the designs becomeinstitutionalized within schools, and schools are perhaps less vulner-able to, or in need of, direct district support and leadership. On theother hand, if schools that failed to receive district support alsodropped out of the panel, then the district effects might well be un-derestimated. Based on the two studies and the RAND case studies,it is fair to infer that district and institutional factors are extremelyimportant in ensuring the success of comprehensive school reform,particularly in the early stages of implementing the designs. Thispoints to the need for a careful strategy to involve districts in anyfederal reform efforts such as CSRD.
We had earlier mentioned that we were interested in seeing whethercharacteristics of designs other than those measured in our models(clear communication, teacher support, attendance at design teamworkshop, adequacy of resources, the latter two of which are not in-cluded in models reported here) had an independent effect on im-plementation. We tested explicitly for these effects in Model 3.Controlling for prior implementation levels, and other factors, wefind that compared with RW, the reference category, both AC andCON schools reported implementation levels that were about 3/10ths
of a standard deviation higher. AC schools have made considerableprogress in implementation in the last year; they tended to be at thesample mean in earlier years, and lower than RW schools. The de-sign team had been put on notice by NAS that they might be droppedfrom NAS’s portfolio unless they improved. As a consequence, ACreduced the number of schools in which they were during scale-upand expended time and effort on the remaining schools. It clearlypaid dividends, suggesting the importance of quality support, par-ticularly if the design has limited capacity.
In our earlier study, design team differences were statistically in-significant, controlling for other factors. It may be that over time,unobserved differences in design teams become more importantmaking some designs easier or harder to implement.
Factors Affecting Implementation 65
In Model 3, we also included a measure of district support based on asummary measure from RAND’s case study analysis of these districts(Bodilly, 1998). The effect of this variable was small and statisticallyinsignificant, although positive. One reason may be the variable istoo dated—given that it was based on 1996–1997 data—to reflect cur-rent realities in terms of district environment and support.
Goodness of Fit
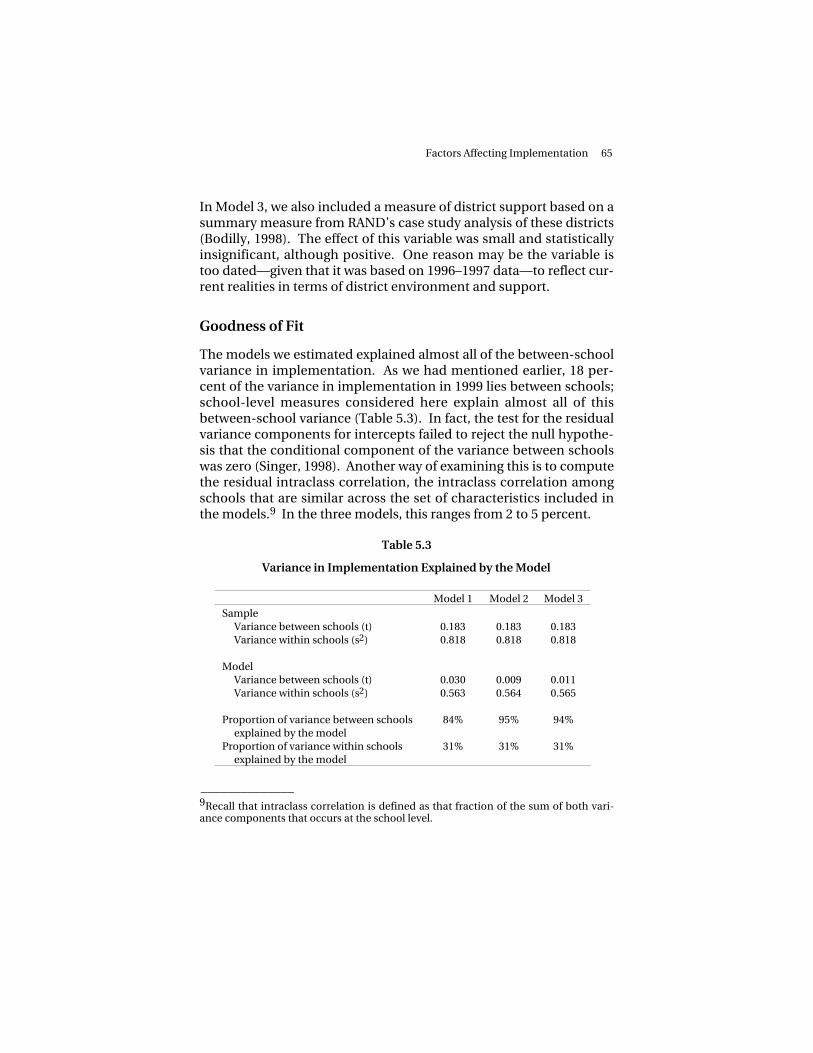
The models we estimated explained almost all of the between-schoolvariance in implementation. As we had mentioned earlier, 18 per-cent of the variance in implementation in 1999 lies between schools;school-level measures considered here explain almost all of thisbetween-school variance (Table 5.3). In fact, the test for the residualvariance components for intercepts failed to reject the null hypothe-sis that the conditional component of the variance between schoolswas zero (Singer, 1998). Another way of examining this is to computethe residual intraclass correlation, the intraclass correlation amongschools that are similar across the set of characteristics included inthe models.9 In the three models, this ranges from 2 to 5 percent.
Table 5.3
Variance in Implementation Explained by the Model
Model 1 Model 2 Model 3Sample
Variance between schools (t) 0.183 0.183 0.183Variance within schools (s2) 0.818 0.818 0.818
ModelVariance between schools (t) 0.030 0.009 0.011Variance within schools (s2) 0.563 0.564 0.565
Proportion of variance between schoolsexplained by the model
84% 95% 94%
Proportion of variance within schoolsexplained by the model
31% 31% 31%
______________ 9Recall that intraclass correlation is defined as that fraction of the sum of both vari-ance components that occurs at the school level.

66 Implementation in a Longitudinal Sample of New American Schools
Explaining within-school variance has traditionally been much moredifficult. The teacher-level factors included in the models explainedabout 31 percent of the within-school variance, suggesting that othermeasures are important for explaining the differences in implemen-tation occurring within schools.
SUMMARY
The analyses shown here further our understanding about theprogress NAS schools have made in the first several years of imple-mentation. We find that teacher reports about implementation intheir school differed much more within schools than between them.
Our models strongly underscore the importance of the followingfactors in implementation:
• Strong principal leadership;
• Teacher support for designs and clear communication;
• A sense of teacher efficacy in terms of positive teacher percep-tions and expectations about students’ ability and willingness tolearn;
• Teacher and school demographic characteristics (e.g., AfricanAmerican teacher, schools serving large numbers of poor or mi-nority students);
• Strong district support;
• Type of design; and
• Prior level of implementation.
Many of these factors have important policy implications for the suc-cess of the current CSRD reform effort.