Embed Size (px)
Citation preview
Chapter
Equilibrium: Market Forces of Supply
and Demand
4
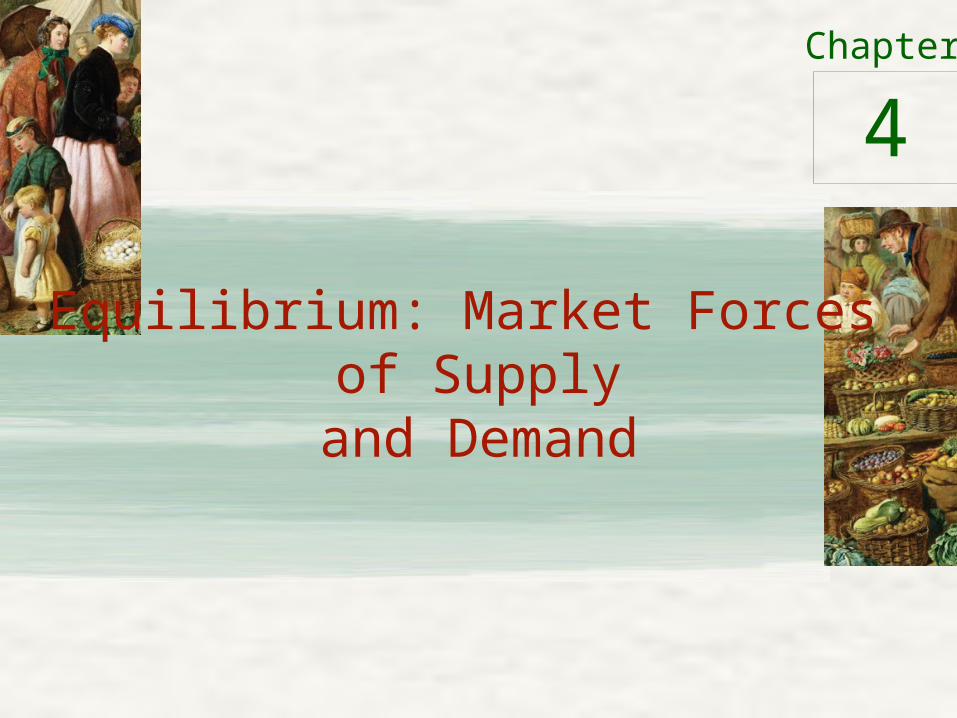
Supply and Demand Together
• Equilibrium - a situation– Market price has reached the level :
• Quantity supplied = quantity demanded
• Equilibrium price - the price:– Balances quantity supplied and quantity
demanded• Equilibrium quantity
– Quantity supplied and the quantity demanded at the equilibrium price
2
The equilibrium of supply and demand
8
3
Supply
0 1210 1191 2 3 4 5 6 7 8Quantity of Ice-Cream Cones
$3.00
2.50
2.00
1.50
1.00
0.50
Price of Ice-Cream
Cones
Equilibrium
Demand
Equilibriumprice
Equilibriumquantity
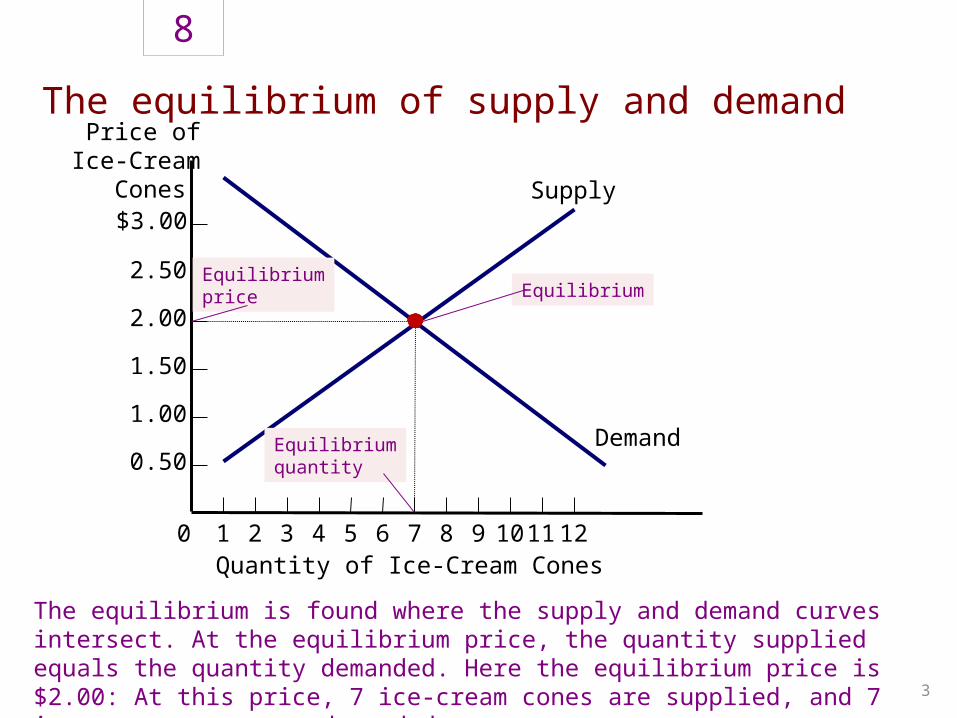
The equilibrium is found where the supply and demand curves intersect. At the equilibrium price, the quantity supplied equals the quantity demanded. Here the equilibrium price is $2.00: At this price, 7 ice-cream cones are supplied, and 7 ice-cream cones are demanded.
Supply and Demand Together
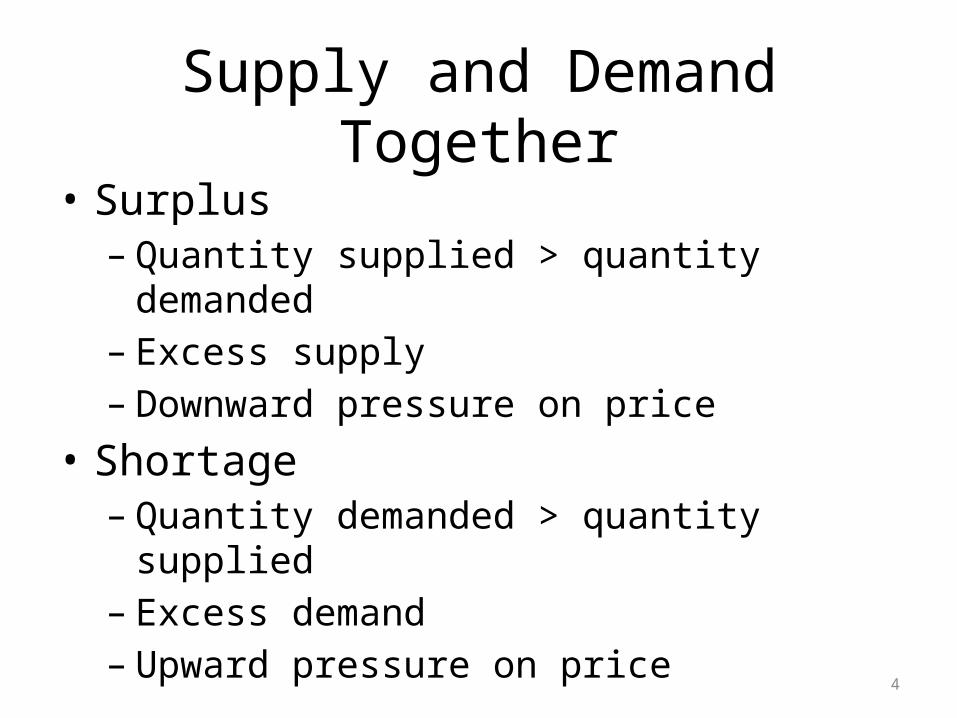
• Surplus– Quantity supplied > quantity demanded– Excess supply– Downward pressure on price
• Shortage– Quantity demanded > quantity supplied– Excess demand– Upward pressure on price
4
Markets not in equilibrium
9
5
Price ofIce
CreamCones
Quantity of Ice-Cream Cones 0
Demand
7
$2.50
(a) Excess Supply
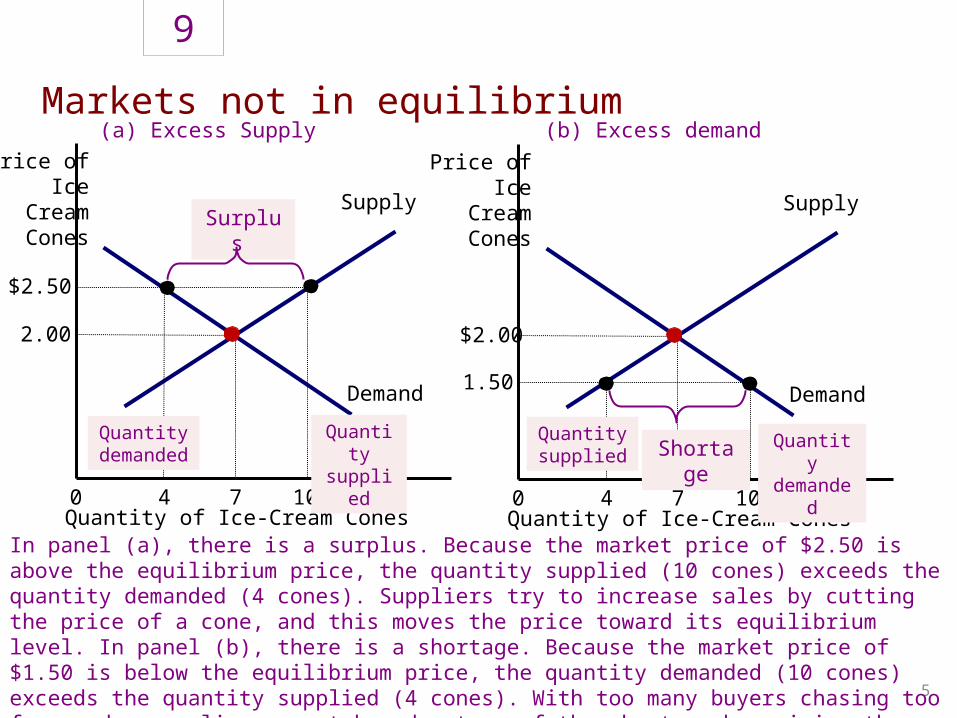
In panel (a), there is a surplus. Because the market price of $2.50 is above the equilibrium price, the quantity supplied (10 cones) exceeds the quantity demanded (4 cones). Suppliers try to increase sales by cutting the price of a cone, and this moves the price toward its equilibrium level. In panel (b), there is a shortage. Because the market price of $1.50 is below the equilibrium price, the quantity demanded (10 cones) exceeds the quantity supplied (4 cones). With too many buyers chasing too few goods, suppliers can take advantage of the shortage by raising the price. Hence, in both cases, the price adjustment moves the market toward the equilibrium of supply and demand
(b) Excess demand
2.00
Supply Surplus
4
Quantitydemanded
10
Quantitysupplied
Price ofIce
CreamCones
Quantity of Ice-Cream Cones 0
Demand
7
1.50
$2.00
Supply
Shortage
4
Quantitysupplied
10
Quantitydemanded
Supply and Demand Together
• Law of supply and demand– The price of any good adjusts
• Bring the quantity supplied and the quantity demanded into balance
– In most markets• Surpluses and shortages are temporary
6
Supply and Demand Together
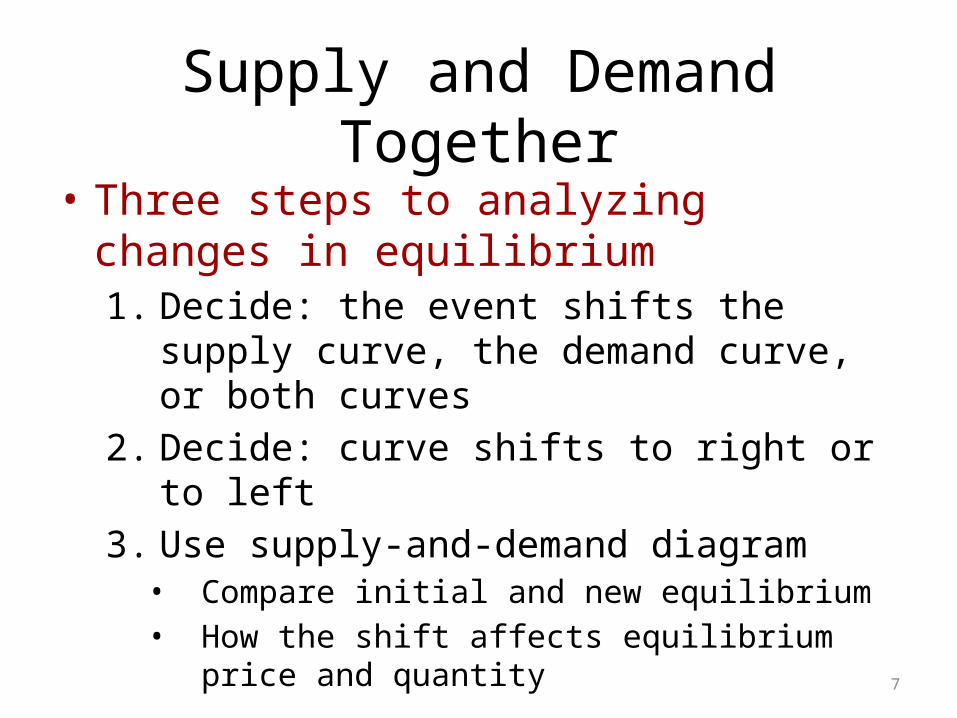
• Three steps to analyzing changes in equilibrium1. Decide: the event shifts the supply curve, the
demand curve, or both curves2. Decide: curve shifts to right or to left3. Use supply-and-demand diagram
• Compare initial and new equilibrium• How the shift affects equilibrium price and quantity
7
Three steps for analyzing changes in equilibrium
3
8
1. Decide whether the event shifts the supply or demand curve (or perhaps both).
2. Decide in which direction the curve shifts.
3. Use the supply-and demand diagram to see how the shift changes the equilibrium price and quantity.
Supply and Demand Together
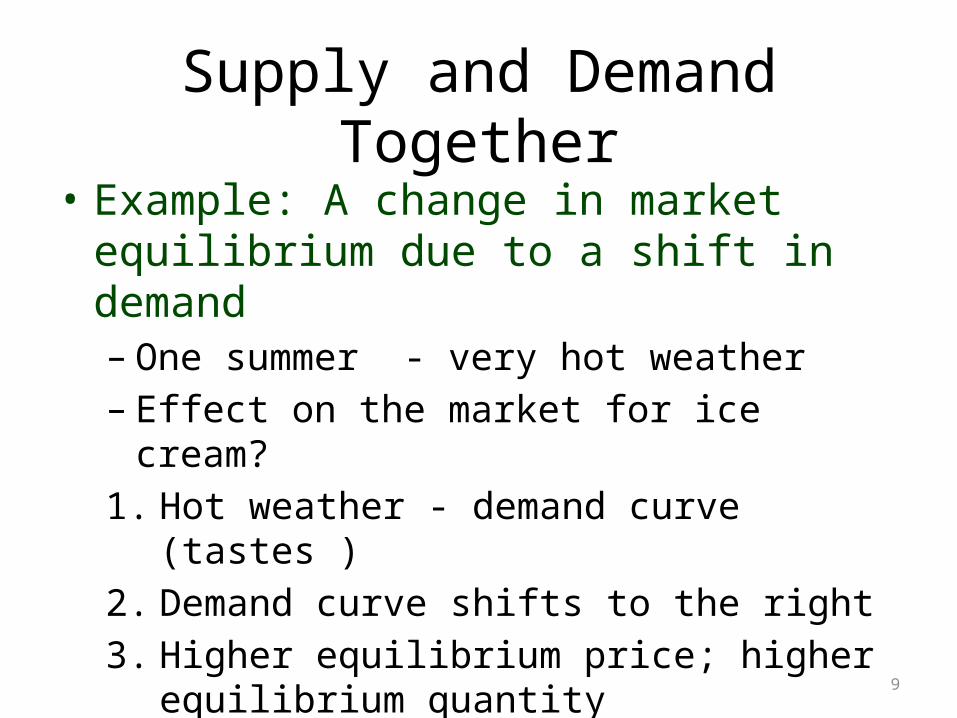
• Example: A change in market equilibrium due to a shift in demand– One summer - very hot weather– Effect on the market for ice cream? 1. Hot weather - demand curve (tastes ) 2. Demand curve shifts to the right 3. Higher equilibrium price; higher equilibrium
quantity
9
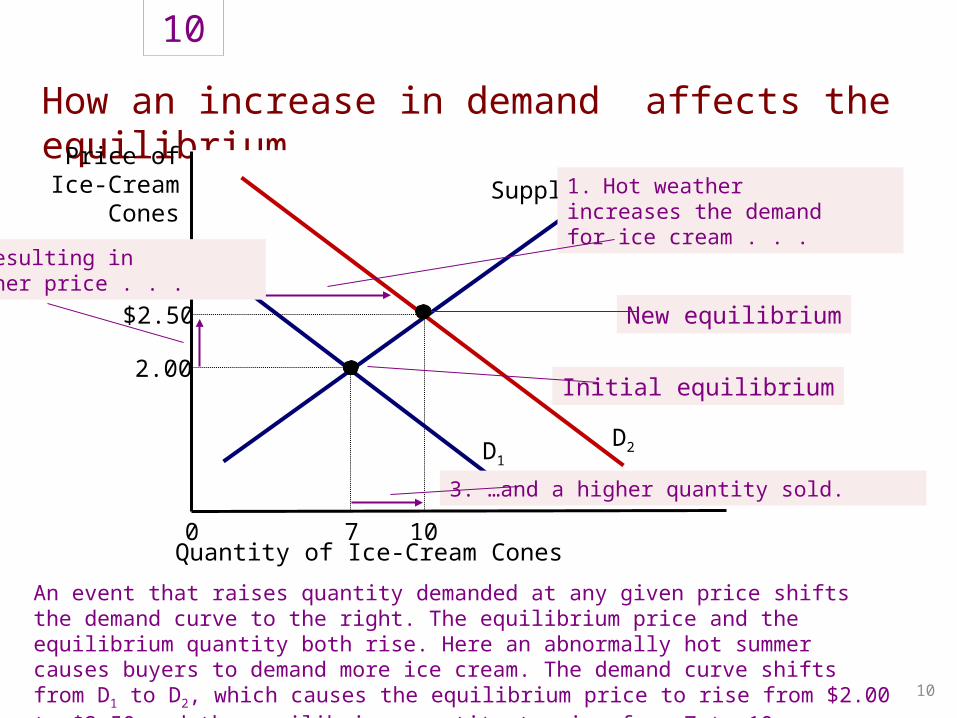
How an increase in demand affects the equilibrium
10
10
Supply
New equilibrium
D2
An event that raises quantity demanded at any given price shifts the demand curve to the right. The equilibrium price and the equilibrium quantity both rise. Here an abnormally hot summer causes buyers to demand more ice cream. The demand curve shifts from D1 to D2, which causes the equilibrium price to rise from $2.00 to $2.50 and the equilibrium quantity to rise from 7 to 10 cones
Price ofIce-Cream
Cones
Quantity of Ice-Cream Cones 0 7
$2.50
2.00
10
D1
Initial equilibrium
1. Hot weatherincreases the demandfor ice cream . . .
2. …resulting in a higher price . . .
3. …and a higher quantity sold.
Supply and Demand Together
• Shifts in curves versus movements along curves – Shift in the supply curve
• Change in supply
– Movement along a fixed supply curve• Change in the quantity supplied
– Shift in the demand curve• Change in demand
– Movement along a fixed demand curve• Change in the quantity demanded
11
Supply and Demand Together
• Example: A change in market equilibrium due to a shift in supply– One summer - a hurricane destroys part of the
sugarcane crop• Price of sugar - increases
– Effect on the market for ice cream?1. Change in price of sugar - supply curve2. Supply curve - shifts to the left3. Higher equilibrium price; lower equilibrium
quantity12
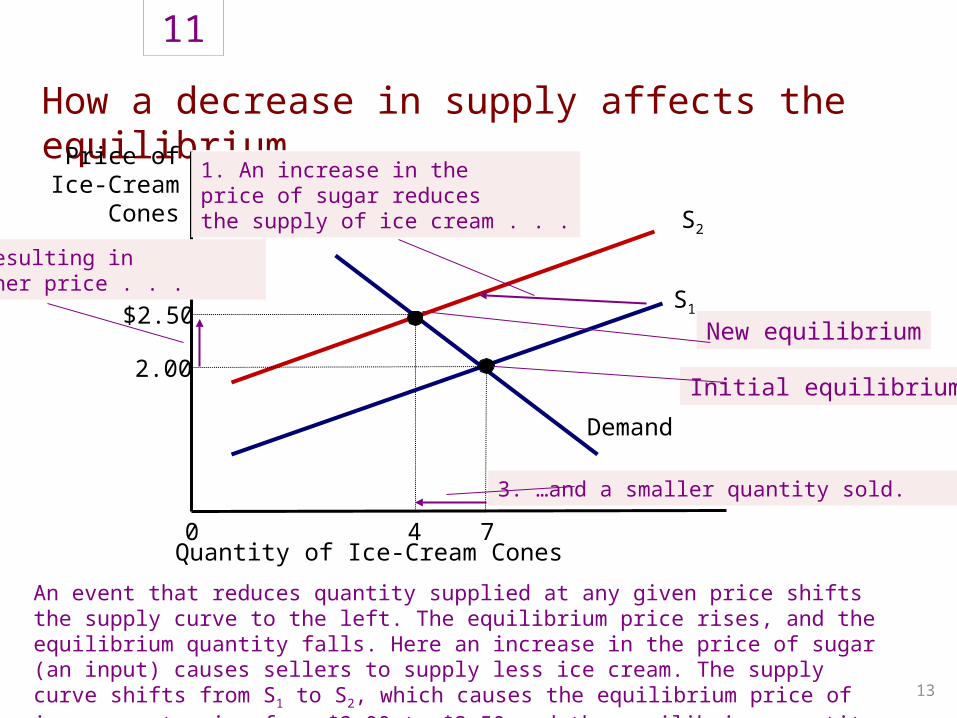
How a decrease in supply affects the equilibrium
11
13
S1
New equilibrium
S2
An event that reduces quantity supplied at any given price shifts the supply curve to the left. The equilibrium price rises, and the equilibrium quantity falls. Here an increase in the price of sugar (an input) causes sellers to supply less ice cream. The supply curve shifts from S1 to S2, which causes the equilibrium price of ice cream to rise from $2.00 to $2.50 and the equilibrium quantity to fall from 7 to 4 cones
Price ofIce-Cream
Cones
Quantity of Ice-Cream Cones 0 7
$2.50
2.00
4
Demand
Initial equilibrium
1. An increase in theprice of sugar reducesthe supply of ice cream . . .
2. …resulting in a higher price . . .
3. …and a smaller quantity sold.
Supply and Demand Together
• Example: shifts in both supply and demand– One summer: hurricane and heat wave
1. Heat wave – shift demand curve; hurricane – shift supply curve
2. Demand curve shifts to the right; Supply curve shifts to the left
3. Equilibrium price raises– If demand increases substantially while supply falls just a little:
equilibrium quantity –rises– If supply falls substantially while demand rises just a little:
equilibrium quantity falls
14
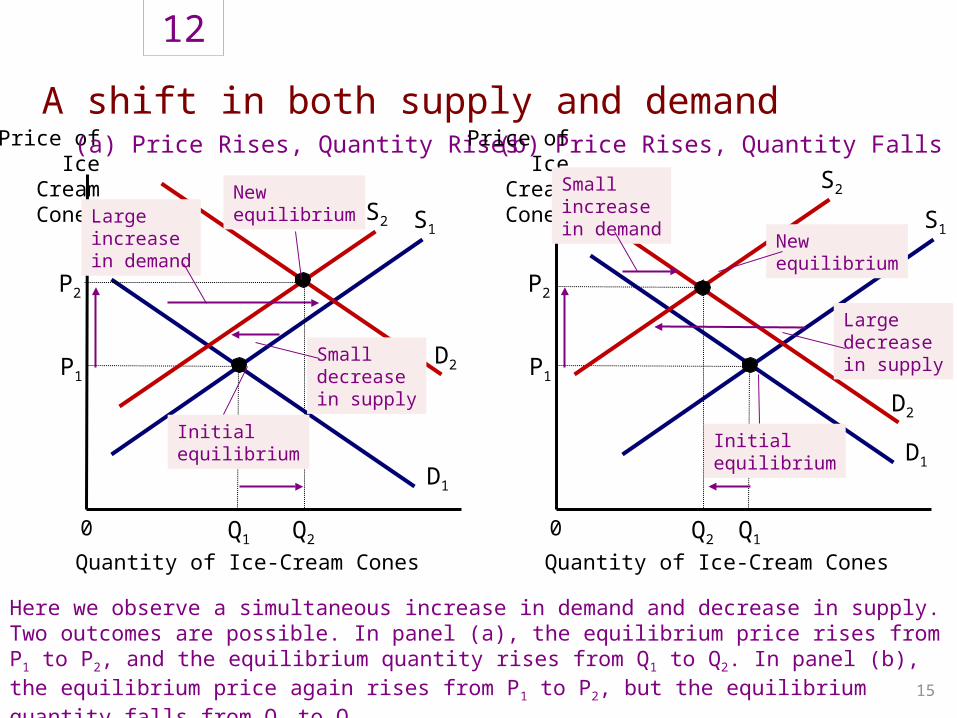
A shift in both supply and demand
12
15
Price ofIce
CreamCones
Quantity of Ice-Cream Cones
0
D1
P2
(a) Price Rises, Quantity Rises
Here we observe a simultaneous increase in demand and decrease in supply. Two outcomes are possible. In panel (a), the equilibrium price rises from P1 to P2, and the equilibrium quantity rises from Q1 to Q2. In panel (b), the equilibrium price again rises from P1 to P2, but the equilibrium quantity falls from Q1 to Q2.
(b) Price Rises, Quantity Falls
P1
S1
Q1 Q2
D2
S2
Initialequilibrium
New equilibrium
Smalldecreasein supply
Largeincreasein demand
Price ofIce
CreamCones
Quantity of Ice-Cream Cones
0
D1
P2
P1
S1
Q1Q2
D2
S2
Initialequilibrium
New equilibrium
Large decreasein supply
Small increasein demand
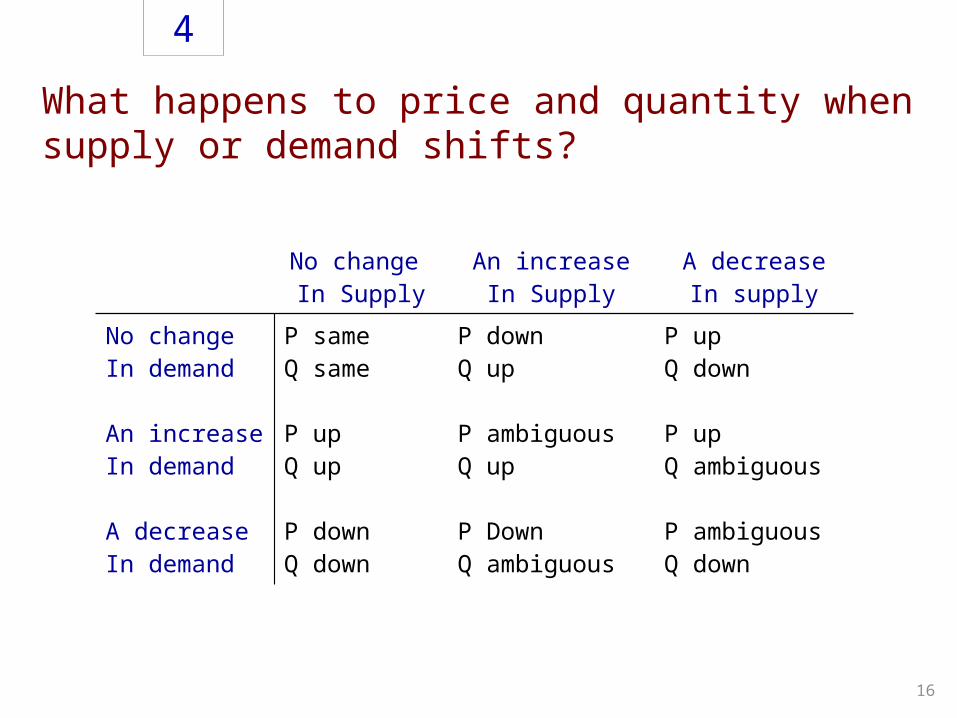
What happens to price and quantity when supply or demand shifts?
4
16
No change In Supply
An increaseIn Supply
A decreaseIn supply
No changeIn demand
An increaseIn demand
A decreaseIn demand
P sameQ same
P upQ up
P downQ down
P downQ up
P ambiguousQ up
P DownQ ambiguous
P upQ down
P upQ ambiguous
P ambiguousQ down