Embed Size (px)
Citation preview

Education at a Glance © OECD 2011 379
The Learning environmenTand organisaTion
of schooLs
DChapter
IndIcator D1
Education at a Glance © OECD 2011380
How MucH TiMe Do STuDenTS SpenD in THe claSSrooM?
•Students in OECD countries are expected to receive an average of 6 732 hours of instruction between the ages of 7 and 14, and most of that intended instruction time is compulsory.
•On average across OECD countries, instruction in reading, writing and literature, mathematics and science represents 48% of the compulsory instruction time for 9-11 year-olds and 41% for 12-14 year-olds.
1 2 http://dx.doi.org/10.1787/888932461807
Ages 7 to 8 Ages 9 to 11 Ages 12 to 14
Chart D1.1. Total number of intended instruction hours in public institutions between the ages of 7 and 14 (2009)
1. Estimated because breakdown by age not available.2. Minimum number of hours per year.3. "Ages 12-14" covers ages 12-13 only.Countries are ranked in ascending order of the total number of intended instruction hours.Source: OECD. Table D1.1. See Annex 3 for notes (www.oecd.org/edu/eag2011).
0 1 000 2 000 3 000 4 000 5 000 6 000 7 000 8 000 9 000
Total number of intendedinstruction hours
Poland
Estonia
Finland
Slovenia
Russian Federation
Sweden1
Korea
Czech Republic2
Hungary
Norway
Slovak Republic
Greece
Japan
Germany
Iceland
Denmark
OECD averageAustria
Chile
Turkey
Belgium (Fl.)
England
Portugal
Luxembourg
Spain
Ireland
France
Mexico
Netherlands
Belgium (Fr.)3
Israel
Australia
Italy
IndIcator D1
Education at a Glance © OECD 2011 381
contextInstruction time in formal classroom settings accounts for a large portion of public investment in student learning and is a central component of effective schooling. The amount of instruction time and after-school lessons available to students is an important indication of students’ opportunities to learn. Matching resources with students’ needs and making optimal use of time are central to education policy. The main costs of education are the use and deployment of teachers, institutional maintenance and other educational resources. The length of time during which these resources are made available to students (as partly shown in this indicator) is thus an important factor in determining how funds for education are allocated (see Indicator B7).
Countries make various choices concerning the overall amount of time devoted to instruction and which subjects should be compulsory. These choices reflect national and/or regional priorities and preferences on what material students should be taught and at what age. Countries usually have statutory or regulatory requirements regarding hours of instruction. These are most often stipulated as the minimum number of hours of instruction a school must offer and are based on the notion that sufficient teaching time is required for good learning outcomes.
other findings• In OECD countries, compulsory instruction time for 7-8 year-old students averages 749 hours
per year and intended instruction time averages 775 hours per year. Students aged 9 to 11 receive, on average, about 44 more hours of compulsory education per year than 7-8 year-olds, while students aged 12 to 14 receive about 80 more hours per year than 9-11 year-olds. Students aged 9 to 11 receive just over 46 more hours of intended instruction per year than 7-8 year-olds, and students aged 12 to 14 receive 86 more hours per year than 9-11 year-olds.
• For 9-11 year-olds, the proportion of the compulsory curriculum that is devoted to reading, writing and literature varies widely, from 11% in Indonesia to 30% or more in France, Mexico and the Netherlands.
chapter D The Learning environmenT and organisaTion of schooLs
D1
Education at a Glance © OECD 2011382
analysis
Total intended instruction time
Total intended instruction time is an estimate of the number of hours during which students are taught both compulsory and non-compulsory parts of the curriculum as per public regulations.
Between the ages of 7 and 8, students in OECD countries are expected to receive 1 550 hours of instruction, those between the ages of 9 and 11 are expected to receive 2 462 hours, and those between the ages of 12 and 14 are expected to receive 2 720 hours. Most of this instruction time is compulsory.
While the average instruction time for students in OECD countries between the ages of 7 and 14 is 6 732 hours, formal teaching-time requirements range from 4 715 hours in Poland to 8 316 hours in Italy. During these hours, schools are obliged to offer instruction in compulsory and non-compulsory subjects. The total intended instruction time for this age range is a good indicator of students’ theoretical workload in school, but it cannot be interpreted as the actual amount of instruction time students receive during the years they spend in initial education.
Annual instruction time should be examined together with the length of compulsory education. In some countries with a heavier student workload, compulsory education covers fewer years and students drop out of the school system earlier; in other countries, a more even distribution of workload and study time over more years ultimately means a larger number of total instruction hours for all. Table D1.1 shows the age range at which over 90% of the population is in education (see Indicator C1). Chart D1.1 shows the total amount of intended instruction time students should receive between the ages of 7 and 14. Intended instruction time does not capture the quality of learning opportunities provided or the level or quality of the human and material resources involved (see Indicator D2, which shows the number of teachers relative to the student population).
In some countries, intended instruction time varies considerably among regions or types of schools. In many countries, local education authorities or schools determine the number and allocation of hours of instruction. Intended instruction time can also differ from the actual instruction time. Additional teaching time is often planned for enrichment or remedial courses (Box D1.1). However, time may be lost because of student absences or a lack of qualified substitutes to replace absent teachers.
Box D1.1. after-school lessons
Intended instruction time only captures the time spent by students in formal classroom settings. This is only a part of the total time students spend receiving instruction. Instruction also occurs outside the classroom and/or school. Secondary school students are often encouraged to take after-school classes in subjects already taught in school to help them improve their performance in key subjects. Students can take part in after-school lessons in the form of remedial “catch-up” classes or enrichment courses, with individual tutors or in group lessons provided by school teachers, or other independent courses. These lessons can be financed publically, or can be financed by students and their families.
Findings from the 2009 PISA survey suggest that the amount of time spent in these after-school lessons differs widely among countries. On average across OECD countries, a large proportion of students reported that they attend after-school lessons for up to four hours a week: in mathematics (26%), science (17%), language-of-instruction (reading, writing and literature) (16%), and other subjects (19%). Some students even spend more than four hours a week attending after-school lessons: in mathematics (7%), language-of-instruction (5%), science (5%) and other subjects (7%). In general, after-school lessons in mathematics are most common. In Estonia, Greece, Korea, the Russian Federation and Shanghai-China, more than 45% of students spend up to 4 hours a week in after-school lessons in mathematics; an additional 20% or more of students in Korea, Indonesia and Shanghai-China spend more than 4 hours a week. A similar pattern is observed for the other subjects (Table D1.3, available on line).

D1
How Much Time Do Students Spend in the Classroom? – InDIcator D1 chapter D
Education at a Glance © OECD 2011 383
Compulsory instruction time
Total compulsory instruction time is the estimated number of hours during which students are taught both the compulsory core curriculum and flexible parts of the compulsory curriculum. In OECD countries, students between the ages of 7 and 14 receive an average of 6 497 hours of compulsory instruction.
Intended instruction time is fully compulsory for all age groups between 7 and 14 years in Australia, the Czech Republic, Denmark, England, Estonia, Germany, Greece, Iceland, Israel, Japan, Korea, Luxembourg, Mexico, the Netherlands, Norway, the Russian Federation, Slovenia, Spain and Sweden. Except for Australia, England, Israel, Luxembourg, Mexico, the Netherlands and Spain, the total length of intended instruction time in these countries is less than the OECD average. Intended instruction time is also fully compulsory at age 15 in these 19 countries, except in Israel, and except in Japan, for which data are missing. In France and Ireland, although total intended instruction time is fully compulsory for 7-8 year-olds and 9-11 year-olds, it is not compulsory for the older age groups. In Finland, total intended instruction time is only fully compulsory for 7-8 year-olds.
OECD countries report an average annual total compulsory instruction time in classroom settings of 749 hours for 7-8 year-olds, 793 hours for 9-11 year-olds and 873 hours for 12-14 year-olds. Most 15-year-olds are enrolled in programmes that provide an average of 902 hours of compulsory instruction (Table D1.1).
Instruction time in reading, writing and literature, mathematics and science
In OECD countries, 9-11 year-olds do not necessarily attend separate classes for each subject they study. Students at this age spend an average of 48% of the compulsory curriculum on three basic subjects: reading, writing and literature (23%), mathematics (16%) and science (9%). On average, an additional 9% of the compulsory curriculum is devoted to modern foreign languages and 8% to social studies. Together with the arts (11%) and physical education (9%), these seven study areas form the major part of the curriculum for this age group in all OECD and other G20 countries with available data. Ancient Greek and/or Latin, technology, religion, practical and vocational skills and other subjects make up the remainder (11%) of the compulsory core curriculum for 9-11 year-olds (Table D1.2a and Chart D1.2a).
100908070605040302010
0
% Compulsory �exible curriculumScience
Other compulsory core curriculumMathematics
Modern foreign languagesReading, writing and literature
Chart D1.2a. Instruction time per subject as a percentage of total compulsory instruction time for 9-11 year-olds (2009)
Percentage of intended instruction time devoted to various subject areas within the total compulsory curriculum
Net
herl
ands
1
Mex
ico
Fran
ce
Hun
gary
Irel
and
Rus
sian
Fed
erat
ion
Den
mar
k
Aus
tria
Nor
way
Gre
ece
Slov
ak R
epub
lic
Spai
n
Ital
y
Belg
ium
(Fl.)
Engl
and
Isra
el
Luxe
mbo
urg2
Esto
nia
Finl
and
Port
ugal
3
Arg
enti
na4
Kor
ea
Japa
n
Turk
ey
Chi
le
Slov
enia
Pola
nd3
Ger
man
y
Icel
and
Indo
nesi
a
1. Includes 11-year-olds only.2. German as a language of instruction is included in “Reading, writing and literature” in addition to the mother tongue Luxemburgish.3. Includes 10-11 year-olds only.4. Year of reference 2008.Countries are ranked in descending order of the proportion of intended instruction hours devoted to reading, writing and literature.Source: OECD. Argentina, Indonesia: UNESCO Institute for Statistics (World Education Indicators Programme). Table D1.2a. See Annex 3 for notes (www.oecd.org/edu/eag2011).1 2 http://dx.doi.org/10.1787/888932461826

chapter D The Learning environmenT and organisaTion of schooLs
D1
Education at a Glance © OECD 2011384
100908070605040302010
0
%
Chart D1.2b. Instruction time per subject as a percentage of total compulsory instruction time for 12-14 year-olds (2009)
Percentage of intended instruction time devoted to various subject areas within the total compulsory curriculum
Irel
and1
Ital
y2
Den
mar
k
Isra
el
Gre
ece
Spai
n
Belg
ium
(Fr.)
2
Turk
ey
Luxe
mbo
urg3
Nor
way
Hun
gary
Pola
nd
Fran
ce
Arg
enti
na4
Chi
le
Rus
sian
Fed
erat
ion
Slov
ak R
epub
lic
Mex
ico
Esto
nia
Icel
and
Belg
ium
(Fl.)
Indo
nesi
a
Ger
man
y
Aus
tria
Finl
and
Slov
enia
Kor
ea
Port
ugal
Engl
and
Japa
n
1. For 13-14 year-olds, “Arts” is included in “Non-compulsory curriculum”.2. Includes 12-13 year-olds only.3. German as a language of instruction is included in "Reading, writing and literature" in addition to the mother tongue Luxemburgish.4. Year of reference 2008.Countries are ranked in descending order of the proportion of intended instruction hours devoted to reading, writing and literature.Source: OECD. Argentina, Indonesia: UNESCO Institute for Statistics (World Education Indicators Programme). Table D1.2b. See Annex 3 for notes (www.oecd.org/edu/eag2011).
Compulsory �exible curriculum
Science
Other compulsory core curriculum
Mathematics
Modern foreign languages
Reading, writing and literature
1 2 http://dx.doi.org/10.1787/888932461845
On average, the largest portion of the curriculum for 9-11 year-olds is devoted to reading and writing, but the differences among countries are greater than in other subjects. For example, in Indonesia, reading and writing accounts for 11% of compulsory instruction time while in France, Mexico and the Netherlands, it accounts for 30% or more of compulsory instruction time. There are also sizeable variations between countries in the time spent learning modern foreign languages. In Argentina, Chile, England, Japan, Mexico and the Netherlands, instruction in modern foreign languages accounts for 3% or less of instruction time; in Estonia, Germany, Greece, Israel, Italy, the Slovak Republic, Slovenia, Spain and Turkey it accounts for 10% or more of instruction time; and in Luxembourg, instruction in modern foreign languages accounts for 25% of total instruction time.
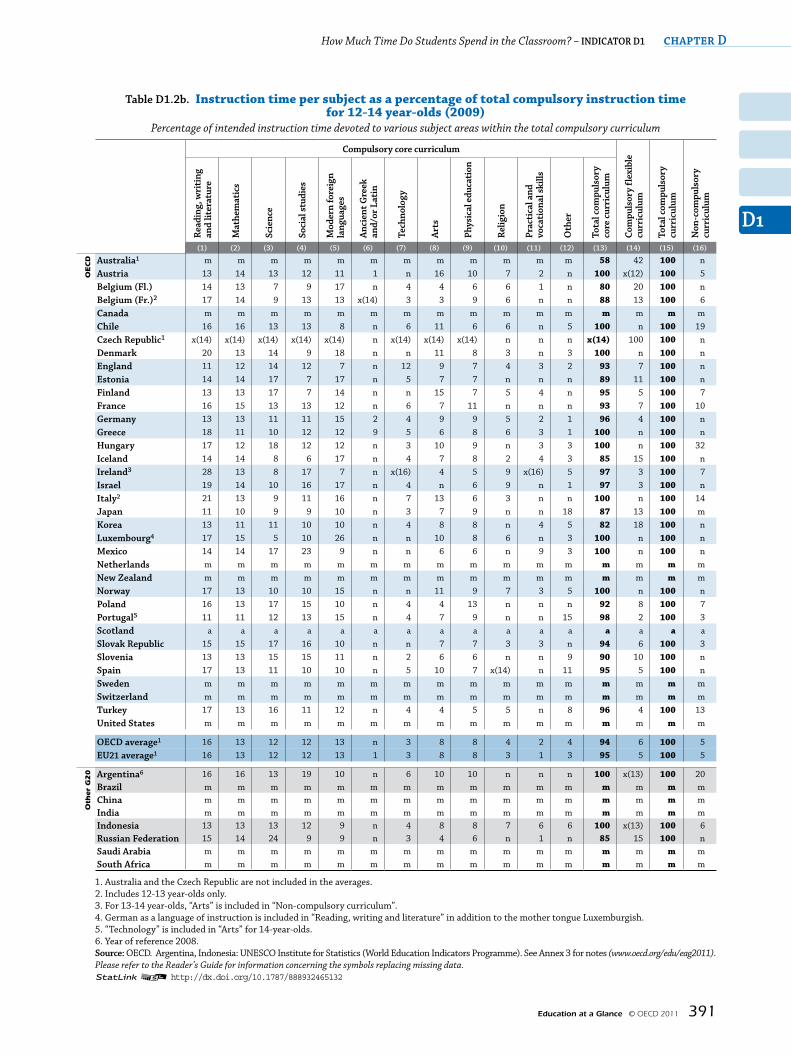
In OECD countries, an average of 41% of the compulsory curriculum for 12-14 year-olds is devoted to three subjects: reading, writing and literature (16%), mathematics (13%) and science (12%). Compared with the younger age group, a relatively larger part of the curriculum for this age group is devoted to modern foreign languages (13%) and social studies (12%), and somewhat less time is devoted to the arts (8%) and physical education (8%). Together, these seven study areas form the major part of the compulsory curriculum for lower secondary students in all OECD and partner countries. Ancient Greek and/or Latin, technology, religion, practical and vocational skills and other make up the remainder (12%) of the compulsory core curriculum for 12-14 year-olds (Table D1.2b and Chart D1.2b).
The allocation of time for the different subjects within the compulsory curriculum for 12-14 year-olds varies less among countries than it does for 9-11 year-olds. Again, one of the greatest variations is in the time spent teaching reading and writing, which ranges from 11% of compulsory instruction time in England, Japan and Portugal to 28% in Ireland, where reading and writing includes work in both English and Irish.

D1
How Much Time Do Students Spend in the Classroom? – InDIcator D1 chapter D
Education at a Glance © OECD 2011 385
Box D1.2. does investing in after-school classes pay off?
Students in countries that perform well in PISA spend less time, on average, in after-school lessons and individual study, and more time in regular school lessons, than students in countries that are poor performers in PISA.
According to findings based on PISA 2006 results, learning time spent in after-school lessons and individual study is negatively related to performance. Of course, this might be because students who attend after-school classes do so for remedial purposes, rather than to enhance their school studies. Still, across countries, findings show that students tend to perform better if a high percentage of their total learning time – which includes regular school lessons, after-school lessons and individual study – is spent during normal school hours in a classroom. For example, in the high-performing countries of Australia, Finland, Japan and New Zealand, over 70% of learning in science happens during regular school science lessons. Yet time spent learning does not fully explain why students in these countries are among the best performers. In fact, in all of these countries except New Zealand, 15-year-olds spend fewer hours learning science compared to the OECD average. The same pattern is observed for mathematics and language-of-instruction learning time.
Source: OECD (2011b).. . .
There is also substantial variation in the proportion of compulsory instruction time devoted to particular subjects for 9-11 year-olds compared to 12-14 year-olds. On average among OECD countries, the older age group spends about one-third less time studying reading, writing and literature than the younger age group. Conversely, time spent on science, social studies, modern foreign languages, technology and practical and vocational skills increases with students’ age. These differences are larger in some countries than in others. For example, the percentage of compulsory instruction time devoted to reading, writing and literature for 12-14 year-olds is around one-half of that for 9-11 year-olds in England and Mexico. Yet in Ireland and Italy, the difference is less than 5%. Indonesia is the only country where the proportion of compulsory instruction time devoted to reading, writing and literature is higher for 12-14 year-olds than for 9-11 year-olds. Clearly, countries place different emphases both on subjects and on when they should be taught to students.
Among OECD countries, the non-compulsory part of the curriculum accounts for an average of 4% of the total intended instruction time for 9-11 year-olds and 5% of the total intended instruction time for 12-14 year-olds. Nevertheless, a considerable amount of additional non-compulsory instruction time is sometimes provided. For 9-11 year-olds, all intended instruction time is compulsory in most countries, but additional non-compulsory time accounts for as much as 27% of total instruction time in Chile, 20% in Hungary and Turkey, 12% in Italy and 11% in Belgium (French Community). For 12-14 year-olds, non-compulsory instruction time is a feature in Argentina, Austria, Belgium (French Community), Chile, Finland, France, Hungary, Indonesia, Ireland, Italy, Poland, Portugal, the Slovak Republic and Turkey, ranging from 3% in Portugal and the Slovak Republic to 32% in Hungary (Tables D1.2a and D1.2b).
On average among OECD countries, the flexible part of the curriculum accounts for some 4% of compulsory instruction time for 9-11 year-olds and 6% for 12-14 year-olds. Within the compulsory part of the curriculum, students have varying degrees of freedom to choose the subjects they want to study. The Czech Republic allows complete flexibility (100%) in the compulsory curriculum for 9-14 year-olds. They are followed by Australia, which allows 59% flexibility in the compulsory curriculum for 9-11 year-olds and 42% for 12-14 year-olds. Belgium, Estonia, Iceland, Japan, Korea, the Russian Federation and Slovenia allow 10% or more flexibility in the compulsory curriculum for 12-14 year-olds (Tables D1.2a and D1.2b).

chapter D The Learning environmenT and organisaTion of schooLs
D1
Education at a Glance © OECD 2011386
600
550
500
450
400
350
Score Performance and total science learning time
Total science learning time(hours per week)
R²=0.02
3.5 4.5 5.5 6.0 7.04.0 5.0 6.5 7.5 8.0
Cross-country relationships between performance in science and total science learning time and between performance and percentage
of total science learning time allocated to regular school lessons (PISA 2006)
Russian Federation
Indonesia Brazil Argentina
Greece
Mexico
United Kingdom
Canada
United States
Portugal
Turkey
Italy
Estonia
Spain
Poland
Germany Hungary
Slovenia
Denmark Norway
Australia
Israel
France
Chile
Finland
Slovak Republic
Sweden
Iceland
Belgium Ireland
Austria
Switzerland
Japan
Czech Republic New Zealand
Korea
Luxembourg
Netherlands
NetherlandsSlovenia
IcelandIreland
SpainUnitedStates
Estonia
Austria
Portugal
600
550
500
450
400
350
ScorePerformance and relative learning time in regular school science lessons
(Share of learning hours in regular school lessons out of total science learning time)
Share of learning hours in regular school lessonsout of total science learning time (%)
R²=0.50
Source: OECD, PISA 2006 Database.
45 55 65 7050 60 75 80
RussianFederation
Brazil Argentina
Indonesia
Greece
Mexico
Chile Turkey
Poland
Italy
Israel
Germany
Slovak Republic
Norway Luxembourg
Switzerland
France
Belgium Canada
Denmark
Sweden
Korea United Kingdom
Finland
Japan New ZealandAustralia
Hungary Czech Republic
Definitions The compulsory curriculum refers to the amount and allocation of instruction time that almost every public school must provide and almost all public-sector students must attend. The measurement of the time devoted to specific study areas (subjects) focuses on the minimum common core rather than on the average time spent, since the data sources (policy documents) do not allow for more precise measurement.
Instruction time for 7-15 year-olds refers to the formal number of 60-minute hours per school year organised by the school for class instruction in the reference school year 2008-09. For countries with no formal policy
1 2 http://dx.doi.org/10.1787/888932461864
D1
How Much Time Do Students Spend in the Classroom? – InDIcator D1 chapter D
Education at a Glance © OECD 2011 387
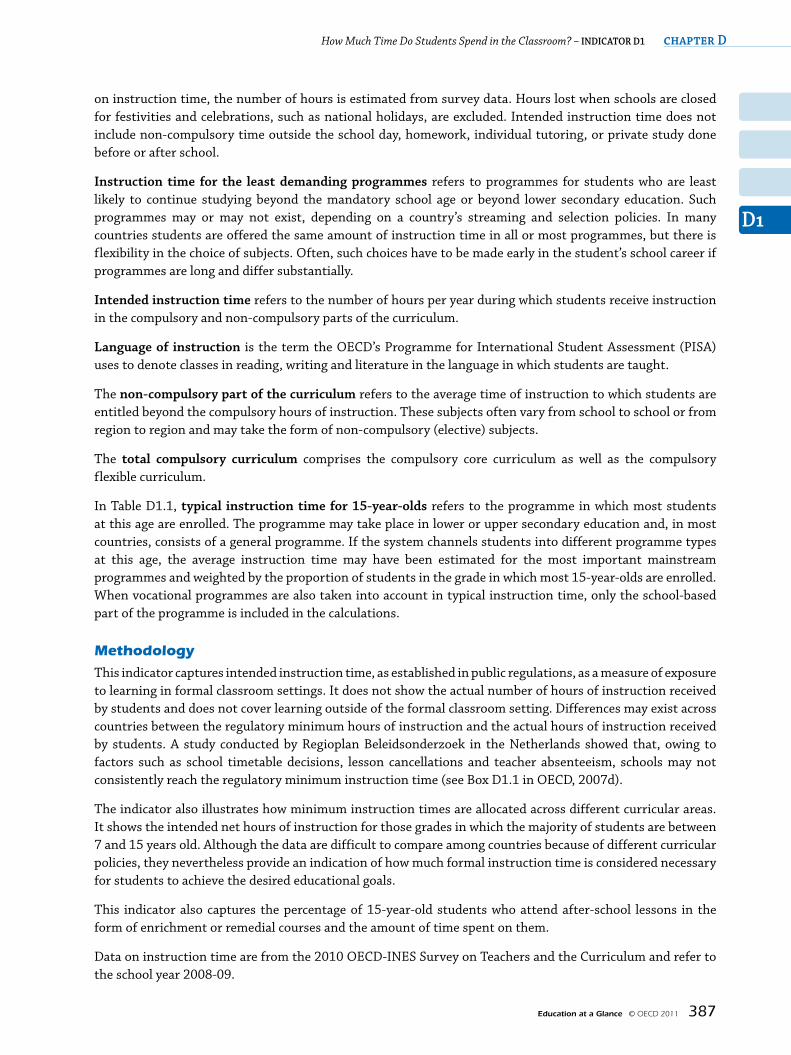
on instruction time, the number of hours is estimated from survey data. Hours lost when schools are closed for festivities and celebrations, such as national holidays, are excluded. Intended instruction time does not include non-compulsory time outside the school day, homework, individual tutoring, or private study done before or after school.
Instruction time for the least demanding programmes refers to programmes for students who are least likely to continue studying beyond the mandatory school age or beyond lower secondary education. Such programmes may or may not exist, depending on a country’s streaming and selection policies. In many countries students are offered the same amount of instruction time in all or most programmes, but there is flexibility in the choice of subjects. Often, such choices have to be made early in the student’s school career if programmes are long and differ substantially.
Intended instruction time refers to the number of hours per year during which students receive instruction in the compulsory and non-compulsory parts of the curriculum.
Language of instruction is the term the OECD’s Programme for International Student Assessment (PISA) uses to denote classes in reading, writing and literature in the language in which students are taught.
The non-compulsory part of the curriculum refers to the average time of instruction to which students are entitled beyond the compulsory hours of instruction. These subjects often vary from school to school or from region to region and may take the form of non-compulsory (elective) subjects.
The total compulsory curriculum comprises the compulsory core curriculum as well as the compulsory flexible curriculum.
In Table D1.1, typical instruction time for 15-year-olds refers to the programme in which most students at this age are enrolled. The programme may take place in lower or upper secondary education and, in most countries, consists of a general programme. If the system channels students into different programme types at this age, the average instruction time may have been estimated for the most important mainstream programmes and weighted by the proportion of students in the grade in which most 15-year-olds are enrolled. When vocational programmes are also taken into account in typical instruction time, only the school-based part of the programme is included in the calculations.
Methodology
This indicator captures intended instruction time, as established in public regulations, as a measure of exposure to learning in formal classroom settings. It does not show the actual number of hours of instruction received by students and does not cover learning outside of the formal classroom setting. Differences may exist across countries between the regulatory minimum hours of instruction and the actual hours of instruction received by students. A study conducted by Regioplan Beleidsonderzoek in the Netherlands showed that, owing to factors such as school timetable decisions, lesson cancellations and teacher absenteeism, schools may not consistently reach the regulatory minimum instruction time (see Box D1.1 in OECD, 2007d).
The indicator also illustrates how minimum instruction times are allocated across different curricular areas. It shows the intended net hours of instruction for those grades in which the majority of students are between 7 and 15 years old. Although the data are difficult to compare among countries because of different curricular policies, they nevertheless provide an indication of how much formal instruction time is considered necessary for students to achieve the desired educational goals.
This indicator also captures the percentage of 15-year-old students who attend after-school lessons in the form of enrichment or remedial courses and the amount of time spent on them.
Data on instruction time are from the 2010 OECD-INES Survey on Teachers and the Curriculum and refer to the school year 2008-09.

chapter D The Learning environmenT and organisaTion of schooLs
D1
Education at a Glance © OECD 2011388
The achievement scores are based on assessments administered as part of the Programme for International Student Assessment (PISA) undertaken by the Organisation for Economic Co-operation and Development (OECD). Data on after-school classes were collected during the 2006 and 2009 school year.
The target population studied for the analysis of after-school classes was 15-year-old students. Operationally, this referred to students aged between 15 years and 3 (completed) months and 16 years and 2 (completed) months at the beginning of the testing period and who were enrolled in an educational institution at the secondary level, irrespective of the grade levels or type of institutions in which they were enrolled, and of whether they participated in school full-time or part-time.
Notes on definitions and methodologies for each country are provided in Annex 3, available at www.oecd.org/edu/eag2011.
The statistical data for Israel are supplied by and under the responsibility of the relevant Israeli authorities. The use of such data by the OECD is without prejudice to the status of the Golan Heights, East Jerusalem and Israeli settlements in the West Bank under the terms of international law.
referencesFor further information about PISA 2006 and PISA 2009, see:OECD (2011b), Quality Time for Students: Learning In and Out of School, OECD, Paris.Visit www.pisa.oecd.org
The following additional material relevant to this indicator is available on line:
• Table D1.3. Percentage of 15-year-old students attending after-school lessons, by hours per week (PISA 2009) 1 2 http://dx.doi.org/10.1787/888932465151

D1
How Much Time Do Students Spend in the Classroom? – InDIcator D1 chapter D
Education at a Glance © OECD 2011 389
table D1.1. compulsory and intended instruction time in public institutions (2009)Average number of hours per year of total compulsory and non-compulsory instruction time in the curriculum
for 7-8, 9-11, 12-14 and 15-year-olds
Endi
ng a
ge o
f co
mpu
lsor
y ed
ucat
ion
age
rang
e at
whi
ch
over
90%
of t
he
popu
lati
on a
re
enro
lled
average number of hours per year of total compulsory instruction time
average number of hours per year of total intended instruction time
age
s 7-
8
age
s 9-
11
age
s 12
-14
age
15
(typ
ical
pr
ogra
mm
e)
age
15
(lea
st
dem
andi
ng
prog
ram
me)
age
s 7-
8
age
s 9-
11
age
s 12
-14
age
15
(typ
ical
pr
ogra
mm
e)
age
15
(lea
st
dem
andi
ng
prog
ram
me)
(1) (2) (3) (4) (5) (6) (7) (8) (9) (10) (11) (12)
oecD australia 15 5 - 16 972 971 983 964 932 972 971 983 964 932
austria 15 5 - 16 690 766 913 1 005 960 735 811 958 1 050 1 005Belgium (Fl.) 18 3 - 17 a a a a a 831 831 955 955 448Belgium (Fr.)1 18 3 - 17 840 840 960 m m 930 930 1 020 m mcanada 16 - 18 6 - 17 m m m m m m m m m mchile 18 6 - 15 675 675 709 743 743 855 855 855 945 945czech republic2 15 5 - 17 624 713 871 950 683 624 713 871 950 683Denmark 16 3 - 16 701 803 900 930 900 701 803 900 930 900England 16 4 - 16 893 899 925 950 a 893 899 925 950 aEstonia 15 4 - 17 595 683 802 840 m 595 683 802 840 mFinland 16 6 - 18 608 640 777 856 a 608 683 829 913 aFrance 16 3 - 17 847 847 971 1 042 a 847 847 1 065 1 147 aGermany 18 4 - 17 643 794 898 912 m 643 794 898 912 mGreece 14 - 15 5 - 17 720 812 821 798 a 720 812 821 798 aHungary 18 4 - 17 555 601 671 763 763 614 724 885 1 106 1 106Iceland 16 3 - 16 720 800 872 888 a 720 800 872 888 aIreland 16 5 - 18 941 941 848 802 713 941 941 907 891 891Israel 17 4 - 16 914 991 981 964 m 914 991 981 1 101 mItaly 16 3 - 16 891 913 1 001 1 089 m 990 1 023 1 089 1 089 mJapan 15 4 - 17 709 774 868 m a 709 774 868 m aKorea 14 7 - 17 612 703 867 1 020 a 612 703 867 1 020 aLuxembourg 15 4 - 15 924 924 908 900 900 924 924 908 900 900Mexico 15 4 - 14 800 800 1 167 1 058 a 800 800 1 167 1 058 anetherlands 18 4 - 17 940 940 1 000 1 000 a 940 940 1 000 1 000 anew Zealand 16 4 - 16 m m m m m m m m m mnorway 16 3 - 17 700 756 829 859 a 700 756 829 859 aPoland 16 6 - 18 446 563 604 595 a 486 603 644 635 aPortugal 14 5 - 16 875 869 908 893 m 910 898 934 945 mScotland 16 4 - 16 a a a a a a a a a aSlovak republic 16 6 - 17 687 767 813 926 926 715 785 842 926 926Slovenia 14 6 - 17 621 721 791 908 888 621 721 791 908 888Spain 16 3 - 16 875 821 1 050 1 050 1 050 875 821 1 050 1 050 1 050Sweden3 16 4 - 18 741 741 741 741 a 741 741 741 741 aSwitzerland 15 5 - 16 m m m m m m m m m mturkey 14 7 - 13 720 720 750 810 a 864 864 846 810 aUnited States 17 6 - 16 m m m m m m m m m m
oEcD average 16 5 - 16 749 793 873 902 860 775 821 907 941 889EU21 average 16 4 - 17 746 790 865 897 865 767 815 902 935 880
oth
er
G2
0 argentina4 17 5 - 15 m 720 744 m m m m m m mBrazil 17 7 - 15 m m m m m m m m m mchina m m 531 613 793 748 m m m m m mIndia m m m m m m m m m m m mIndonesia 15 6 - 14 m 551 654 m m m m m m mrussian Federation 17 7 - 14 493 737 879 912 m 493 737 879 912 mSaudi arabia m m m m m m m m m m m mSouth africa m m m m m m m m m m m m
1. “Ages 12-14” covers ages 12-13 only.2. Minimum number of hours per year.3. Estimated minimum numbers of hours per year because breakdown by age not available.4. Year of reference 2008.Source: OECD. Argentina, Indonesia: UNESCO Institute for Statistics (World Education Indicators Programme). China: The Ministry of Education, Notes on the Experimental Curriculum of Compulsory Education, 19 November 2001. See Annex 3 for notes (www.oecd.org/edu/eag2011).Please refer to the Reader’s Guide for information concerning the symbols replacing missing data.1 2 http://dx.doi.org/10.1787/888932465094

chapter D The Learning environmenT and organisaTion of schooLs
D1
Education at a Glance © OECD 2011390
table D1.2a. Instruction time per subject as a percentage of total compulsory instruction time for 9-11 year-olds (2009)
Percentage of intended instruction time devoted to various subject areas within the total compulsory curriculum
compulsory core curriculum
com
puls
ory
flex
ible
cu
rric
ulum
tota
l com
puls
ory
curr
icul
um
non
-com
puls
ory
curr
icul
um
rea
ding
, wri
ting
an
d lit
erat
ure
Mat
hem
atic
s
Scie
nce
Soci
al s
tudi
es
Mod
ern
fore
ign
lang
uage
s
anc
ient
Gre
ek a
nd/
or L
atin
tech
nolo
gy
art
s
Phys
ical
edu
cati
on
rel
igio
n
Prac
tica
l and
vo
cati
onal
ski
lls
oth
er
tota
l com
puls
ory
core
cur
ricu
lum
(1) (2) (3) (4) (5) (6) (7) (8) (9) (10) (11) (12) (13) (14) (15) (16)
oecD australia1 m m m m m m m m m m m m 41 59 100 n
austria 24 16 10 3 8 n n 18 10 8 x(12) 3 100 x(12) 100 6 Belgium (Fl.)1 22 19 x(12) x(12) 7 n n 10 7 7 n 18 89 11 100 nBelgium (Fr.)1 x(12) x(12) x(12) x(12) 5 n x(12) x(12) 7 7 n 81 100 n 100 11 canada m m m m m m m m m m m m m m m mchile 19 19 18 4 2 n 9 12 9 7 n 1 100 n 100 27 czech republic1 x(14) x(14) x(14) x(14) x(14) n x(14) x(14) x(14) n n n x(14) 100 100 nDenmark 26 16 7 5 9 n n 20 10 4 n 3 100 n 100 nEngland 22 19 12 9 3 n 11 9 7 4 1 3 100 n 100 nEstonia 21 15 7 6 12 n 4 9 10 n n 4 88 12 100 nFinland 21 18 10 2 9 n n 19 9 5 n n 94 6 100 7 France 30 19 5 11 9 n 3 9 14 n n n 100 n 100 nGermany 17 14 5 6 10 n 3 14 10 6 1 10 98 2 100 nGreece 23 13 6 16 14 n n 7 6 6 n 7 100 n 100 nHungary 29 17 6 7 9 n n 14 12 n 5 2 100 n 100 20 Iceland 16 15 8 8 4 n 6 12 9 3 5 3 89 11 100 nIreland 29 12 4 8 x(14) n n 12 4 10 n 14 92 8 100 nIsrael 21 17 8 11 11 n 1 5 6 11 n 3 93 7 100 nItaly2 22 17 8 11 13 n 2 14 7 6 n n 100 n 100 12 Japan 19 15 9 9 n n n 10 9 n n 21 92 8 100 mKorea 19 13 10 10 5 n 2 13 10 n 2 3 87 13 100 nLuxembourg3 21 18 6 2 25 n n 11 10 7 n n 100 n 100 nMexico 30 25 15 20 n n n 5 5 n n n 100 n 100 nnetherlands4 32 19 6 6 1 n n 9 7 5 3 n 88 13 100 nnew Zealand m m m m m m m m m m m m m m m mnorway 24 16 8 9 8 n n 15 9 8 n 3 100 n 100 nPoland5 17 13 23 8 9 n 4 4 13 n n n 91 9 100 7 Portugal5, 6 21 17 6 11 7 n x(8) 12 6 n n 18 98 2 100 3 Scotland a a a a a a a a a a a a a a a aSlovak republic 23 16 9 12 10 n 1 9 7 4 2 n 93 7 100 2 Slovenia 18 16 10 8 11 n 2 11 11 n 3 10 100 n 100 nSpain 23 17 9 9 13 n n 10 10 x(14) n 3 92 8 100 nSweden m m m m m m m m m m m m m m m mSwitzerland m m m m m m m m m m m m m m m mturkey 19 13 13 10 11 n 2 7 6 7 n 6 93 7 100 20 United States m m m m m m m m m m m m m m m m
oEcD average1 23 16 9 8 9 n 2 11 9 4 1 4 96 4 100 4 EU21 average1 23 16 8 8 9 n 2 12 9 4 1 4 96 4 100 3
oth
er
G2
0 argentina7 20 20 15 15 n n n 10 10 n n 10 100 x(13) 100 nBrazil m m m m m m m m m m m m m m m mchina 20-23 13-16 7-10 3-5 6-9 m m 9-12 10-12 m 16-21 7-10 m m m mIndia m m m m m m m m m m m m m m m mIndonesia 11 11 9 7 a n a 9 9 7 4 4 100 x(13) 100 4 russian Federation 27 16 7 6 9 n 7 7 7 n n n 85 15 100 nSaudi arabia m m m m m m m m m m m m m m m mSouth africa m m m m m m m m m m m m m m m m
1. Australia, Belgium (Fl.), Belgium (Fr.) and the Czech Republic are not included in the averages.2. For 9 and 10 year-olds the curriculum is largely flexible, for 11-year-olds it is about the same as for 12 and 13 year-olds.3. German as a language of instruction is included in “Reading, writing and literature” in addition to the mother tongue Luxemburgish. 4. Includes 11-year-olds only.5. Includes 10-11 year-olds only.6. For 9-year-olds, “Technology”, “Arts” and “Practical and vocational skills” are included in “Other”.7. Year of reference 2008.Source: OECD. Argentina, Indonesia: UNESCO Institute for Statistics (World Education Indicators Programme). China: The Ministry of Education, Notes on the Experimental Curriculum of Compulsory Education, 19 November 2001. See Annex 3 for notes (www.oecd.org/edu/eag2011).Please refer to the Reader’s Guide for information concerning the symbols replacing missing data.1 2 http://dx.doi.org/10.1787/888932465113
D1
How Much Time Do Students Spend in the Classroom? – InDIcator D1 chapter D
Education at a Glance © OECD 2011 391
table D1.2b. Instruction time per subject as a percentage of total compulsory instruction time for 12-14 year-olds (2009)
Percentage of intended instruction time devoted to various subject areas within the total compulsory curriculum
compulsory core curriculum
com
puls
ory
flex
ible
cu
rric
ulum
tota
l com
puls
ory
curr
icul
um
non
-com
puls
ory
curr
icul
um
rea
ding
, wri
ting
an
d lit
erat
ure
Mat
hem
atic
s
Scie
nce
Soci
al s
tudi
es
Mod
ern
fore
ign
lang
uage
s
anc
ient
Gre
ek
and/
or L
atin
tech
nolo
gy
art
s
Phys
ical
edu
cati
on
rel
igio
n
Prac
tica
l and
vo
cati
onal
ski
lls
oth
er
tota
l com
puls
ory
core
cur
ricu
lum
(1) (2) (3) (4) (5) (6) (7) (8) (9) (10) (11) (12) (13) (14) (15) (16)
oecD australia1 m m m m m m m m m m m m 58 42 100 n
austria 13 14 13 12 11 1 n 16 10 7 2 n 100 x(12) 100 5 Belgium (Fl.) 14 13 7 9 17 n 4 4 6 6 1 n 80 20 100 nBelgium (Fr.)2 17 14 9 13 13 x(14) 3 3 9 6 n n 88 13 100 6 canada m m m m m m m m m m m m m m m mchile 16 16 13 13 8 n 6 11 6 6 n 5 100 n 100 19 czech republic1 x(14) x(14) x(14) x(14) x(14) n x(14) x(14) x(14) n n n x(14) 100 100 nDenmark 20 13 14 9 18 n n 11 8 3 n 3 100 n 100 nEngland 11 12 14 12 7 n 12 9 7 4 3 2 93 7 100 nEstonia 14 14 17 7 17 n 5 7 7 n n n 89 11 100 nFinland 13 13 17 7 14 n n 15 7 5 4 n 95 5 100 7 France 16 15 13 13 12 n 6 7 11 n n n 93 7 100 10 Germany 13 13 11 11 15 2 4 9 9 5 2 1 96 4 100 nGreece 18 11 10 12 12 9 5 6 8 6 3 1 100 n 100 nHungary 17 12 18 12 12 n 3 10 9 n 3 3 100 n 100 32 Iceland 14 14 8 6 17 n 4 7 8 2 4 3 85 15 100 nIreland3 28 13 8 17 7 n x(16) 4 5 9 x(16) 5 97 3 100 7 Israel 19 14 10 16 17 n 4 n 6 9 n 1 97 3 100 nItaly2 21 13 9 11 16 n 7 13 6 3 n n 100 n 100 14 Japan 11 10 9 9 10 n 3 7 9 n n 18 87 13 100 mKorea 13 11 11 10 10 n 4 8 8 n 4 5 82 18 100 nLuxembourg4 17 15 5 10 26 n n 10 8 6 n 3 100 n 100 nMexico 14 14 17 23 9 n n 6 6 n 9 3 100 n 100 nnetherlands m m m m m m m m m m m m m m m mnew Zealand m m m m m m m m m m m m m m m mnorway 17 13 10 10 15 n n 11 9 7 3 5 100 n 100 nPoland 16 13 17 15 10 n 4 4 13 n n n 92 8 100 7 Portugal5 11 11 12 13 15 n 4 7 9 n n 15 98 2 100 3 Scotland a a a a a a a a a a a a a a a aSlovak republic 15 15 17 16 10 n n 7 7 3 3 n 94 6 100 3 Slovenia 13 13 15 15 11 n 2 6 6 n n 9 90 10 100 nSpain 17 13 11 10 10 n 5 10 7 x(14) n 11 95 5 100 nSweden m m m m m m m m m m m m m m m mSwitzerland m m m m m m m m m m m m m m m mturkey 17 13 16 11 12 n 4 4 5 5 n 8 96 4 100 13 United States m m m m m m m m m m m m m m m m
oEcD average1 16 13 12 12 13 n 3 8 8 4 2 4 94 6 100 5 EU21 average1 16 13 12 12 13 1 3 8 8 3 1 3 95 5 100 5
oth
er
G2
0 argentina6 16 16 13 19 10 n 6 10 10 n n n 100 x(13) 100 20 Brazil m m m m m m m m m m m m m m m mchina m m m m m m m m m m m m m m m mIndia m m m m m m m m m m m m m m m mIndonesia 13 13 13 12 9 n 4 8 8 7 6 6 100 x(13) 100 6 russian Federation 15 14 24 9 9 n 3 4 6 n 1 n 85 15 100 nSaudi arabia m m m m m m m m m m m m m m m mSouth africa m m m m m m m m m m m m m m m m
1. Australia and the Czech Republic are not included in the averages. 2. Includes 12-13 year-olds only.3. For 13-14 year-olds, “Arts” is included in “Non-compulsory curriculum”.4. German as a language of instruction is included in “Reading, writing and literature” in addition to the mother tongue Luxemburgish.5. “Technology” is included in “Arts” for 14-year-olds.6. Year of reference 2008.Source: OECD. Argentina, Indonesia: UNESCO Institute for Statistics (World Education Indicators Programme). See Annex 3 for notes (www.oecd.org/edu/eag2011).Please refer to the Reader’s Guide for information concerning the symbols replacing missing data.1 2 http://dx.doi.org/10.1787/888932465132