Embed Size (px)
Citation preview

Chapter – 5
Analysis and Interpretation

Chapter-5: Analysis and
Interpretation
5.1 Introduction
5.2 Growth Rate Analysis of Major Financial
Components of Selected Municipal Corporations
5.3 Ratio Analysis
5.4 Analysis of Variance
5.5 Regression Analysis

5. Analysis and Interpretation
5.1 Introduction
To ensure transparency and give a correct picture of assets
and liabilities, municipal corporations has introduced the accrual
based accounting system; presently, a mix of cash based system
and accrual based sys tem is being followed. The system involves
the revenue function (receipt of taxes, charges, loans and grants)
and the expenditure function (release of funds against
establishment, works and supplies).
The corporation maintains its accounts in the form of funds;
the income and expenditure items are indicated under each fund
account. There is a municipal general fund under which the normal
income and expenditure (revenue and capital) items are listed.
Apart from this, there are separate fund accounts for the loans,
anamat (public deposits), capital grants including contributions
from the corporation and tasalmaat (advances). Additionally, the
gas project is maintained as an individual entity and accounting
for the same is maintained separately with that of th e corporation.
The corporation maintains its assets in the form of fixed assets,
deposits, capital works-in-progress, investments in sinking fund
etc.; these are accounted under the anamat fund. The corporation
also holds a record of its current assets inc luding stores and spares
in hand, bank balance and cash balance. The loans and advances
paid to the employees and other parties are also accounted for as
assets.

As part of their liabilities, municipal corporations maintain a
tasalmat fund, consisting of revolving funds for specific purposes.
The reserves and surpluses contained by the corporation include
income from capital receipts and credit balance from revenue
income. In addition to these, there are current liabilities in the
form of sundry creditors , deposits received, employee related
liabilities and other liabilities.
Municipal finances hold the key to the overall status and
progress of service delivery in right direction. Poor finances of
municipal corporation results in poor basic services, low capital
investment, low credibility of municipal corporation, poor revenue
collection efficiency, corruption and the lack of innovation in
resource mobilization. This vicious cycle leads to poor delivery
and low quality of services, which will hamper the g rowth
potential of Municipal Corporation. Here, understanding the
structure or pattern of finance of Municipal Corporation and its
growth holds greater promise in the move towards improving the
municipal revenue.
The analysis of municipal finances first l ooks at the current
financial status of municipal bodies in providing civic amenities,
which is carried out in terms of current spending vis -à-vis the
standard/norm. The revenue of expenditure sides of municipal
finance are then analysed in terms of the gr owth and their
normalized indicators are used to benchmark the cities. The
performance is also measured through relative analysis of the
Municipal Corporations in a cross section in terms of absolute
figures and their growth. Although, the debt/borrowed fu nds can
play an important role, it is not examined here as only few of them

actually have gone to market and made borrowings. Therefore,
debt sustainability of the local governments is not looked upon in
this study.
5.2 Growth Rate Analysis of Major Financial
Components of Selected Municipal
Corporations
Following tables indicates the growth rates of study
indicators of all three Municipal Corporations for the period of ten
years i.e. from 1999-2000 to 2008-2009.
Municipal Corporations are expected to render a minimum
level of services to citizens in order to ensure providing a
minimum standard of living to citizens. To understand the above
situation, per capita revenue and expenditure are compared with
growth in total receipts and expenditures to see whet her there are
any inherent constraints to the provision of services before the
Municipal Corporations.
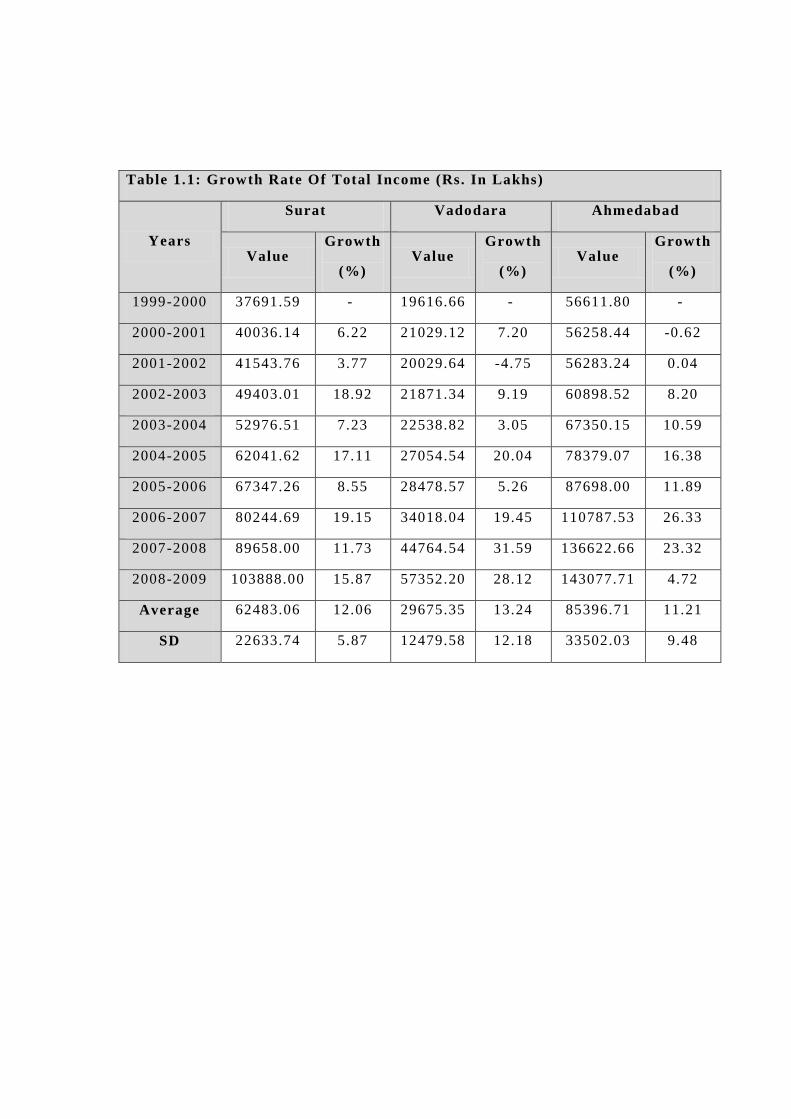
Table 1.1: Growth Rate Of Total Income (Rs. In Lakhs)
Years
Surat Vadodara Ahmedabad
Value Growth
(%) Value
Growth
(%) Value
Growth
(%)
1999-2000 37691.59 - 19616.66 - 56611.80 -
2000-2001 40036.14 6.22 21029.12 7.20 56258.44 -0.62
2001-2002 41543.76 3.77 20029.64 -4.75 56283.24 0.04
2002-2003 49403.01 18.92 21871.34 9.19 60898.52 8.20
2003-2004 52976.51 7.23 22538.82 3.05 67350.15 10.59
2004-2005 62041.62 17.11 27054.54 20.04 78379.07 16.38
2005-2006 67347.26 8.55 28478.57 5.26 87698.00 11.89
2006-2007 80244.69 19.15 34018.04 19.45 110787.53 26.33
2007-2008 89658.00 11.73 44764.54 31.59 136622.66 23.32
2008-2009 103888.00 15.87 57352.20 28.12 143077.71 4.72
Average 62483.06 12.06 29675.35 13.24 85396.71 11.21
SD 22633.74 5.87 12479.58 12.18 33502.03 9.48

Above table indicate growth rate of total income of all three
Municipal Corporations for the period of ten years data fro m
1999-2000 to 2008-2009. Overall growth rate, during this period
has been shown by taking average growth rate of all consecutive
years.
In the Surat Municipal Corporations growth rate is vary from
3.77 percent in the year 2001-2002 to 19.15 percent in the year
2006-2007 with an average growth rate 12.06 percentage. Standard
deviation (5.87) indicates consistency in the growth rates during
the taken period of time.
The variation in the growth rates for Vadodara Municipal
Corporation is found -4.75 percent in the year 2001-2002 to 28.12
percent in the year 2008-2009. Standard deviation (12.18)
indicates non-homogeneity in the growth rate of total income in
Chart 1.1: Growth Rate Of Total Income
-10.00
-5.00
0.00
5.00
10.00
15.00
20.00
25.00
30.00
35.00
1999-2000 2000-2001 2001-2002 2002-2003 2003-2004 2004-2005 2005-2006 2006-2007 2007-2008 2008-2009
Years
Gro
wth
Ra
te
Surat Vadodara Ahmedabad

Vadodara Municipal Corporation. Looking to the growth rate data
average growth rate is calculated 13 .24 percentages during of the
year 1999-2000 to 2008-2009.
According to the data of Ahmedabad Municipal Corporation
growth rate of total income, -2.82 percent found in the year 2000-
2001 and maximum growth rate found 23.58 percent in the year
2006-2007 with an average growth rate 8.75 percentages. Standard
deviation 9.27 of growth rate of total income indicate high
inconsistency during define period.
Table 1.2: Growth Rate of Per Capita Income (Rs. In Lakhs)
Years
Surat Vadodara Ahmedabad
Value Growth
(%)
Value Growth
(%)
Value Growth
(%)
1999-2000 1659.53 1542.34 1644.62
2000-2001 1644.98 -0.88 1609.91 4.38 1598.21 -2.82
2001-2002 1592.88 -3.17 1493.07 -7.26 1563.55 -2.17
2002-2003 1767.67 10.97 1587.47 6.32 1654.35 5.81
2003-2004 1768.88 0.07 1592.90 0.34 1789.15 8.15
2004-2005 1933.16 9.29 1861.75 16.88 2036.08 13.80
2005-2006 1958.28 1.30 1908.20 2.50 2227.78 9.41
2006-2007 2177.40 11.19 2219.42 16.31 2752.07 23.53
2007-2008 2270.29 4.27 2843.74 28.13 3318.78 20.59
2008-2009 2454.86 8.13 3547.57 24.75 3398.72 2.41
Average 1922.79 4.57 2020.64 10.26 2198.33 8.75
SD 293.09 5.48 677.64 11.86 712.05 9.27

Above table shows the per capita income of Surat, Vadodara
and Ahmedabad Municipal Corporations for the define period of
ten years using the projected Population from the year 1999 -2000
to 2008-2009 by taking the reference of Census of India.
In the year 2000-2001 and 2001-2002 the per capita income
is found to be negative and highest 11.19 percentage in the year
2006-2007. Average per capita income for the period 1999-2000 to
2008-2009 was 4.57 percentages with absolute figure of Rs
1922.79. The lowest per capita income was Rs. 1592 in the year
2001-2002 and highest Rs. 2454.86 in the year 2008 -2009.
According to per capita income growth rate, in Vadodara
Municipal Corporation the variation is found -7.26 percent to
28.13 percent in the year 2001-2002 & 2007-2008 respectively.
The lowest per capita income Rs 1493.07 was found in the year
Chart 1.2: Growth Rate of Per Capita Income
-10.00
-5.00
0.00
5.00
10.00
15.00
20.00
25.00
30.00
1999-2000 2000-2001 2001-2002 2002-2003 2003-2004 2004-2005 2005-2006 2006-2007 2007-2008 2008-2009
Years
Gro
wth
Ra
te
Surat Vadodara Ahmedabad

2001-2002 and highest was found Rs. 3547 .57 in the year 2008-
2009. The average per capita income is Rs. 2020.64 with average
growth rate 10.26 percent in Vadodara Municipal Corporation.
The average per capita income during the period from 1999 -
2000 to 2008-2009 is Rs. 2198.33 and average growt h rate is 8.75
in Ahmedabad Municipal Corporation. Looking to the lowest and
highest value of per capita income and growth rate, per capita
income was found Rs. 1563.55 as a lowest in the year 2001 -2002
and Rs. 3398.72 as a highest in the year 2008 -2009. As per growth
rate -2.82 percent as a lowest in the year 2000-2001 and 23.53
percent highest in the year 2006-2007.
Looking to the standard deviation value of all three
Municipal Corporations, consistent increase was found in per
capita income.
The level of expenditure is, to some extent, reflective of the
level of services rendered by Municipal Corporations. While the
trend in per capita expenditure would provide first approximation
of the level as services rendered by a municipal government, a
further segregation into discretionary and non-discretionary
components, relative share of revenue and capital expenditure,
share of establishment, administrative, wages -salaries as a
proportion of total revenue expenditure would reveal the quality of
expenditure and ability of local bodies to meet its stated
objectives.
Following tables indicates the year wise expenditure
growth rates as well as per capita expenditure growth rates.

Table 1.3: Growth Rate of Expenditure (Rs. In Lakhs)
Years
Surat Vadodara Ahmedabad
Value Growth
(%) Value Growth
(%)
Value Growth
(%)
1999-2000 23512.02 18268.41 43299.25
2000-2001 22995.83 -2.20 18294.21 0.14 47898.55 10.62
2001-2002 23355.66 1.56 18395.89 0.56 47261.93 -1.33
2002-2003 23904.11 2.35 19167.73 4.20 47406.43 0.31
2003-2004 25139.38 5.17 19535.85 1.92 47168.50 -0.50
2004-2005 26392.43 4.98 20195.36 3.38 49875.97 5.74
2005-2006 28816.07 9.18 20962.12 3.80 53737.70 7.74
2006-2007 34910.61 21.15 28483.90 35.88 68420.36 27.32
2007-2008 40811.53 16.90 29919.44 5.04 76675.34 12.07
2008-2009 48936.00 19.91 38237.29 27.80 78672.91 2.61
Average 29877.36 8.78 23146.02 9.19 56041.69 7.17
SD 8881.48 8.55 6785.19 13.10 13306.40 8.97
Chart 1.3: Growth Rate of Expenditure
-5.00
0.00
5.00
10.00
15.00
20.00
25.00
30.00
35.00
40.00
1999-2000 2000-2001 2001-2002 2002-2003 2003-2004 2004-2005 2005-2006 2006-2007 2007-2008 2008-2009
Years
Gro
wth
Rate
Surat Vadodara Ahmedabad

Table indicates the growth rates of Revenue Expenditure for
the period of ten years from 1999-2000 to 2008-2009 for Surat,
Vadodara and Ahmedabad Municipal Corporations.
In Surat compared to 1999-2000 expenditure was low
indicated by -2.20 percent negative growth rate, and heights
percentage growth rates 21.15 percent in the year 200 6-2007
compare to the previous year. With the average growth rate 8.78
percent, Surat municipal corporations found consistent in last few
years compare to beginning years of the duration.
For the Vadodara municipal corporations, growth rate found
to consistent except the year 2006-2007 and 2008-2009. In the
year mentioned with heights growth rates, there was a tremendous
rise found in expenditure with 35.88 and 27.80 percent of growth.
The average growth rate of expenditure is 9.19 percents.
Ahmedabad Municipal Corporation was not that consistent in
expenditure during the period. With the variation, -1.33 percent in
the year 2001-2002 to 27.22 percent in the year 2006 -2007. The
average growth rate of expenditure is 7.17 percent form the period
999-2000 to 2008-2009.
The Standard deviations overall growth rates for all three
municipal corporations can not be predicted.
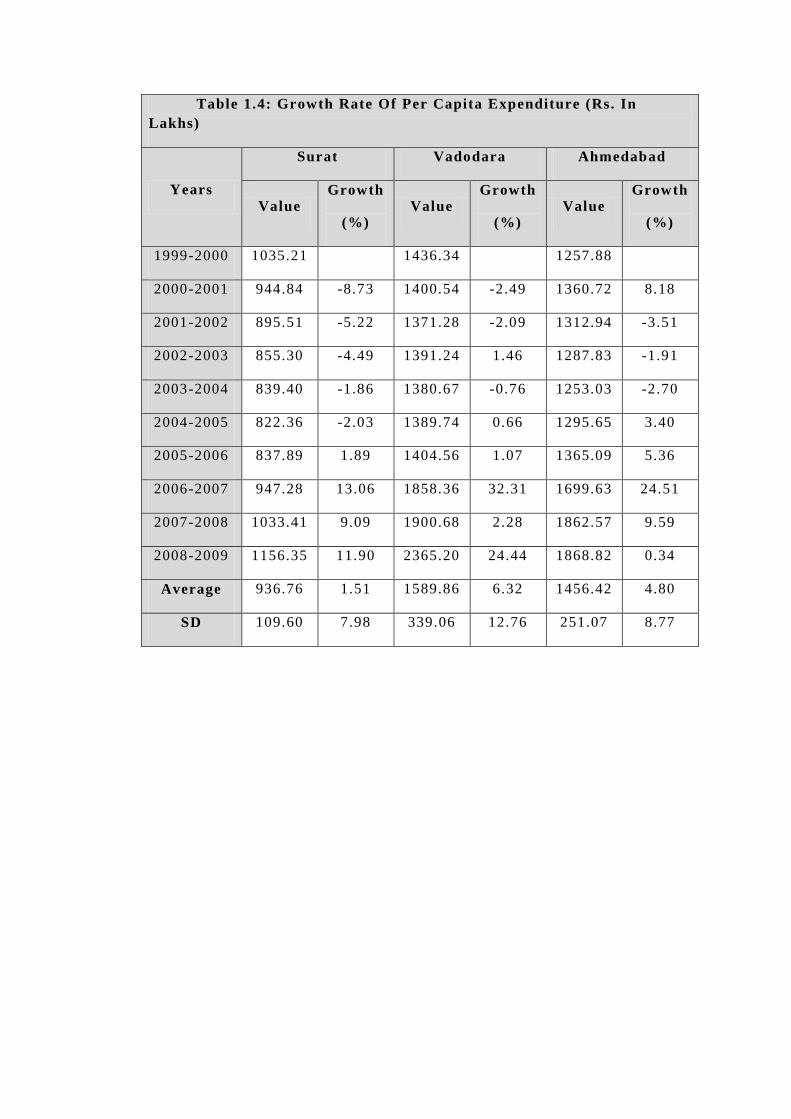
Table 1.4: Growth Rate Of Per Capita Expenditure (Rs. In
Lakhs)
Years
Surat Vadodara Ahmedabad
Value Growth
(%) Value
Growth
(%) Value
Growth
(%)
1999-2000 1035.21 1436.34 1257.88
2000-2001 944.84 -8.73 1400.54 -2.49 1360.72 8.18
2001-2002 895.51 -5.22 1371.28 -2.09 1312.94 -3.51
2002-2003 855.30 -4.49 1391.24 1.46 1287.83 -1.91
2003-2004 839.40 -1.86 1380.67 -0.76 1253.03 -2.70
2004-2005 822.36 -2.03 1389.74 0.66 1295.65 3.40
2005-2006 837.89 1.89 1404.56 1.07 1365.09 5.36
2006-2007 947.28 13.06 1858.36 32.31 1699.63 24.51
2007-2008 1033.41 9.09 1900.68 2.28 1862.57 9.59
2008-2009 1156.35 11.90 2365.20 24.44 1868.82 0.34
Average 936.76 1.51 1589.86 6.32 1456.42 4.80
SD 109.60 7.98 339.06 12.76 251.07 8.77

In the table above shows the per capita expenditure by
respective Municipal Corporations.
There is a high variation found in growth rate of per capita
expenditure in Surat Municipal Corporation. Per capita
expenditure varies from Rs. 822.36 to Rs. 1156.35. The average
per capita expenditure is Rs. 936.76 with an average growth rate
1.51 percent.
In the Vadodara, the per capita expenditure varies from Rs.
1371.28 during the year 2001-2002 to Rs. 2365.23 in the year
2008-2009. Again there was no linear increase found in the per
capita expenditure growth rate. The average per capita expenditure
of Vadodara Municipal Corporation is Rs. 1589.86 with average
growth rate 6.32 percent.
Chart 1.4: Growth Rate Of Per Capita Expenditure
-15.00
-10.00
-5.00
0.00
5.00
10.00
15.00
20.00
25.00
30.00
35.00
1999-2000 2000-2001 2001-2002 2002-2003 2003-2004 2004-2005 2005-2006 2006-2007 2007-2008 2008-2009
Years
Gro
wth
Rate
Surat Vadodara Ahmedabad

In the Ahmedabad, the per capita expenditure varies from
Rs. 1257.88 during the year 1999-2000 to Rs. 1868.82 in the year
2008-2009. Again there was no linear increase found in the per
capita expenditure growth rate. The average per c apita expenditure
of Ahmedabad Municipal Corporation is Rs. 1456.42 with average
growth rate 4.80 percent.
The high Standard Deviation value indicate that there was no
consistency in the per capital expenditure growth rates amongst
the all three Municipal Corporations.
Table 1.5: Growth Rate of Income over Expenditure (Rs. In Lakhs)
Years
Surat Vadodara Ahmedabad
Value Growth
(%)
Value Growth
(%)
Value Growth
(%)
1999-2000 14179.56 1348.25 13312.55
2000-2001 17040.31 20.18 2734.91 102.85 8359.90 -37.20
2001-2002 18188.10 6.74 1633.74 -40.26 9021.31 7.91
2002-2003 25498.90 40.20 2703.61 65.49 13492.09 49.56
2003-2004 27837.13 9.17 3002.97 11.07 20181.65 49.58
2004-2005 35649.18 28.06 6859.17 128.41 28503.10 41.23
2005-2006 38531.19 8.08 7516.45 9.58 33960.30 19.15
2006-2007 45334.08 17.66 5534.14 -26.37 42367.17 24.75
2007-2008 -39914.95 -188.05 14845.10 168.25 59947.32 41.49
2008-2009 -47897.12 20.00 19114.92 28.76 64404.80 7.44
Average 13444.64 -4.22 6529.33 49.75 29355.02 22.66
SD 31863.93 69.75 5980.54 71.36 20556.22 27.83

Table shows the growth rate of Income over Expenditure for
the period from 1999-2000 to 2008-2009.
Growth rate varies from -188.05 percent to 40.20 percent in
Surat municipal corporations in the year 2007 -2008 and 2002-2003
respectively.
Growth rate varies from -40.26 percent to 168.25 percent in
Vadodara municipal corporations in the year 2001 -2002 and 2007-
2008 respectively.
Growth rate varies from -37.20 percent to 49.58 percent in
Ahmedabad municipal corporations in the year 2000-2001 and
2003-2004 respectively.
Chart 1.5: Growth Rate of Income over Expenditure
-250.00
-200.00
-150.00
-100.00
-50.00
0.00
50.00
100.00
150.00
200.00
1999-2000 2000-2001 2001-2002 2002-2003 2003-2004 2004-2005 2005-2006 2006-2007 2007-2008 2008-2009
Years
Gro
wth
Rate
Surat Vadodara Ahmedabad

Surat, Vadodara and Ahmedabad municipal corporations
having average growth rate 69.75, 71.36 and 27.83 percent
respectively.
The revenue performance of a municipal corporation can be
observed in terms of growth of tax revenue, growth of total (tax
and non-tax) revenue, composition of tax and non -tax performers
amongst the municipal corporations, shared revenue to total
revenue (decentralization) and transfers from state government to
total revenue receipts (dependency).
Growth of tax revenue is an important indicator which
reflects the strength of a municipal corporation to undertake
service provisioning responsibilities.
Table 1.6: Growth Rate of Income from Tax (Rs. In Lakhs)
Years
Surat Vadodara Ahmedabad
Value Growth
(%) Value
Growth
(%) Value
Growth
(%)
1999-2000 29770.78 14817.88 42584.04
2000-2001 31638.85 6.27 16349.95 10.34 42235.01 -0.82
2001-2002 33324.30 5.33 15551.19 -4.89 42964.96 1.73
2002-2003 39488.40 18.50 17878.11 14.96 47586.51 10.76
2003-2004 42066.87 6.53 19158.41 7.16 52056.57 9.39
2004-2005 49423.06 17.49 23899.66 24.75 61251.79 17.66
2005-2006 52179.01 5.58 25029.28 4.73 72686.18 18.67
2006-2007 62127.32 19.07 29045.94 16.05 91249.94 25.54
2007-2008 69415.33 11.73 24575.74 -15.39 103427.29 13.35
2008-2009 80432.53 15.87 31486.37 28.12 105282.30 1.79
Average 48986.65 11.82 21779.25 9.54 66132.46 10.90
SD 17136.18 5.97 5856.87 13.73 25442.11 8.90

Table shows the growth rate of Income from Tax for the
period from 1999-2000 to 2008-2009.
Growth rate varies from 5.33 percent to 19.07 percent in
Surat municipal corporations in the year 2001 -2002 and 2006-2007
respectively.
Growth rate varies from -15.39 percent to 28.12 percent in
Vadodara municipal corporations in the year 2007-2008 and 2008-
2009 respectively.
Chart 1.6: Growth Rate of Income from Tax
-20.00
-15.00
-10.00
-5.00
0.00
5.00
10.00
15.00
20.00
25.00
30.00
35.00
1999-2000 2000-2001 2001-2002 2002-2003 2003-2004 2004-2005 2005-2006 2006-2007 2007-2008 2008-2009
Years
Gro
wth
Rate
Surat Vadodara Ahmedabad

Growth rate varies from -0.82 percent to 25.54 percent in
Ahmedabad municipal corporations in the year 2000 -2001 and
2006-2007 respectively.
Surat, Vadodara and Ahmedabad municipal corpora tions
having average growth rate 5.97, 13.73 and 8.90 percent
respectively.
Growth rate of revenue receipts is an indication of healthy
state of finances of municipal corporations.
Table 1.7: Growth Rate of Total revenue (Rs. In Lakhs)
Years
Surat Vadodara Ahmedabad
Value Growth
(%)
Value Growth
(%)
Value Growth
(%)
1999-2000 36287.92 16176.26 46711.45
2000-2001 38715.02 6.69 17970.21 11.09 46054.70 -1.41
2001-2002 40168.91 3.76 17196.69 -4.30 47346.56 2.81
2002-2003 47593.32 18.48 18659.87 8.51 51980.45 9.79
2003-2004 51242.63 7.67 19969.28 7.02 59116.07 13.73
2004-2005 60352.46 17.78 24705.54 23.72 69255.75 17.15
2005-2006 65496.03 8.52 25940.38 5.00 79360.17 14.59
2006-2007 78746.90 20.23 30518.33 17.65 101317.54 27.67
2007-2008 87984.51 11.73 31175.19 2.15 124855.62 23.23
2008-2009 101948.90 15.87 39941.57 28.12 128687.25 3.07
Average 60853.66 12.30 24225.33 10.99 75468.56 12.29
SD 22500.70 5.96 7749.40 10.43 32137.40 9.72

Table shows the growth rate of total revenue for the per iod
from 1999-2000 to 2008-2009.
Growth rate varies from 6.69 percent to 20.23 percent in
Surat municipal corporations in the year 2000 -2001 and 2006-2007
respectively.
Growth rate varies from -4.30 percent to 28.12 percent in
Vadodara municipal corpora tions in the year 2001-2002 and 2008-
2009 respectively.
Growth rate varies from -1.41 percent to 27.67 percent in
Ahmedabad municipal corporations in the year 2000 -2001 and
2006-2007 respectively.
Char 1.7: Growth Rate of Total Revenue
-10.00
-5.00
0.00
5.00
10.00
15.00
20.00
25.00
30.00
1999-2000 2000-2001 2001-2002 2002-2003 2003-2004 2004-2005 2005-2006 2006-2007 2007-2008 2008-2009
Years
Gro
wth
Rate
Surat Vadodara Ahmedabad

Surat, Vadodara and Ahmedabad municipal corporations
having average growth rate 5.96, 10.43 and 9.72 percent
respectively.
Growth rate of composition of tax and non-tax revenue
indicates one way of establishing creditworthiness.
Table 1.8: Growth Rate of Total (Tax and Non -tax) Revenue (Rs. In Lakhs)
Years
Surat Vadodara Ahmedabad
Value Growth
(%) Value
Growth
(%) Value
Growth
(%)
1999-2000 32104.04 15321.97 44651.06
2000-2001 34052.33 6.07 16781.86 9.53 44702.78 0.12
2001-2002 36111.91 6.05 15786.63 -5.93 46112.04 3.15
2002-2003 42595.88 17.96 18214.41 15.38 50556.22 9.64
2003-2004 45717.89 7.33 19564.60 7.41 57153.15 13.05
2004-2005 53657.98 17.37 24343.85 24.43 66712.73 16.73
2005-2006 56679.92 5.63 25533.13 4.89 77068.19 15.52
2006-2007 66424.18 17.19 29957.04 17.33 96724.75 25.51
2007-2008 74216.24 11.73 25267.06 -15.66 110886.61 14.64
2008-2009 85995.42 15.87 32372.09 28.12 116168.88 4.76
Average 52755.58 11.69 22314.26 9.50 71073.64 11.46
SD 18179.81 5.46 6048.42 13.97 27814.84 7.91

Table shows the growth rate of total revenue i. e. composite
of tax and non tax for the period from 1999-2000 to 2008-2009.
Growth rate varies from 6.05 percent to 15.87 percent in
Surat municipal corporations in the year 2000 -2001 and 2008-2009
respectively.
Growth rate varies from -15.66 percent to 28.12 percent in
Vadodara municipal corporations in the year 2000 -2001 and 2006-
2007 respectively.
Growth rate varies from 0.12 percent to 25.51 percent in
Ahmedabad municipal corporations in the year 2000 -2001 and
2008-2009 respectively.
Chart 1.8: Growth Rate of Total (Tax and Non-tax) Revenue
-20.00
-15.00
-10.00
-5.00
0.00
5.00
10.00
15.00
20.00
25.00
30.00
35.00
1999-2000 2000-2001 2001-2002 2002-2003 2003-2004 2004-2005 2005-2006 2006-2007 2007-2008 2008-2009
Years
Gro
wth
Rate
Surat Vadodara Ahmedabad

Surat, Vadodara and Ahmedabad municipal corporations
having average growth rate 11.69, 13.97 and 11.46 percent
respectively.
Apart from the measures of revenue growth and composition,
the revenue performance of municipal corporations can be gauged
through other than tax income.
Table 1.9: Growth Rate of other Revenue Income (Rs. In Lakhs)
Years
Surat Vadodara Ahmedabad
Value Growth
(%) Value
Growth
(%) Value
Growth
(%)
1999-2000 4183.88 854.29 2060.39
2000-2001 4662.69 11.44 1188.36 39.10 1351.92 -34.39
2001-2002 4057.00 -12.99 1410.06 18.66 1234.52 -8.68
2002-2003 4997.44 23.18 445.46 -68.41 1424.23 15.37
2003-2004 5524.74 10.55 404.68 -9.16 1962.92 37.82
2004-2005 6694.48 21.17 361.70 -10.62 2543.02 29.55
2005-2006 8816.11 31.69 407.25 12.59 2291.98 -9.87
2006-2007 12322.72 39.77 561.26 37.82 4592.79 100.39
2007-2008 13768.26 11.73 5908.13 952.66 13969.01 204.15
2008-2009 15953.48 15.87 7569.48 28.12 12518.37 -10.38
Average 8098.08 16.94 1911.07 111.20 4394.92 35.99
SD 4395.46 14.96 2598.84 317.29 4772.40 74.24

Table shows the growth rate of other revenue income for the
period from 1999-2000 to 2008-2009.
Growth rate varies -12.99 percent to 39.77 percent in Surat
municipal corporations in the year 2001-2002 and 2006-2007
respectively.
Growth rate varies -68.41 percent to 952.66 percent in
Vadodara municipal corporations in the year 2002 -2003 and 2007-
2008 respectively.
Chart 1.9: Growth Rate of other Revenue Income
-200.00
0.00
200.00
400.00
600.00
800.00
1000.00
1200.00
1999-2000 2000-2001 2001-2002 2002-2003 2003-2004 2004-2005 2005-2006 2006-2007 2007-2008 2008-2009
Years
Gro
wth
Rate
Surat Vadodara Ahmedabad

Growth rate varies -34.39 percent to 204.15 percent in
Ahmedabad municipal corporations in the year 2000 -2001 and
2007-2008 respectively.
Surat, Vadodara and Ahmedabad municipal corporations
having average growth rate 16.94, 111.20 and 35.99 percent
respectively.
Establishment expenditure includes salary & wages,
allowances, reimbursements, employee welfare, terminal bene fits
and other employee costs.
Table 1.10: Growth Rate of Establishment (Rs. In Lakhs)
Years
Surat Vadodara Ahmedabad
Value Growth
(%)
Value Growth
(%)
Value Growth
(%)
1999-2000 15507.64 10098.12 28540.52
2000-2001 14150.24 -8.75 9392.68 -6.99 31395.10 10.00
2001-2002 14850.10 4.95 9470.13 0.82 30389.77 -3.20
2002-2003 15800.40 6.40 9793.56 3.42 30548.59 0.52
2003-2004 16759.23 6.07 10093.70 3.06 31222.08 2.20
2004-2005 17693.26 5.57 10339.06 2.43 30936.31 -0.92
2005-2006 19270.66 8.92 11289.24 9.19 32924.35 6.43
2006-2007 21638.98 12.29 14927.19 32.22 46285.60 40.58
2007-2008 26366.01 21.84 16265.56 8.97 47329.18 2.25
2008-2009 32126.00 21.85 20787.52 27.80 44917.94 -5.09
Average 19416.25 8.79 12245.68 8.99 35448.94 5.86
SD 5790.41 9.35 3829.16 12.87 7502.65 13.81

Table shows the growth rate of establishment expenditure for
the period from 1999-2000 to 2008-2009.
Growth rate varies from -8.75 percent to 21.85 percent in
Surat municipal corporations in the year 2000 -2001 and 2008-2009
respectively.
Growth rate varies from -6.99 percent to 32.22 percent in
Vadodara municipal corporations in the year 2000 -2001 and 2006-
2007 respectively.
Growth rate varies from -5.09 percent to 40.58 percent in
Ahmedabad municipal corporations in the year 2000-2001 and
2007-2008 respectively.
Chart 1.10: Growth Rate of Establishment
-20.00
-10.00
0.00
10.00
20.00
30.00
40.00
50.00
1999-2000 2000-2001 2001-2002 2002-2003 2003-2004 2004-2005 2005-2006 2006-2007 2007-2008 2008-2009
Years
Gro
wth
Rate
Surat Vadodara Ahmedabad

Surat, Vadodara and Ahmedabad municipal corporations
having average growth rate 8.79, 8.99 and 5.86 percent
respectively.
Administrative expense is one of the major expenses of total
expenditure.
Table 1.11: Growth Rate of Administrative Expenses (Rs. In Lakhs)
Years
Surat Vadodara Ahmedabad
Value
Growth
(%) Value
Growth
(%) Value
Growth
(%)
1999-2000 4722.18 256.08 899.04
2000-2001 6352.90 34.53 322.03 25.76 1029.63 14.53
2001-2002 6622.05 4.24 274.80 -14.67 917.14 -10.93
2002-2003 6616.59 -0.08 175.80 -36.03 1535.37 67.41
2003-2004 7558.60 14.24 184.66 5.04 1109.68 -27.73
2004-2005 8176.12 8.17 132.42 -28.29 1046.49 -5.69
2005-2006 9010.93 10.21 171.74 29.70 1315.89 25.74
2006-2007 10482.07 16.33 668.03 288.97 1843.22 40.07
2007-2008 10992.21 4.87 998.08 49.41 2144.85 16.36
2008-2009 13800.00 25.54 1275.56 27.80 2378.69 10.90
Average 8433.37 13.12 445.92 38.63 1422.00 14.52
SD 2695.54 11.06 399.70 98.21 533.35 28.36

Table shows the growth rate of Administrative expense for
the period from 1999-2000 to 2008-2009.
Growth rate varies from -0.08 percent to 34.53 percent in
Surat municipal corporations in the year 2002 -2003 and 2001-2002
respectively.
Growth rate varies from -36.03 percent to 288.97 percent in
Vadodara municipal corporations in the year 2002 -2003 and 2006-
2007 respectively.
Growth rate varies from -27.73 percent to 67.41 percent in
Ahmedabad municipal corporations in the year 2003 -2004 and
2002-2003 respectively.
Chart 1.11: Growth Rate of Administrative Expenses
-100.00
-50.00
0.00
50.00
100.00
150.00
200.00
250.00
300.00
350.00
1999-2000 2000-2001 2001-2002 2002-2003 2003-2004 2004-2005 2005-2006 2006-2007 2007-2008 2008-2009
Years
Gro
wth
Rate
Surat Vadodara Ahmedabad

Surat, Vadodara and Ahmedabad municipal corporations
having average growth rate 13.12, 38.63 and 14.52 percent
respectively.
Table 1.12: Growth Rate of Repair & Maintenance Expense (Rs. In Lakhs)
Years
Surat Vadodara Ahmedabad
Value Growth
(%)
Value Growth
(%)
Value Growth
(%)
1999-2000 3652.15 3800.46 1905.96
2000-2001 4249.63 16.36 4405.69 15.92 1604.40 -15.82
2001-2002 3427.02 -19.36 4218.59 -4.25 2070.77 29.07
2002-2003 3075.35 -10.26 4763.58 12.92 2331.26 12.58
2003-2004 3353.20 9.03 5208.53 9.34 1888.42 -19.00
2004-2005 4017.97 19.82 5796.71 11.29 3308.16 75.18
2005-2006 4540.00 12.99 5725.93 -1.22 3149.98 -4.78
2006-2007 7006.57 54.33 8668.78 51.40 3875.61 23.04
2007-2008 7570.52 8.05 8715.69 0.54 3548.26 -8.45
2008-2009 8604.00 13.65 11138.72 27.80 4958.78 39.75
Average 4949.64 11.62 6244.27 13.75 2864.16 14.62
SD 2001.21 20.55 2429.72 17.20 1081.56 30.72

Table shows the growth rate of Repair & Maintenance
Expense for the period from 1999-2000 to 2008-2009.
Growth rate varies from -19.36 percent to 54.33 percent in
Surat municipal corporations in the year 2001 -2002 and 2006-2007
respectively.
Growth rate varies from -4.25 percent to 51.40 percent in
Vadodara municipal corporations in the year 2001 -2002 and 2006-
2007 respectively.
Chart 1.12: Growth Rate of Repair & Maintenance Expense
-40.00
-20.00
0.00
20.00
40.00
60.00
80.00
1999-2000 2000-2001 2001-2002 2002-2003 2003-2004 2004-2005 2005-2006 2006-2007 2007-2008 2008-2009
Years
Gro
wth
Rate
Surat Vadodara Ahmedabad

Growth rate varies from -19.00 percent to 75.18 percent in
Ahmedabad municipal corporations in the year 2003 -2004 and
2004-2005 respectively.
Surat, Vadodara and Ahmedabad municipal corporations
having average growth rate 20.55, 17.20 and 30.72 percent
respectively.
Table 1.13: Growth Rate of Services related direct expense (Rs. In Lakhs)
Years
Surat Vadodara Ahmedabad
Value
Growth
(%) Value
Growth
(%) Value
Growth
(%)
1999-2000 923.50 3080.76 1288.06
2000-2001 1328.08 43.81 3046.13 -1.12 1381.42 7.25
2001-2002 1438.40 8.31 3049.38 0.11 1504.47 8.91
2002-2003 1434.38 -0.28 3209.16 5.24 1717.94 14.19
2003-2004 1615.09 12.60 3188.66 -0.64 1429.23 -16.81
2004-2005 2218.13 37.34 3444.07 8.01 1984.05 38.82
2005-2006 2589.31 16.73 3597.90 4.47 3004.31 51.42
2006-2007 3531.72 36.40 4434.94 23.26 3564.92 18.66
2007-2008 3670.79 3.94 4827.01 8.84 4421.58 24.03
2008-2009 4284.59 16.72 6168.95 27.80 4841.94 9.51
Average 2303.40 19.51 3804.70 8.44 2513.79 17.33
SD 1165.49 15.88 1033.28 10.39 1345.74 19.62

Table shows the growth rate of Services related direct
expense for the period from 1999-2000 to 2008-2009.
Growth rate varies from -0.28 percent to 37.34 percent in
Surat municipal corporations in the year 2002 -2003 and 2004-2005
respectively.
Growth rate varies from -1.12 percent to 27.80 percent in
Vadodara municipal corporations in the year 2000 -2001 and 2008-
2009 respectively.
Growth rate varies from -16.81 percent to 51.42 percent in
Ahmedabad municipal corporations in the year 2003-2004 and
2005-2006 respectively. Surat, Vadodara and Ahmedabad
Chart 1.13: Growth Rate of Services related direct expense
-30.00
-20.00
-10.00
0.00
10.00
20.00
30.00
40.00
50.00
60.00
1999-2000 2000-2001 2001-2002 2002-2003 2003-2004 2004-2005 2005-2006 2006-2007 2007-2008 2008-2009
Years
Gro
wth
rate
Surat Vadodara Ahmedabad
municipal corporations having average growth rate 15.88, 10.39
and 19.62 percent respectively.
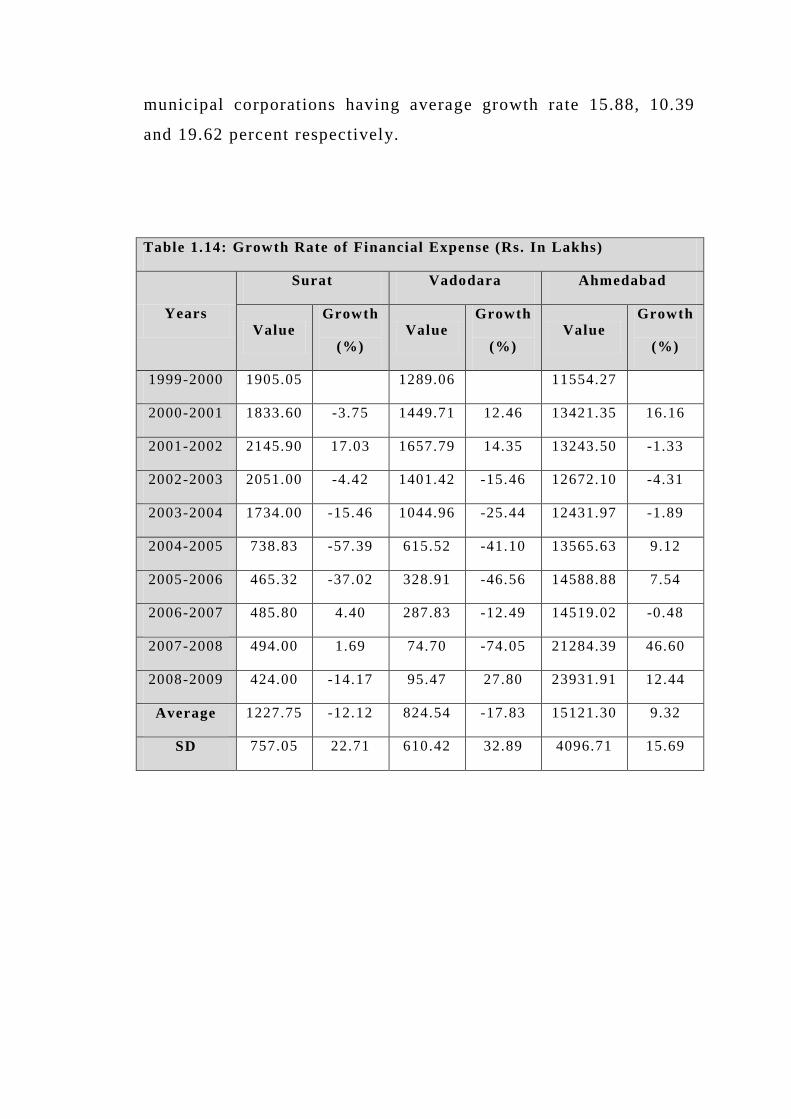
Table 1.14: Growth Rate of Financial Expense (Rs. In Lakhs)
Years
Surat Vadodara Ahmedabad
Value Growth
(%)
Value Growth
(%)
Value Growth
(%)
1999-2000 1905.05 1289.06 11554.27
2000-2001 1833.60 -3.75 1449.71 12.46 13421.35 16.16
2001-2002 2145.90 17.03 1657.79 14.35 13243.50 -1.33
2002-2003 2051.00 -4.42 1401.42 -15.46 12672.10 -4.31
2003-2004 1734.00 -15.46 1044.96 -25.44 12431.97 -1.89
2004-2005 738.83 -57.39 615.52 -41.10 13565.63 9.12
2005-2006 465.32 -37.02 328.91 -46.56 14588.88 7.54
2006-2007 485.80 4.40 287.83 -12.49 14519.02 -0.48
2007-2008 494.00 1.69 74.70 -74.05 21284.39 46.60
2008-2009 424.00 -14.17 95.47 27.80 23931.91 12.44
Average 1227.75 -12.12 824.54 -17.83 15121.30 9.32
SD 757.05 22.71 610.42 32.89 4096.71 15.69

Table shows the growth rate of Financial Expense for the
period from 1999-2000 to 2008-2009.
Growth rate varies from -57.39 percent to 17.03 percent in
Surat municipal corporations in the year 2004 -2005 and 2001-2002
respectively.
Growth rate varies from -46.56 percent to 27.80 percent in
Vadodara municipal corporations in the year 2005 -2006 and 2008-
2009 respectively.
Growth rate varies from -4.31 percent to 46.60 percent in
Ahmedabad municipal corporations in the year 2002 -2003 and
2007-2008 respectively.
Chart 1.14: Growth Rate of Financial Expense
-100.00
-80.00
-60.00
-40.00
-20.00
0.00
20.00
40.00
60.00
1999-2000 2000-2001 2001-2002 2002-2003 2003-2004 2004-2005 2005-2006 2006-2007 2007-2008 2008-2009
Years
Gro
wth
Rate
Surat Vadodara Ahmedabad

Surat, Vadodara and Ahmedabad municipal corporations
having average growth rate 22.71, 32.89 and 15.69 percent
respectively.
Table 1.15: Growth Rate of Salary and Wages (Rs. In Lakhs)
Years
Surat Vadodara Ahmedabad
Value Growth
(%) Value
Growth
(%) Value
Growth
(%)
1999-2000 9280.63 4458.94 9509.21
2000-2001 7500.65 -19.18 4513.89 1.23 10460.31 10.00
2001-2002 7571.36 0.94 4528.52 0.32 14273.74 36.46
2002-2003 7608.56 0.49 4210.21 -7.03 14471.23 1.38
2003-2004 7728.81 1.58 4147.39 -1.49 15603.71 7.83
2004-2005 8214.13 6.28 4089.41 -1.40 15757.43 0.99
2005-2006 11090.32 35.02 5517.63 34.92 17404.26 10.45
2006-2007 12685.48 14.38 8373.74 51.76 25559.02 46.85
2007-2008 13236.10 4.34 7162.45 -14.47 26246.02 2.69
2008-2009 16237.20 22.67 12811.31 78.87 26558.06 1.19
Average 10115.32 7.39 5981.35 15.86 17584.30 13.09
SD 3061.80 15.35 2801.66 31.86 6351.31 16.82

Table shows the growth rate of Salary and Wages for the
period from 1999-2000 to 2008-2009.
Growth rate varies from -19.18 percent to 35.02 percent in
Surat municipal corporations in the year 2000 -2001 and 2005-2006
respectively.
Growth rate varies from -14.47 percent to 78.87 percent in
Vadodara municipal corporations in the year 2007 -2008 and 2008-
2009 respectively.
Growth rate varies from 0.99 percent to 46.85 percent in
Ahmedabad municipal corporations in the year 2004-2005 and
2006-2007 respectively.
Chart 1.15: Growth Rate of Salary and Wages
-40.00
-20.00
0.00
20.00
40.00
60.00
80.00
100.00
1999-2000 2000-2001 2001-2002 2002-2003 2003-2004 2004-2005 2005-2006 2006-2007 2007-2008 2008-2009
Years
Gro
wth
Rate
Surat Vadodara Ahmedabad

Surat, Vadodara and Ahmedabad municipal corporations
having average growth rate 15.35, 31.86 and 16.82 percent
respectively.
Table 1.16: Growth Rate of Other than Salary and Wages (Rs. In Lakhs)
Years
Surat Vadodara Ahmedabad
Value Growth
(%) Value
Growth
(%) Value
Growth
(%)
1999-2000 6227.01 5639.18 19031.31
2000-2001 6651.39 6.82 4878.80 -13.48 20934.78 10.00
2001-2002 7278.74 9.43 4941.61 1.29 16116.03 -23.02
2002-2003 8191.84 12.54 5583.35 12.99 16077.36 -0.24
2003-2004 9030.42 10.24 5946.31 6.50 15618.37 -2.85
2004-2005 9479.13 4.97 6249.65 5.10 15178.88 -2.81
2005-2006 8180.34 -13.70 5771.61 -7.65 15520.09 2.25
2006-2007 8953.50 9.45 6553.44 13.55 20726.58 33.55
2007-2008 12767.19 42.59 9103.11 38.91 21083.16 1.72
2008-2009 15888.80 24.45 7976.21 -12.38 18359.88 -12.92
Average 9264.84 11.87 6264.33 4.98 17864.64 0.63
SD 2956.57 15.18 1330.86 16.23 2440.17 15.58

Table shows the growth rate of Other than Salary and Wages
for the period from 1999-2000 to 2008-2009.
Growth rate varies from -13.70 percent to 42.59 percent in
Surat municipal corporations in the year 2005 -2006 and 2007-2008
respectively.
Growth rate varies from -13.48 percent to 38.91 percent in
Vadodara municipal corporations in the year 2000-2001 and 2007-
2008 respectively.
Growth rate varies from -23.02 percent to 33.55 percent in
Ahmedabad municipal corporations in the year 2001 -2002 and
2006-2007 respectively.
Chart 1.16: Growth Rate of Other than Salary and Wages
-30.00
-20.00
-10.00
0.00
10.00
20.00
30.00
40.00
50.00
1999-2000 2000-2001 2001-2002 2002-2003 2003-2004 2004-2005 2005-2006 2006-2007 2007-2008 2008-2009
Years
Gro
wth
Rate
Surat Vadodara Ahmedabad

Surat, Vadodara and Ahmedabad municipal co rporations
having average growth rate 11.87, 4.98 and 0.63 percent
respectively.
Table 1.17: Growth Rate of Octroi and Toll (Rs. In Lakhs)
Years
Surat Vadodara Ahmedabad
Value Growth
(%)
Value Growth
(%)
Value Growth
(%)
1999-2000 22259.85 9672.19 30918.72
2000-2001 23003.10 3.34 11321.95 17.06 32451.10 4.96
2001-2002 23495.29 2.14 10458.90 -7.62 30806.73 -5.07
2002-2003 28502.80 21.31 11991.35 14.65 36130.57 17.28
2003-2004 30135.03 5.73 13489.09 12.49 40093.84 10.97
2004-2005 35417.50 17.53 15994.42 18.57 46204.73 15.24
2005-2006 40520.73 14.41 18451.98 15.37 55150.39 19.36
2006-2007 48559.48 19.84 22489.07 21.88 70815.00 28.40
2007-2008 34734.55 -28.47 16157.67 -28.15 51200.93 -27.70
2008-2009 0.00 -100.00 26.43 -99.84 0.00 -100.00
Average 28662.83 -4.91 13005.30 -3.96 39377.20 -4.06
SD 13091.40 38.74 6042.64 39.37 18791.64 39.53

Table shows the growth rate of Octroi and Toll for the
period from 1999-2000 to 2008-2009.
Growth rate varies from -100.00 percent to 21.31 percent in
Surat municipal corporations in the year 2008 -2009 and 2002-2003
respectively.
Growth rate varies from -99.84 percent to 21.88 percent in
Vadodara municipal corporations in the year 2008 -2009 and 2006-
2007 respectively.
Growth rate varies from -100.00 percent to 28.40 percent in
Ahmedabad municipal corporations in the year 2008 -2009 and
2006-2007 respectively.
Chart 1.17: Growth Rate of Octroi and Toll
-120.00
-100.00
-80.00
-60.00
-40.00
-20.00
0.00
20.00
40.00
1999-2000 2000-2001 2001-2002 2002-2003 2003-2004 2004-2005 2005-2006 2006-2007 2007-2008 2008-2009
Years
Gro
wth
Rate
Surat Vadodara Ahmedabad

Surat, Vadodara and Ahmedabad municipal corporations
having average growth rate 38.74, 39.37 and 39.53 percent
respectively.
Table 1.18: Growth Rate of Property Tax (Rs. In Lakhs)
Years
Surat Vadodara Ahmedabad
Value Growth
(%)
Value Growth
(%)
Value Growth
(%)
1999-2000 7503.06 5003.98 11665.32
2000-2001 8625.18 14.96 4987.93 -0.32 9783.91 -16.13
2001-2002 9821.29 13.87 5055.04 1.35 12158.23 24.27
2002-2003 10978.40 11.78 5350.72 5.85 11455.94 -5.78
2003-2004 11817.36 7.64 5141.38 -3.91 11992.73 4.69
2004-2005 13453.36 13.84 7307.88 42.14 15047.07 25.47
2005-2006 10973.57 -18.43 6030.00 -17.49 17535.79 16.54
2006-2007 12417.06 13.15 5862.54 -2.78 20434.94 16.53
2007-2008 34084.00 174.49 6497.04 10.82 21372.31 4.59
2008-2009 79742.40 133.96 24280.67 273.72 22610.86 5.80
Average 19941.57 40.58 7551.72 34.38 15405.71 8.44
SD 22327.92 66.04 5926.87 91.20 4724.22 13.75

Table shows the growth rate of Property Tax for the period
from 1999-2000 to 2008-2009.
Growth rate varies from -18.43 percent to 174.49 percent in
Surat municipal corporations in the year 2005 -2006 and 2007-2008
respectively.
Growth rate varies from -17.49 percent to 273.72 percent in
Vadodara municipal corporations in the year 2005 -2006 and 2008-
2009 respectively.
Growth rate varies from -16.13 percent to 25.47 percent in
Ahmedabad municipal corporations in the year 2000 -2001 and
2004-2005 respectively.
Chart 1.18: Growth Rate of Property Tax
-50.00
0.00
50.00
100.00
150.00
200.00
250.00
300.00
1999-2000 2000-2001 2001-2002 2002-2003 2003-2004 2004-2005 2005-2006 2006-2007 2007-2008 2008-2009
Years
Gro
wth
Rate
Surat Vadodara Ahmedabad

Surat, Vadodara and Ahmedabad municipal corporations
having average growth rate 66.04, 91.20 and 13.75 percent
respectively.
Table 1.19: Growth Rate of Reserved & Surplus (Rs. In Lakhs)
Years
Surat Vadodara Ahmedabad
Value Growth
(%) Value
Growth
(%) Value
Growth
(%)
1999-2000 18515.48 1092.18 14208.68
2000-2001 30311.19 63.71 2442.43 123.63 13551.75 -4.62
2001-2002 40911.29 34.97 1358.95 -44.36 2601.00 -80.81
2002-2003 46549.74 13.78 2661.12 95.82 2701.00 3.84
2003-2004 60821.21 30.66 2818.30 5.91 11301.00 318.40
2004-2005 80234.31 31.92 6726.69 138.68 11301.00 0.00
2005-2006 92896.50 15.78 7344.70 9.19 21101.00 86.72
2006-2007 237647.88 155.82 5160.34 -29.74 31201.00 47.87
2007-2008 254503.62 7.09 24561.28 375.96 42800.20 37.18
2008-2009 279953.98 10.00 25484.69 3.76 78901.00 84.35
Average 114234.52 40.41 7965.07 75.43 22966.77 54.77
SD 101650.99 46.65 9238.53 130.78 23229.00 111.39

Table shows the growth rate of Reserved & Surplace for the
period from 1999-2000 to 2008-2009.
Growth rate varies from 7.09 percent to 155.82 percent in
Surat municipal corporations in the year 2007 -2008 and 2006-2007
respectively.
Growth rate varies from -44.36 percent to 375.96 percent in
Vadodara municipal corporations in the year 2001 -2002 and 2007-
2008 respectively.
Growth rate varies from -80.81 percent to 318.40 percent in
Ahmedabad municipal corporations in the year 2001 -2002 and
2003-2004 respectively.
Chart 1.19: Growth Rate of Reserved & Surplus
-200.00
-100.00
0.00
100.00
200.00
300.00
400.00
1999-2000 2000-2001 2001-2002 2002-2003 2003-2004 2004-2005 2005-2006 2006-2007 2007-2008 2008-2009
Years
Gro
wth
Rate
Surat Vadodara Ahmedabad
Surat, Vadodara and Ahmedabad municipal corporations
having average growth rate 46.65, 130.78 and 111.39 percent
respectively.
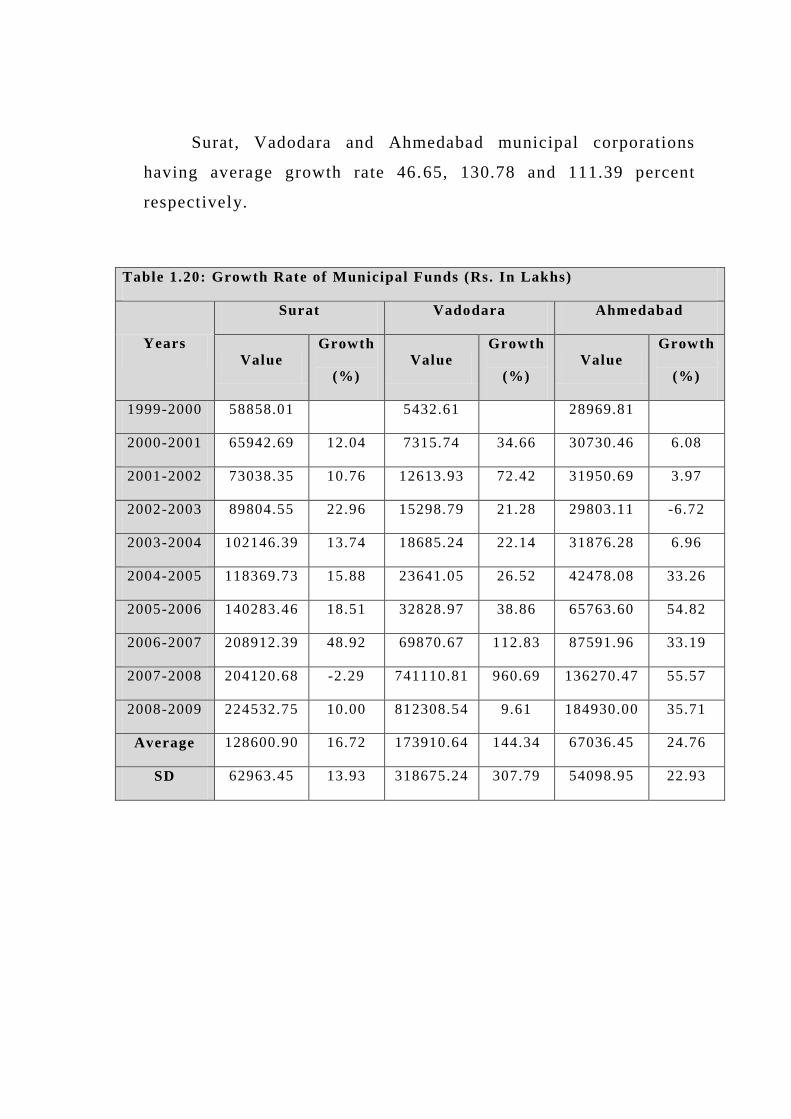
Table 1.20: Growth Rate of Municipal Funds (Rs. In Lakhs)
Years
Surat Vadodara Ahmedabad
Value Growth
(%) Value
Growth
(%) Value
Growth
(%)
1999-2000 58858.01 5432.61 28969.81
2000-2001 65942.69 12.04 7315.74 34.66 30730.46 6.08
2001-2002 73038.35 10.76 12613.93 72.42 31950.69 3.97
2002-2003 89804.55 22.96 15298.79 21.28 29803.11 -6.72
2003-2004 102146.39 13.74 18685.24 22.14 31876.28 6.96
2004-2005 118369.73 15.88 23641.05 26.52 42478.08 33.26
2005-2006 140283.46 18.51 32828.97 38.86 65763.60 54.82
2006-2007 208912.39 48.92 69870.67 112.83 87591.96 33.19
2007-2008 204120.68 -2.29 741110.81 960.69 136270.47 55.57
2008-2009 224532.75 10.00 812308.54 9.61 184930.00 35.71
Average 128600.90 16.72 173910.64 144.34 67036.45 24.76
SD 62963.45 13.93 318675.24 307.79 54098.95 22.93

Table shows the growth rate of Municipal Funds for the
period from 1999-2000 to 2008-2009.
Growth rate varies from -2.29 percent to 48.92 percent in
Surat municipal corporations in the year 2007-2008 and 2006-2007
respectively.
Growth rate varies from 9.61 percent to 960.69 percent in
Vadodara municipal corporations in the year 2008 -2009 and 2007-
2008 respectively.
Growth rate varies from -6.72 percent to 55.57 percent in
Ahmedabad municipal corporations in the year 2002 -2003 and
2007-2008 respectively.
Chart 1.20: Growth Rate of Municipal Funds
-200.00
0.00
200.00
400.00
600.00
800.00
1000.00
1200.00
1999-2000 2000-2001 2001-2002 2002-2003 2003-2004 2004-2005 2005-2006 2006-2007 2007-2008 2008-2009
Years
Gro
wth
Rate
Surat Vadodara Ahmedabad

Surat, Vadodara and Ahmedabad municipal corporations
having average growth rate 13.93, 307.79 and 22.93 percent
respectively.
Table 1.21: Growth Rate of Secured Loa n (Rs. In Lakhs)
Years
Surat Vadodara Ahmedabad
Value Growth
(%)
Value Growth
(%)
Value Growth
(%)
1999-2000 12963.52 5469.64 31252.13
2000-2001 15633.89 20.60 4857.31 -11.20 26447.42 -15.37
2001-2002 17616.77 12.68 3964.71 -18.38 51702.61 95.49
2002-2003 14670.05 -16.73 2655.95 -33.01 51698.25 -0.01
2003-2004 11987.21 -18.29 2655.95 0.00 64490.17 24.74
2004-2005 2565.40 -78.60 785.07 -70.44 74492.20 15.51
2005-2006 2458.90 -4.15 1137.65 44.91 74494.48 0.00
2006-2007 2352.40 -4.33 949.50 -16.54 74494.67 0.00
2007-2008 1875.90 -20.26 1137.65 19.82 74494.67 0.00
2008-2009 2063.49 10.00 1262.59 10.98 74494.67 0.00
Average 8418.75 -11.01 2487.60 -8.21 59806.13 13.37
SD 6657.58 29.23 1737.06 33.00 18738.45 32.78

Table shows the growth ra te of Secured Loan for the period
from 1999-2000 to 2008-2009.
Growth rate varies from -78.60 percent to 20.60 percent in
Surat municipal corporations in the year 2004 -2005 and 2000-2001
respectively.
Growth rate varies from -70.44 percent to 44.91 percent in
Vadodara municipal corporations in the year 2004 -2005 and 2005-
2006 respectively.
Growth rate varies from -15.37 percent to 95.49 percent in
Ahmedabad municipal corporations in the year 2000 -2001 and
2001-2002 respectively.
Chart 1.21: Growth Rate of Secured Loan
-100.00
-80.00
-60.00
-40.00
-20.00
0.00
20.00
40.00
60.00
80.00
100.00
120.00
1999-2000 2000-2001 2001-2002 2002-2003 2003-2004 2004-2005 2005-2006 2006-2007 2007-2008 2008-2009
Years
Gro
wth
Rate
Surat Vadodara Ahmedabad

Surat, Vadodara and Ahmedabad municipal corporations
having average growth rate 29.23, 33.00 and 32.78 percent
respectively.
Table 1.22: Growth Rate of Liability (Rs. In Lakhs)
Years
Surat Vadodara Ahmedabad
Value Growth
(%) Value
Growth
(%) Value
Growth
(%)
1999-2000 98331.90 16357.00 172571.99
2000-2001 119851.63 21.88 21588.79 31.99 101380.24 -41.25
2001-2002 140536.76 17.26 25797.09 19.49 204363.38 101.58
2002-2003 164491.71 17.05 26742.22 3.66 123669.03 -39.49
2003-2004 189120.96 14.97 29924.84 11.90 159561.78 29.02
2004-2005 216746.46 14.61 34827.17 16.38 184629.45 15.71
2005-2006 253047.10 16.75 41494.36 19.14 222871.27 20.71
2006-2007 470629.66 85.99 77960.19 87.88 261631.76 17.39
2007-2008 460500.20 -2.15 769115.66 886.55 347780.70 32.93
2008-2009 506550.22 10.00 841376.80 9.40 456639.78 31.30
Average 261980.66 21.82 188518.41 120.71 223509.94 18.66
SD 156853.60 25.00 325931.86 288.28 107854.13 42.33

Table shows the growth rate of l iability for the period from
1999-2000 to 2008-2009.
Growth rate varies from -2.15 percent to 85.99 percent in
Surat municipal corporations in the year 2007 -2008 and 2006-2007
respectively.
Growth rate varies from 3.66 percent to 886.55 percent in
Vadodara municipal corporations in the year 2002 -2003 and 2007-
2008 respectively.
Growth rate varies from -39.49 percent to 101.58 percent in
Ahmedabad municipal corporations in the year 2002 -2003 and
2001-2002 respectively.
Chart 1.22: Growth Rate of Liability
-200.00
0.00
200.00
400.00
600.00
800.00
1000.00
1999-2000 2000-2001 2001-2002 2002-2003 2003-2004 2004-2005 2005-2006 2006-2007 2007-2008 2008-2009
Years
Gro
wth
Rate
Surat Vadodara Ahmedabad

Surat, Vadodara and Ahmedabad municipal corporations
having average growth rate 25.00, 288.28 and 42.33 percent
respectively.
Table 1.23: Growth Rate of Capital work in progress (Rs. In Lakhs)
Years
Surat Vadodara Ahmedabad
Value Growth
(%) Value
Growth
(%) Value
Growth
(%)
1999-2000 82749.97 8401.76 20324.28
2000-2001 103489.25 25.06 16047.02 91.00 15487.43 -23.80
2001-2002 119417.72 15.39 19513.54 21.60 40068.61 158.72
2002-2003 136058.21 13.93 22104.96 13.28 17308.66 -56.80
2003-2004 153328.27 12.69 23653.30 7.00 49009.57 183.15
2004-2005 170714.93 11.34 29592.13 25.11 55483.00 13.21
2005-2006 203277.73 19.07 36550.19 23.51 61295.38 10.48
2006-2007 94904.57 -53.31 3958.00 -89.17 73754.10 20.33
2007-2008 120643.96 27.12 13787.96 248.36 99736.66 35.23
2008-2009 132708.36 10.00 18453.21 33.84 115490.90 15.80
Average 131729.30 9.03 19206.21 41.61 54795.86 39.59
SD 36442.14 24.12 9580.67 90.38 34148.04 79.54

Table shows the growth rate of Capital work in progress for
the period from 1999-2000 to 2008-2009.
Growth rate varies from -53.31 percent to 27.12 percent in
Surat municipal corporations in the year 2006-2007 and 2007-2008
respectively.
Growth rate varies from -89.17 percent to 248.36 percent in
Vadodara municipal corporations in the year 2006 -2007 and 2007-
2008 respectively.
Growth rate varies from -56.80 percent to 183.15 percent in
Ahmedabad municipal corporations in the year 2002 -2003 and
2003-2004 respectively.
Chart 1.23: Growth Rate of Capital work in progress
-150.00
-100.00
-50.00
0.00
50.00
100.00
150.00
200.00
250.00
300.00
1999-2000 2000-2001 2001-2002 2002-2003 2003-2004 2004-2005 2005-2006 2006-2007 2007-2008 2008-2009
Years
Gro
wth
Rate
Surat Vadodara Ahmedabad

Surat, Vadodara and Ahmedabad municipal corporations
having average growth rate 24.12, 90.38 and 79.54 percent
respectively.
Table 1.24: Growth Rate of Unsecured Loan (Rs. In Lakhs)
Years
Surat Vadodara Ahmedabad
Value Growth
(%)
Value Growth
(%)
Value Growth
(%)
1999-2000 7984.93 4362.57 8492.32
2000-2001 7951.57 -0.42 6973.31 59.84 8904.92 4.86
2001-2002 8956.78 12.64 7859.50 12.71 88552.96 894.43
2002-2003 13466.44 50.35 6126.36 -22.05 9696.43 -89.05
2003-2004 14166.11 5.20 5765.35 -5.89 9892.09 2.02
2004-2005 15576.98 9.96 3674.37 -36.27 10804.63 9.22
2005-2006 17408.25 11.76 183.03 -95.02 11525.48 6.67
2006-2007 21716.98 24.75 591.12 222.96 12558.23 8.96
2007-2008 0.00 -100.00 183.03 -69.04 14430.83 14.91
2008-2009 0.00 - 186.87 2.10 17825.26 23.52
Average 10722.80 1.78 3590.55 7.71 19268.31 97.28
SD 7124.03 43.99 3077.41 92.57 24507.40 300.78

Table shows the growth rate of Unsecured Loan for the
period from 1999-2000 to 2008-2009.
Growth rate varies from -100.00 percent to 50.35 percent in
Surat municipal corporations in the year 2007 -2008 and 2002-2003
respectively.
Growth rate varies from -95.02 percent to 222.96 percent in
Vadodara municipal corporations in the year 2005 -2006 and 2006-
2007 respectively.
Growth rate varies from -89.05 percent to 894.43 percent in
Ahmedabad municipal corporations in the year 2002 -2003 and
2001-2002 respectively.
Chart 1.24: Growth Rate of Unsecured Loan
-200.00
0.00
200.00
400.00
600.00
800.00
1000.00
1999-2000 2000-2001 2001-2002 2002-2003 2003-2004 2004-2005 2005-2006 2006-2007 2007-2008 2008-2009
Years
Gro
wth
Rate
Surat Vadodara Ahmedabad

Surat, Vadodara and Ahmedabad municipal corporations
having average growth rate 43.99, 92.57 and 300.78 percent
respectively.
5.3 Ratio Analysis
With rapid urbanization and the pressure on urban areas for
service delivery, the role of urban local governments is
undoubtedly becoming important and, here, their financial
capacity can hold the key. At the same time, there are several
issues in urban governance that need to be addressed yet.
Delegation of decision making powers to urban local bodies
(ULBs), which are traditionally considered as a part of the system
of State government and acting on behalf of it, is one of them. The
constitutional mechanisms like inter -governmental fiscal transfers
were an attempt to reduce the ground. It has become imperative
now to understand the financial position of ULBs in order to move
forward with the new means of fund flow. Performing cross -
sectional analysis of the finances of Surat, Vadodara and
Ahmedabad Municipal Corporations in terms of their financial
base and its adequacy vis-à-vis norms, and their revenue and
expenditure performance. Using certain ratios, the relative
performance of municipalities on decentralization and dependency
measures was also assessed. The implications to the finances of
ULBs, in terms of raising resources, improv ing inter-governmental
transfers and charting new mechanisms are also discussed.
Revenue performance depend upon the ability of
municipality to generate revenue depends upon an array of factors:

(i) the level of economic activity in the region; (ii) fisc al powers
delegated to local government; (iii) tax efforts of municipal
government itself; and (iv) transfers out of sharable pool of
revenue by the state government to local government. The revenue
performance of the municipality/ Municipal Corporation ca n be
gauged by computing following two groups of indicators:
An Expenditure performance depend upon the level of
expenditure is, to some extent, reflective of the level of services
rendered by an urban local body. While the trend in per capita
expenditure would provide first approximation of the level of
services rendered by a municipal government, a further
segregation into discretionary and non-discretionary components,
relative share of revenue and capital expenditure, share of
establishment/ administra tive/ wages salaries as a proportion of
total/ revenue expenditure would reveal the quality of expenditure
and ability of the local bodies to meet is stated objectives.
Achieving a good proportion of own revenue to total revenue
receipts is one way of establishing creditworthiness, and a greater
share of tax revenue in it is desirable as it is a reliable revenue
source.
Apart from the measures of revenue growth and composition,
the revenue performance of Municipal Corporations can be gauged
through decentralization and dependency. Decentralization
measure is defined as the proportion of shared tax in the tax
revenue, which underscores the importance of share revenue as

opposed to own revenue. The dependency measure is the
proportion of total grants in a id in total expenditure.
The level and structure of expenditure has some major
implications to the finances of the Municipal Corporations. The
revenue expenditure, comprising expenditures on establishment
(staff salaries and administration) and maintenance, assumes
importance, as it relates to the provision of civic services and their
maintenance.
The expenditure structure of municipal corporations also
throws some lights on the relative importance assigned to each
component in the total expenditure and it has bearing on the
financial position and service delivery.
Various ratios has been calculated on the basis of various
financial terms using the data for the duration of ten years i.e.
from 1999-2000 to 2008-2009.
Following are the ratios for three Municipals Corporations
i.e. Surat, Vadodara and Ahmedabad, listed below:
1. Year wise Per Capita Income, Expenditure Ratio
2. Ratio Percentage of Financial Expense by Loan
(Secured+Unsecured)
3. Ratio Percentage of Expenditure by Income
4. Ratio Percentage of Establishment Expenditure by total
Revenue Income

5. Ratio Percentage of Administrative Expense by total
Revenue Income
6. Ratio Percentage of Repair & Maintains Expense by Total
Revenue Income
7. Ratio Percentage of Direct Expense by Total Revenue
Income
8. Ratio Percentage of Financial Expense by Total Revenue
Income
9. Ratio Percentage of Other Expense by Total Revenue
Income
10. Ratio Percentage of Income over Expenditure by Total
Revenue Income
11. Ratio Percentage of Income over Expenditure by
Municipal Fund & Reserve & Surplus
12. Ratio Percentage of Salary, Wages & allowances by Total
Income
13. Ratio Percentage of Salary, Wages & allowances by
Establishment Expenditure
14. Ratio Percentage of Direct Expenditure for Service &
Programs by Total Income
15. Ratio Percentage of Terminal Benefits by Establishment
Expenditure
16. Ratio Percentage of Octrio & Toll by Income from Tax
17. Ratio Percentage of Property Tax & Toll by Income from
Tax
18. Ratio Percentage of Other direct Tax & Toll by Income
from Tax

Table 2.0: Year wise Per Capita Income, Expenditur e Ratio for Surat, Vadodara and Ahmedabad
Year
Per Capita Income (in Rs.) Per Capita Expenditure (in Rs.) Ratio (Income over Expenditure)
Surat Vadodara Ahmedabad Surat Vadodara Ahmedabad Surat Vadodara Ahmedabad
2000 1659.53 1542.34 1644.62 1035.21 1436.34 1257.88 1.60 1.07 1.31
2001 1644.98 1609.91 1598.21 944.84 1400.54 1360.72 1.74 1.15 1.17
2002 1592.88 1493.07 1563.55 895.51 1371.28 1312.94 1.78 1.09 1.19
2003 1767.67 1587.47 1654.35 855.30 1391.24 1287.83 2.07 1.14 1.28
2004 1768.88 1592.90 1789.15 839.40 1380.67 1253.03 2.11 1.15 1.43
2005 1933.16 1861.75 2036.08 822.36 1389.74 1295.65 2.35 1.34 1.57
2006 1958.28 1908.20 2227.78 837.89 1404.56 1365.09 2.34 1.36 1.63
2007 2177.40 2219.42 2752.07 947.28 1858.36 1699.63 2.30 1.19 1.62
2008 2270.29 2843.74 3318.78 1033.41 1900.68 1862.57 2.20 1.50 1.78
2009 2454.86 3547.57 3398.72 1156.35 2365.20 1868.82 2.12 1.50 1.82
Average 1922.79 2020.64 2198.33 936.76 1589.86 1456.42 2.06 1.25 1.48
SD 293.09 677.64 712.05 109.60 339.06 251.07 0.27 0.16 0.24

Table(2.0) indicate the percentage ratio of Per Capita Income
over Expenditure. To calculate the per capita income and
expenditure projected population has been calculated using the
exponential growth rate and census population data for 1991 and
2001 for Surat, Vadodara and Ahmedabad.
Looking to the ratio percentage, for Surat Municipal
Corporations percentage varies from 1.60 percent in the year 2000
to 2.35 percent in the year 2005. Average percentage of this ratio
is 2.06 for define period. Also per capita income and expenditure
is Rs. 1922.79 and Rs. 936.76 respectively.
Looking to the ratio percentage, for Vadodara Municipal
Corporations percentage varies from 1.07 percent in the year 2000
to 1.50 percent in the year 2008 and 2009. Av erage percentage of
this ratio is 1.25 for define period. Also per capita income and
expenditure is Rs. 2020.64 and Rs. 1589.86 respectively.
Looking to the ratio percentage, for Ahmedabad Municipal
Corporations percent varies from 1.17 percent in the yea r 2001 to
1.82 percentage in the year 2009. Average percentage of this ratio
is 1.48 for define period. Also per capita income and expenditure
is Rs. 2198.33 and Rs. 1456.42 respectively.

Table 2.1: Ratio Percentage of Financial Expense by Loan (Secured+ Unsecured) for all three cities (In Rs. Lakhs)
Years
Surat Vadodara Ahmedabad
Financial
Expense
Secured
loan &
Unsecured
loan
Ratio
%
Financial
Expense
Secured
loan &
Unsecured
loan
Ratio
%
Financial
Expense
Secured
loan &
Unsecured
loan
Ratio
%
1999-2000 1905.05 20948.44 9.09 1289.06 9832.21 13.11 11554.27 111744.45 10.34
2000-2001 1833.60 23585.47 7.77 1449.71 11830.62 12.25 13421.35 35352.34 37.96
2001-2002 2145.90 26573.55 8.08 1657.79 11824.21 14.02 13243.50 140255.58 9.44
2002-2003 2051.00 28136.49 7.29 1401.42 8782.31 15.96 12672.10 61394.68 20.64
2003-2004 1734.00 26153.32 6.63 1044.96 8421.30 12.41 12431.97 74382.26 16.71
2004-2005 738.83 18142.38 4.07 615.52 4459.44 13.80 13565.63 85296.83 15.90
2005-2006 465.32 19867.15 2.34 328.91 1320.69 24.90 14588.88 86019.96 16.96
2006-2007 485.80 24069.38 2.02 287.83 1540.62 18.68 14519.02 87052.90 16.68
2007-2008 494.00 1875.90 26.33 74.70 1320.69 5.66 21284.39 88925.50 23.94
2008-2009 424.00 2063.49 20.55 95.47 1449.46 6.59 23931.91 92319.93 25.92
Average 1227.75 19141.56 9.42 824.54 6078.15 13.74 15121.30 86274.44 19.45
SD 757.05 9567.85 7.89 610.42 4508.08 5.53 4096.71 27811.62 8.32

Table(2.1) indicate the percentage ratio of financial charges to
Loan including secured and unsecured loan both. To under stand
the variation of this percentage ratio ten years value of financial
expense and loan amount has been taken for the periods 1999 -2000
to 2008-2009.
Looking to the ratio percentage, for Surat Municipal
Corporations percentage varies from 2.02 percentage (2006-2007)
to 26.33 percentage (2007-2008) on loan amount. The ratio pattern
indicates that on an average Surat Municipal Corporation paid
9.42 percentages as financial charges.
Chart 2.1: Ratio Percentage of Financial Expense by Loan (Secured+Unsecured)
for all three cities
0.00
5.00
10.00
15.00
20.00
25.00
30.00
35.00
40.00
1999-
2000
2000-
2001
2001-
2002
2002-
2003
2003-
2004
2004-
2005
2005-
2006
2006-
2007
2007-
2008
2008-
2009
Years
Ra
tio
(%
)
Surat Vadodara Ahmedabad

For Vadodara Municipal Corporations the above percentage
ratio is varies from 5.66 percentage (2007-2008) to 24.90
percentages (2005-2006). Vadodara Municipal Corporations paid
on an average 13.74 percentage financial charges on loan
amount.For Ahmedabad Municipal Corporations the above
percentages ratio is varies from 9.44 percentage (2001 -2002) to
37.96 percentages (2000-2001). Ahmedabad Municipal
Corporations paid on an average 19.45 percentage financial
charges on loan amount.

Table 2.2: Ratio Percentage of Expenditure by Income for all t hree cities (In Rs. Lakhs)
Years
Surat Vadodara Ahmedabad
Expenditure Income Ratio
% Expenditure Income
Ratio
% Expenditure Income
Ratio
%
1999-2000 28234.20 36287.92 77.81 18268.41 16176.26 112.93 44198.29 46711.45 94.62
2000-2001 29348.74 38715.02 75.81 18294.21 17970.21 101.80 48928.17 46054.70 106.24
2001-2002 29977.71 40168.91 74.63 18395.89 17196.69 106.97 48179.07 47346.56 101.76
2002-2003 30520.69 47593.32 64.13 19167.73 18659.87 102.72 48941.80 51980.45 94.15
2003-2004 32697.98 51242.63 63.81 19535.85 19969.28 97.83 48278.18 59116.07 81.67
2004-2005 34568.56 60352.46 57.28 20195.36 24705.54 81.74 50922.46 69255.75 73.53
2005-2006 37827.00 65496.03 57.75 20962.12 25940.38 80.81 55053.59 79360.17 69.37
2006-2007 45392.68 78746.90 57.64 28483.90 30518.33 93.33 70263.58 101317.54 69.35
2007-2008 51803.74 87984.51 58.88 29919.44 31175.19 95.97 78820.19 124855.62 63.13
2008-2009 62736.00 101948.90 61.54 38237.29 39941.57 95.73 81051.60 128687.25 62.98
Average 38310.73 60853.66 64.93 23146.02 24225.33 96.99 57463.69 75468.56 81.68
SD 11482.00 22500.70 8.11 6785.19 7749.40 10.12 13812.03 32137.40 16.31

Table(2.2) indicate the percentage ratio of Expenditure by
income. To under stand the variation of this percentage ratio ten
years value of expenditure and income amount has been taken for
the periods 1999-2000 to 2008-2009.
Looking to the ratio percentage, for Surat Municipal
Corporations percentage varies from 57.28 percentage (2004 -2005)
to 77.81 percentage (1999-2000) on income amount. The average
of the ratio is found to be 64.93 percent during the ten years of
period.
Chart 2.2: Ratio Percentage of Expenditure by Income for all three cities
0.00
20.00
40.00
60.00
80.00
100.00
120.00
1999-
2000
2000-
2001
2001-
2002
2002-
2003
2003-
2004
2004-
2005
2005-
2006
2006-
2007
2007-
2008
2008-
2009
Years
Ra
tio
(%
)
Surat Vadodara Ahmedabad

For Vadodara Municipal Corporations percentage varies from
80.81 percentage (2005-2006) to 112.93 percentage (1999-2000)
on income amount. The average of the ratio is found to be 96.99
percent during the ten years of period.
For Ahmedabad Municipal Corporations percentage varies
from 62.98 percentage (2008-2009) to 106.24 percentage (2000-
2001) on income amount. The average of the ratio is found to be
81.68 percent during the ten years of period.

Table 2.3: Ratio Percentage of Establishment Expenditure by total Revenue Income for all three cities (In Rs. Lakhs)
Years
Surat Vadodara Ahmedabad
Expenditure Income Ratio
% Expenditure Income
Ratio
% Expenditure Income
Ratio
%
1999-2000 15507.64 37691.59 41.14 10098.12 19616.66 51.48 28540.52 56611.80 50.41
2000-2001 14150.24 40036.14 35.34 9392.68 21029.12 44.67 31395.10 56258.44 55.81
2001-2002 14850.10 41543.76 35.75 9470.13 20029.64 47.28 30389.77 56283.24 53.99
2002-2003 15800.40 49403.01 31.98 9793.56 21871.34 44.78 30548.59 60898.52 50.16
2003-2004 16759.23 52976.51 31.64 10093.70 22538.82 44.78 31222.08 67350.15 46.36
2004-2005 17693.26 62041.62 28.52 10339.06 27054.54 38.22 30936.31 78379.07 39.47
2005-2006 19270.66 67347.26 28.61 11289.24 28478.57 39.64 32924.35 87698.00 37.54
2006-2007 21638.98 80244.69 26.97 14927.19 34018.04 43.88 46285.60 110787.53 41.78
2007-2008 26366.01 89658.00 29.41 16265.56 44764.54 36.34 47329.18 136622.66 34.64
2008-2009 32126.00 103888.00 30.92 20787.52 57352.20 36.25 44917.94 143077.71 31.39
Average 19416.25 62483.06 32.03 12245.68 29675.35 42.73 35448.94 85396.71 44.16
SD 5790.41 22633.74 4.29 3829.16 12479.58 4.98 7502.65 33502.03 8.42

Table(2.3) indicate the percentage ratio of Establishment
Expenditure by Total Revenue Income. To under stand the
variation of this percentage ratio ten years value of establishment
expenditure and total revenue income amount has been taken for
the periods 1999-2000 to 2008-2009.
Looking to the ratio percentage, for Surat Municipal
Corporations percentage varies from 28.52 percentage (2004 -2005)
to 41.14 percentage (1999-2000) on total revenue income amount.
The average of the ratio is found to be 32.03 percent d uring the
ten years of period.
Chart 2.3: Ratio Percentage of Establishment Expenditure by total Revenue
Income for all three cities
0.00
10.00
20.00
30.00
40.00
50.00
60.00
1999-
2000
2000-
2001
2001-
2002
2002-
2003
2003-
2004
2004-
2005
2005-
2006
2006-
2007
2007-
2008
2008-
2009
Years
Ra
tio
(%
)
Surat Vadodara Ahmedabad

For Vadodara Municipal Corporations percentage varies from
36.25 percentage (2008-2009) to 51.48 percentage (1999-2000) on
total revenue income amount. The average of the ratio is found to
be 42.73 percent during the ten yea rs of period.
For Ahmedabad Municipal Corporations percentage varies
from 31.39 percentage (2008-2009) to 55.81 percentage (2000-
2001) on total revenue income amount. The average of the ratio is
found to be 44.16 percent during the ten years of period.

Table 2.4: Ratio Percentage of Administrative Expense by total Revenue Income for all three cities (In Rs. Lakhs)
Years
Surat Vadodara Ahmedabad
Ad.
Expense Income
Ratio
%
Ad.
Expense Income
Ratio
%
Ad.
Expense Income
Ratio
%
1999-2000 4722.18 37691.59 12.53 256.08 19616.66 1.31 899.04 56611.80 1.59
2000-2001 6352.90 40036.14 15.87 322.03 21029.12 1.53 1029.63 56258.44 1.83
2001-2002 6622.05 41543.76 15.94 274.80 20029.64 1.37 917.14 56283.24 1.63
2002-2003 6616.59 49403.01 13.39 175.80 21871.34 0.80 1535.37 60898.52 2.52
2003-2004 7558.60 52976.51 14.27 184.66 22538.82 0.82 1109.68 67350.15 1.65
2004-2005 8176.12 62041.62 13.18 132.42 27054.54 0.49 1046.49 78379.07 1.34
2005-2006 9010.93 67347.26 13.38 171.74 28478.57 0.60 1315.89 87698.00 1.50
2006-2007 10482.07 80244.69 13.06 668.03 34018.04 1.96 1843.22 110787.53 1.66
2007-2008 10992.21 89658.00 12.26 998.08 44764.54 2.23 2144.85 136622.66 1.57
2008-2009 13800.00 103888.00 13.28 1275.56 57352.20 2.22 2378.69 143077.71 1.66
Average 8433.37 62483.06 13.72 445.92 29675.35 1.33 1422.00 85396.71 1.69
SD 2695.54 22633.74 1.27 399.70 12479.58 0.65 533.35 33502.03 0.32

Table(2.4) indicate the percentage ratio of Administrative
Expenditure by Total Revenue Income. To under stand the
variation of this percentage ratio ten years value of administrative
expenditure and total revenue income amount has been taken for
the periods 1999-2000 to 2008-2009.
Looking to the ratio percentage, for Surat Municipal
Corporations percentage varies from 12.53 percentage (1999-2000]
to 15.94 percentage (2001-2002) on total revenue income amount.
The average of the ratio is found to be 13.72 percent during the
ten years of period.
Chart 2.4: Ratio Percentage of Administrative Expense by total Revenue Income
for all three cities
0.00
2.00
4.00
6.00
8.00
10.00
12.00
14.00
16.00
18.00
1999-
2000
2000-
2001
2001-
2002
2002-
2003
2003-
2004
2004-
2005
2005-
2006
2006-
2007
2007-
2008
2008-
2009
Years
Rati
o (
%)
Surat Vadodara Ahmedabad

For Vadodara Municipal Corporations percentage varies from
0.49 percentage (2004-2005) to 2.23 percentage (2007-2008) on
total revenue income amount. The average of the ratio is found to
be 1.33 percent during the ten years of period.
For Ahmedabad Municipal Corporations percentage varies
from 1.34 percentage (2004-2005) to 2.52 percentage (2002-2003)
on total revenue income amount. The average of the ratio is found
to be 1.69 percent during the ten years of period.

Table 2.5: Ratio Percentage of Repair & Maintenance Expense by Total Revenue Income for all three cities (In Rs.
Lakhs)
Years
Surat Vadodara Ahmedabad
Repair &
Maintenance Income
Ratio
%
Repair &
Maintenance Income
Ratio
%
Repair &
Maintenance Income
Ratio
%
1999-2000 3652.15 37691.59 9.69 3800.46 19616.66 19.37 1905.96 56611.80 3.37
2000-2001 4249.63 40036.14 10.61 4405.69 21029.12 20.95 1604.40 56258.44 2.85
2001-2002 3427.02 41543.76 8.25 4218.59 20029.64 21.06 2070.77 56283.24 3.68
2002-2003 3075.35 49403.01 6.23 4763.58 21871.34 21.78 2331.26 60898.52 3.83
2003-2004 3353.20 52976.51 6.33 5208.53 22538.82 23.11 1888.42 67350.15 2.80
2004-2005 4017.97 62041.62 6.48 5796.71 27054.54 21.43 3308.16 78379.07 4.22
2005-2006 4540.00 67347.26 6.74 5725.93 28478.57 20.11 3149.98 87698.00 3.59
2006-2007 7006.57 80244.69 8.73 8668.78 34018.04 25.48 3875.61 110787.53 3.50
2007-2008 7570.52 89658.00 8.44 8715.69 44764.54 19.47 3548.26 136622.66 2.60
2008-2009 8604.00 103888.00 8.28 11138.72 57352.20 19.42 4958.78 143077.71 3.47
Average 4949.64 62483.06 7.98 6244.27 29675.35 21.22 2864.16 85396.71 3.39
SD 2001.21 22633.74 1.51 2429.72 12479.58 1.92 1081.56 33502.03 0.50
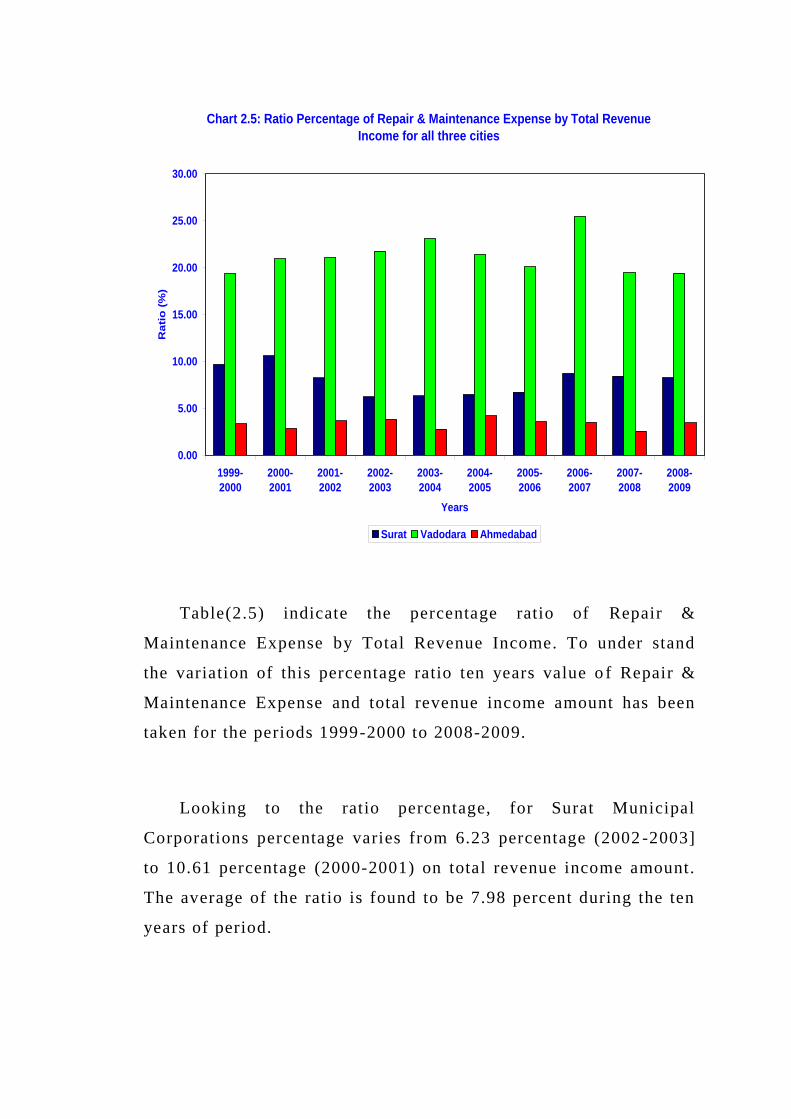
Table(2.5) indicate the percentage ratio of Repair &
Maintenance Expense by Total Revenue Income. To under stand
the variation of this percentage ratio ten years value o f Repair &
Maintenance Expense and total revenue income amount has been
taken for the periods 1999-2000 to 2008-2009.
Looking to the ratio percentage, for Surat Municipal
Corporations percentage varies from 6.23 percentage (2002 -2003]
to 10.61 percentage (2000-2001) on total revenue income amount.
The average of the ratio is found to be 7.98 percent during the ten
years of period.
Chart 2.5: Ratio Percentage of Repair & Maintenance Expense by Total Revenue
Income for all three cities
0.00
5.00
10.00
15.00
20.00
25.00
30.00
1999-
2000
2000-
2001
2001-
2002
2002-
2003
2003-
2004
2004-
2005
2005-
2006
2006-
2007
2007-
2008
2008-
2009
Years
Ra
tio
(%
)
Surat Vadodara Ahmedabad

For Vadodara Municipal Corporations percentage varies from
19.47 percentage (2007-2008) to 25.48 percentage (2006-2007) on
total revenue income amount. The average of the ratio is found to
be 21.22 percent during the ten years of period.
For Ahmedabad Municipal Corporations percentage varies
from 2.60 percentage (2007-2008) to 4.22 percentage (2004-2005)
on total revenue income amount. The average of the ratio is found
to be 3.39 percent during the ten years of period.

Table 2.6: Ratio Percentage of Direct Expense by Total Revenue Income for all three cities (In Rs. Lakhs)
Years
Surat Vadodara Ahmedabad
Direct
Expenditure Income
Ratio
%
Direct
Expenditure Income
Ratio
%
Direct
Expenditure Income
Ratio
%
1999-2000 958.56 37691.59 2.54 3080.76 19616.66 15.70 1288.06 56611.80 2.28
2000-2001 1366.45 40036.14 3.41 3046.13 21029.12 14.49 1381.42 56258.44 2.46
2001-2002 1463.24 41543.76 3.52 3049.38 20029.64 15.22 1504.47 56283.24 2.67
2002-2003 1476.00 49403.01 2.99 3209.16 21871.34 14.67 1717.94 60898.52 2.82
2003-2004 1661.93 52976.51 3.14 3188.66 22538.82 14.15 1429.23 67350.15 2.12
2004-2005 2269.30 62041.62 3.66 3444.07 27054.54 12.73 1984.05 78379.07 2.53
2005-2006 2674.72 67347.26 3.97 3597.90 28478.57 12.63 3004.31 87698.00 3.43
2006-2007 3604.26 80244.69 4.49 4434.94 34018.04 13.04 3559.76 110787.53 3.21
2007-2008 3823.00 89658.00 4.26 4827.01 44764.54 10.78 4421.58 136622.66 3.24
2008-2009 4462.00 103888.00 4.30 6168.95 57352.20 10.76 4841.94 143077.71 3.38
Average 2375.94 62483.06 3.63 3804.70 29675.35 13.42 2513.28 85396.71 2.81
SD 1212.70 22633.74 0.63 1033.28 12479.58 1.73 1345.29 33502.03 0.48

Table(2.6) indicate the percentage ratio of Direct Expense by
Total Revenue Income. To under stand the variation of this
percentage ratio ten years value of Direct Expense and total
revenue income amount has been taken for the periods 1999 -2000
to 2008-2009.
Looking to the ratio percentage, for Surat Municipal
Corporations percentage varies from 2.54 percentage (1999 -2000]
to 4.49 percentage (2006-2007) on total revenue income amount.
The average of the ratio is found to be 7.98 percent during the ten
years of period.
Chart 2.6: Ratio Percentage of Direct Expense by Total Revenue Income for all
three cities
0.00
2.00
4.00
6.00
8.00
10.00
12.00
14.00
16.00
18.00
1999-
2000
2000-
2001
2001-
2002
2002-
2003
2003-
2004
2004-
2005
2005-
2006
2006-
2007
2007-
2008
2008-
2009
Years
Ra
tio
(%
)
Surat Vadodara Ahmedabad

For Vadodara Municipal Corporations percentage varies from
10.76 percentage (2008-2009) to 15.70 percentage (1999-2000) on
total revenue income amount. The average of the ratio is found to
be 13.42 percent during the ten years of period.
For Ahmedabad Municipal Corporations percentage varies
from 2.12 percentage (2003-2004) to 3.43 percentage (2005-2006)
on total revenue income amount. The average of the ratio is found
to be 2.81 percent during the ten years of period.

Table 2.7: Ratio Percentage of Financial Expense by Total Revenue Income for all three cities (In Rs. Lakhs)
Years
Surat Vadodara Ahmedabad
Financial
Expense Income
Ratio
%
Financial
Expense Income
Ratio
%
Financial
Expense Income
Ratio
%
1999-2000 1905.05 37691.59 5.05 1289.06 19616.66 6.57 11554.27 56611.80 20.41
2000-2001 1833.60 40036.14 4.58 1449.71 21029.12 6.89 13421.35 56258.44 23.86
2001-2002 2145.90 41543.76 5.17 1657.79 20029.64 8.28 13243.50 56283.24 23.53
2002-2003 2051.00 49403.01 4.15 1401.42 21871.34 6.41 12672.10 60898.52 20.81
2003-2004 1734.00 52976.51 3.27 1044.96 22538.82 4.64 12431.97 67350.15 18.46
2004-2005 738.83 62041.62 1.19 615.52 27054.54 2.28 13565.63 78379.07 17.31
2005-2006 465.32 67347.26 0.69 328.91 28478.57 1.15 14588.88 87698.00 16.64
2006-2007 485.80 80244.69 0.61 287.83 34018.04 0.85 14519.02 110787.53 13.11
2007-2008 494.00 89658.00 0.55 74.70 44764.54 0.17 21284.39 136622.66 15.58
2008-2009 424.00 103888.00 0.41 95.47 57352.20 0.17 23931.91 143077.71 16.73
Average 1227.75 62483.06 2.57 824.54 29675.35 3.74 15121.30 85396.71 18.64
SD 757.05 22633.74 2.05 610.42 12479.58 3.15 4096.71 33502.03 3.47

Table(2.7) indicate the percentage ratio of Financial Expense
by Total Revenue Income. To under stand the variat ion of this
percentage ratio ten years value of Financial Expense and total
revenue income amount has been taken for the periods 1999 -2000
to 2008-2009.
Looking to the ratio percentage, for Surat Municipal
Corporations percentage varies from 0.41 percent age (2008-2009]
to 5.17 percentage (2001-2002) on total revenue income amount.
The average of the ratio is found to be 2.57 percent during the ten
years of period.
Chart 2.7: Ratio Percentage of Financial Expense by Total Revenue Income for
all three cities
0.00
5.00
10.00
15.00
20.00
25.00
30.00
1999-
2000
2000-
2001
2001-
2002
2002-
2003
2003-
2004
2004-
2005
2005-
2006
2006-
2007
2007-
2008
2008-
2009
Years
Ra
tio
(%
)
Surat Vadodara Ahmedabad
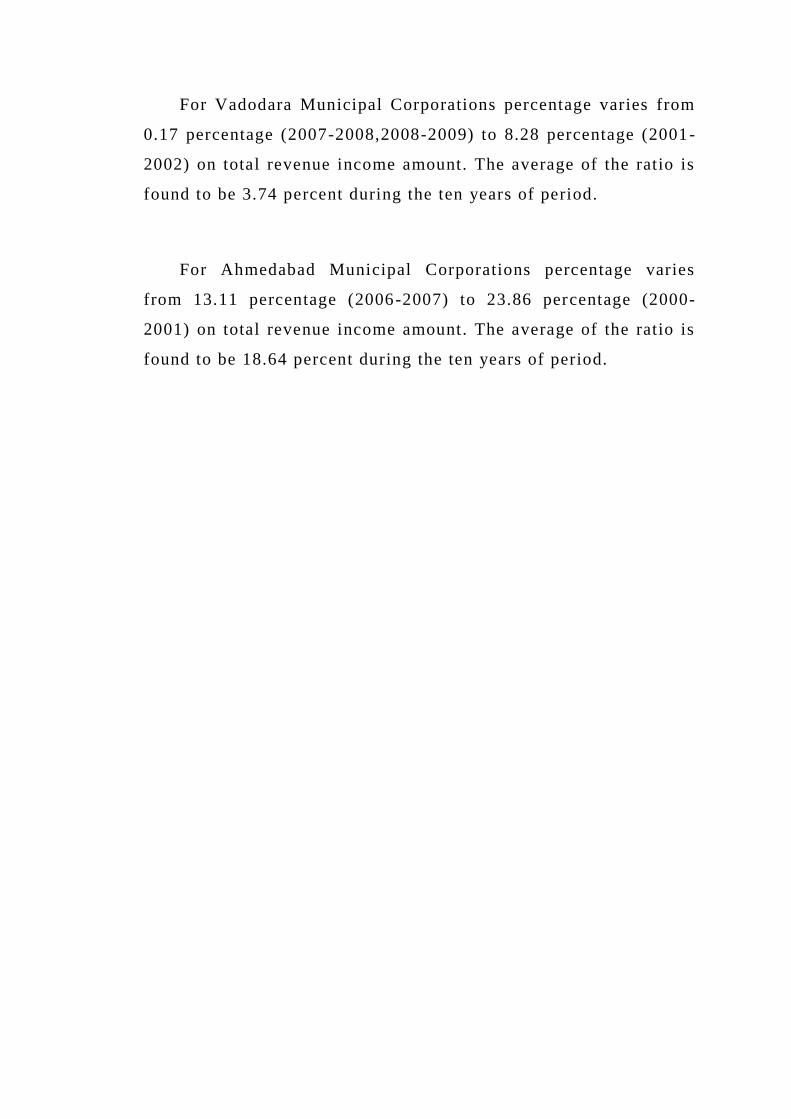
For Vadodara Municipal Corporations percentage varies from
0.17 percentage (2007-2008,2008-2009) to 8.28 percentage (2001-
2002) on total revenue income amount. The average of the ratio is
found to be 3.74 percent during the ten years of period.
For Ahmedabad Municipal Corporations percentage varies
from 13.11 percentage (2006-2007) to 23.86 percentage (2000-
2001) on total revenue income amount. The average of the ratio is
found to be 18.64 percent during the ten years of period.

Table 2.8: Ratio Percentage of Other Expense by Total Revenue Income for all three cities (In Rs. Lakhs)
Years
Surat Vadodara Ahmedabad
Other
Expense Income
Ratio
%
Other
Expense Income
Ratio
%
Other
Expense Income
Ratio
%
1999-2000 1488.63 37691.59 3.95 0.00 19616.66 0.00 10.44 56611.80 0.02
2000-2001 1395.92 40036.14 3.49 0.00 21029.12 0.00 96.28 56258.44 0.17
2001-2002 1469.40 41543.76 3.54 0.00 20029.64 0.00 53.42 56283.24 0.09
2002-2003 1501.36 49403.01 3.04 0.00 21871.34 0.00 136.54 60898.52 0.22
2003-2004 1631.02 52976.51 3.08 0.00 22538.82 0.00 196.80 67350.15 0.29
2004-2005 1673.08 62041.62 2.70 0.00 27054.54 0.00 81.82 78379.07 0.10
2005-2006 1865.37 67347.26 2.77 20.14 28478.57 0.07 70.18 87698.00 0.08
2006-2007 2175.00 80244.69 2.71 165.16 34018.04 0.49 180.37 110787.53 0.16
2007-2008 2558.00 89658.00 2.85 36.49 44764.54 0.08 91.93 136622.66 0.07
2008-2009 3320.00 103888.00 3.20 46.63 57352.20 0.08 22.34 143077.71 0.02
Average 1907.78 62483.06 3.13 26.84 29675.35 0.07 94.01 85396.71 0.12
SD 616.18 22633.74 0.41 51.62 12479.58 0.15 61.76 33502.03 0.09

Table(2.8) indicate the percentage ratio of Other Expense by
Total Revenue Income. To under stand the variation of this
percentage ratio ten years value of Other Expense and total
revenue income amount has been taken for the periods 1999 -2000
to 2008-2009.
Looking to the ratio percentage, for Surat Municipal
Corporations percentage varies from 2.70 percentage (2004 -2005]
to 3.95 percentage (1999-2001) on total revenue income amount.
The average of the ratio is found to be 3.13 percent during the ten
years of period.
For Vadodara Municipal Corporations percentage varies from
0.0 percentage (1999-2000 to 2004-2005) to 0.49 percentage
Chart 2.8: Ratio Percentage of Other Expense by Total Revenue Income for all
three cities
0.00
0.50
1.00
1.50
2.00
2.50
3.00
3.50
4.00
4.50
1999-
2000
2000-
2001
2001-
2002
2002-
2003
2003-
2004
2004-
2005
2005-
2006
2006-
2007
2007-
2008
2008-
2009
YEars
Ra
tio
(%
)
Surat Vadodara Ahmedabad

(2001-2002) on total revenue income amount. The average of the
ratio is found to be 0.07 percent during the ten years of period.
For Ahmedabad Municipal Corporations percentage varies
from 0.02 percentage (1999-2000) to 0.29 percentage (2003-2004)
on total revenue income amount. The average of the ratio is found
to be 0.12 percent during the ten years of period.

Table 2.9: Ratio Percentage of Income over E xpenditure by Total Revenue Income for all three cities
(In Rs. Lakhs)
Years
Surat Vadodara Ahmedabad
Surplace Income Ratio
% Surplace Income
Ratio
% Surplace Income
Ratio
%
1999-2000 14179.56 37691.59 37.62 1348.25 19616.66 6.87 13312.55 56611.80 23.52
2000-2001 17040.31 40036.14 42.56 2734.91 21029.12 13.01 8359.89 56258.44 14.86
2001-2002 18188.10 41543.76 43.78 1633.74 20029.64 8.16 9021.31 56283.24 16.03
2002-2003 25498.90 49403.01 51.61 2703.61 21871.34 12.36 13492.09 60898.52 22.16
2003-2004 27837.13 52976.51 52.55 3002.97 22538.82 13.32 20181.65 67350.15 29.97
2004-2005 35649.18 62041.62 57.46 6859.17 27054.54 25.35 28503.10 78379.07 36.37
2005-2006 38531.19 67347.26 57.21 7516.45 28478.57 26.39 33960.30 87698.00 38.72
2006-2007 45334.08 80244.69 56.49 5534.14 34018.04 16.27 42367.17 110787.53 38.24
2007-2008 48846.47 89658.00 54.48 14845.10 44764.54 33.16 59947.32 136622.66 43.88
2008-2009 54952.00 103888.00 52.90 19114.92 57352.20 33.33 64404.80 143077.71 45.01
Average 32605.69 62483.06 50.67 6529.33 29675.35 18.82 29355.02 85396.71 30.87
SD 14268.94 22633.74 6.91 5980.54 12479.58 9.92 20556.23 33502.03 11.17

Table(2.9) indicate the percentage ratio of Income over
Expenditure Expense by Total Revenue Income. To under s tand the
variation of this percentage ratio ten years value of Income over
Expenditure Expense and total revenue income amount has been
taken for the periods 1999-2000 to 2008-2009.
Looking to the ratio percentage, for Surat Municipal
Corporations percentage varies from 37.62 percentage (1999-2000]
to 57.46 percentage (2004-2005) on total revenue income amount.
The average of the ratio is found to be 50.67 percent during the
ten years of period.
Chart 2.9: Ratio Percentage of Income over Expenditure by Total Revenue
Income for all three cities
0.00
10.00
20.00
30.00
40.00
50.00
60.00
70.00
1999-
2000
2000-
2001
2001-
2002
2002-
2003
2003-
2004
2004-
2005
2005-
2006
2006-
2007
2007-
2008
2008-
2009
Years
Rati
o (
%)
Surat Vadodara Ahmedabad

For Vadodara Municipal Corporations percentage varies from
6.87 percentage (1999-2000) to 33.33 percentage (2008-2009) on
total revenue income amount. The average of the ratio is found to
be 18.82 percent during the ten years of period.
For Ahmedabad Municipal Corporations percentage varies
from 14.86 percentage (2000-2001) to 45.01 percentage (2008-
2009) on total revenue income amount. The average of the ratio is
found to be 30.87 percent during the ten years of period.

Table 2.10: Ratio Percentage of Income over Expenditure by Municipal Fund & Reserve & Surplus for all three cities (In
Rs. Lakhs)
Years
Surat Vadodara Ahmedabad
Surplace
Municipal
Fund-
Reserve &
Surplace
Ratio
% Surplace
Municipal
Fund-
Reserve &
Surplace
Ratio
% Surplace
Municipal
Fund-
Reserve &
Surplace
Ratio
%
1999-2000 14179.56 77373.50 18.33 1348.25 6524.79 20.66 13312.55 43178.49 30.83
2000-2001 17040.31 96253.88 17.70 2734.91 9758.17 28.03 8359.89 44282.21 18.88
2001-2002 18188.10 113949.64 15.96 1633.74 13972.88 11.69 9021.31 34551.70 26.11
2002-2003 25498.90 136354.29 18.70 2703.61 17959.91 15.05 13492.09 32504.12 41.51
2003-2004 27837.13 162967.60 17.08 3002.97 21503.54 13.96 20181.65 43177.28 46.74
2004-2005 35649.18 198604.04 17.95 6859.17 30367.74 22.59 28503.10 53779.08 53.00
2005-2006 38531.19 233179.95 16.52 7516.45 40173.67 18.71 33960.30 86864.61 39.10
2006-2007 45334.08 446560.28 10.15 5534.14 75031.01 7.38 42367.17 118792.97 35.66
2007-2008 48846.47 458624.30 10.65 14845.10 765672.09 1.94 59947.32 179070.68 33.48
2008-2009 54952.00 504486.73 10.89 19114.92 837793.24 2.28 64404.80 263831.01 24.41
Average 32605.69 242835.42 15.39 6529.33 181875.70 14.23 29355.02 90003.21 34.97
SD 14268.94 163901.11 3.43 5980.54 327727.41 8.63 20556.23 76852.42 10.50

Table(2.10) indicate the percentage ratio of Income over
Expenditure by Municipal Fund & Reserve & Surplus . To under
stand the variation of this percentage ratio ten years value of
Income over Expenditure and Municipal Fund & Reserve &
Surplus amount has been taken for the periods 1999 -2000 to 2008-
2009.
Looking to the ratio percentage, for Surat Municipal
Corporations percentage varies from 10.50 percentage (2006 -2007]
to 18.70 percentage (2002-2003) on Municipal Fund & Reserve &
Surplus. The average of the ratio is found to be 15.39 percent
during the ten years of period.
Chart 2.10: Ratio Percentage of Income over Expenditure by Municipal Fund &
Reserve & Surplus for all three cities
0.00
10.00
20.00
30.00
40.00
50.00
60.00
1999-
2000
2000-
2001
2001-
2002
2002-
2003
2003-
2004
2004-
2005
2005-
2006
2006-
2007
2007-
2008
2008-
2009
Years
Ra
tio
(%
)
Surat Vadodara Ahmedabad

For Vadodara Municipal Corporations percentage varies from
1.94 percentage (2007-2008) to 28.03 percentage (2000-2001) on
Municipal Fund & Reserve & Surplus . The average of the ratio is
found to be 14.23 percent during the ten years of peri od.
For Ahmedabad Municipal Corporations percentage varies
from 18.88 percentage (2000-2001) to 53.00 percentage (2004-
2005) on Municipal Fund & Reserve & Surplus amount. The
average of the ratio is found to be 34.97 percent during the ten
years of period.

Table 2.11: Ratio Percentage of Salary, Wages & allowances by Total Income for all three cities (In Rs. Lakhs)
Years
Surat Vadodara Ahmedabad
Salary &
Allowance Total Income
Ratio
%
Salary &
Allowance Total Income
Ratio
%
Salary &
Allowance Total Income
Ratio
%
1999-2000 13389.04 37691.59 35.52 6943.13 19616.66 35.39 18484.39 56611.80 32.65
2000-2001 11722.37 40036.14 29.28 7173.65 21029.12 34.11 20333.17 56258.44 36.14
2001-2002 12179.79 41543.76 29.32 7401.54 20029.64 36.95 18002.11 56283.24 31.98
2002-2003 12552.68 49403.01 25.41 7239.95 21871.34 33.10 17988.65 60898.52 29.54
2003-2004 13590.36 52976.51 25.65 7619.15 22538.82 33.80 16411.51 67350.15 24.37
2004-2005 14443.06 62041.62 23.28 7637.90 27054.54 28.23 16939.40 78379.07 21.61
2005-2006 15892.40 67347.26 23.60 8239.88 28478.57 28.93 17888.30 87698.00 20.40
2006-2007 18111.15 80244.69 22.57 11201.76 34018.04 32.93 32469.18 110787.53 29.31
2007-2008 21548.64 89658.00 24.03 10924.83 44764.54 24.41 29062.29 136622.66 21.27
2008-2009 26663.30 103888.00 25.67 16578.47 57352.20 28.91 27779.30 143077.71 19.42
Average 16009.28 62483.06 26.43 9096.03 29675.35 31.68 21535.83 85396.71 26.67
SD 4816.46 22633.74 3.94 3045.08 12479.58 3.88 5884.86 33502.03 5.97

Table(2.11) indicate the percentage ratio of Salary, Wages &
allowances by Total Income. To understand the variation of this
percentage ratio ten years value of Salary, Wages & allowances
and Total Income amount has been taken for the periods 1999-
2000 to 2008-2009.
Looking to the ratio percentage, for Surat Municipal
Corporations percentage varies from 22.57 percentage (2006 -2007]
to 35.52 percentage (1999-2000) on Total Income. The average of
the ratio is found to be 26.43 percent during the ten years of
period.
Chart 2.11: Ratio Percentage of Salary, Wages & allowances by Total Income for
all three cities
0.00
5.00
10.00
15.00
20.00
25.00
30.00
35.00
40.00
1999-
2000
2000-
2001
2001-
2002
2002-
2003
2003-
2004
2004-
2005
2005-
2006
2006-
2007
2007-
2008
2008-
2009
Years
Rati
o (
%)
Surat Vadodara Ahmedabad

For Vadodara Municipal Corporations percentage varies from
24.41 percentage (2007-2008) to 36.95 percentage (2001-2002) on
Total Income. The average of the ratio is found to be 31.68
percent during the ten years of period.
For Ahmedabad Municipal Corporations pe rcentage varies
from 19.42 percentage (2008-2009) to 36.14 percentage (2000-
2001) on Total Income. The average of the ratio is found to be
26.67 percent during the ten years of period.

Table 2.12: Ratio Percentage of Salary, Wages & allowances by Establis hment Expenditure for all three cities (In Rs.
Lakhs)
Years
Surat Vadodara Ahmedabad
Salary &
Allowance
Establishment
Expenditure
Ratio
%
Salary &
Allowance
Establishment
Expenditure
Ratio
%
Salary &
Allowance
Establishment
Expenditure
Ratio
%
1999-2000 13389.04 15507.64 86.34 6943.13 10098.12 68.76 18484.39 28540.52 64.77
2000-2001 11722.37 14150.24 82.84 7173.65 9392.68 76.37 20333.17 31395.10 64.77
2001-2002 12179.79 14850.10 82.02 7401.54 9470.13 78.16 18002.11 30389.77 59.24
2002-2003 12552.68 15800.40 79.45 7239.95 9793.56 73.93 17988.65 30548.59 58.89
2003-2004 13590.36 16759.23 81.09 7619.15 10093.70 75.48 16411.51 31222.08 52.56
2004-2005 14443.06 17693.26 81.63 7637.90 10339.06 73.87 16939.40 30936.31 54.76
2005-2006 15892.40 19270.66 82.47 8239.88 11289.24 72.99 17888.30 32924.35 54.33
2006-2007 18111.15 21638.98 83.70 11201.76 14927.19 75.04 32469.18 46285.60 70.15
2007-2008 21548.64 26366.01 81.73 10924.83 16265.56 67.17 29062.29 47329.18 61.40
2008-2009 26663.30 32126.00 83.00 16578.47 20787.52 79.75 27779.30 44917.94 61.84
Average 16009.28 19416.25 82.43 9096.03 12245.68 74.15 21535.83 35448.94 60.27
SD 4816.46 5790.41 1.81 3045.08 3829.16 3.86 5884.86 7502.65 5.48

Table(2.12) indicate the percentage ratio of Salary, Wages &
allowances by Establishment Expenditure . To understand the
variation of this percentage ratio ten years value of Salary, Wages
& allowances and Establishment Expenditure amount has been
taken for the periods 1999-2000 to 2008-2009.
Looking to the ratio percentage, for Surat Municipal
Corporations percentage varies from 19.45 percentage (2002 -2003]
to 86.34 percentage (1999-2000) on Establishment Expenditure .
The average of the ratio is found to be 82.43 percent during the
ten years of period.
For Vadodara Municipal Corporations percentage varies from
67.17 percentage (2007-2008) to 79.75 percentage (2008-2009) on
Chart 2.12: Ratio Percentage of Salary, Wages & allowances by Establishment
Expenditure for all three cities
0.00
10.00
20.00
30.00
40.00
50.00
60.00
70.00
80.00
90.00
100.00
1999-
2000
2000-
2001
2001-
2002
2002-
2003
2003-
2004
2004-
2005
2005-
2006
2006-
2007
2007-
2008
2008-
2009
Years
Ra
tio
(%
)
Surat Vadodara Ahmedabad

Establishment Expenditure . The average of the ratio is found to be
74.15 percent during the ten years of period.
For Ahmedabad Municipal Corporations percentage varies
from 52.56 percentage (2003-2004) to 70.15 percentage (2006-
2007) on Establishment Expenditure . The average of the ratio is
found to be 60.27 percent during the ten years of period.

Table 2.13: Ratio Percentage of Direct Expenditure for Service & Programs by Total Income for all three cities (In Rs.
Lakhs)
Years
Surat Vadodara Ahmedabad
Direct
Expenditure Total Income
Ratio
%
Direct
Expenditure Total Income
Ratio
%
Direct
Expenditure Total Income
Ratio
%
1999-2000 958.56 37691.59 2.54 3080.76 19616.66 15.70 6959.47 56611.80 12.29
2000-2001 1366.45 40036.14 3.41 3046.13 21029.12 14.49 7243.35 56258.44 12.88
2001-2002 1463.24 41543.76 3.52 3049.38 20029.64 15.22 14747.97 56283.24 26.20
2002-2003 1470.33 49403.01 2.98 3209.16 21871.34 14.67 14390.03 60898.52 23.63
2003-2004 1661.93 52976.51 3.14 3188.66 22538.82 14.15 14969.86 67350.15 22.23
2004-2005 2269.30 62041.62 3.66 3444.07 27054.54 12.73 15549.68 78379.07 19.84
2005-2006 2674.72 67347.26 3.97 3597.90 28478.57 12.63 17593.19 87698.00 20.06
2006-2007 3604.26 80244.69 4.49 4434.94 34018.04 13.04 22324.00 110787.53 20.15
2007-2008 3822.61 89658.00 4.26 4827.01 44764.54 10.78 25705.97 136622.66 18.82
2008-2009 4462.00 103888.00 4.30 6168.95 57352.20 10.76 28773.85 143077.71 20.11
Average 2375.34 62483.06 3.63 3804.70 29675.35 13.42 16825.74 85396.71 19.62
SD 1213.12 22633.74 0.63 1033.28 12479.58 1.73 7125.26 33502.03 4.30

Table(2.13) indicate the percentage ratio of Direct
Expenditure for Service & Programs by Total Income . To
understand the variation of this percentage ratio ten years value of
Direct Expenditure for Service & Programs and Total Income
amount has been taken for the periods 1999-2000 to 2008-2009.
Looking to the ratio percentage, for Surat Municipal
Corporations percentage varies from 2.54 percentage (1999 -2000]
to 4.49 percentage (2006-2007) on Total Income. The average of
the ratio is found to be 3.63 percent during the ten years of period.
Chart 2.13: Ratio Percentage of Direct Expenditure for Service & Programs by
Total Income for all three cities
0.00
5.00
10.00
15.00
20.00
25.00
30.00
1999-
2000
2000-
2001
2001-
2002
2002-
2003
2003-
2004
2004-
2005
2005-
2006
2006-
2007
2007-
2008
2008-
2009
Years
Rati
o (
%)
Surat Vadodara Ahmedabad

For Vadodara Municipal Corporations percentage varies from
10.76 percentage (2008-2009) to 15.70 percentage (1999-2000) on
Total Income. The average of the ratio is found to be 13.42
percent during the ten years of period.
For Ahmedabad Municipal Corporations percentage va ries
from 12.29 percentage (1999-2000) to 26.20 percentage (2001-
2002) on Total Income. The average of the ratio is found to be
19.62 percent during the ten years of period.

Table 2.14: Ratio Percentage of Terminal Benefits by Establishment Expenditure fo r all three cities (In Rs. Lakhs)
Years
Surat Vadodara Ahmedabad
Terminal
Benefits
Establishment
Expenditure
Ratio
%
Terminal
Benefits
Establishment
Expenditure
Ratio
%
Terminal
Benefits
Establishment
Expenditure
Ratio
%
1999-2000 1458.65 15507.64 9.41 1354.90 10098.12 13.42 121.69 28540.52 0.43
2000-2001 1666.47 14150.24 11.78 1426.41 9392.68 15.19 133.86 31395.10 0.43
2001-2002 2100.76 14850.10 14.15 1454.13 9470.13 15.35 143.43 30389.77 0.47
2002-2003 2438.02 15800.40 15.43 1863.30 9793.56 19.03 196.26 30548.59 0.64
2003-2004 2618.13 16759.23 15.62 1952.58 10093.70 19.34 249.15 31222.08 0.80
2004-2005 2640.00 17693.26 14.92 2137.49 10339.06 20.67 255.34 30936.31 0.83
2005-2006 2740.00 19270.66 14.22 2511.42 11289.24 22.25 255.63 32924.35 0.78
2006-2007 2733.18 21638.98 12.63 2938.79 14927.19 19.69 155.63 46285.60 0.34
2007-2008 3446.29 26366.01 13.07 3302.21 16265.56 20.30 136.41 47329.18 0.29
2008-2009 4227.36 32126.00 13.16 3159.32 20787.52 15.20 149.27 44917.94 0.33
Average 2606.89 19416.25 13.44 2210.05 12245.68 18.04 179.67 35448.94 0.53
SD 806.43 5790.41 1.88 732.15 3829.16 2.98 54.51 7502.65 0.21
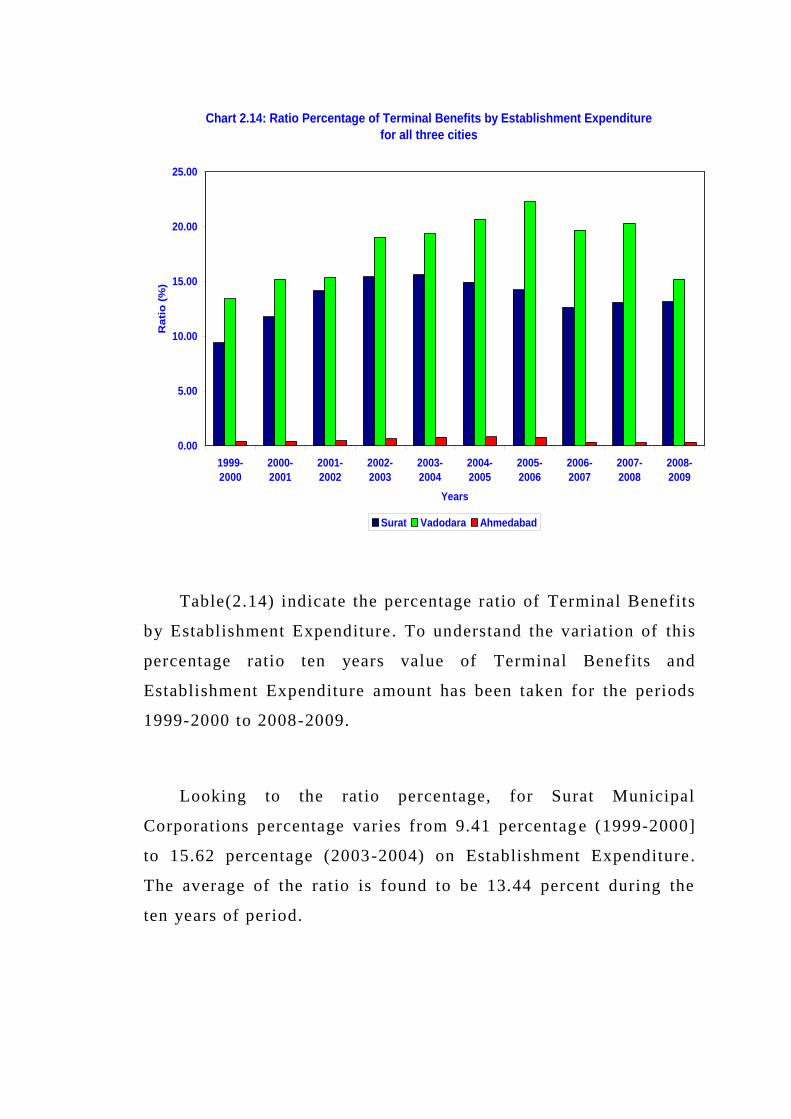
Table(2.14) indicate the percentage ratio of Terminal Benefits
by Establishment Expenditure . To understand the variation of this
percentage ratio ten years value of Terminal Benefits and
Establishment Expenditure amount has been taken for the periods
1999-2000 to 2008-2009.
Looking to the ratio percentage, for Surat Municipal
Corporations percentage varies from 9.41 percentag e (1999-2000]
to 15.62 percentage (2003-2004) on Establishment Expenditure .
The average of the ratio is found to be 13.44 percent during the
ten years of period.
Chart 2.14: Ratio Percentage of Terminal Benefits by Establishment Expenditure
for all three cities
0.00
5.00
10.00
15.00
20.00
25.00
1999-
2000
2000-
2001
2001-
2002
2002-
2003
2003-
2004
2004-
2005
2005-
2006
2006-
2007
2007-
2008
2008-
2009
Years
Rati
o (
%)
Surat Vadodara Ahmedabad

For Vadodara Municipal Corporations percentage varies from
13.42 percentage (1999-2000) to 22.25 percentage (2005-2006) on
Establishment Expenditure . The average of the ratio is found to be
18.04 percent during the ten years of period.
For Ahmedabad Municipal Corporations percentage varies
from 0.29 percentage (2007-2008) to 0.83 percentage (2004-2005)
on Establishment Expenditure . The average of the ratio is found to
be 0.53 percent during the ten years of period.

Table 2.15: Ratio Percentage of Octrio & Toll by Income from Tax for all three cities (In Rs. Lakhs)
Years
Surat Vadodara Ahmedabad
Octrio Income from
Tax
Ratio
% Octrio
Income from
Tax
Ratio
% Octrio
Income from
Tax
Ratio
%
1999-2000 22259.85 29770.78 74.77 9672.19 14817.88 65.27 30918.72 42584.04 72.61
2000-2001 23003.10 31638.85 72.71 11321.95 16349.95 69.25 32451.10 42235.01 76.83
2001-2002 23495.29 33324.30 70.50 10458.90 15551.19 67.25 30806.73 42964.96 71.70
2002-2003 28502.80 39488.40 72.18 11991.35 17878.11 67.07 36130.57 47586.51 75.93
2003-2004 30135.03 42066.87 71.64 13489.09 19158.41 70.41 40093.84 52086.57 76.98
2004-2005 35417.50 49423.06 71.66 15994.42 23899.66 66.92 46204.73 61251.80 75.43
2005-2006 40520.73 52179.01 77.66 18451.98 25029.28 73.72 55150.39 72686.18 75.87
2006-2007 48559.48 62127.32 78.16 22489.07 29045.94 77.43 70815.00 91249.94 77.61
2007-2008 34734.55 69414.60 50.04 16157.67 24575.74 65.75 51200.93 103427.26 49.50
2008-2009 0.00 80433.00 0.00 26.43 31486.37 0.08 0.00 105282.30 0.00
Average 28662.83 48986.62 63.93 13005.30 21779.25 62.32 39377.20 66135.46 65.25
SD 13091.40 17136.18 23.80 6042.64 5856.87 22.19 18791.64 25440.26 24.40

Table(2.15) indicate the percentage ratio of Octrio & Toll by
Income from Tax. To understand the variation of this percentage
ratio ten years value of Octrio & Toll and Income from Tax
amount has been taken for the periods 1999-2000 to 2008-2009.
Looking to the ratio percentage, for Surat Municipal
Corporations percentage varies from 0.00 percentage (2008 -2009]
to 78.16 percentage (2006-2007) on Income from Tax. The average
of the ratio is found to be 63.93 percent during the ten years of
period.
For Vadodara Municipal Corporations percentage varies from
0.08 percentage (2008-2009) to 77.43 percentage (2006-2007) on
Chart 2.15: : Ratio Percentage of Octrio & Toll by Income from Tax for all three
cities
0.00
10.00
20.00
30.00
40.00
50.00
60.00
70.00
80.00
90.00
1999-
2000
2000-
2001
2001-
2002
2002-
2003
2003-
2004
2004-
2005
2005-
2006
2006-
2007
2007-
2008
2008-
2009
Years
Ra
tio
(%
)
Surat Vadodara Ahmedabad

Income from Tax. The average of the ratio is found to be 62.32
percent during the ten years of period.
For Ahmedabad Municipal Corporations percentage varies
from 0.00 percentage (2008-2009) to 77.61 percentage (2006-
2007) on Income from Tax. The average of the ratio is found to be
65.25 percent during the ten years of period.

Table 2.16: Ratio Percentage of Property Tax by Income from Tax for all three cities (In Rs. Lakhs)
Years
Surat Vadodara Ahmedabad
Property
Tax
Income from
Tax
Ratio
%
Property
Tax
Income from
Tax
Ratio
%
Property
Tax
Income from
Tax
Ratio
%
1999-2000 7503.06 29770.78 25.20 5003.98 14817.88 33.77 9604.93 42584.04 22.56
2000-2001 8625.18 31638.85 27.26 4987.93 16349.95 30.51 8431.99 42235.01 19.96
2001-2002 9821.29 33324.30 29.47 5055.04 15551.19 32.51 10923.71 42964.96 25.42
2002-2003 10978.40 39488.40 27.80 5350.72 17878.11 29.93 10031.71 47586.51 21.08
2003-2004 11817.36 42066.87 28.09 5141.38 19158.41 26.84 10029.81 52086.57 19.26
2004-2005 13453.36 49423.06 27.22 7307.88 23899.66 30.58 12504.05 61251.80 20.41
2005-2006 10973.57 52179.01 21.03 6030.00 25029.28 24.09 15243.81 72686.18 20.97
2006-2007 12417.06 62127.32 19.99 5862.54 29045.94 20.18 15842.15 91249.94 17.36
2007-2008 34084.00 69414.60 49.10 6497.04 24575.74 26.44 24839.65 103427.26 24.02
2008-2009 79742.40 80433.00 99.14 24280.67 31486.37 77.11 35451.10 105282.30 33.67
Average 19941.57 48986.62 35.43 7551.72 21779.25 33.20 15290.29 66135.46 22.47
SD 22327.92 17136.18 23.75 5926.87 5856.87 15.96 8560.05 25440.26 4.57

Table(2.16) indicate the percentage ratio of Property Tax by
Income from Tax. To understand the variation of this percentage
ratio ten years value of Property Tax and Income from Tax amount
has been taken for the periods 1999-2000 to 2008-2009.
Looking to the ratio percentage, for Surat Municipal
Corporations percentage varies from 19.99 percentage (2006-2007]
to 99.14 percentage (2008-2009) on Income from Tax. The average
of the ratio is found to be 35.43 percent during the ten years of
period.
For Vadodara Municipal Corporations percentage varies from
20.18 percentage (2006-2007) to 77.11 percentage (2008-2009) on
Chart 2.16: : Ratio Percentage of Property Tax by Income from Tax for all three cities
0.00
20.00
40.00
60.00
80.00
100.00
120.00
1999-
2000
2000-
2001
2001-
2002
2002-
2003
2003-
2004
2004-
2005
2005-
2006
2006-
2007
2007-
2008
2008-
2009
Years
Rati
o (
%)
Surat Vadodara Ahmedabad

Income from Tax. The average of the ratio is found to be 33.20
percent during the ten years of period.
For Ahmedabad Municipal Corporations percentage varies
from 17.36 percentage (2006-2007) to 33.67 percentage (2008-
2009) on Income from Tax. The average of the ratio is found to be
22.47 percent during the ten years of period.

Table 2.17: Ratio Percentage of Other direct Tax & Toll by Income from Tax for all three cities (In Rs. Lakhs)
Years
Surat Vadodara Ahmedabad
Other
Direct Tax
Income from
Tax
Ratio
%
Other
Direct Tax
Income from
Tax
Ratio
%
Other
Direct Tax
Income from
Tax
Ratio
%
1999-2000 7.87 29770.78 0.03 141.70 14817.88 0.96 2060.39 42584.04 4.84
2000-2001 10.58 31638.85 0.03 40.07 16349.95 0.25 1351.92 42235.01 3.20
2001-2002 7.72 33324.30 0.02 37.24 15551.19 0.24 1234.52 42964.96 2.87
2002-2003 7.20 39488.40 0.02 536.04 17878.11 3.00 1424.23 47586.51 2.99
2003-2004 114.48 42066.87 0.27 527.94 19158.41 2.76 1962.92 52086.57 3.77
2004-2005 552.19 49423.06 1.12 597.35 23899.66 2.50 2543.02 61251.80 4.15
2005-2006 684.71 52179.01 1.31 547.30 25029.28 2.19 2291.98 72686.18 3.15
2006-2007 1150.78 62127.32 1.85 694.34 29045.94 2.39 4592.79 91249.94 5.03
2007-2008 596.05 69414.60 0.86 1921.03 24575.74 7.82 27386.68 103427.26 26.48
2008-2009 690.60 80433.00 0.86 7179.27 31486.37 22.80 69831.20 105282.30 66.33
Average 382.22 48986.62 0.64 1222.23 21779.25 4.49 11467.97 66135.46 12.28
SD 405.89 17136.18 0.66 2160.80 5856.87 6.78 22003.98 25440.26 20.30

Table(2.17) indicate the percentage ratio of Other direct Tax by
Income from Tax. To understand the variation of this percentage
ratio ten years value of other direct Tax and Income from Tax amount
has been taken for the periods 1999-2000 to 2008-2009.
Looking to the ratio percentage, for Surat Municipal
Corporations percentage varies from 0.02 percentage (2001 -2002,
2002-2003] to 1.85 percentage (2006-2007) on Income from Tax. The
average of the ratio is found to be 0.64 percent during the ten years
of period.
Chart 2.17: Ratio Percentage of Other direct Tax & Toll by Income from Tax for
all three cities
0.00
10.00
20.00
30.00
40.00
50.00
60.00
70.00
1999-
2000
2000-
2001
2001-
2002
2002-
2003
2003-
2004
2004-
2005
2005-
2006
2006-
2007
2007-
2008
2008-
2009
Years
Gro
wth
Ra
te (
%)
Surat Vadodara Ahmedabad

For Vadodara Municipal Corporations percentage varies from
0.24 percentage (2001-2002) to 22.80 percentage (2008-2009) on
Income from Tax. The average of the ratio is found to be 4.49
percent during the ten years of period.
For Ahmedabad Municipal Corporations percentage varies from
2.87 percentage (2001-2002) to 66.33 percentage (2008-2009) on
Income from Tax. The average of the ratio is found to be 12.28
percent during the ten years of period.

5.4 Analysis of Variance
In this section we have tries to analyse the variation between
different major financial components of Municipal Corporations. In
this way we have use the one way analysis of variance for the mean
comparison of major financial indicators of mun icipal corporations.
Table 3.1: Mean comparison of Per Capita Total Income across
all three Municipal Corporations using One Way
Analysis of Variance .
Municipal
Corporations Mean SD F-value P-value
Surat 1922.793 293.091
0.556 0.580 Vadodara 2020.637 677.644
Ahmedabad 2198.332 712.053
(p <= 0.05, Significant at 5% level of significance)
Above table shows the mean comparison regarding the per
capita total income across the three municipal corporations. To
derive the per capita total income, tota l income has been divided by
their projected population for the respected year. Above table also
indicate mean values along with SD value for per capita total income
parameter.

With the help of One Way Analysis of Variance statistics,
following null hypothesis has been tested.
Average per capita total income for Surat, Vadodara and
Ahmedabad municipal corporations are alike for the ten years of
periods from 1999-2000 to 2008-2009.
Above result indicate F-value (0.556) is not found to be
significant, as p-value is 0.580. So by accepting the above
assumption, it can be conclude that there is no significant difference
between mean values of per capita income amongst Surat (Rs.
1922.793), Vadodara (2020.637) and Ahmedabad (2198.332)
municipal corporations.
Table 3.2: Mean comparison of Per Capita Expenditure across
all three Municipal Corporations using One Way
Analysis of Variance.
Municipal
Corporations Mean SD F-value P-value
Surat 936.757 109.599
18.799 0.000* Vadodara 1589.861 339.057
Ahmedabad 1456.415 251.070
* Significant at the 0.05 level
Pair having significant difference (Surat, Vadodara) (Surat,
Ahmedabad)
(p <= 0.05, Significant at 5% level of significance)

Above table shows the mean comparison regarding the per capita
expenditure across the three municipal corporations. To derive the
per capita expenditure, expenditure has been divided by their
projected population for the respected year. Above table also indicate
mean values along with SD value for per capita total expenditure.
With the help of One Way Analysis of Variance statistics,
following null hypothesis has been tested.
Average per capita expenditure for Surat, Vadodara and
Ahmedabad municipal corporations are alike for the ten years of
periods from 1999-2000 to 2008-2009.
Above result indicate F-value (18.799) is found to be significant,
as p-value is 0.000. So by rejecting the above assumption, it can be
conclude that, there exist significant difference between mean values
of per capita expenditure amongst Surat, Vadodara and Ahmedabad
municipal corporations.
Also by performing post hoc statistics, it is to be found that
there exists significant difference in the mean values of Surat
(936.757) with Vadodara (1589.861) and Ahmedabad (1456.415).

Table 3.3: Mean comparison of Ratio Per Capita Income by
Per Capita Expenditure across all three Municipal
Corporations using One Way Analysis of Variance.
Municipal
Corporations Mean SD F-value P-value
Surat 2.060 0.265
34.267 0.000* Vadodara 1.249 0.163
Ahmedabad 1.481 0.237
* Significant at the 0.05 level
Pair having significant difference (Surat, Vadodara) (Surat,
Ahmedabad)
(p <= 0.05, Significant at 5% level of significance)
Above table shows the mean comparison regarding the per
capita income over per capita expenditure across the three municipal
corporations. To derive the per capita income expenditure ratio, per
capita income has been divided by per capita expenditure for the
respected year. Above table also indicate mean values along with SD
value for the above mentioned ratio.
With the help of One Way Analysis of Variance statistics,
following null hypothesis has been tested.
Average per capita income over per capita expenditure for
Surat, Vadodara and Ahmedabad municipal corporations are
alike for the ten years of periods from 1999-2000 to 2008-2009.

Above result indicate F-value (34.267) is found to be
significant, as p-value is 0.000. So by rejecting the above
assumption, it can be conclude that, there exist significant difference
between mean values of the define ratio amongst Surat, Vadodara and
Ahmedabad municipal corporations.
Also by performing post hoc statistics, it is to be found that
there exists significant difference in the mean values of Surat (2.060)
with Vadodara (1.249) and Ahmedabad (1.481).
Table 3.4: Mean comparison of Financial Expense by Loan
across all three Municipal Corporations using One
Way Analysis of Variance.
Municipal
Corporations Mean SD F-value P-value
Surat 9.418 7.890
4.688 0.018* Vadodara 13.738 5.525
Ahmedabad 19.450 8.322
* Significant at the 0.05 level
Pair having significant difference (Surat, Ahmedabad)
(p <= 0.05, Significant at 5% level of significance)
Above table shows the mean comparison of ratio based on the
financial expense by loan across the three municipal corporations. To
derive the mentioned ratio, financial expense has been divided by

total loan amount for the respected year. Above table also indicate
mean values along with SD value for the above mentioned ratio.
With the help of One Way Analysis of Variance statistics,
following null hypothesis has been tested.
Average of ratio of financial charge by loan for Surat,
Vadodara and Ahmedabad municipal corporations are alike for
the ten years of periods from 1999-2000 to 2008-2009.
Above result indicate F-value (4.688) is found to be
significant, as p-value is 0.018. So by rejecting the above
assumption, it can be conclude that, there exist significant difference
between mean values of the define ratio amongst Surat, Vadodara and
Ahmedabad municipal corporations.
Also by performing post hoc statistics, it is to be found that
there exists significant difference in the mean values of Surat (9.418)
with Ahmedabad (19.450).

Table 3.5: Mean comparison of Expenditure by Income across
all three Municipal Corporations using One Way
Analysis of Variance.
Municipal
Corporations Mean SD F-value P-value
Surat 64.927 8.106
17.774 0.000* Vadodara 96.983 10.115
Ahmedabad 81.680 16.306
* Significant at the 0.05 level
Pair having significant difference (Surat, Vadodara) (Vadodara,
Ahmedabad) (Surat, Ahmedabad)
(p <= 0.05, Significant at 5% level of significance)
Above table shows the mean comparison of ratio regarding
expenditure by total income across the three municipal corporations.
To derive the mentioned ratio, expenditure has been divided by total
income for the respected year. Above table also indicate mean values
along with SD value for the above mentioned ratio.
With the help of One Way Analysis of Variance statistics,
following null hypothesis has been tested.
Average of ratio of expenditure by total income for Surat,
Vadodara and Ahmedabad municipal corporations are alike for
the ten years of periods from 1999-2000 to 2008-2009.

Above result indicate F-value (17.774) is found to be
significant, as p-value is 0.000. So by rejecting the above
assumption, it can be conclude that, there exist significant difference
between mean values of the define ratio amongst Surat, Vadodara and
Ahmedabad municipal corporations.
Also by performing post hoc statistics, it is to be found that
there exists significant difference in the mean values in all three
municipal corporations i.e. Surat (64.927), Vadodara (96.983) and
Ahmedabad (81.680).
Table 3.6: Mean comparison of Establishment Expenditure by
total Revenue Income across all three Municipal
Corporations using One Way Analysis of Variance.
Municipal
Corporations Mean SD F-value P-value
Surat 32.028 4.291
11.560 0.000* Vadodara 42.732 4.983
Ahmedabad 44.156 8.415
* Significant at the 0.05 level
Pair having significant difference (Surat, Vadodara) (Surat,
Ahmedabad)
(p <= 0.05, Significant at 5% level of significance)
Above table shows the mean comparison of ratio regarding
establishment expenditure by total revenue income acro ss the three

municipal corporations. To derive the mentioned ratio, establishment
expenditure has been divided by total revenue income for the
respected year. Above table also indicate mean values along with SD
value for the above mentioned ratio.
With the help of One Way Analysis of Variance statistics,
following null hypothesis has been tested.
Average of ratio of establishment expenditure by total
revenue income for Surat, Vadodara and Ahmedabad municipal
corporations are alike for the ten years of per iods from 1999-2000
to 2008-2009.
Above result indicate F-value (11.560) is found to be
significant, as p-value is 0.000. So by rejecting the above
assumption, it can be conclude that, there exist significant difference
between mean values of the define ratio amongst Surat, Vadodara and
Ahmedabad municipal corporations.
Also by performing post hoc statistics, it is to be found that
there exists significant difference between Surat (32.028) with
Vadodara (42.732) and Ahmedabad (44.156).

Table 3.7: Mean comparison of Administrative Expense by
total Revenue Income across all three Municipal
Corporations using One Way Analysis of Variance.
Municipal
Corporations Mean SD F-value P-value
Surat 13.716 1.271
696.400 0.000* Vadodara 1.333 0.652
Ahmedabad 1.695 0.317
* Significant at the 0.05 level
Pair having significant difference (Surat, Vadodara) (Surat,
Ahmedabad)
(p <= 0.05, Significant at 5% level of significance)
Above table shows the mean comparison of ratio regarding
administrative expenditure by total revenue income across the three
municipal corporations. To derive the mentioned ratio, administrative
expenditure has been divided by total revenue income for the
respected year. Above table also indicate mean values along with SD
value for the above mentioned ratio.
With the help of One Way Analysis of Variance statistics,
following null hypothesis has been tested.
Average of ratio of administrative expenditure by total
revenue income for Surat, Vadodara and Ahmedabad municipal

corporations are alike for the ten years of periods from 1999 -2000
to 2008-2009.
Above result indicate F-value (696.400) is found to be
significant, as p-value is 0.000. So by rejecting the above
assumption, it can be conclude that, there exist significant difference
between mean values of the define ratio amongst Surat, Vadodara and
Ahmedabad municipal corporations.
Also by performing post hoc statistics, it is to be found that
there exists significant difference between Surat (13.716) with
Vadodara (1.333) and Ahmedabad (1.695).
Table 3.8: Mean comparison of Repair & Maintains Expense by
Total Revenue Income across all three Municipal
Corporations using One Way Analysis of Variance.
Municipal
Corporations Mean SD F-value P-value
Surat 7.978 1.506
414.460 0.000* Vadodara 21.218 1.919
Ahmedabad 3.390 0.504
* Significant at the 0.05 level
Pair having significant difference (Surat, Vadodara) (Vadodara,
Ahmedabad) (Surat, Ahmedabad)
(p <= 0.05, Significant at 5% level of significance)

Above table shows the mean comparison of ratio regarding
repair and maintains expense by total revenue income across the
three municipal corporations. To derive the mentioned ratio, repair
and maintains expense has been divided by total revenue income for
the respected year. Above table also indicate mean values along with
SD value for the above mentioned ratio.
With the help of One Way Analysis of Variance statistics,
following null hypothesis has been tested.
Average of ratio of repair and maintains expense by total
revenue income for Surat, Vadodara and Ahmedabad municipal
corporations are alike for the ten years of periods from 1999 -2000
to 2008-2009.
Above result indicate F-value (414.460) is found to be
significant, as p-value is 0.000. So by rejecting the above
assumption, it can be conclude that, there exist significant difference
between mean values of the define ratio amongst Surat, Vadodara and
Ahmedabad municipal corporations.
Also by performing post hoc statistics, it is to be found that
there exists significant difference between all three municipal

corporations i.e. Surat (7.978) with Vadodara (21.218) and
Ahmedabad (3.390).
Table 3.9: Mean comparison of Direct Expense by Total
Revenue Income across all three Municipal
Corporations using One Way Analysis of Varianc e.
Municipal
Corporations Mean SD F-value P-value
Surat 3.628 0.632
288.356 0.000* Vadodara 13.417 1.731
Ahmedabad 2.814 0.475
* Significant at the 0.05 level
Pair having significant difference (Surat, Vadodara) (Vadodara,
Ahmedabad)
(p <= 0.05, Significant at 5% level of significance)
Above table shows the mean comparison of ratio regarding
direct expense by total revenue income across the three municipal
corporations. To derive the mentioned ratio, direct expense has been
divided by total revenue income for the respected year. Above table
also indicate mean values along with SD value for the above
mentioned ratio.
With the help of One Way Analysis of Variance statistics,
following null hypothesis has been tested.

Average of ratio of direct expense by total revenue income
for Surat, Vadodara and Ahmedabad municipal corporations are
alike for the ten years of periods from 1999-2000 to 2008-2009.
Above result indicate F-value (288.356) is found to be
significant, as p-value is 0.000. So by reject ing the above
assumption, it can be conclude that, there exist significant difference
between mean values of the define ratio amongst Surat, Vadodara and
Ahmedabad municipal corporations.
Also by performing post hoc statistics, it is to be found that
there exists significant difference Vadodara (13.417) with Surat
(3.628) and Ahmedabad (2.814).
Table 3.10: Mean comparison of Financial Expense
by Total Revenue Income across all three Municipal
Corporations using One Way Analysis of Variance.
Municipal
Corporations Mean SD F-value P-value
Surat 2.567 2.054
92.026 0.000* Vadodara 3.741 3.148
Ahmedabad 18.642 3.471
* Significant at the 0.05 level
Pair having significant difference (Vadodara, Ahmedabad) (Surat,
Ahmedabad)
(p <= 0.05, Significant at 5% level of significance)

Above table shows the mean comparison of ratio regarding
financial expense by total revenue income across the three municipal
corporations. To derive the mentioned ratio, financial expense has
been divided by total revenue income for the respected year. Above
table also indicate mean values along with SD value for the above
mentioned ratio.
With the help of One Way Analysis of Variance statistics,
following null hypothesis has been tested.
Average of ratio of financial expense by total revenue
income for Surat, Vadodara and Ahmedabad municipal
corporations are alike for the ten years of periods from 1999 -2000
to 2008-2009.
Above result indicate F-value (92.026) is found to be
significant, as p-value is 0.000. So by rejecting the above
assumption, it can be conclude that, there exist significant difference
between mean values of the define ratio amongst Surat, Vadodara and
Ahmedabad municipal corporations.
Also by performing post hoc statistics, it is to be found that
there exists significant difference between Ahmedabad (18.642) with
Surat (2.568) and Vadodara (3.741).

Table 3.11: Mean comparison of Other Expense by Total
Revenue Income across all three Municipal
Corporations using One Way Analysis of Variance.
Municipal
Corporations Mean SD F-value P-value
Surat 3.132 0.415
453.560 0.000* Vadodara 0.072 0.151
Ahmedabad 0.123 0.089
* Significant at the 0.05 level
Pair having significant difference (Surat, Vadodara) (Surat,
Ahmedabad)
(p <= 0.05, Significant at 5% level of significance)
Above table shows the mean comparison of ratio regarding
other expense by total revenue income across the three municipal
corporations. To derive the mentioned ratio, other expense has been
divided by total revenue income for the respecte d year. Above table
also indicate mean values along with SD value for the above
mentioned ratio.
With the help of One Way Analysis of Variance statistics,
following null hypothesis has been tested.
Average of ratio of other expense by total revenue income
for Surat, Vadodara and Ahmedabad municipal corporations are
alike for the ten years of periods from 1999-2000 to 2008-2009.

Above result indicate F-value (453.560) is found to be
significant, as p-value is 0.000. So by rejecting the above
assumption, it can be conclude that, there exist significant difference
between mean values of the define ratio amongst Surat, Vadodara and
Ahmedabad municipal corporations.
Also by performing post hoc statistics, it is to be found that
there exists significant difference between Surat (3.132) with
Vadodara (0.072) and Ahmedabad (0.123).
Table 3.12: Mean comparison of Income over Expenditure
by Total Revenue Income across all three Municipal
Corporations using One Way Analysis of Variance.
Municipal
Corporations Mean SD F-value P-value
Surat 50.667 6.914
28.630 0.000* Vadodara 18.822 9.915
Ahmedabad 30.875 11.170
* Significant at the 0.05 level
Pair having significant difference (Surat, Vadodara) (Vadodara,
Ahmedabad) (Surat, Ahmedabad)
(p <= 0.05, Significant at 5% level of significance)

Above table shows the mean comparison of ratio regarding
income over expenditure by total revenue income across the three
municipal corporations. To derive the mentioned ratio, income over
expenditure has been divided by to tal revenue income for the
respected year. Above table also indicate mean values along with SD
value for the above mentioned ratio.
With the help of One Way Analysis of Variance statistics,
following null hypothesis has been tested.
Average of ratio of income over expenditure by total
revenue income for Surat, Vadodara and Ahmedabad municipal
corporations are alike for the ten years of periods from 1999 -2000
to 2008-2009.
Above result indicate F-value (28.630) is found to be
significant, as p-value is 0.000. So by rejecting the above
assumption, it can be conclude that, there exist significant difference
between mean values of the define ratio amongst Surat, Vadodara and
Ahmedabad municipal corporations.
Also by performing post hoc statistics, it is to be found that
there exists significant difference between Vadodara (18.822) with
Surat (50.667) and Ahmedabad (30.875).

Table 3.13: Mean comparison of Income over Expenditure
by Municipal Fund & Reserve & Surplus across all
three Municipal Corporations using One Way
Analysis of Variance.
Municipal
Corporations Mean SD F-value P-value
Surat 15.394 3.433
20.742 0.000* Vadodara 14.229 8.626
Ahmedabad 34.972 10.500
* Significant at the 0.05 level
Pair having significant difference (Vadodara, Ahmedabad) (Surat,
Ahmedabad)
(p <= 0.05, Significant at 5% level of significance)
Above table shows the mean comparison of ratio regarding
income over expenditure by municipal funds across the three
municipal corporations. To derive the mentioned ratio, income ov er
expenditure has been divided by municipal funds for the respected
year. Above table also indicate mean values along with SD value for
the above mentioned ratio.
With the help of One Way Analysis of Variance statistics,
following null hypothesis has been tested.

Average of ratio of income over expenditure by municipal
funds for Surat, Vadodara and Ahmedabad municipal
corporations are alike for the ten years of periods from 1999 -2000
to 2008-2009.
Above result indicate F-value (20.742) is found to be
significant, as p-value is 0.000. So by rejecting the above
assumption, it can be conclude that, there exist significant difference
between mean values of the define ratio amongst Surat, Vadodara and
Ahmedabad municipal corporations.
Also by performing post hoc statistics, it is to be found that
there exists significant difference between Ahmedabad (34.972) with
Surat (15.394) and Vadodara (14.229).
Table 3.14: Mean comparison of Salary, Wages &
allowances by Total Income across all three
Municipal Corporations using One Way Analysis of
Variance.
Municipal
Corporations Mean SD F-value P-value
Surat 26.433 3.943
3.971 0.031* Vadodara 31.676 3.880
Ahmedabad 26.669 5.970
* Significant at the 0.05 level
Pair having significant difference (Vadodara, Ahm edabad)
(Vadodara, Surat)
(p <= 0.05, Significant at 5% level of significance)

Above table shows the mean comparison of ratio regarding
salary, wages & allowances by total income across the three
municipal corporations. To derive the mentioned ratio, tota l of
salary, wages and allowance has been divided by total income for the
respected year. Above table also indicate mean values along with SD
value for the above mentioned ratio.
With the help of One Way Analysis of Variance statistics, following
null hypothesis has been tested.
Average of ratio of salary, wages and allowance by total
income for Surat, Vadodara and Ahmedabad municipal
corporations are alike for the ten years of periods from 1999 -2000
to 2008-2009.
Above result indicate F-value (3.971) is found to be
significant, as p-value is 0.031. So by rejecting the above
assumption, it can be conclude that, there exist significant difference
between mean values of the define ratio amongst Surat, Vadodara and
Ahmedabad municipal corporations.
Also by performing post hoc statistics, it is to be found that
there exists significant difference between Vadodara (31.676) with
Ahmedabad (26.669) and Surat (26.433).

Table 3.15: Mean comparison of Salary, Wages & allowances
by Establishment Expenditure across all three
Municipal Corporations using One Way Analysis of
Variance.
Municipal
Corporations Mean SD F-value P-value
Surat 82.426 1.807
78.067 0.000* Vadodara 74.152 3.861
Ahmedabad 60.271 5.476
* Significant at the 0.05 level
Pair having significant difference (Vadodara, Ahmedabad)
(Vadodara, Surat) (Surat, Ahmedabad)
(p <= 0.05, Significant at 5% level of significance)
Above table shows the mean comparison of ratio regarding
salary, wages & allowances by establishment expenditure across the
three municipal corporations. To derive the mentioned ratio, total of
salary, wages and allowance has been divided by establishment
expenditure for the respected year. Above table also indicate mean
values along with SD value for the above mentioned ratio.
With the help of One Way Analysis of Variance statistics,
following null hypothesis has been tested.

Average of ratio of salary, wages and allowance by
establishment expenditure for Surat, Vadodara and Ahmedabad
municipal corporations are alike for the te n years of periods from
1999-2000 to 2008-2009.
Above result indicate F-value (78.067) is found to be
significant, as p-value is 0.000. So by rejecting the above
assumption, it can be conclude that, there exist significant difference
between mean values of the define ratio amongst Surat, Vadodara and
Ahmedabad municipal corporations.
Also by performing post hoc statistics, it is to be found that
there exists significant difference between all the municipal
corporations i.e. Surat (82.426), Vadodara (74.15 2) and Ahmedabad
(60.271).

Table 3.16: Mean comparison of Direct Expenditure for
Service & Programs by Total Income across all three
Municipal Corporations using One Way Analysis of
Variance.
Municipal
Corporations Mean SD F-value P-value
Surat 3.627 0.634
88.941 0.000* Vadodara 13.417 1.731
Ahmedabad 19.620 4.305
* Significant at the 0.05 level
Pair having significant difference (Surat, Vadodara) (Vadodara,
Ahmedabad) (Surat, Ahmedabad)
(p <= 0.05, Significant at 5% level of significan ce)
Above table shows the mean comparison of ratio regarding
direct expenditure for service and programs by total income across
the three municipal corporations. To derive the mentioned ratio,
regarding direct expenditure for service and programs has been
divided by total income for the respected year. Above table also
indicate mean values along with SD value for the above mentioned
ratio.
With the help of One Way Analysis of Variance statistics,
following null hypothesis has been tested.

Average of ratio of direct expenditure for service and
programs by total income for Surat, Vadodara and Ahmedabad
municipal corporations are alike for the ten years of periods from
1999-2000 to 2008-2009.
Above result indicate F-value (88.941) is found to be
significant, as p-value is 0.000. So by rejecting the above
assumption, it can be conclude that, there exist significant difference
between mean values of the define ratio amongst Surat, Vadodara and
Ahmedabad municipal corporations.
Also by performing post hoc stat istics, it is to be found that
there exists significant difference between all three i.e. Surat
(3.627), Vadodara (13.417) and Ahmedabad (19.620).

Table 3.17: Mean comparison of Terminal Benefits by
Establishment Expenditure across all three Municipal
Corporations using One Way Analysis of Variance.
Municipal
Corporations Mean SD F-value P-value
Surat 13.438 1.884
198.203 0.000* Vadodara 18.044 2.980
Ahmedabad 0.534 0.209
* Significant at the 0.05 level
Pair having significant difference (Vadodara, Ahmedabad) (Surat,
Ahmedabad)
(p <= 0.05, Significant at 5% level of significance)
Above table shows the mean comparison of ratio regarding
terminal benefits by establishment expenditure across the three
municipal corporations. To derive the mentioned ratio, regarding
terminal benefits has been divided by establishment expenditure for
the respected year. Above table also indicate mean values along with
SD value for the above mentioned ratio.
With the help of One Way Analysis of Variance statist ics,
following null hypothesis has been tested.
Average of ratio of terminal benefits by establishment
expenditure for Surat, Vadodara and Ahmedabad municipal

corporations are alike for the ten years of periods from 1999 -2000
to 2008-2009.
Above result indicate F-value (198.203) is found to be
significant, as p-value is 0.000. So by rejecting the above
assumption, it can be conclude that, there exist significant difference
between mean values of the define ratio amongst Surat, Vadodara and
Ahmedabad municipal corporations.
Also by performing post hoc statistics, it is to be found that
there exists significant difference between all three municipal
corporations i.e. Surat (13.438), Vadodara (18.044) and Ahmedabad
(0.534).
Table 3.18: Mean comparison of Octrio & Toll by Income
from Tax across all three Municipal Corporations
using One Way Analysis of Variance.
Municipal
Corporations Mean SD F-value P-value
Surat 63.932 23.795
0.039 0.962 Vadodara 62.315 22.196
Ahmedabad 65.246 24.395
(p <= 0.05, Significant at 5% level of significance)

Above table shows the mean comparison of ratio regarding
income from octrio & toll by income from tax across the three
municipal corporations. To derive the mentioned ratio, income from
octrio & toll has been divided by income from tax for the respected
year. Above table also indicate mean values along with SD value for
the above mentioned ratio.
With the help of One Way Analysis of Variance statistics,
following null hypothesis has been tested.
Average of ratio of income from octrio & toll by income
from tax for Surat, Vadodara and Ahmedabad municipal
corporations are alike for the ten years of periods from 1999 -2000
to 2008-2009.
Above result indicate F-value (0.039) is not found to be
significant, as p-value is 0.962. So by accepting the above
assumption, it can be conclude that, there exist no significant
difference between mean values of the define ratio amongst Surat,
Vadodara and Ahmedabad municipal corporations.

Table 3.19: Mean comparison of Property Tax & Toll by
Income from Tax across all three Municipal
Corporations using One Way Analysis of Variance.
Municipal
Corporations Mean SD F-value P-value
Surat 35.431 23.754
1.714 0.199 Vadodara 33.196 15.959
Ahmedabad 22.472 4.567
(p <= 0.05, Significant at 5% level of significance)
Above table shows the mean comparison of ratio regarding
income from property tax by income from tax across the three
municipal corporations. To derive the mentioned ratio, income from
property tax has been divided by income from tax for the respected
year. Above table also indicate mean values along with SD value for
the above mentioned ratio.
With the help of One Way Analysis of Variance statistics,
following null hypothesis has been tested.
Average of ratio of income from property tax by income
from tax for Surat, Vadodara and Ahmedabad municipal
corporations are alike for the ten years of periods from 1999 -2000
to 2008-2009.

Above result indicate F-value (1.714) is not found to be
significant, as p-value is 0.199. So by accepting the above
assumption, it can be conclude that, there exist no significant
difference between mean values of the define ratio amongst Surat,
Vadodara and Ahmedabad municipal corporations.
Table 3.20: Mean comparison of Other direct Tax & Toll
by Income from Tax across all three Municipal
Corporations using One Way Analysis of Variance.
Municipal
Corporations Mean SD F-value P-value
Surat 0.637 0.658
2.302 0.119 Vadodara 4.491 6.780
Ahmedabad 12.282 20.302
(p <= 0.05, Significant a t 5% level of significance)
Above table shows the mean comparison of ratio regarding
income from other direct tax by income from tax across the three
municipal corporations. To derive the mentioned ratio, income from
other direct tax has been divided by income from tax for the
respected year. Above table also indicate mean values along with SD
value for the above mentioned ratio.
With the help of One Way Analysis of Variance statistics,
following null hypothesis has been tested.
Average of ratio of income from other direct tax by income
from tax for Surat, Vadodara and Ahmedabad municipal
corporations are alike for the ten years of periods from 1999 -2000
to 2008-2009.
Above result indicate F-value (2.302) is not found to be
significant, as p-value is 0.119. So by accepting the above
assumption, it can be conclude that, there exist no significant
difference between mean values of the define ratio amongst Surat,
Vadodara and Ahmedabad municipal corporations.
5.5 Regression Analysis
A time series is a set of ordered observations on a quantitative
characteristic of a phenomenon at equally spaced time points. One of
the main goals of time series analysis is to forecast future values of
the series.
A trend is a regular, slowly evolving change in the series l evel.
Changes that can be modeled by low-order polynomials

In making a forecast, it is also important to provide a measure
of how accurate one can expect the forecast to be. The use of
intuitive methods usually precludes any quantitative measure of
confidence in the resulting forecast. The statistical analysis of the
individual relationships that make up a model, and of the model as a
whole, makes it possible to attach a measure of confidence to the
model‘s forecasts.
In the Single-Equation Regression Models the variable under
study is explained by a single function (linear or nonlinear) of a
number of explanatory variables. The equation will often be time -
dependent (i.e., the time index will appear explicitly in the model),
so that one can predict the response over time of the variable under
study to changes in one or more of the explanatory variables. A
principal purpose for constructing single -equation regression models
is forecasting. A forecast is a quantitative estimate (or set of
estimates) about the likelihood of future events which is developed
on the basis of past and current information. This information is
embodied in the form of a model—a single-equation structural model
and a multi-equation model or a time-series model. By extrapolating
our models beyond the period over which they were estimated, we
can make forecasts about near future events. This section shows how
the single-equation regression model can be used as a forecasting
tool.

Table 4.1: Trend analysis for Income from Tax using
Regression Analysis across three Municipal
Corporations using the data for the year 1999 -2000 to
2008-2009
Regression
result
Surat Vadodara Ahmedabad
R 0.974 0.944 0.951
R2 0.949 0.891 0.904
F-value 149.360 65.302 75.627
p-value 0.000* 0.000* 0.000*
Coefficient of
X (b) 5514.146 1825.851 7991.209
p-value 0.000 0.000 0.000
Constant 18658.840 11737.071 22180.811
p-value 0.000 0.000 0.005
In the above table, the model summary table reports the
strength of the relationship between the years and Inco me fro tax for
Surat, Vadodara and Ahmedabad Municipal Corporations.
For Surat, R the multiple correlation coefficients indicates the
linear correlation between the observed and model predicated value
of Income from tax. Here it indicates high positive c orrelation
(0.974) between years and Income from tax. R2 the coefficient of
determinant is square value of the multiple correlation coefficient. It
shows that in Surat, 94.9 percent of Income from tax can be

explained by years. Moreover regression model as well as coefficient
of independent variable i.e. years is found to be significant.
Similarly to Vadodara multiple correlation coefficients R
indicate high positive correlation (0.944) between the year and
Income from tax. Value of determinant of coeffic ient R2 reflects 89.1
percent income from tax is explained by years. Model F -value is also
found to be significant with significant coefficient value of years.
For Ahmedabad high positive correlation found between year
and Income from tax, the value of R is 0.951. Value of determinant
of coefficient R2 reflects 90.4 percent income from tax is explained
by years. Model F-value and coefficient of years is found to be
significant.
Model for prediction for Income from tax with year for all
three municipal corporations are as follows.
Surat: y = 18658.840 + 5514.146 (x)
Vadodara: y = 11737.017 + 1825.851 (x)
Ahmedabad: y = 22180.811 + 7991.209 (x)
Where y is Income from tax & x is year
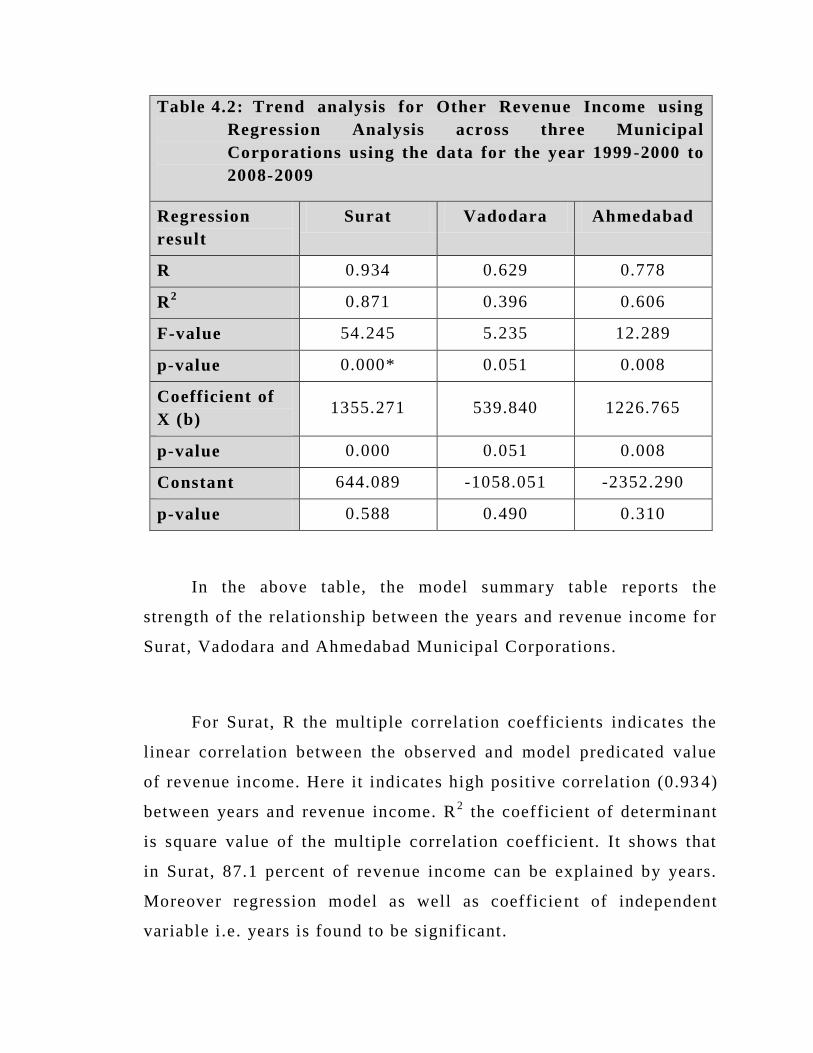
Table 4.2: Trend analysis for Other Revenue Income using
Regression Analysis across three Municipal
Corporations using the data for the year 1999-2000 to
2008-2009
Regression
result
Surat Vadodara Ahmedabad
R 0.934 0.629 0.778
R2 0.871 0.396 0.606
F-value 54.245 5.235 12.289
p-value 0.000* 0.051 0.008
Coefficient of
X (b) 1355.271 539.840 1226.765
p-value 0.000 0.051 0.008
Constant 644.089 -1058.051 -2352.290
p-value 0.588 0.490 0.310
In the above table, the model summary table reports the
strength of the relationship between the years and revenue income for
Surat, Vadodara and Ahmedabad Municipal Corporations.
For Surat, R the multiple correlation coefficients indicates the
linear correlation between the observed and model predicated value
of revenue income. Here it indicates high positive correlation (0.93 4)
between years and revenue income. R2 the coefficient of determinant
is square value of the multiple correlation coefficient. It shows that
in Surat, 87.1 percent of revenue income can be explained by years.
Moreover regression model as well as coefficient of independent
variable i.e. years is found to be significant.

For Vadodara multiple correlation coefficients R indicate
positive correlation (0.629) between the year and Income from tax.
Value of determinant of coefficient R2 reflects 39.6 percent income
from tax is explained by years. Model F-value is not found to be
significant. with non-significant coefficient value of years.
For Ahmedabad high positive correlation found between year
and revenue income from tax, the value of R is 0.778. Value of
determinant of coefficient R2 reflects 60.6 percent revenue income is
explained by years. Model F-value and coefficient of years is found
to be significant.
Model for prediction for revenue income from tax with year for all
three municipal corporations are as follows.
Surat: y = 644.089 + 1355.271 (x)
Vadodara: y = -1056.051 + 539.840 (x)
Ahmedabad: y = -2352.290 + 1226.765 (x)
Where y is revenue income from tax & x is year

Table 4.3: Trend analysis for Establishment Expenditure
using Regression Analysis across three Municipal
Corporations using the data for the year 1999-2000 to
2008-2009
Regression
result
Surat Vadodara Ahmedabad
R 0.888 0.845 0.844
R2 0.789 0.714 0.713
F-value 29.979 19.973 19.876
p-value 0.001* 0.002* 0.002
Coefficient of
X (b) 1699.181 1068.682 2092.461
p-value 0.001 0.002 0.002
Constant 10070.759 6367.927 23940.411
p-value 0.001 0.003 0.000
In the above table, the model summary table reports the
strength of the relationship between the years and establishment
expenditure for Surat, Vadodara and Ahmedabad Municipal
Corporations.
For Surat, R the multiple correlation coefficients indicates the
linear correlation between the observed and model predicated value
of establishment expenditure. Here it indicates high posi tive
correlation (0.888) between years and establishment expenditure. R2
the coefficient of determinant is square value of the multiple
correlation coefficient. It shows that in Surat, 78.9 percent of
establishment expenditure can be explained by years. Mo reover

regression model as well as coefficient of independent variable i.e.
years are found to be significant.
Similarly to Vadodara multiple correlation coefficients R
indicate high positive correlation (0.845) between the year and
establishment expendi ture. Value of determinant of coefficient R2
reflects 71.4 percent establishment expenditure is explained by years.
Model F-value is also found to be significant with significant
coefficient value of years.
For Ahmedabad high positive correlation found b etween year
and establishment expenditure, the value of R is 0.844. Value of
determinant of coefficient R2 reflects 71.3 percent establishment
expenditure is explained by years. Model F -value and coefficient of
years is found to be significant.
Model for prediction for establishment expenditure with year
for all three municipal corporations are as follows.
Surat: y = 10070.759 + 1699.181 (x)
Vadodara: y = 6367.927 + 1068.682 (x)
Ahmedabad: y = 23940.411 + 2092.461 (x)
Where y is establishment expenditure & x is year

Table 4.4: Trend analysis for Administrative Expense using
Regression Analysis across three Municipal
Corporations using the data for the year 1999-2000 to
2008-2009
Regression
result
Surat Vadodara Ahmedabad
R 0.962 0.726 0.861
R2 0.923 0.527 0.742
F-value 98.511 8.904 22.968
p-value 0.000* 0.017* 0.001*
Coefficient of
X (b) 856.220 95.815 151.710
p-value 0.000 0.017 0.001
Constant 3724.158 -81.060 587.595
p-value 0.000 0.695 0.017
In the above table, the model summary table reports the
strength of the relationship between the years and administrative
expense for Surat, Vadodara and Ahmedabad Municipal
Corporations.
For Surat, R the multiple correlation coefficients indicates the
linear correlation between the observed and model predicated value
of administrative expense. Here it indicates high positive correlation
(0.962) between years and administrative expense. R2 the coefficient
of determinant is square value of the multiple correlation coefficient.
It shows that in Surat, 92.3 percent of administrative expense can be

explained by years. Moreover regression model as well as coefficient
of independent variable i.e. years are found to be significant.
Similarly to Vadodara multiple correlation coefficients R
indicate high positive correlation (0.726) between the year and
administrative expense. Value of determinant of coefficient R2
reflects 52.7 percent administrative expense is explained by years.
Model F-value is also found to be significant with significant
coefficient value of years.
For Ahmedabad high positive correlation found between year
and administrative expense, the value of R is 0.861. Value of
determinant of coefficient R2 reflects 74.2 percent administrative
expense is explained by years. Model F -value and coefficient of
years is found to be significant.
Model for prediction for administrative expense with year for
all three municipal corporations are as follows.
Surat: y = 3724.158 + 856.220 (x)
Vadodara: y = -81.060 + 95.815 (x)
Ahmedabad: y = 587.595 + 151.710 (x)
Where y is administrative expense & x is year

Table 4.5: Trend analysis for Repair & Maintenance
Expenditure using Regression Analysis across three
Municipal Corporations using the data for the year
1999-2000 to 2008-2009
Regression
result
Surat Vadodara Ahmedabad
R 0.832 0.921 0.916
R2 0.693 0.848 0.839
F-value 18.032 44.652 41.622
p-value 0.003* 0.000* 0.000*
Coefficient of
X (b) 550.118 739.033 327.167
p-value 0.003 0.000 0.000
Constant 1923.994 2179.584 1064.743
p-value 0.044 0.013 0.010
In the above table, the model summary table reports the
strength of the relationship between the years and maintenance
expenditure for Surat, Vadodara and Ahmedabad Municipal
Corporations.
For Surat, R the multiple correlation coefficients indicates the
linear correlation between the observed and model predicated value
of maintenance expenditure. Here it indicates high positive
correlation (0.832) between years and maintenance expenditure. R2
the coefficient of determinant is square value of the multiple
correlation coefficient. It shows that in Surat, 69.3 percent of

maintenance expenditure can be explained by years. Moreover
regression model as well as coefficient of independent variable i.e.
years are found to be significant.
Similarly to Vadodara multiple correlation coefficients R
indicate high positive correlation (0.921) between the year and
maintenance expenditure. Value of determinant of coefficient R2
reflects 84.8 percent maintenance expenditure is explained by years.
Model F-value is also found to be significant with significant
coefficient value of years.
For Ahmedabad high positive correlation found between year
and maintenance expenditure, the value of R is 0.916. Value of
determinant of coefficient R2 reflects 83.9 percent maintenance
expenditure is explained by years. Model F -value and coefficient of
years is found to be significant.
Model for prediction for maintenance expenditure with year for
all three municipal corporations are as follows.
Surat: y = 1923.994 + 550.118 (x)
Vadodara: y = 2179.584 + 739.033 (x)
Ahmedabad: y = 1064.743 + 327.167 (x)
Where y is maintenance expenditure & x is year

Table 4.6: Trend analysis for Direct Expenditure for Service
& Programs using Regression Analysis across three
Municipal Corporations using the data for the year
1999-2000 to 2008-2009
Regression
result
Surat Vadodara Ahmedabad
R 0.963 0.863 0.927
R2 0.927 0.745 0.859
F-value 101.763 23.391 48.800
p-value 0.000* 0.001* 0.000*
Coefficient of
X (b) 385.670 294.602 411.857
p-value 0.000 0.001 0.000
Constant 254.761 2184.386 248.062
p-value 0.314 0.000 0.517
In the above table, the model summary table reports the
strength of the relationship between the years and direct expenditure
for Surat, Vadodara and Ahmedabad Municipal Corporations.
For Surat, R the multiple correlation coefficients indicates the
linear correlation between the observed and model predicated value
of direct expenditure. Here it indicates high positive correlation
(0.963) between years and direct expenditure. R2 the coefficient of
determinant is square value of the multiple correlation coefficient. It
shows that in Surat, 92.7 percent of direct expenditure can be

explained by years. Moreover regression model as well as coefficient
of independent variable i.e. years is found to be significant.
Similarly to Vadodara multiple correlation coefficients R
indicate high positive correlation (0.86.3) between the year and
direct expenditure. Value of determinant of coefficient R2 reflects
74.5 percent direct expenditure is explained by years. Model F -value
is also found to be significant with significant coefficient value of
years.
For Ahmedabad high positive correlation found between year
and direct expenditure, the value of R is 0.927. Value of dete rminant
of coefficient R2 reflects 85.9 percent direct expenditure is explained
by years. Model F-value and coefficient of years is found to be
significant.
Model for prediction for direct expenditure with year for all
three municipal corporations are as follows.
Surat: y = 254.761 + 385.670 (x)
Vadodara: y = 2184.386 + 294.602 (x)
Ahmedabad: y = 248.062 + 411.857 (x)
Where y is direct expenditure & x is year

Table 4.7: Trend analysis for Other Expense using Regression
Analysis across three Municipal Corporations using
the data for the year 1999-2000 to 2008-2009
Regression
result
Surat Vadodara Ahmedabad
R 0.872 0.555 0.118
R2 0.760 0.308 0.014
F-value 25.365 3.561 0.113
p-value 0.001* 0.096 0.745
Coefficient of
X (b) 177.449 9.463 2.408
p-value 0.001 0.096 0.745
Constant 931.810 -25.202 80.767
p-value 0.003 0.441 0.107
In the above table, the model summary table reports the
strength of the relationship between the years and direct expenditure
for Surat, Vadodara and Ahmedabad Municipa l Corporations.
For Surat, R the multiple correlation coefficients indicates the
linear correlation between the observed and model predicated value
of other expense. Here it indicates high positive correlation (0.872)
between years and other expense. R2 the coefficient of determinant is
square value of the multiple correlation coefficient. It shows that in
Surat, 76.0 percent of other expense can be explained by years.
Moreover regression model as well as coefficient of independent
variable i.e. years is found to be significant.

Similarly to Vadodara multiple correlation coefficients R
indicate positive correlation (0.555) between the year and other
expense. Value of determinant of coefficient R2 reflects 30.8 percent
direct expenditure is explained by years. Model F-value is not found
to be significant with non-significant coefficient value of years.
For Ahmedabad non-significant correlation found between year
and other expense, the value of R is 0.118 which is not significant.
Value of determinant of coefficient R2 reflects only 1.4 percent other
expense is explained by years. Model F -value and coefficient of
years is not found to be significant.
Model for prediction for other expense with year for all three
municipal corporations are as follows.
Surat: y = 931.810 + 177.449 (x)
Vadodara: y = -25.202 + 9.463 (x)
Ahmedabad: y = 80.767 + 2.408 (x)
Where y is other expense & x is year

Table 4.8: Trend analysis for Income over Expenditure using
Regression Analysis across three Municipal
Corporations using the data for the year 1999-2000 to
2008-2009
Regression
result
Surat Vadodara Ahmedabad
R 0.993 0.867 0.944
R2 0.986 0.751 0.891
F-value 571.055 24.142 65.333
p-value 0.000* 0.001* 0.000*
Coefficient of
X (b) 4680.206 1711.928 6408.471
p-value 0.000 0.001 0.000
Constant 6864.562 -2886.277 -5891.570
p-value 0.000 0.219 0.265
In the above table, the model summary table reports the
strength of the relationship between the years and income over
expenditure for Surat, Vadodara and Ahmedabad Municipal
Corporations.
For Surat, R the multiple correlation coefficients indicates the
linear correlation between the observed and model predicated value
of income over expenditure. Here it indicates high positive
correlation (0.993) between years and income over expenditure. R2
the coefficient of determinant is square value of the multiple
correlation coefficient. It shows that in Surat, 98.6 percent of income
over expenditure can be explained by years. Moreover regression

model as well as coefficient of independent variable i.e. years is
found to be significant.
Similarly to Vadodara multiple correlation coefficients R
indicate high positive correlation (0.867) between the year and
income over expenditure. Value of determinant of coefficient R2
reflects 75.1 percent income over expenditure is explained by years.
Model F-value is also found to be significant with significant
coefficient value of years.
For Ahmedabad high positive correlation found between year
and income over expenditure, the value o f R is 0.944. Value of
determinant of coefficient R2 reflects 89.1 percent income over
expenditure is explained by years. Model F -value and coefficient of
years is found to be significant.
Model for prediction for income over expenditure with year for
all three municipal corporations are as follows.
Surat: y = 6864.562 + 4680.206 (x)
Vadodara: y = -2886.277 + 1711.928 (x)
Ahmedabad: y = -5891.570 + 6408.471 (x)
Where y is income over expenditure & x is year

Table 4.9: Trend analysis for Financial Expense using
Regression Analysis across three Municipal
Corporations using the data for the year 1999-2000 to
2008-2009
Regression
result
Surat Vadodara Ahmedabad
R 0.985 0.983 0.524
R2 0.970 0.965 0.275
F-value 114.803 97.797 1.326
p-value 0.000* 0.000* 0.325
Coefficient of
X (b1) 0.003 0.150 -0.005
p-value 0.652 0.000 0.921
Coefficient of
X (b2) 0.109 -0.051 0.116
p-value 0.000 0.372 0.149
Constant 249.159 38.711 8633.834
p-value 0.056 0.617 0.165
b1:Total Loan, b2: Secured Loan
The above regression indicates the prediction of financial
charges by taking the total loan and secured loan as a effective
variables during the ten years of period from 1999 -2000 to 2008-
2009 for all the municipal corporations.

For Surat multiple correlations (0.985) indicate high linearity
between the financial charges and total loan and secured loan. To
gather financial charges can be explained 97.0 percent for Surat.
With high positive correlation (0.983) in Vadodara there exists high
correlation between f inancial charges and total loan and secured loan
during the defined period. Using the result it can be seen that 96.5
percent financial charges has been explained due to loan and secured
loan.
Specifically for Ahmedabad correlation between financial
charges and loan and secured loan is found to be 0.524, which
indicates that there is no strong relationship between them. Even the
regression model is not found to be significant. Only 27.5 percent
financial charges is explained by total loan and secured loan .
Model for prediction for financial charges due to total loan
and secured loan for all three municipal corporations are as follows.
Surat: y = + (x)
Vadodara: y = + (x)
Ahmedabad: y = + (x)
Where y is financial expense, x1 is total loan & x2 is s ecured
loan