Embed Size (px)
Citation preview
1
AFRICA ISRAEL INVESTMENTS LTD.
March 21, 2013
Report of the Board of Directors
for the Period from January to December 2012
Chapter A – The Directors’ Explanations of the State of the Company’s
Affairs
1. General
Africa Israel Investments Ltd. (hereinafter, ―the Company‖), through its subsidiaries and
associated companies (hereinafter, ―the Group‖), is an investment company operating in
various areas of activities, primarily in real estate development and its synergetic areas, in
several major geographic regions: the CIS, Eastern Europe, the USA, and Israel. The
Company’s business policy is based on investment planning, identification of business
opportunities, entrepreneurship, and management at a high standard.
The following table summarizes the Company main data as presented in its consolidated
financial statements (in NIS millions):
For year For year For year
ending ending ending
December 31, December 31, December 31,
1021 1022 1020
Income (Loss) from operations
before financing (020) 29241 29211
Financing income, net (231) (333) (300)
Profit from the Arrangement
with the bondholders 29100
Profit (Loss) for the period, net (29341) 130 29332
Profit (Loss) attributed to
Company shareholders, net (29003) 324 29203
As at
December 31, 2012
As at
December 31, 2011
As at
December 31, 2010
Total balance sheet
119102 109140 119103
Equity attributed to Company
shareholders 39213 19001 39010
2
The following revaluations/depreciations were recorded in 2012:
In 2012, the Company recorded net depreciation of NIS 1,108 million (of which, NIS 21 million
in respect of appreciation recorded in the fourth quarter of 2012). The depreciations stemmed
from the following reasons:
(a) Decline in fair value of investment property under construction in the amount of NIS 835
million (of which, NIS 40 million recorded in the fourth quarter of 2012), stemming mainly
from a decline in the fair value of four AFI Development projects involving real estate
development and rental properties in the CIS due to changes in municipal planning policies and
development policies of Moscow municipality;
(b) Revaluation of a provision for impairment of inventory of building and land, especially in
AFI Development, in the amount of NIS 266 million (NIS 14 million in respect of recovered
value recorded in the fourth quarter of 2012), stemming mainly from a depreciation of land in an
AFI Development projects resulting from a liquidation suit filed against the project’s primary
investor;
(c) Net decline in the fair value of investment property in the amount of NIS 21 million (of
which, a depreciation in the amount of NIS 20 million was recorded in the fourth quarter of
2012);
(d) Revaluation gains from associated companies item in the amount of NIS 143 million of
which, NIS 98 was recorded as revaluation gains in the fourth quarter of 2012), stemming
mainly from the revaluation of the Times Building in the USA and revaluation of investment
property in AFI Development’s Four Winds project (a property whose sale was concluded after
the date of the statement of financial position);
(e) Depreciation of associated companies, which was recorded in other expenses, in the amount
of NIS 128 million (of which a decline in value in the amount of NIS 31 million was recorded in
the fourth quarter of 2012), stemming mainly from a depreciation of Africa Properties in respect
of an associated company in Poland in the amount of NIS 97 million in the third quarter of 2012.
The following revaluations/depreciations were recorded in 2011:
In 2011, the Company recorded a net appreciation of NIS 1,262 million (of which, revaluation
of NIS 376 million was recorded in the fourth quarter of 2011). The appreciation stemmed
mainly from the following reasons:
(a) Revaluation in respect of investment property in the amount of NIS 856 million (of which,
NIS 166 million was recorded in the fourth quarter of 2011);
(B) Revaluation of investment property under construction of NIS 65 million (of which, NIS 74
million was recorded in the fourth quarter of 2011);
(c) Revaluation gains from associated companies in the amount of NIS 290 million (of which,
NIS 117 million were recorded as revaluation gains in the fourth quarter of 2012);
(d) Elimination of a provision for impairment mainly in a residential project in the United States,
in the amount of NIS 82 million (of which NIS 21 million was recorded in the fourth quarter of
3
2011) less a deduction for impairment of NIS 20 million stemming from a provision recorded
for loss on an investment in a jointly controlled company presented at book value and recorded
in the fourth quarter of 2011.
2. The Group’s Segments of Operation
Through its subsidiaries and associated companies (above and hereinafter, ―the Group‖), the
Company is engaged in holdings and investments in a variety of areas in and outside of Israel.
The Company’s main operations are the development and construction of real estate projects
designated for residential, industrial, office, and commercial uses, where the Company focuses
on the rental and operation of non-residential projects after construction has been completed.
The Group operates mainly in the CIS (mainly in Russia), Eastern Europe, the USA, and Israel.
The Company also has operations in areas that are synergetic with its real estate operations,
such as operations in the sector of construction contracting and infrastructure contracting, and
operations in the steel (in Israel) and ceramics sectors.
The Company has four publicly traded subsidiaries, and one publicly traded subsidiary listed on
the London Stock Exchange.
The Group has 10 activity sectors that are reported as primary operating segments in the
Company’s Financial Statements, as described below:
a. Real estate development in Israel;
b. Rental properties in Israel;
c. Development of real estate and rental properties in Europe – Central and Eastern Europe;
d. Development of real estate and rental properties in the USA;
e. Development of real estate and rental properties in the CIS;
f. Construction contracting;
g. Infrastructure contracting;
h. Steel in Israel;
i. Steel in Russia1;
j. Ceramics.
In addition to the segments of operation listed above, the Group operates in the hotel industry
and in the communications industry (Channel 9). These operations do not constitute a segment
of operations due to their limited scope. The Group performs various other activities through
associated companies:
1 Until December 6, 2012, the Group was also active in the steel industry in Russia. In view of the conclusion of Africa
Industries’ holdings (65%) in its subsidiary on December 6, 2012, as stated in Section 15.1(A) to the Description of the
Company’s Business, the steel sector in Russia is presented in the Company’s financial statements as at December 31, 2012
as a discontinued operation.
4
The following table summarizes the percentage holdings of the Company in the Group’s public
companies on March 21, 2013:1
Company Percentage holding
(March 21, 2013)
Africa Development (AFID) 68.44%
Africa Properties 66...%
Danya Cebus 48.46%
Africa Residences2 56.66%
Africa Industries3 56.6.%
3. Analysis of the Financial Position
3.1 Following are material data from equity items (in NIS million):
1 In 2012, the Company sold its entire holding in Alon USA Energy Inc., a foreign company whose shares are listed
for trade on the New York Stock Exchange, for a total consideration of NIS 178 million (of which NIS 119 million
were received in the third quarter of 2012). As a result of the sale, the Company recorded a gain of NIS 56 million (of
which NIS million were recorded in the third quarter of 2012). 2
The percentage holding relates to the holdings of Danya Cebus in this company. 3 Africa Industries holds 100% of the equity and voting rights in Negev Ceramics, which was, until February 2012, a
public company on the Stock Exchange whose shares were listed on the Tel-Aviv Stock Exchange.
December 31,
2012
December 31,
2011
Total statement of financial position 24,607 25,695
Equity attributed to the Company’s shareholders 3,768 4,506
Non-controlling interests 3,744 4,306
Total equity 7,512 8,812
Property, plant, and equipment 1,055 908
Investment property 9,919 9,074
Investment property under construction 2,896 3,903
Real estate inventory 1,472 2,175
Investments in investees 859 1,370
Loans to investees 793 640
Long-term loans, investments, and debt balances 136 123
Other non-current assets 234 278
Cash and cash equivalents 1,747 1,026
Assets held for sale 531 124
Other current assets 4,962 6,074
Long-term liabilities 10,645 10,859
Short-term credit from banks and others 2,461 2,579
Bonds presented in current liabilities 641 204
Other liabilities 3,348 3,240
5
3.2 Liquidity
The sources of the Company’s liquidity are mainly dividends and debt repayments from the
Group’s companies, as well as from raising loans, bond issues, sales of holdings in investees,
and raising share capital. The liquidity sources of the Group’s companies are cash deriving
from inter alia their rental properties, sales of apartments, income from operations, sale and
disposal of assets and/or holdings in assets, credit lines, long-term loans, and raising share
capital. These sources are used to purchase and develop properties and land, discharge
liabilities, invest in associated companies, and make other long-term investments. As at
December 31, 2012, the Group’s liquid balances, including short-term investments, totaled
NIS 2,408 million, compared with NIS 1,653 million as at December 31, 2011. The increase
in liquid balances as at December 31, 2012 compared to December 31, 2011 stems mainly
from an increase in cash balances, resulting from proceeds from a right issue and sale of
property in the USA, Israel, and Russia. Proceeds from the sale of property in the USA and
Israel and from the rights issue in April 2012 increased the Company’s cash balances in the
Company’s extended solo financial statement (in the matter of the extended solo financial
statement, also see Section 5.3 hereinafter). As at December 31, 2012, the liquid balances in
the Company’s extended solo financial statements totaled NIS 747 million, compared to NIS
311 million as at December 31, 2011.
The aggregate market value of the Company’s holdings in shares of its public subsidiaries,
as at March 19, 2013, is NIS 3 billion. In the Arrangement with the Company’s bondholders,
the Company created a lien on part of its holdings in Africa Properties (51%) and in AFI
Development (24.17%). The value of the pledged holdings at March 19, 2013 is NIS 1.2
billion.
3.3 Current assets
The balance of current assets as at December 31, 2012 is NIS 7.2 billion, unchanged from
the balance as at December 31, 2011. The change in the composition of current assets as at
December 31, 2012, compared to December 31, 2011 stems mainly from a decrease in
inventory of buildings for sale, resulting from the sale of property, mainly the Clock Tower
in the USA, and, on the other hand, an increase in the Group’s liquid balances resulting from
proceeds from the sale of properties stated in Section 3.2 hereinabove.
3.4 Investment property, investment property under construction
A. The balance of investment property under construction as at December 31, 2012 is
NIS 2.9 billion, compared with NIS 3.9 billion as at December 31, 2011. The change
in the reporting period was mainly due to the following reasons:
(1) A decrease resulting from impairment of investment property under
construction in the amount of NIS 835 million (of which, an impairment loss of
NIS 40million was recorded in the fourth quarter of 2012), stemming mainly
6
from a decrease in AFI Development’s rights in four projects in Russia due to
changes in the municipal planning policy and development policy of Moscow
municipality. For additional details, also see Section 4.3.2 hereinafter.
(2) A decrease resulting from the first-time classification in the second quarter of
2012, of the Tverskaya Plaza II and Tverskaya Plaza Ib projects, from
investment property under construction to investment property, in the amount
of NIS 159 million in total. For additional information see Note 7(A)(2)(C) of
the Company’s Financial Statements as at December 31, 2012.
(3) A decrease following the first-time classification to investment property
performed by Africa Properties of an office building adjacent to the AFI Palace
Cotroceni mall in Bucharest, stage B of Classic 7 project in Prague, and the
Beit Psagot House project in Tel Aviv (following construction completion in
the reporting period), of a total amount of NIS 251 million;
(4) Increase following additional costs invested in 2012 in the amount of NIS 240
million, mainly in respect of AFI Europe’s projects and AFI Development’s
projects.
B. The balance of investment property as at December 31, 2012 totaled NIS 9.9 billion,
compared to NIS 9.1 billion as at December 31, 2011. The change from December
31, 2011 to December 31, 2012 stemmed mainly from the following reasons:
(1) A decrease due to impairment of investment property in the amount of NIS 21
million (of which, an impairment loss in the amount of NIS 20 million was
recorded in the fourth quarter of 2012).
(2) An increase due to the first-time classification, in the second quarter of 2012,
from investment property under construction to investment property of the
Tverskaya Plaza II and Tverskaya Plaza Ib projects in the total amount of NIS
159 million. For additional information see Note 7(A)(2)(B) of the Company’s
Financial Statements as at December 31, 2012.
(3) An increase following the first-time classification from investment property
under construction to investment property of an office building adjacent to the
AFI Palace Cotroceni mall in Bucharest, stage B of Classic 7 project in Prague,
and the Beit Psagot House project in Tel Aviv (following construction
completion in the reporting period), of a total amount of NIS 251 million.
(4) An increase following the first-time consolidation of real estate properties in
Germany owned by AFI Europe in the amount of NIS 480 million.
(5) An increase following the strengthening of the euro and the ruble relative to the
shekel in the reporting period in the amount of NIS 43 million.
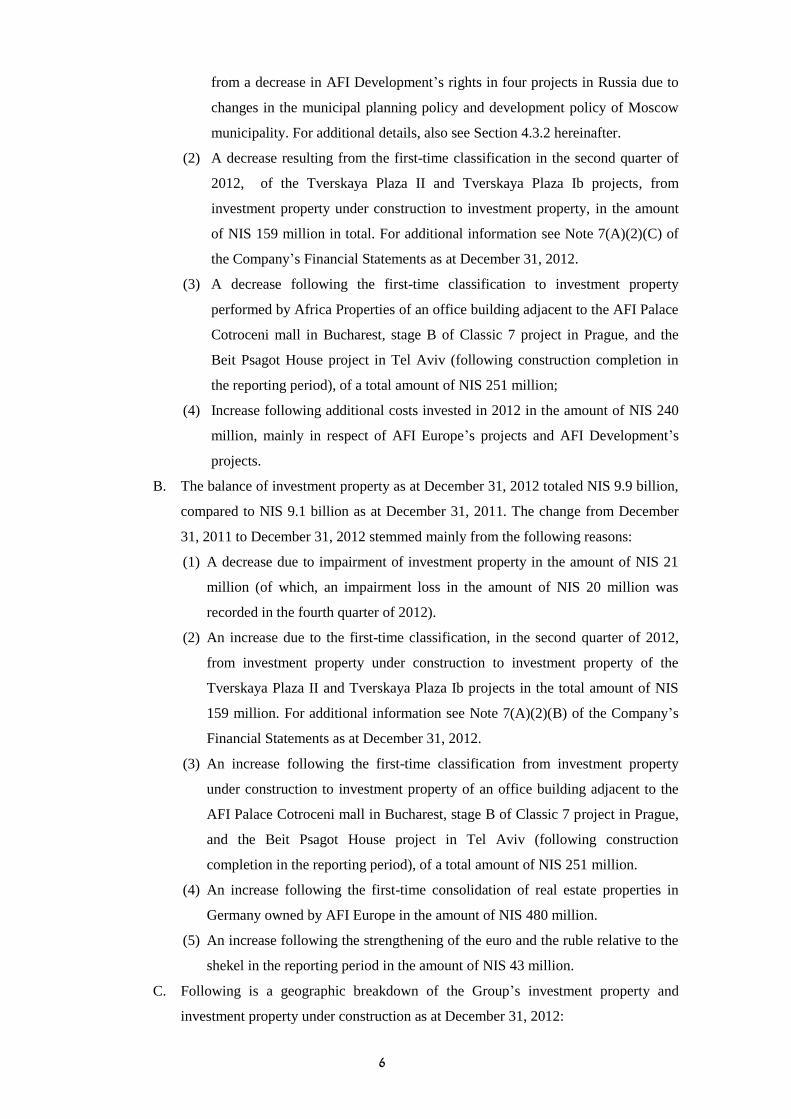
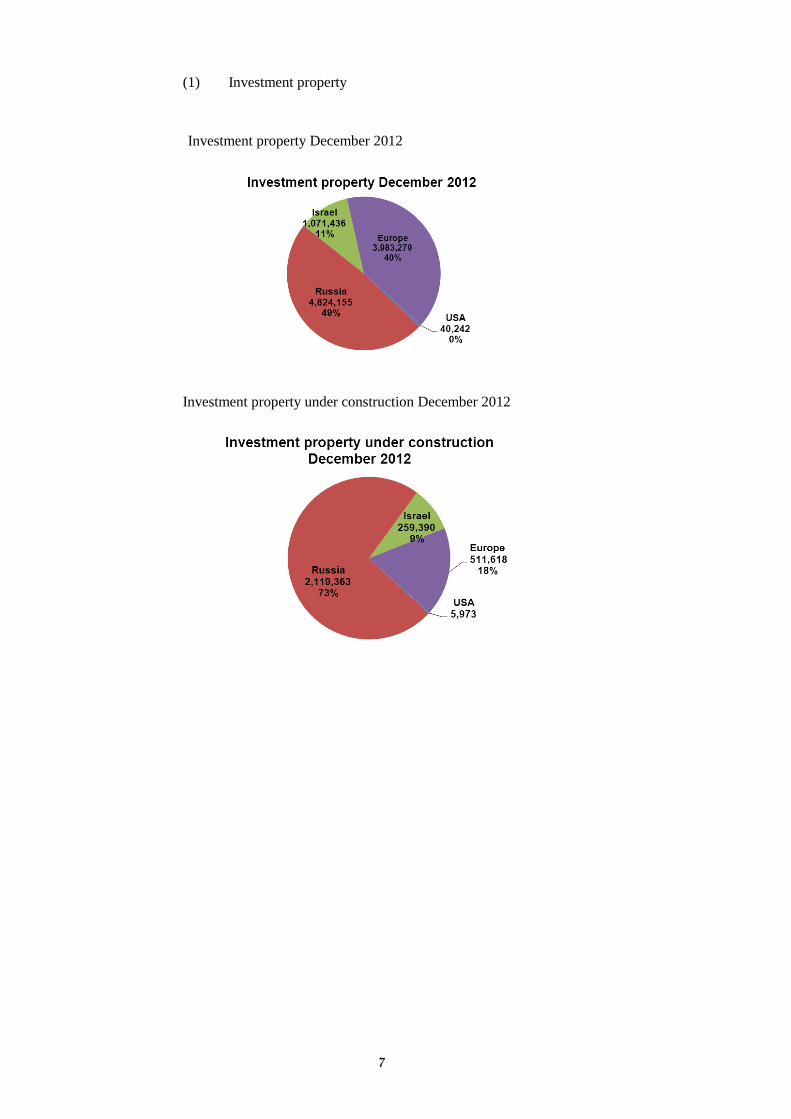
C. Following is a geographic breakdown of the Group’s investment property and
investment property under construction as at December 31, 2012:
7
(1) Investment property
Investment property December 2012
Investment property under construction December 2012
8
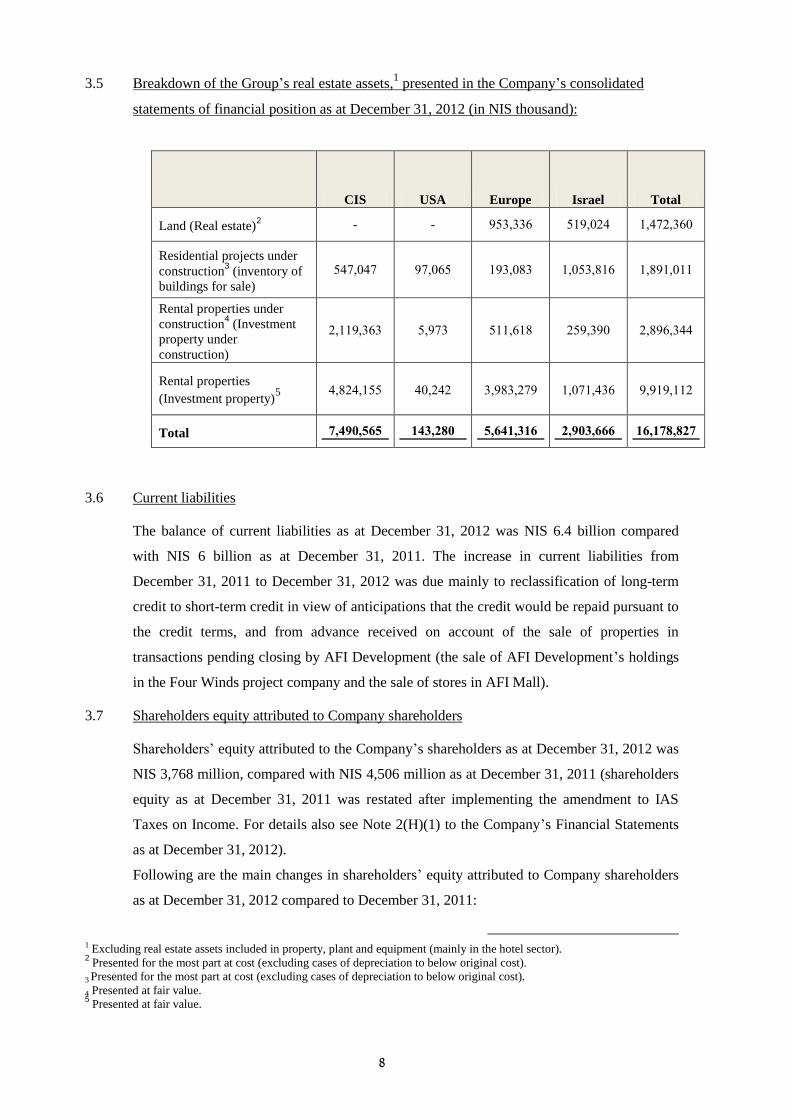
3.5 Breakdown of the Group’s real estate assets,1 presented in the Company’s consolidated
statements of financial position as at December 31, 2012 (in NIS thousand):
CIS USA Europe Israel Total
Land (Real estate)2 - - 666,666 686,.18 8,851,66.
Residential projects under
construction3 (inventory of
buildings for sale)
685,.85 65,.66 866,.46 8,.66,486 8,468,.88
Rental properties under
construction4 (Investment
property under
construction)
1,886,666 6,656 688,684 166,66. 1,466,688
Rental properties
(Investment property)5
8,418,866 8.,181 6,646,156 8,.58,866 6,686,881
Total 291409010 2139130 091129321 194039111 2192239312
3.6 Current liabilities
The balance of current liabilities as at December 31, 2012 was NIS 6.4 billion compared
with NIS 6 billion as at December 31, 2011. The increase in current liabilities from
December 31, 2011 to December 31, 2012 was due mainly to reclassification of long-term
credit to short-term credit in view of anticipations that the credit would be repaid pursuant to
the credit terms, and from advance received on account of the sale of properties in
transactions pending closing by AFI Development (the sale of AFI Development’s holdings
in the Four Winds project company and the sale of stores in AFI Mall).
3.7 Shareholders equity attributed to Company shareholders
Shareholders’ equity attributed to the Company’s shareholders as at December 31, 2012 was
NIS 3,768 million, compared with NIS 4,506 million as at December 31, 2011 (shareholders
equity as at December 31, 2011 was restated after implementing the amendment to IAS
Taxes on Income. For details also see Note 2(H)(1) to the Company’s Financial Statements
as at December 31, 2012).
Following are the main changes in shareholders’ equity attributed to Company shareholders
as at December 31, 2012 compared to December 31, 2011:
1 Excluding real estate assets included in property, plant and equipment (mainly in the hotel sector). 2 Presented for the most part at cost (excluding cases of depreciation to below original cost).
3 Presented for the most part at cost (excluding cases of depreciation to below original cost).
4 Presented at fair value. 5 Presented at fair value.
9
The Company’s loss in 2012 totaled NIS 1,003 million.
Increase of NIS 15 million in capital reserves from translation differences
(adjustments stemming from the translation of financial statements of foreign
operations).
Net proceeds of NIS 213 million from a rights issue the Company made in April
2012.
Increase in net capital reserves from transactions with non-controlling interests in the
amount of NIS 38 million, reflecting mainly the difference between the
consideration paid in respect of AFI Development shares and Danya Cebus shares
(for additional details see Note 6(C)(2)(3) to the Company’s Financial Statements as
at December 31, 2012) and the decrease in non-controlling interests.
Shareholders’ equity per share (including non-controlling interests) as at December 31, 2012
was NIS 51.17 compared with NIS 67.37 per share as at December 31, 2011.
Shareholders’ equity per share (excluding non-controlling interests) as at December 31, 2012
was NIS 25.62 compared with NIS 34.45 per share as at December 31, 2011.
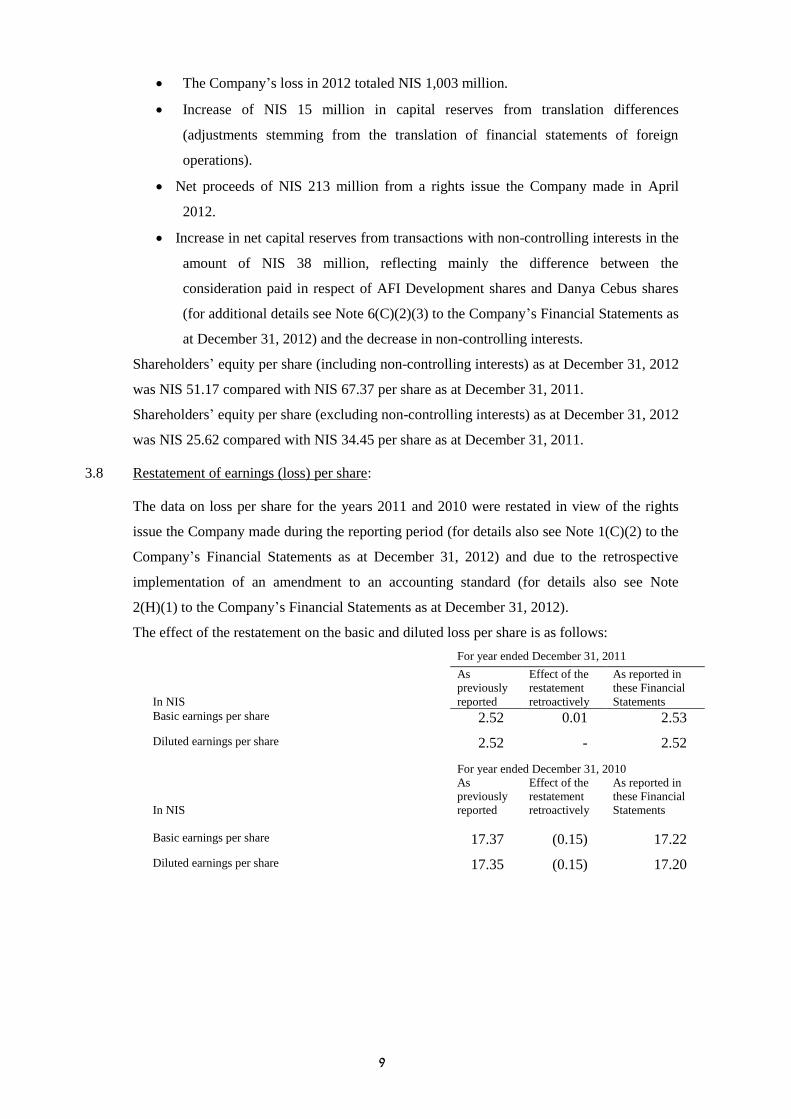
3.8 Restatement of earnings (loss) per share:
The data on loss per share for the years 2011 and 2010 were restated in view of the rights
issue the Company made during the reporting period (for details also see Note 1(C)(2) to the
Company’s Financial Statements as at December 31, 2012) and due to the retrospective
implementation of an amendment to an accounting standard (for details also see Note
2(H)(1) to the Company’s Financial Statements as at December 31, 2012).
The effect of the restatement on the basic and diluted loss per share is as follows:
For year ended December 31, 2011
In NIS
As
previously
reported
Effect of the
restatement
retroactively
As reported in
these Financial
Statements
Basic earnings per share 2.52 0.01 2.53
Diluted earnings per share 2.52 - 2.52
For year ended December 31, 2010
In NIS
As
previously
reported
Effect of the
restatement
retroactively
As reported in
these Financial
Statements
Basic earnings per share 17.37 (0.15) 17.22
Diluted earnings per share 17.35 (0.15) 17.20
11
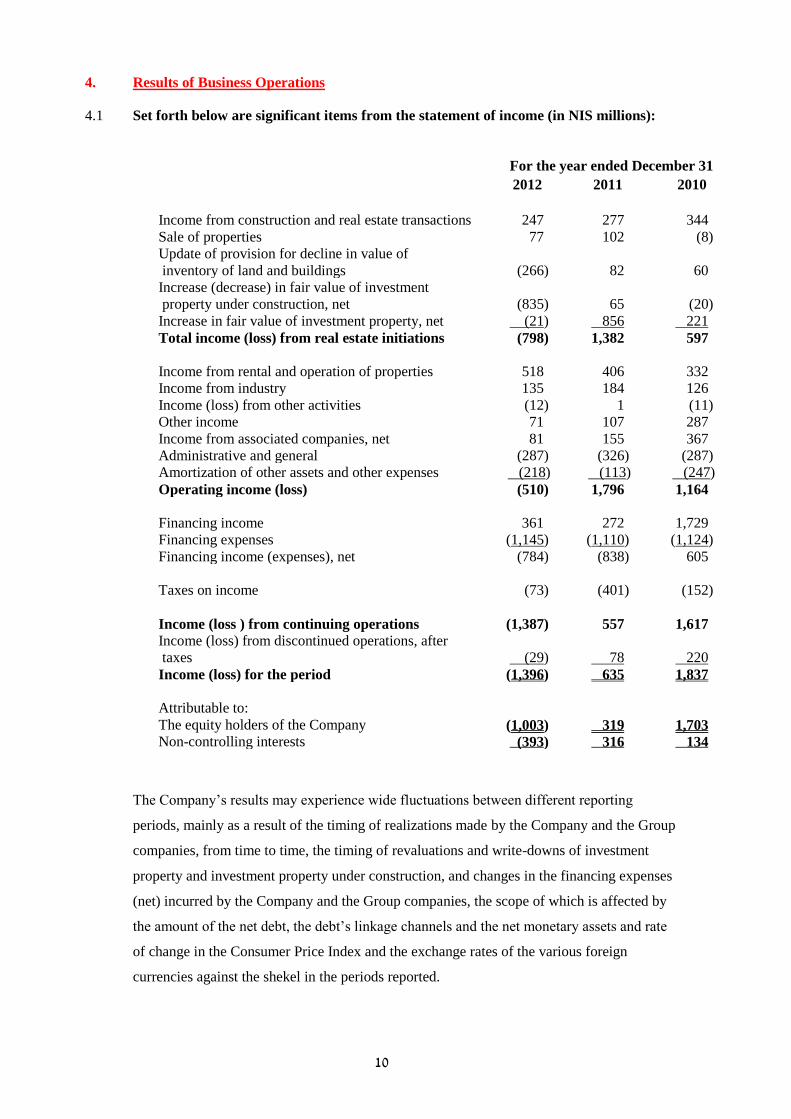
4. Results of Business Operations
4.1 Set forth below are significant items from the statement of income (in NIS millions):
For the year ended December 31
2012 2011 2010
Income from construction and real estate transactions 247 277 344
Sale of properties 77 102 (8)
Update of provision for decline in value of
inventory of land and buildings (266) 82 60
Increase (decrease) in fair value of investment
property under construction, net (835) 65 (20)
Increase in fair value of investment property, net (21) 856 221
Total income (loss) from real estate initiations (798) 1,382 597
Income from rental and operation of properties 518 406 332
Income from industry 135 184 126
Income (loss) from other activities (12) 1 (11)
Other income 71 107 287
Income from associated companies, net 81 155 367
Administrative and general (287) (326) (287)
Amortization of other assets and other expenses (218) (113) (247)
Operating income (loss) (510) 1,796 1,164
Financing income 361 272 1,729
Financing expenses (1,145) (1,110) (1,124)
Financing income (expenses), net (784) (838) 605
Taxes on income (73) (401) (152)
Income (loss ) from continuing operations (1,387) 557 1,617
Income (loss) from discontinued operations, after
taxes (29) 78 220
Income (loss) for the period (1,396) 635 1,837
Attributable to:
The equity holders of the Company (1,003) 319 1,703
Non-controlling interests (393) 316 134
The Company’s results may experience wide fluctuations between different reporting
periods, mainly as a result of the timing of realizations made by the Company and the Group
companies, from time to time, the timing of revaluations and write-downs of investment
property and investment property under construction, and changes in the financing expenses
(net) incurred by the Company and the Group companies, the scope of which is affected by
the amount of the net debt, the debt’s linkage channels and the net monetary assets and rate
of change in the Consumer Price Index and the exchange rates of the various foreign
currencies against the shekel in the periods reported.
11
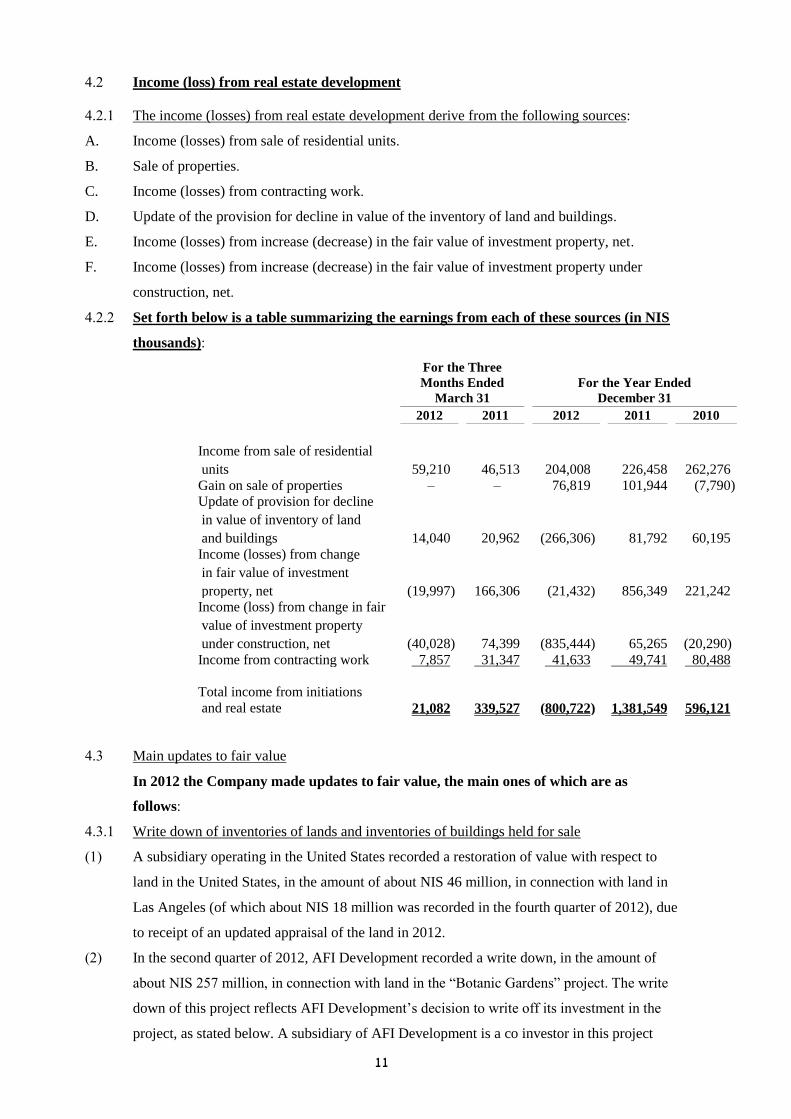
8.1 Income (loss) from real estate development
8.1.8 The income (losses) from real estate development derive from the following sources:
A. Income (losses) from sale of residential units.
B. Sale of properties.
C. Income (losses) from contracting work.
D. Update of the provision for decline in value of the inventory of land and buildings.
E. Income (losses) from increase (decrease) in the fair value of investment property, net.
F. Income (losses) from increase (decrease) in the fair value of investment property under
construction, net.
8.1.1 Set forth below is a table summarizing the earnings from each of these sources (in NIS
thousands):
For the Three
Months Ended For the Year Ended
March 31 December 31
2012 2011 2012 2011 2010
Income from sale of residential units 59,210 46,513 204,008 226,458 262,276 Gain on sale of properties – – 76,819 101,944 (7,790) Update of provision for decline in value of inventory of land and buildings 14,040 20,962 (266,306) 81,792 60,195 Income (losses) from change in fair value of investment property, net (19,997) 166,306 (21,432) 856,349 221,242 Income (loss) from change in fair value of investment property under construction, net (40,028) 74,399 (835,444) 65,265 (20,290) Income from contracting work 7,857 31,347 41,633 49,741 80,488
Total income from initiations
and real estate 21,082 339,527 )800,722( 1,381,549 596,121
8.6 Main updates to fair value
In 2012 the Company made updates to fair value, the main ones of which are as
follows:
8.6.8 Write down of inventories of lands and inventories of buildings held for sale
(8) A subsidiary operating in the United States recorded a restoration of value with respect to
land in the United States, in the amount of about NIS 46 million, in connection with land in
Las Angeles (of which about NIS 18 million was recorded in the fourth quarter of 2012), due
to receipt of an updated appraisal of the land in 2012.
(1) In the second quarter of 2012, AFI Development recorded a write down, in the amount of
about NIS 257 million, in connection with land in the ―Botanic Gardens‖ project. The write
down of this project reflects AFI Development’s decision to write off its investment in the
project, as stated below. A subsidiary of AFI Development is a co investor in this project
12
together with a private company wholly owned by the City of Moscow, which is the main
investor in the project (hereinafter – ―the Main Investor‖), and which is entitled under the
investment agreement with the City of Moscow to receive the lease rights therein. On
August 2, 2012, a request was filed in the Court in Moscow on behalf of a third party
creditor to declare that the Main Investor is bankrupt, further to a foreclosure imposed on its
assets in favor of that creditor. AFI Development estimates, based on an outside legal
opinion, that the chances of recovering its investments in this project are not probable.
Taking into account the circumstances of the matter, AFI Development decided to write off
its investment in this project in its financial statements for the second quarter of 2012.
Nonetheless, AFI Development announced its intention to continue the efforts to recover its
investments in this project and/or to receive the development rights therein. On February 5,
2013, AFI Development announced that further to contacts it carried on with the City, the
parties signed an addendum to the investment agreement (hereinafter – ―the Addendum‖)
whereby the rights of AFI Development in the project were recognized (through a wholly
controlled subsidiary, hereafter – ―the Project Company‖). Pursuant to the Addendum, the
Main Investor will have no contentions with respect to the AFI Development’s investments
in the project and the Project Company will become the sole investor in the project pursuant
to the investment agreement. Further to this, the City approved assignment of the short term
lease agreement covering the project’s lands from the name of the Main Investor to the name
of the Project Company. After an in depth evaluation of the risks to the rights of the Project
Company in the project, against the background of the insolvency of the Main Investor, the
Project Company decided to make the required payments to the City pursuant to the
Addendum in exchange for additional development rights. The total payments under the
Addendum amount to about US$18.5 million, which were paid in a number of installments.
The decision was made on the basis of the opinion of AFI Development’s outside legal
advisors, whereby in a case where the Addendum is declared null and void or is cancelled
(due to claims of creditors of the Main Investor), the Project Company will be entitled to
return of the amounts paid to the City of Moscow. In light of maintenance of the insolvency
proceedings, and based on an opinion of AFI Development’s outside legal advisors, there is
uncertainty regarding the period of the Addendum and/or the possibility of maintaining
grounds for its cancellation. Due to that stated above, at this stage the provision recorded, as
stated above, with respect to write off of the investment in the project, was not cancelled.
(6) In the third quarter of 2012, AFI Europe made a write down for decline in value of an
inventory of lands relating to projects in Romania, in the aggregate amount of NIS 54
million.
8.6.1 Write down of investment property under construction
(8) In the second quarter of 2012, AFI Development recorded a decline in fair value, in the
amount of about NIS 282 million, in respect of the Putchotovo project. During 2012, the
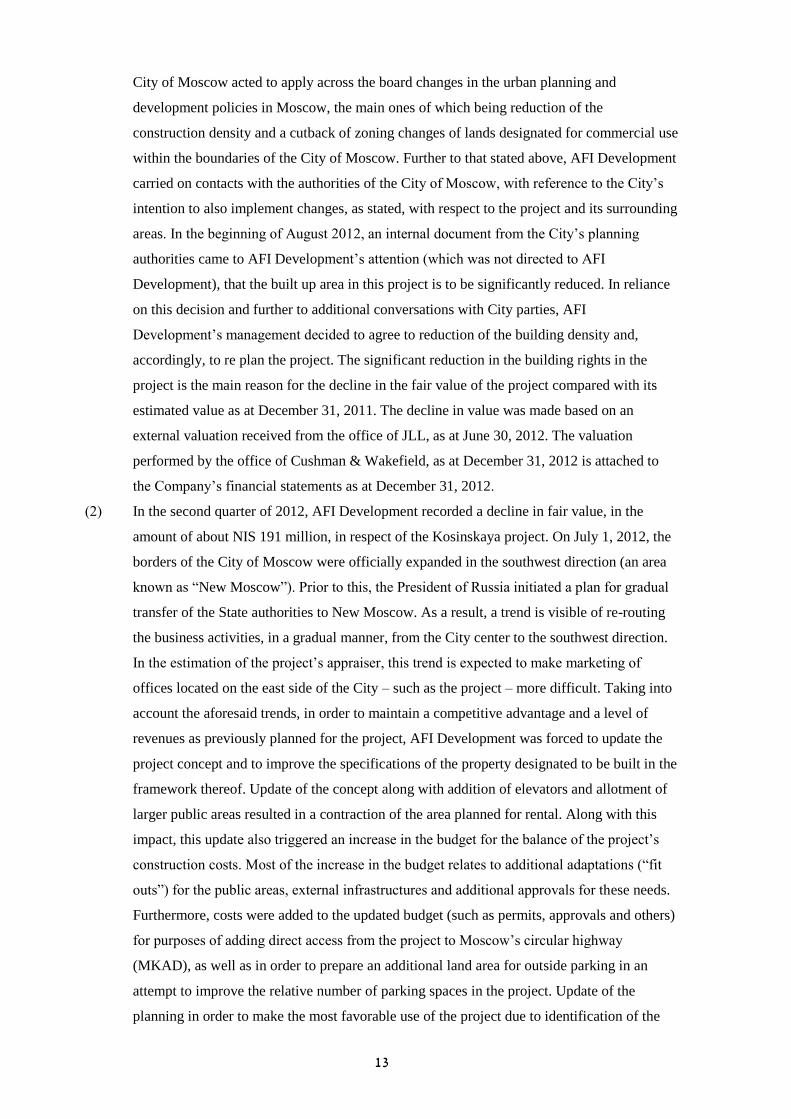
13
City of Moscow acted to apply across the board changes in the urban planning and
development policies in Moscow, the main ones of which being reduction of the
construction density and a cutback of zoning changes of lands designated for commercial use
within the boundaries of the City of Moscow. Further to that stated above, AFI Development
carried on contacts with the authorities of the City of Moscow, with reference to the City’s
intention to also implement changes, as stated, with respect to the project and its surrounding
areas. In the beginning of August 2012, an internal document from the City’s planning
authorities came to AFI Development’s attention (which was not directed to AFI
Development), that the built up area in this project is to be significantly reduced. In reliance
on this decision and further to additional conversations with City parties, AFI
Development’s management decided to agree to reduction of the building density and,
accordingly, to re plan the project. The significant reduction in the building rights in the
project is the main reason for the decline in the fair value of the project compared with its
estimated value as at December 31, 2011. The decline in value was made based on an
external valuation received from the office of JLL, as at June 30, 2012. The valuation
performed by the office of Cushman & Wakefield, as at December 31, 2012 is attached to
the Company’s financial statements as at December 31, 2012.
(1) In the second quarter of 2012, AFI Development recorded a decline in fair value, in the
amount of about NIS 191 million, in respect of the Kosinskaya project. On July 1, 2012, the
borders of the City of Moscow were officially expanded in the southwest direction (an area
known as ―New Moscow‖). Prior to this, the President of Russia initiated a plan for gradual
transfer of the State authorities to New Moscow. As a result, a trend is visible of re-routing
the business activities, in a gradual manner, from the City center to the southwest direction.
In the estimation of the project’s appraiser, this trend is expected to make marketing of
offices located on the east side of the City – such as the project – more difficult. Taking into
account the aforesaid trends, in order to maintain a competitive advantage and a level of
revenues as previously planned for the project, AFI Development was forced to update the
project concept and to improve the specifications of the property designated to be built in the
framework thereof. Update of the concept along with addition of elevators and allotment of
larger public areas resulted in a contraction of the area planned for rental. Along with this
impact, this update also triggered an increase in the budget for the balance of the project’s
construction costs. Most of the increase in the budget relates to additional adaptations (―fit
outs‖) for the public areas, external infrastructures and additional approvals for these needs.
Furthermore, costs were added to the updated budget (such as permits, approvals and others)
for purposes of adding direct access from the project to Moscow’s circular highway
(MKAD), as well as in order to prepare an additional land area for outside parking in an
attempt to improve the relative number of parking spaces in the project. Update of the
planning in order to make the most favorable use of the project due to identification of the
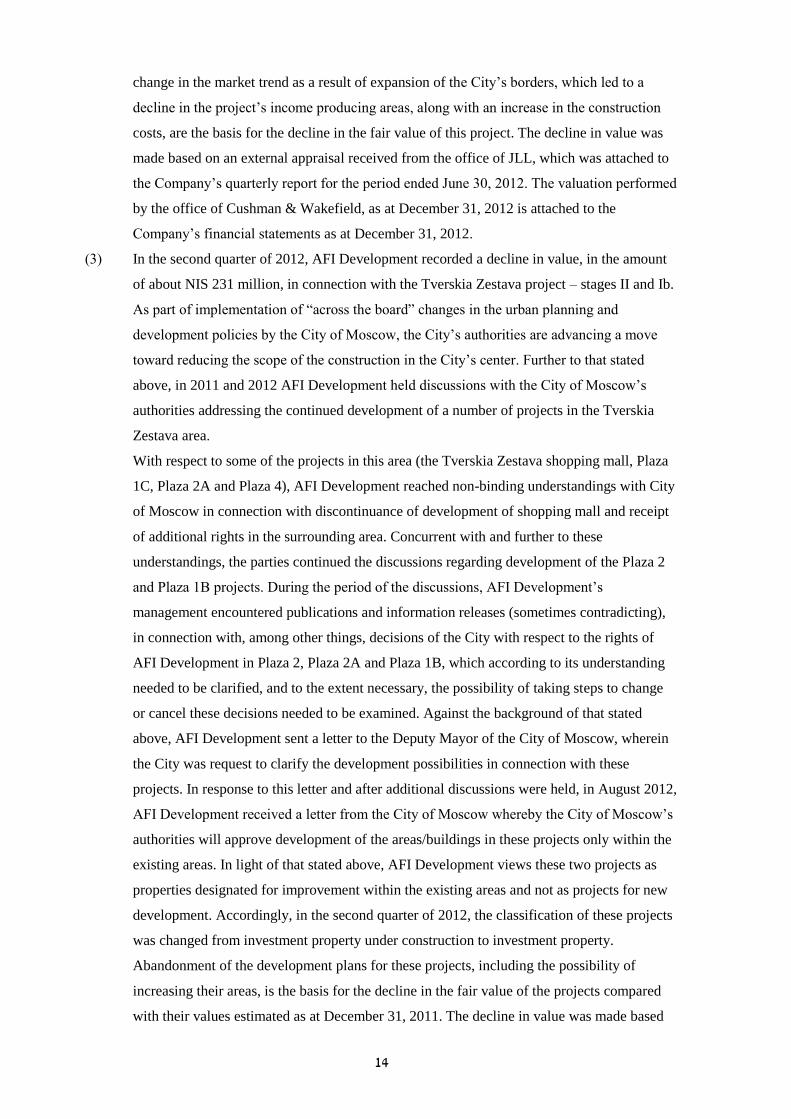
14
change in the market trend as a result of expansion of the City’s borders, which led to a
decline in the project’s income producing areas, along with an increase in the construction
costs, are the basis for the decline in the fair value of this project. The decline in value was
made based on an external appraisal received from the office of JLL, which was attached to
the Company’s quarterly report for the period ended June 30, 2012. The valuation performed
by the office of Cushman & Wakefield, as at December 31, 2012 is attached to the
Company’s financial statements as at December 31, 2012.
(6) In the second quarter of 2012, AFI Development recorded a decline in value, in the amount
of about NIS 231 million, in connection with the Tverskia Zestava project – stages II and Ib.
As part of implementation of ―across the board‖ changes in the urban planning and
development policies by the City of Moscow, the City’s authorities are advancing a move
toward reducing the scope of the construction in the City’s center. Further to that stated
above, in 2011 and 2012 AFI Development held discussions with the City of Moscow’s
authorities addressing the continued development of a number of projects in the Tverskia
Zestava area.
With respect to some of the projects in this area (the Tverskia Zestava shopping mall, Plaza
1C, Plaza 2A and Plaza 4), AFI Development reached non-binding understandings with City
of Moscow in connection with discontinuance of development of shopping mall and receipt
of additional rights in the surrounding area. Concurrent with and further to these
understandings, the parties continued the discussions regarding development of the Plaza 2
and Plaza 1B projects. During the period of the discussions, AFI Development’s
management encountered publications and information releases (sometimes contradicting),
in connection with, among other things, decisions of the City with respect to the rights of
AFI Development in Plaza 2, Plaza 2A and Plaza 1B, which according to its understanding
needed to be clarified, and to the extent necessary, the possibility of taking steps to change
or cancel these decisions needed to be examined. Against the background of that stated
above, AFI Development sent a letter to the Deputy Mayor of the City of Moscow, wherein
the City was request to clarify the development possibilities in connection with these
projects. In response to this letter and after additional discussions were held, in August 2012,
AFI Development received a letter from the City of Moscow whereby the City of Moscow’s
authorities will approve development of the areas/buildings in these projects only within the
existing areas. In light of that stated above, AFI Development views these two projects as
properties designated for improvement within the existing areas and not as projects for new
development. Accordingly, in the second quarter of 2012, the classification of these projects
was changed from investment property under construction to investment property.
Abandonment of the development plans for these projects, including the possibility of
increasing their areas, is the basis for the decline in the fair value of the projects compared
with their values estimated as at December 31, 2011. The decline in value was made based
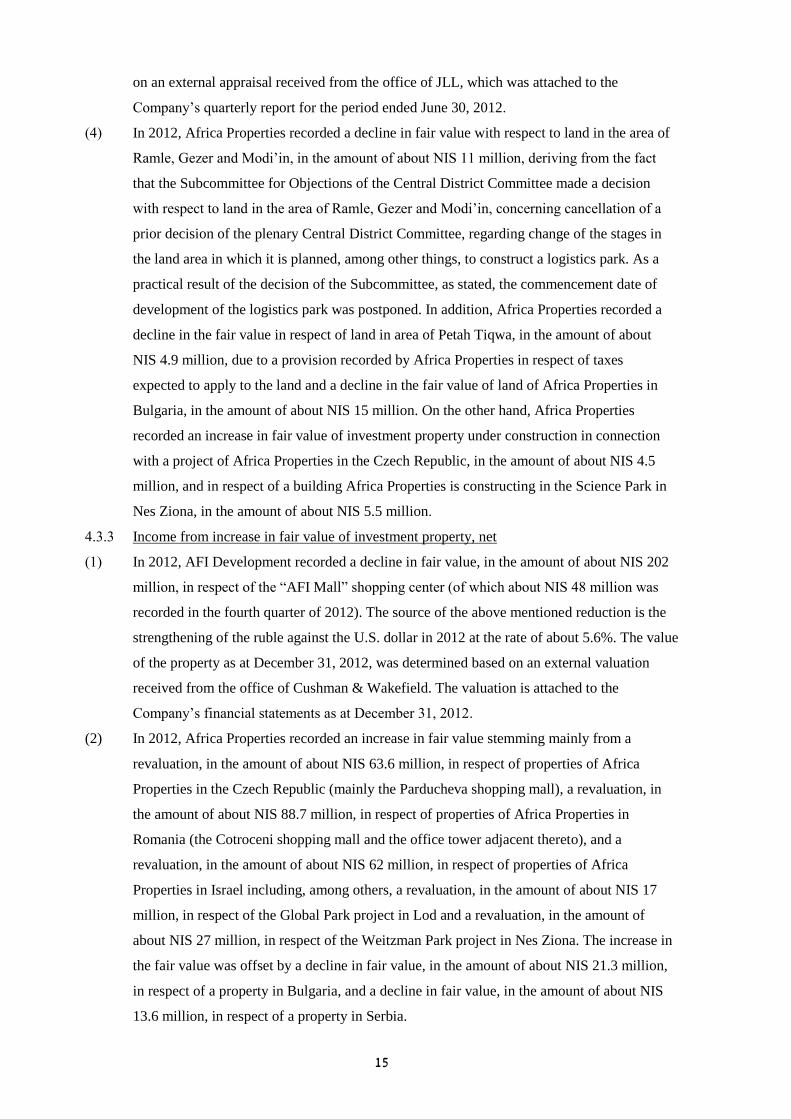
15
on an external appraisal received from the office of JLL, which was attached to the
Company’s quarterly report for the period ended June 30, 2012.
(8) In 2012, Africa Properties recorded a decline in fair value with respect to land in the area of
Ramle, Gezer and Modi’in, in the amount of about NIS 11 million, deriving from the fact
that the Subcommittee for Objections of the Central District Committee made a decision
with respect to land in the area of Ramle, Gezer and Modi’in, concerning cancellation of a
prior decision of the plenary Central District Committee, regarding change of the stages in
the land area in which it is planned, among other things, to construct a logistics park. As a
practical result of the decision of the Subcommittee, as stated, the commencement date of
development of the logistics park was postponed. In addition, Africa Properties recorded a
decline in the fair value in respect of land in area of Petah Tiqwa, in the amount of about
NIS 4.9 million, due to a provision recorded by Africa Properties in respect of taxes
expected to apply to the land and a decline in the fair value of land of Africa Properties in
Bulgaria, in the amount of about NIS 15 million. On the other hand, Africa Properties
recorded an increase in fair value of investment property under construction in connection
with a project of Africa Properties in the Czech Republic, in the amount of about NIS 4.5
million, and in respect of a building Africa Properties is constructing in the Science Park in
Nes Ziona, in the amount of about NIS 5.5 million.
8.6.6 Income from increase in fair value of investment property, net
(8) In 2012, AFI Development recorded a decline in fair value, in the amount of about NIS 202
million, in respect of the ―AFI Mall‖ shopping center (of which about NIS 48 million was
recorded in the fourth quarter of 2012). The source of the above mentioned reduction is the
strengthening of the ruble against the U.S. dollar in 2012 at the rate of about 5.6%. The value
of the property as at December 31, 2012, was determined based on an external valuation
received from the office of Cushman & Wakefield. The valuation is attached to the
Company’s financial statements as at December 31, 2012.
(2) In 2012, Africa Properties recorded an increase in fair value stemming mainly from a
revaluation, in the amount of about NIS 63.6 million, in respect of properties of Africa
Properties in the Czech Republic (mainly the Parducheva shopping mall), a revaluation, in
the amount of about NIS 88.7 million, in respect of properties of Africa Properties in
Romania (the Cotroceni shopping mall and the office tower adjacent thereto), and a
revaluation, in the amount of about NIS 62 million, in respect of properties of Africa
Properties in Israel including, among others, a revaluation, in the amount of about NIS 17
million, in respect of the Global Park project in Lod and a revaluation, in the amount of
about NIS 27 million, in respect of the Weitzman Park project in Nes Ziona. The increase in
the fair value was offset by a decline in fair value, in the amount of about NIS 21.3 million,
in respect of a property in Bulgaria, and a decline in fair value, in the amount of about NIS
13.6 million, in respect of a property in Serbia.
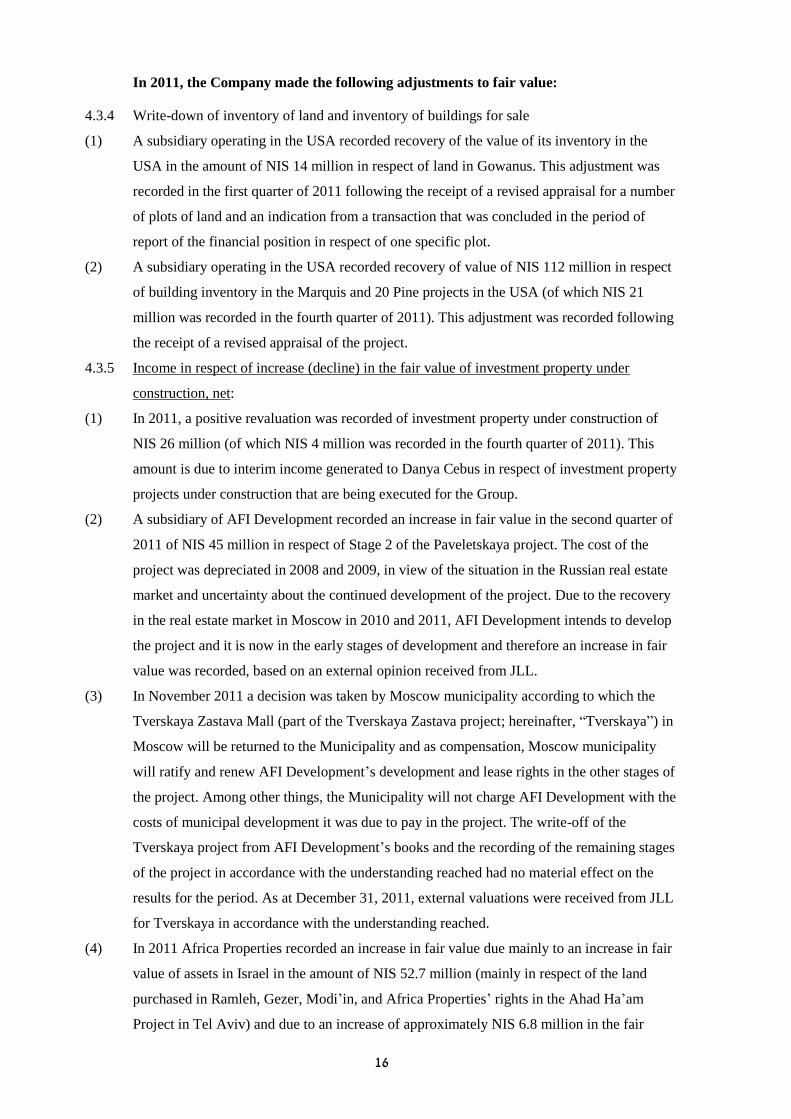
16
In 2011, the Company made the following adjustments to fair value:
4.3.4 Write-down of inventory of land and inventory of buildings for sale
(1) A subsidiary operating in the USA recorded recovery of the value of its inventory in the
USA in the amount of NIS 14 million in respect of land in Gowanus. This adjustment was
recorded in the first quarter of 2011 following the receipt of a revised appraisal for a number
of plots of land and an indication from a transaction that was concluded in the period of
report of the financial position in respect of one specific plot.
(2) A subsidiary operating in the USA recorded recovery of value of NIS 112 million in respect
of building inventory in the Marquis and 20 Pine projects in the USA (of which NIS 21
million was recorded in the fourth quarter of 2011). This adjustment was recorded following
the receipt of a revised appraisal of the project.
4.3.5 Income in respect of increase (decline) in the fair value of investment property under
construction, net:
(1) In 2011, a positive revaluation was recorded of investment property under construction of
NIS 26 million (of which NIS 4 million was recorded in the fourth quarter of 2011). This
amount is due to interim income generated to Danya Cebus in respect of investment property
projects under construction that are being executed for the Group.
(2) A subsidiary of AFI Development recorded an increase in fair value in the second quarter of
2011 of NIS 45 million in respect of Stage 2 of the Paveletskaya project. The cost of the
project was depreciated in 2008 and 2009, in view of the situation in the Russian real estate
market and uncertainty about the continued development of the project. Due to the recovery
in the real estate market in Moscow in 2010 and 2011, AFI Development intends to develop
the project and it is now in the early stages of development and therefore an increase in fair
value was recorded, based on an external opinion received from JLL.
(3) In November 2011 a decision was taken by Moscow municipality according to which the
Tverskaya Zastava Mall (part of the Tverskaya Zastava project; hereinafter, ―Tverskaya‖) in
Moscow will be returned to the Municipality and as compensation, Moscow municipality
will ratify and renew AFI Development’s development and lease rights in the other stages of
the project. Among other things, the Municipality will not charge AFI Development with the
costs of municipal development it was due to pay in the project. The write-off of the
Tverskaya project from AFI Development’s books and the recording of the remaining stages
of the project in accordance with the understanding reached had no material effect on the
results for the period. As at December 31, 2011, external valuations were received from JLL
for Tverskaya in accordance with the understanding reached.
(4) In 2011 Africa Properties recorded an increase in fair value due mainly to an increase in fair
value of assets in Israel in the amount of NIS 52.7 million (mainly in respect of the land
purchased in Ramleh, Gezer, Modi’in, and Africa Properties’ rights in the Ahad Ha’am
Project in Tel Aviv) and due to an increase of approximately NIS 6.8 million in the fair
17
value of the Classic 7 Project Stage B in the Czech Republic. The increase was set off by a
decline in fair value of NIS 25.3 million in respect of the Varna Business Park in Bulgaria,
and a decline of NIS 6.5 million in respect of land owned by Africa Properties land in Lod.
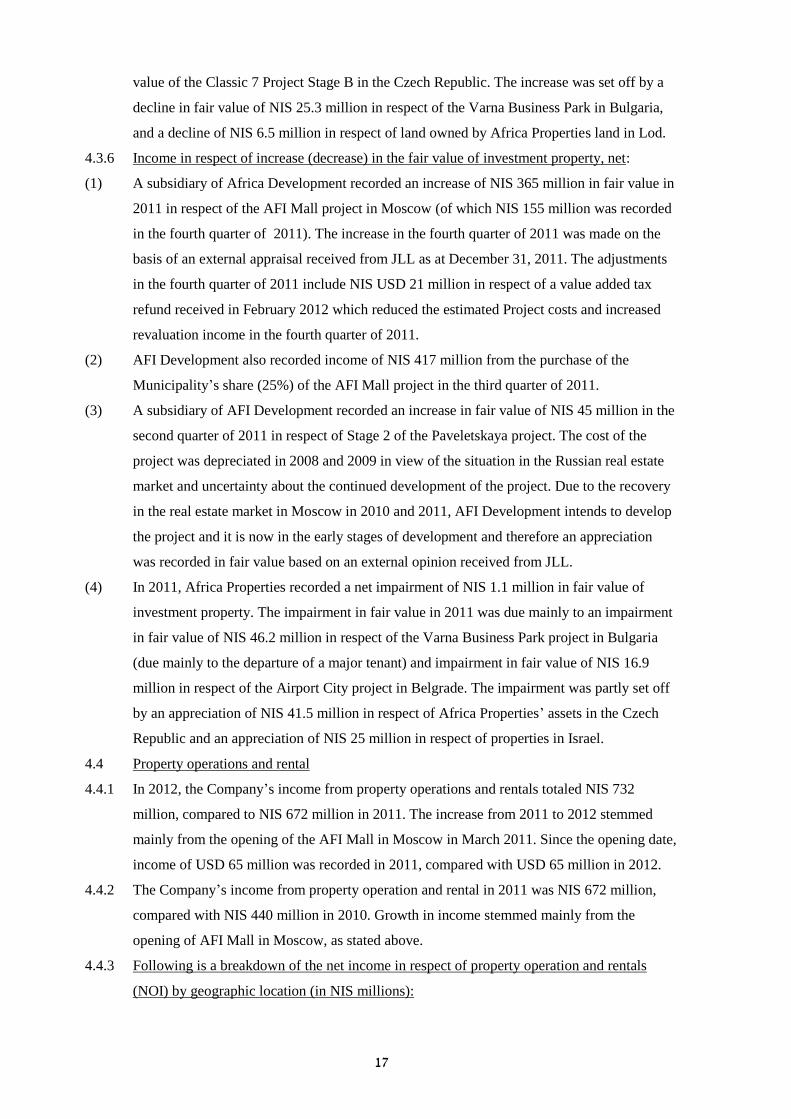
4.3.6 Income in respect of increase (decrease) in the fair value of investment property, net:
(1) A subsidiary of Africa Development recorded an increase of NIS 365 million in fair value in
2011 in respect of the AFI Mall project in Moscow (of which NIS 155 million was recorded
in the fourth quarter of 2011). The increase in the fourth quarter of 2011 was made on the
basis of an external appraisal received from JLL as at December 31, 2011. The adjustments
in the fourth quarter of 2011 include NIS USD 21 million in respect of a value added tax
refund received in February 2012 which reduced the estimated Project costs and increased
revaluation income in the fourth quarter of 2011.
(2) AFI Development also recorded income of NIS 417 million from the purchase of the
Municipality’s share (25%) of the AFI Mall project in the third quarter of 2011.
(3) A subsidiary of AFI Development recorded an increase in fair value of NIS 45 million in the
second quarter of 2011 in respect of Stage 2 of the Paveletskaya project. The cost of the
project was depreciated in 2008 and 2009 in view of the situation in the Russian real estate
market and uncertainty about the continued development of the project. Due to the recovery
in the real estate market in Moscow in 2010 and 2011, AFI Development intends to develop
the project and it is now in the early stages of development and therefore an appreciation
was recorded in fair value based on an external opinion received from JLL.
(4) In 2011, Africa Properties recorded a net impairment of NIS 1.1 million in fair value of
investment property. The impairment in fair value in 2011 was due mainly to an impairment
in fair value of NIS 46.2 million in respect of the Varna Business Park project in Bulgaria
(due mainly to the departure of a major tenant) and impairment in fair value of NIS 16.9
million in respect of the Airport City project in Belgrade. The impairment was partly set off
by an appreciation of NIS 41.5 million in respect of Africa Properties’ assets in the Czech
Republic and an appreciation of NIS 25 million in respect of properties in Israel.
4.4 Property operations and rental
4.4.1 In 2012, the Company’s income from property operations and rentals totaled NIS 732
million, compared to NIS 672 million in 2011. The increase from 2011 to 2012 stemmed
mainly from the opening of the AFI Mall in Moscow in March 2011. Since the opening date,
income of USD 65 million was recorded in 2011, compared with USD 65 million in 2012.
4.4.2 The Company’s income from property operation and rental in 2011 was NIS 672 million,
compared with NIS 440 million in 2010. Growth in income stemmed mainly from the
opening of AFI Mall in Moscow, as stated above.
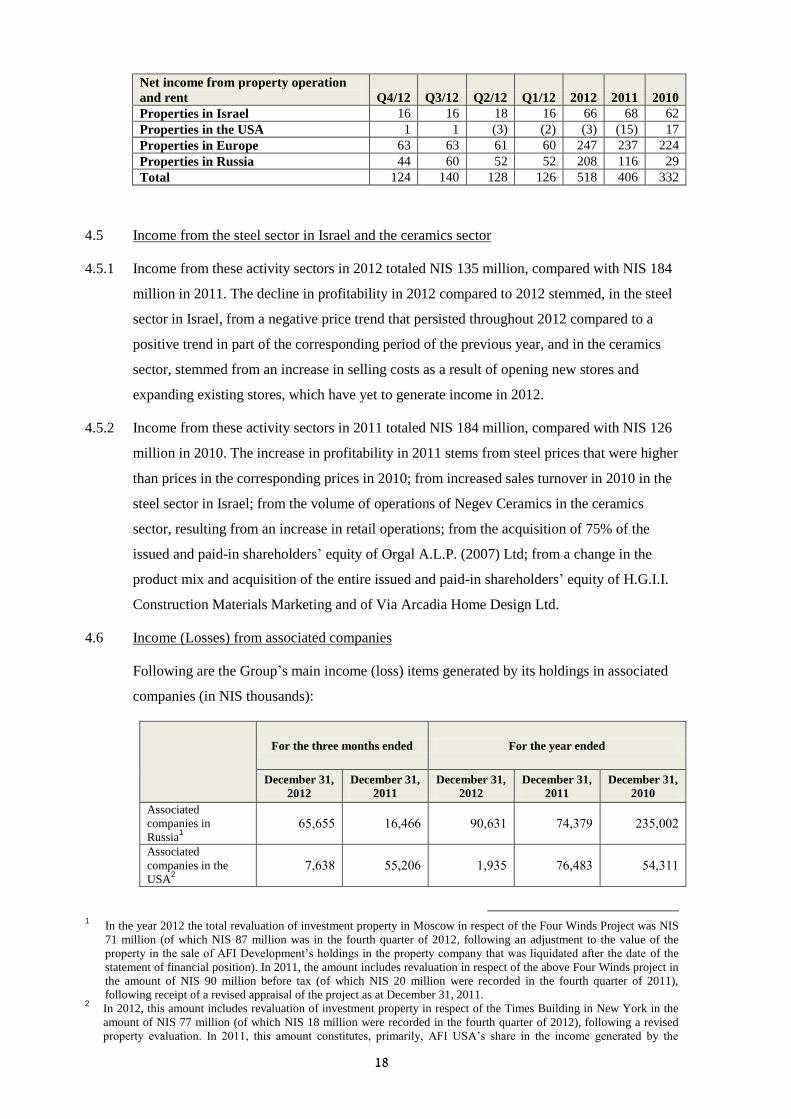
4.4.3 Following is a breakdown of the net income in respect of property operation and rentals
(NOI) by geographic location (in NIS millions):
18
Net income from property operation
and rent Q4/12 Q3/12 Q2/12 Q1/12 2012 2011 2010
Properties in Israel 16 16 18 16 66 68 62
Properties in the USA 1 1 (3) (2) (3) (15) 17
Properties in Europe 63 63 61 60 247 237 224
Properties in Russia 44 60 52 52 208 116 29
Total 124 140 128 126 518 406 332
4.5 Income from the steel sector in Israel and the ceramics sector
4.5.1 Income from these activity sectors in 2012 totaled NIS 135 million, compared with NIS 184
million in 2011. The decline in profitability in 2012 compared to 2012 stemmed, in the steel
sector in Israel, from a negative price trend that persisted throughout 2012 compared to a
positive trend in part of the corresponding period of the previous year, and in the ceramics
sector, stemmed from an increase in selling costs as a result of opening new stores and
expanding existing stores, which have yet to generate income in 2012.
4.5.2 Income from these activity sectors in 2011 totaled NIS 184 million, compared with NIS 126
million in 2010. The increase in profitability in 2011 stems from steel prices that were higher
than prices in the corresponding prices in 2010; from increased sales turnover in 2010 in the
steel sector in Israel; from the volume of operations of Negev Ceramics in the ceramics
sector, resulting from an increase in retail operations; from the acquisition of 75% of the
issued and paid-in shareholders’ equity of Orgal A.L.P. (2007) Ltd; from a change in the
product mix and acquisition of the entire issued and paid-in shareholders’ equity of H.G.I.I.
Construction Materials Marketing and of Via Arcadia Home Design Ltd.
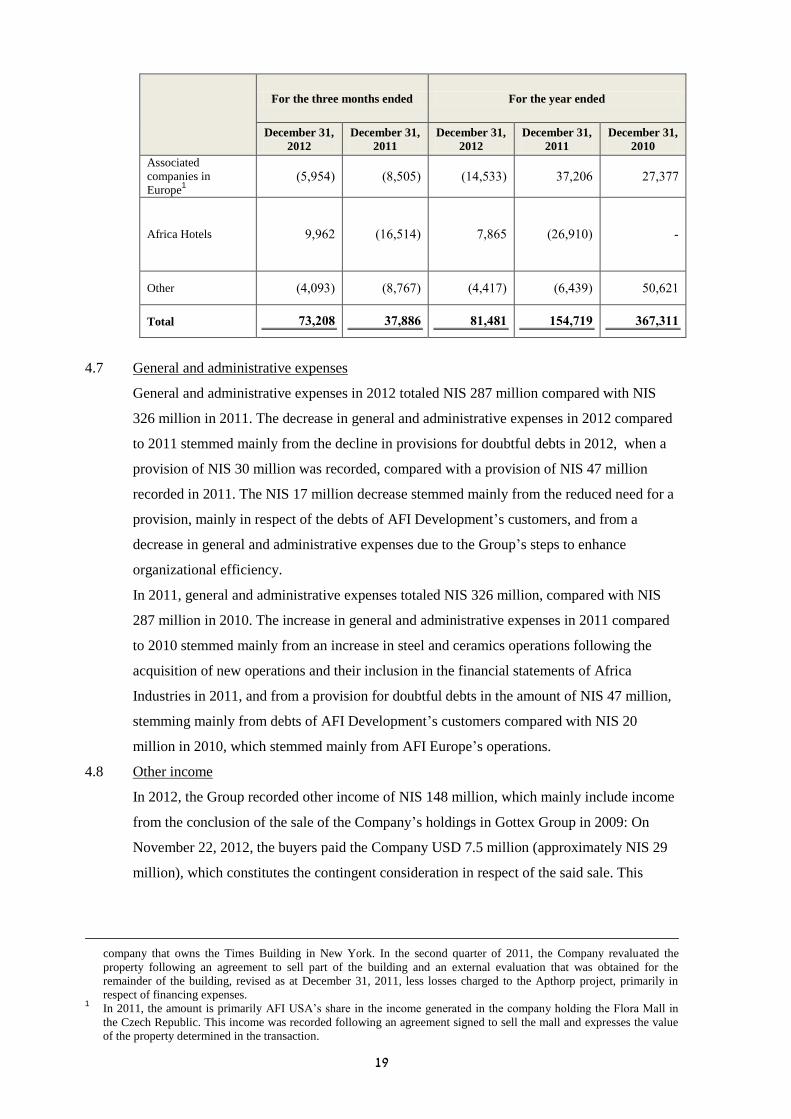
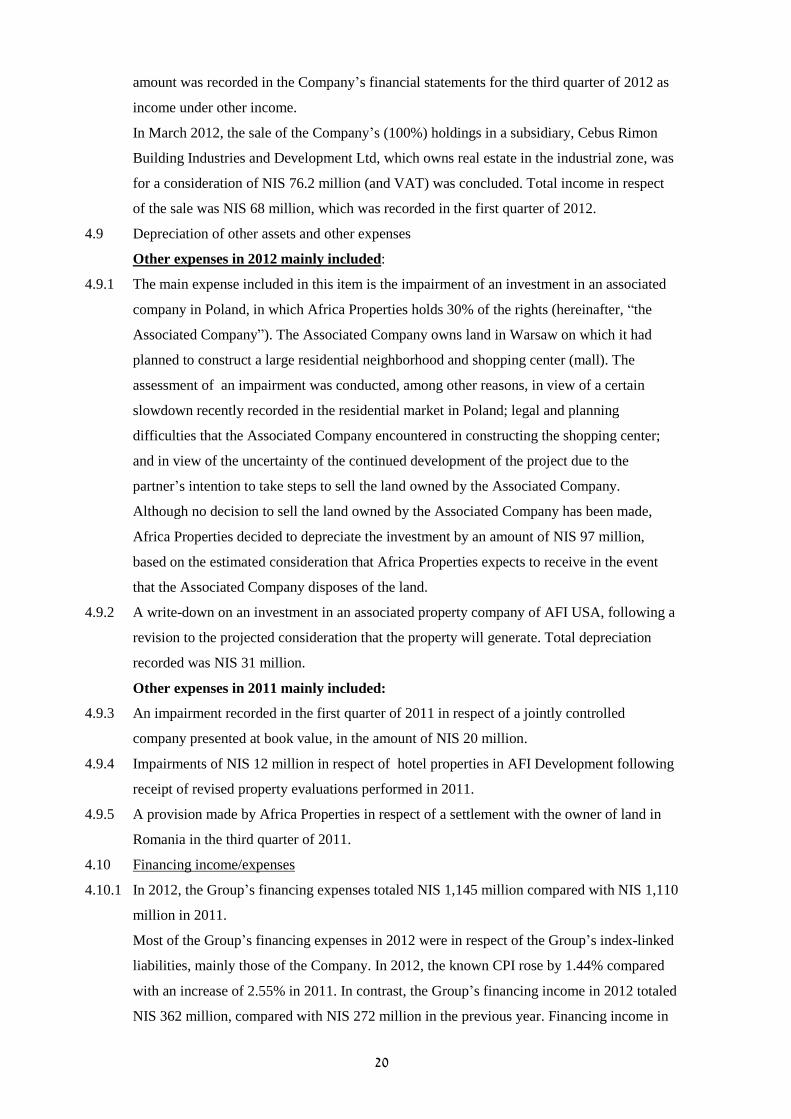
4.6 Income (Losses) from associated companies
Following are the Group’s main income (loss) items generated by its holdings in associated
companies (in NIS thousands):
For the three months ended For the year ended
December 31,
2012
December 31,
2011
December 31,
2012
December 31,
2011
December 31,
2010
Associated
companies in
Russia1
66,666 86,866 6.,668 58,656 166,..1
Associated
companies in the
USA2
5,664 66,1.6 8,666 56,846 68,688
1 In the year 2012 the total revaluation of investment property in Moscow in respect of the Four Winds Project was NIS
71 million (of which NIS 87 million was in the fourth quarter of 2012, following an adjustment to the value of the
property in the sale of AFI Development’s holdings in the property company that was liquidated after the date of the
statement of financial position). In 2011, the amount includes revaluation in respect of the above Four Winds project in
the amount of NIS 90 million before tax (of which NIS 20 million were recorded in the fourth quarter of 2011),
following receipt of a revised appraisal of the project as at December 31, 2011. 2 In 2012, this amount includes revaluation of investment property in respect of the Times Building in New York in the
amount of NIS 77 million (of which NIS 18 million were recorded in the fourth quarter of 2012), following a revised
property evaluation. In 2011, this amount constitutes, primarily, AFI USA’s share in the income generated by the
19
For the three months ended For the year ended
December 31,
2012
December 31,
2011
December 31,
2012
December 31,
2011
December 31,
2010
Associated
companies in
Europe1
(6,668) (4,6.6) (88,666) 65,1.6 15,655
Africa Hotels 6,661 (86,688) 5,466 (16,68.) -
Other (8,.66) (4,565) (8,885) (6,866) 6.,618
Total 239103 329331 329132 2019224 3129322
4.7 General and administrative expenses
General and administrative expenses in 2012 totaled NIS 287 million compared with NIS
326 million in 2011. The decrease in general and administrative expenses in 2012 compared
to 2011 stemmed mainly from the decline in provisions for doubtful debts in 2012, when a
provision of NIS 30 million was recorded, compared with a provision of NIS 47 million
recorded in 2011. The NIS 17 million decrease stemmed mainly from the reduced need for a
provision, mainly in respect of the debts of AFI Development’s customers, and from a
decrease in general and administrative expenses due to the Group’s steps to enhance
organizational efficiency.
In 2011, general and administrative expenses totaled NIS 326 million, compared with NIS
287 million in 2010. The increase in general and administrative expenses in 2011 compared
to 2010 stemmed mainly from an increase in steel and ceramics operations following the
acquisition of new operations and their inclusion in the financial statements of Africa
Industries in 2011, and from a provision for doubtful debts in the amount of NIS 47 million,
stemming mainly from debts of AFI Development’s customers compared with NIS 20
million in 2010, which stemmed mainly from AFI Europe’s operations.
4.8 Other income
In 2012, the Group recorded other income of NIS 148 million, which mainly include income
from the conclusion of the sale of the Company’s holdings in Gottex Group in 2009: On
November 22, 2012, the buyers paid the Company USD 7.5 million (approximately NIS 29
million), which constitutes the contingent consideration in respect of the said sale. This
company that owns the Times Building in New York. In the second quarter of 2011, the Company revaluated the
property following an agreement to sell part of the building and an external evaluation that was obtained for the
remainder of the building, revised as at December 31, 2011, less losses charged to the Apthorp project, primarily in
respect of financing expenses. 1 In 2011, the amount is primarily AFI USA’s share in the income generated in the company holding the Flora Mall in
the Czech Republic. This income was recorded following an agreement signed to sell the mall and expresses the value
of the property determined in the transaction.
21
amount was recorded in the Company’s financial statements for the third quarter of 2012 as
income under other income.
In March 2012, the sale of the Company’s (100%) holdings in a subsidiary, Cebus Rimon
Building Industries and Development Ltd, which owns real estate in the industrial zone, was
for a consideration of NIS 76.2 million (and VAT) was concluded. Total income in respect
of the sale was NIS 68 million, which was recorded in the first quarter of 2012.
4.9 Depreciation of other assets and other expenses
Other expenses in 2012 mainly included:
4.9.1 The main expense included in this item is the impairment of an investment in an associated
company in Poland, in which Africa Properties holds 30% of the rights (hereinafter, ―the
Associated Company‖). The Associated Company owns land in Warsaw on which it had
planned to construct a large residential neighborhood and shopping center (mall). The
assessment of an impairment was conducted, among other reasons, in view of a certain
slowdown recently recorded in the residential market in Poland; legal and planning
difficulties that the Associated Company encountered in constructing the shopping center;
and in view of the uncertainty of the continued development of the project due to the
partner’s intention to take steps to sell the land owned by the Associated Company.
Although no decision to sell the land owned by the Associated Company has been made,
Africa Properties decided to depreciate the investment by an amount of NIS 97 million,
based on the estimated consideration that Africa Properties expects to receive in the event
that the Associated Company disposes of the land.
4.9.2 A write-down on an investment in an associated property company of AFI USA, following a
revision to the projected consideration that the property will generate. Total depreciation
recorded was NIS 31 million.
Other expenses in 2011 mainly included:
4.9.3 An impairment recorded in the first quarter of 2011 in respect of a jointly controlled
company presented at book value, in the amount of NIS 20 million.
4.9.4 Impairments of NIS 12 million in respect of hotel properties in AFI Development following
receipt of revised property evaluations performed in 2011.
4.9.5 A provision made by Africa Properties in respect of a settlement with the owner of land in
Romania in the third quarter of 2011.
4.10 Financing income/expenses
4.10.1 In 2012, the Group’s financing expenses totaled NIS 1,145 million compared with NIS 1,110
million in 2011.
Most of the Group’s financing expenses in 2012 were in respect of the Group’s index-linked
liabilities, mainly those of the Company. In 2012, the known CPI rose by 1.44% compared
with an increase of 2.55% in 2011. In contrast, the Group’s financing income in 2012 totaled
NIS 362 million, compared with NIS 272 million in the previous year. Financing income in
21
2012 included income of NIS 56million from the sale of shares in Alon USA, compared with
NIS 91 million in the previous year.
Accordingly, in 2012, financing expenses (net) totaled NIS 784 million, compared with
financing income (net) of NIS 838 million in 2011.
4.10.2 In 2011, the Group’s financing expenses totaled NIS 1,110 million compared with NIS 1,124
million in 2010.
Most of the Group’s financing expenses in 2011 were in respect of the Group’s index-linked
liabilities, mainly those of the Company. In 2011, the known CPI rose by 2.55% compared
with an increase of 2.28% in 2010. In contrast, the Group’s financing income in 2011 totaled
NIS 272 million, compared with NIS 1,729 million in 2010. The Group’s financing income
in 2010 includes income from the conclusion of the Company’s Arrangement with its
bondholders, in the amount of NIS 1.45billion (For details, also see Note 1(C) to the
Company’s Financial Statements as at December 31, 2012). Excluding this income, the
Group’s financing income in 2010 totaled a mere NIS 280 million.
Accordingly, total financing expenses (net) in 2011 totaled NIS 838 million, compared with
financing expenses (net) of NIS 606 million in 2010.
4.11 Taxes on income
4.11.1 In 2012, tax expenses totaled NIS 73 million. Pre-tax loss , excluding equity income in this
period totaled NIS 1,374 million. The reason for the low amount of tax is financing expenses
in the Company in respect of which no deferred taxes were recorded, stemming from the
Company’s accumulated losses. Tax expenses for 2012 include a one-time expense
following the change in the tax rate in Serbia in the amount of NIS 25 million.
4.11.2 In 2011, tax expenses were NIS 401 million. Income before tax, after controlling for equity
income in the aforesaid period was NIS 803 million. The statutory tax rate in this period is
24% and the effective tax rate for the period was 41.8%. The reason for the high tax rate was
financing expenses in the Company in respect of which deferred tax was not recognized as a
result of losses accumulated in the Company. In 2011, additional tax expenses of NIS 45
million (including the company’s share of taxes recognized in companies presented on an
equity basis) were recognized in the reporting period in respect of the Taxation Section of
the recommendations of the committee headed by Professor Trachtenberg, the main effect of
which on the Group is the suspension of the tax cuts and increase of corporate tax to 25%
beginning in 2012.
4.12 Income (Loss) from discontinued operations
Losses from discontinued operations in 2012 constitute the loss recorded by Africa
Industries in the steel sector in Russia, which is presented in Africa Industries’ financial
statements, beginning from the financial statements as at December 31, 2012 as
―discontinued operation‖ following the sale of Africa Industries’ sale of its holdings in
22
Cloudwalk (that owned the company through which the Group operated in the steel sector in
Russia). According to GAAP, the results of the sold company’s operations that stem from
and are related to the discontinued operation are not presented as consolidated results of
Africa Industries. Africa Industries’ loss from the discontinued operation in 2012 totaled NIS
28.8 million, comprising a current loss from the discontinued operation in the amount of NIS
18.4 million and a loss from the sale of the discontinued operation in the amount of NIS 10.4
million.
In 2011, Africa Industries recorded income of NIS 3 million from the discontinued
operation. The Company’s total income from the discontinued operation in 2011 totaled NIS
78, net after tax, of which NIS 71 million constitutes the income from the sale of 75% of
Danya Cebus’ holdings in Nitivei Hayoval Ltd.
5. Sources of Financing and Liquidity
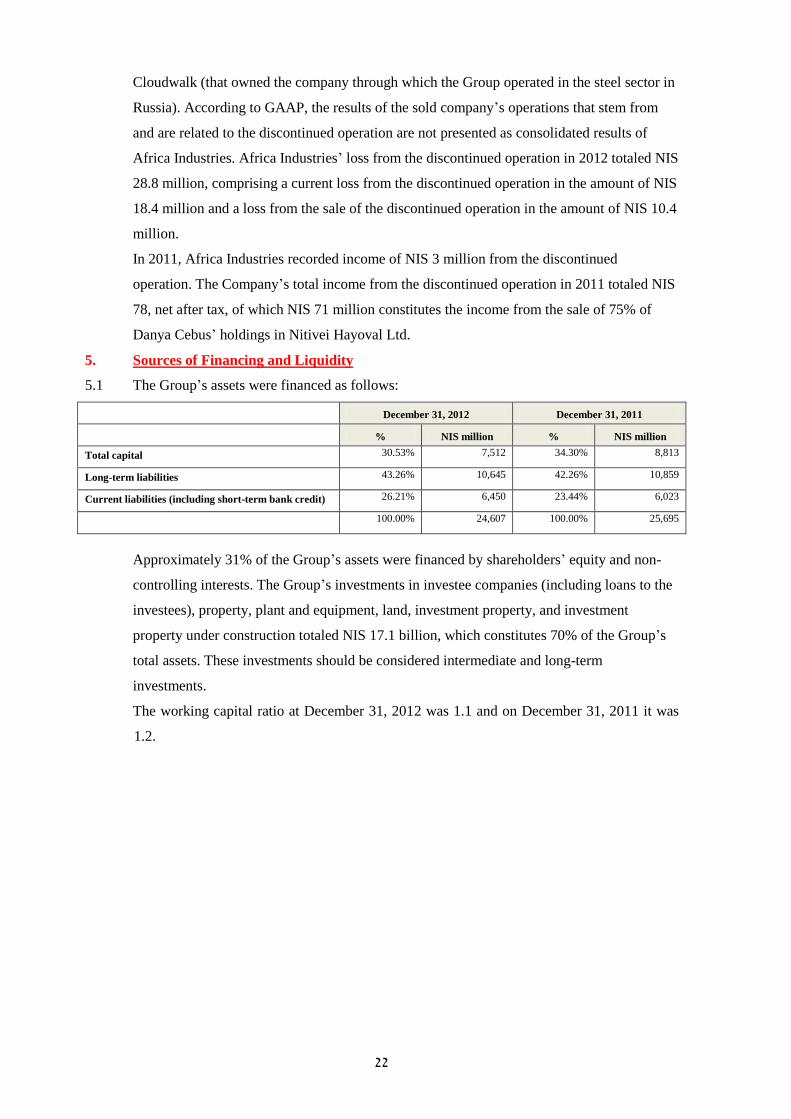
5.1 The Group’s assets were financed as follows:
December 31, 2012 December 31, 2011
% NIS million % NIS million
Total capital 30.53% 7,512 34.30% 8,813
Long-term liabilities 43.26% 10,645 42.26% 10,859
Current liabilities (including short-term bank credit) 26.21% 6,450 23.44% 6,023
100.00% 24,607 100.00% 25,695
Approximately 31% of the Group’s assets were financed by shareholders’ equity and non-
controlling interests. The Group’s investments in investee companies (including loans to the
investees), property, plant and equipment, land, investment property, and investment
property under construction totaled NIS 17.1 billion, which constitutes 70% of the Group’s
total assets. These investments should be considered intermediate and long-term
investments.
The working capital ratio at December 31, 2012 was 1.1 and on December 31, 2011 it was
1.2.
23
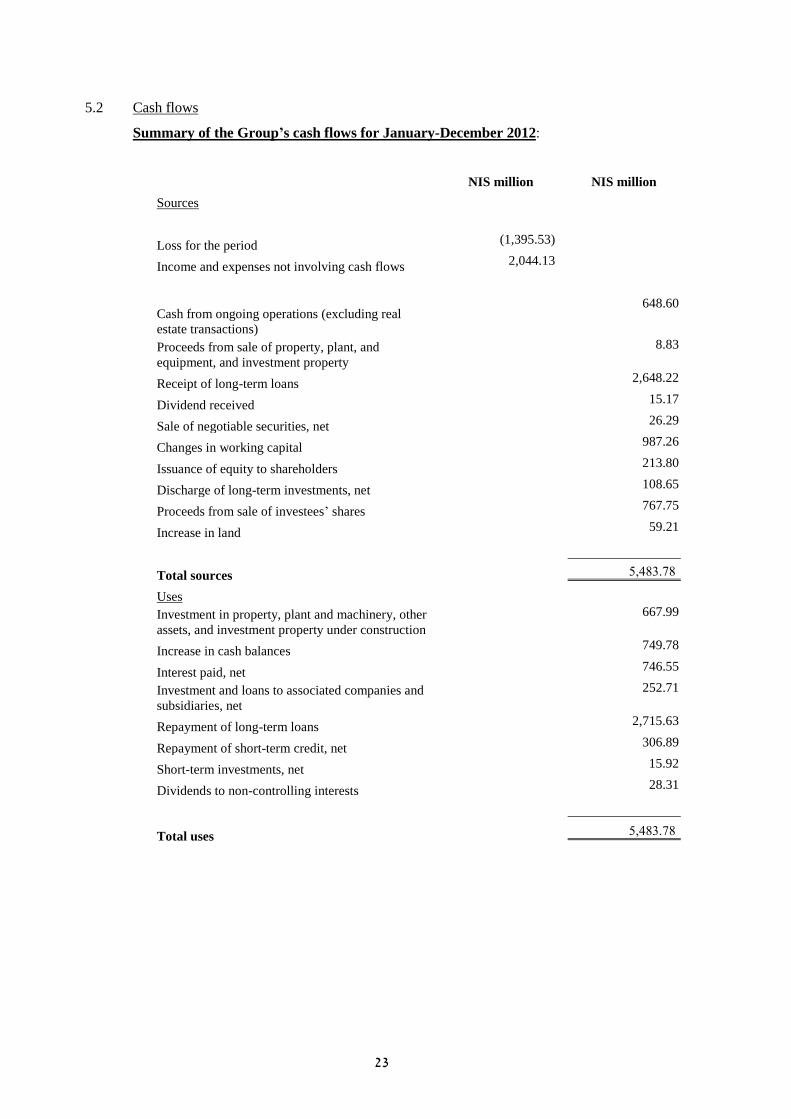
5.2 Cash flows
Summary of the Group’s cash flows for January-December 2012:
NIS million NIS million
Sources
Loss for the period (1,395.53)
Income and expenses not involving cash flows 2,044.13
Cash from ongoing operations (excluding real
estate transactions)
648.60
Proceeds from sale of property, plant, and
equipment, and investment property
8.83
Receipt of long-term loans
2,648.22
Dividend received
15.17
Sale of negotiable securities, net
26.29
Changes in working capital
987.26
Issuance of equity to shareholders
213.80
Discharge of long-term investments, net
108.65
Proceeds from sale of investees’ shares 767.75
Increase in land 59.21
Total sources
6,846.54
Uses
Investment in property, plant and machinery, other
assets, and investment property under construction
667.99
Increase in cash balances
749.78
Interest paid, net
746.55
Investment and loans to associated companies and
subsidiaries, net
252.71
Repayment of long-term loans
2,715.63
Repayment of short-term credit, net
306.89
Short-term investments, net
15.92
Dividends to non-controlling interests
28.31
Total uses
6,846.54
24
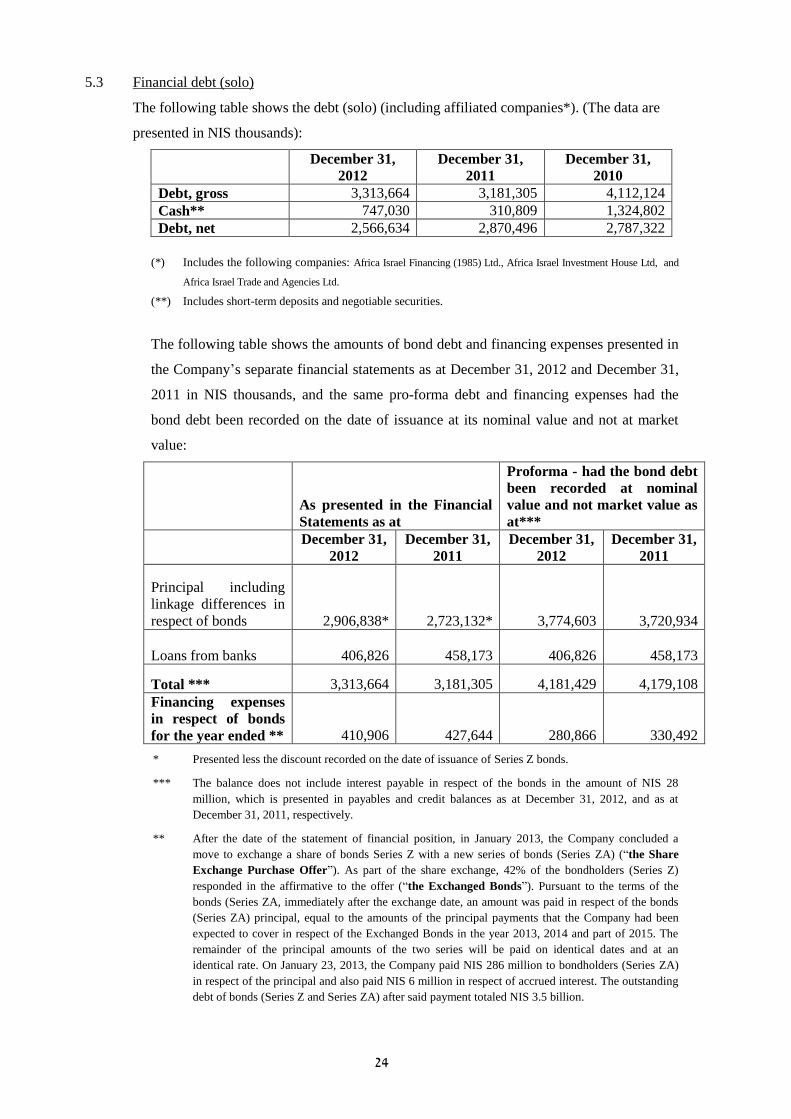
5.3 Financial debt (solo)
The following table shows the debt (solo) (including affiliated companies*). (The data are
presented in NIS thousands):
December 31,
2012
December 31,
2011
December 31,
2010
Debt, gross 3,313,664 3,181,305 4,112,124
Cash** 747,030 310,809 1,324,802
Debt, net 2,566,634 2,870,496 2,787,322
(*) Includes the following companies: Africa Israel Financing (1985) Ltd., Africa Israel Investment House Ltd, and
Africa Israel Trade and Agencies Ltd.
(**) Includes short-term deposits and negotiable securities.
The following table shows the amounts of bond debt and financing expenses presented in
the Company’s separate financial statements as at December 31, 2012 and December 31,
2011 in NIS thousands, and the same pro-forma debt and financing expenses had the
bond debt been recorded on the date of issuance at its nominal value and not at market
value:
As presented in the Financial
Statements as at
Proforma - had the bond debt
been recorded at nominal
value and not market value as
at***
December 31,
2012
December 31,
2011
December 31,
2012
December 31,
2011
Principal including
linkage differences in
respect of bonds 2,906,838* 2,723,132* 3,774,603 3,720,934
Loans from banks 406,826 458,173 406,826 458,173
Total *** 3,313,664 3,181,305 4,181,429 4,179,108
Financing expenses
in respect of bonds
for the year ended ** 410,906 427,644 280,866 330,492
* Presented less the discount recorded on the date of issuance of Series Z bonds.
*** The balance does not include interest payable in respect of the bonds in the amount of NIS 28
million, which is presented in payables and credit balances as at December 31, 2012, and as at
December 31, 2011, respectively.
** After the date of the statement of financial position, in January 2013, the Company concluded a
move to exchange a share of bonds Series Z with a new series of bonds (Series ZA) (―the Share
Exchange Purchase Offer‖). As part of the share exchange, 42% of the bondholders (Series Z)
responded in the affirmative to the offer (―the Exchanged Bonds‖). Pursuant to the terms of the
bonds (Series ZA, immediately after the exchange date, an amount was paid in respect of the bonds
(Series ZA) principal, equal to the amounts of the principal payments that the Company had been
expected to cover in respect of the Exchanged Bonds in the year 2013, 2014 and part of 2015. The
remainder of the principal amounts of the two series will be paid on identical dates and at an
identical rate. On January 23, 2013, the Company paid NIS 286 million to bondholders (Series ZA)
in respect of the principal and also paid NIS 6 million in respect of accrued interest. The outstanding
debt of bonds (Series Z and Series ZA) after said payment totaled NIS 3.5 billion.
25
5.4 Compliance with financial covenants
Regarding compliance by the Group Companies with financial covenants – see Note 22(D)
to the Company’s Financial Statements as at December 31, 2012. Under the Arrangement,
the Company was required to maintain to a maximum net solo debt to CAP ratio of 70%.1
As
at December 31, 2012, the net solo debt to CAP ratio was 36.83%,2
compared with 37.86%
as at December 31, 2011.
5.5 Projected cash flows to finance repayment of the Company’s liabilities
Pursuant to Regulation 10(B)(14) of the Securities Regulations (Periodic and Immediate
Reports) 1970, in the event of warning signs as defined in these Regulations, the company
must attach a statement of projected cash flows including details of the company’s existing
and anticipated liabilities in the two-year period after the publication date of the financial
statement (hereinafter, ―the Projected Cash Flow Statement‖). One of these warning signs is
negative cash flow or a negative cash flow for a period of 12 months, or a persistent negative
cash flow from ordinary operations, unless the Company’s Board of Directors determines
that they do not indicate any liquidity concerns.
Pursuant to the Company’s solo financial statements as at December 31, 2012, the Company
has a negative cash flow from ordinary operations of NIS 19 million in 2012.Nonetheless, it
should be noted that the cash flow from ordinary operations in the fourth quarter of 2012
was positive.
It is the assessment of the Company’s Board of Directors, in view of the fact that the
Company’s ability to service its debt, as a holding company, relies mainly on cash flows
from investing operations and cash flows from financing operations, and to a lesser extent on
cash flows from ordinary operations (which are in any case limited in holding
companies).Taking into consideration that the Company’s solo liquid balances as at
December 31, 2012 were NIS 747 million (see Section 5.3 million), and in view of the scope
of the Company’s short-term liabilities, the Company’s Board of Directors determined that
the solo negative cash flows from ordinary operations do not indicate a liquidity concern and
therefore none of the warning signs exist with respect to the Company.
1 For full details on the manner in which the calculation was made and the specific conditions, the Arrangement
documents (Reference No. 2010-01-379929). 2 Before controlling for accounting deductions in respect of assets against which loans granted exceeded the amount of
the right of recourse to the borrower, which would have reduced this ratio even further.
26
6. Significant Data from the Description of the Company’s Business and Events in
the Reporting Period
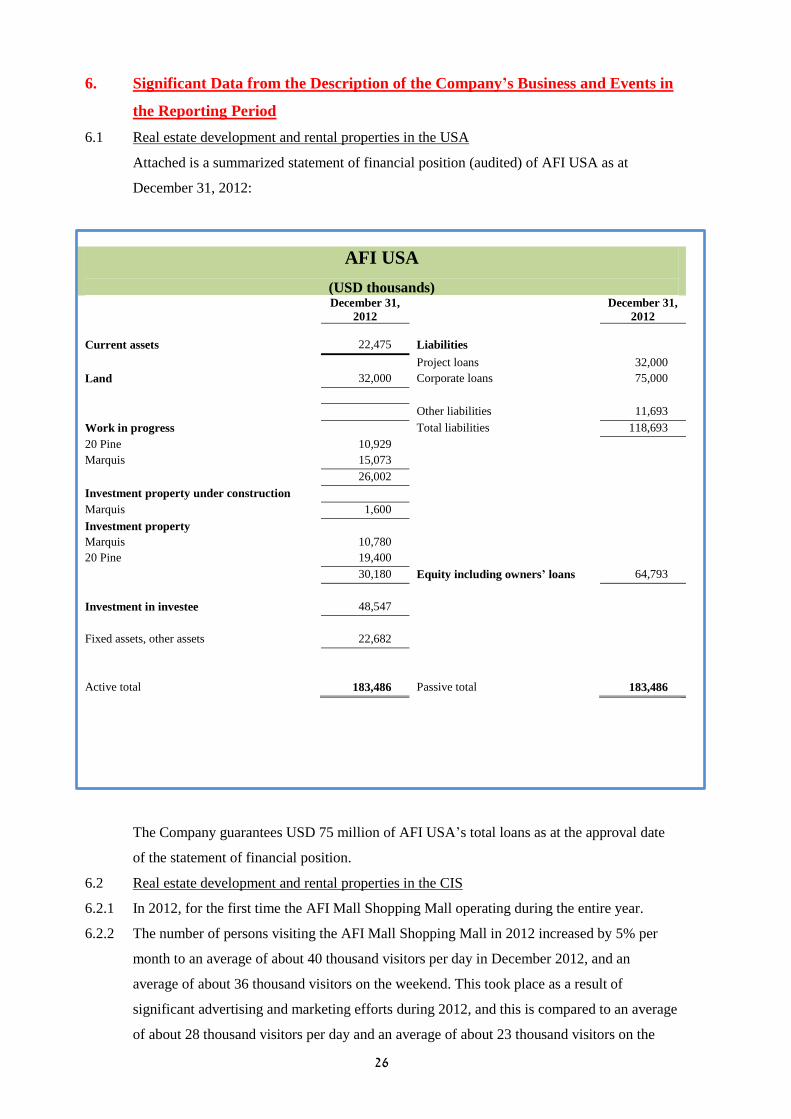
6.1 Real estate development and rental properties in the USA
Attached is a summarized statement of financial position (audited) of AFI USA as at
December 31, 2012:
AFI USA
(USD thousands) December 31,
2012
December 31,
2012
Current assets 22,475 Liabilities
Project loans 32,000
Land 32,000 Corporate loans 75,000
Other liabilities 11,693
Work in progress Total liabilities 118,693
20 Pine 10,929
Marquis 15,073
26,002
Investment property under construction
Marquis 1,600
Investment property
Marquis 10,780
20 Pine 19,400
30,180 Equity including owners’ loans 64,793
Investment in investee 48,547
Fixed assets, other assets 22,682
Active total 183,486 Passive total 183,486
The Company guarantees USD 75 million of AFI USA’s total loans as at the approval date
of the statement of financial position.
6.2 Real estate development and rental properties in the CIS
6.2.1 In 2012, for the first time the AFI Mall Shopping Mall operating during the entire year.
6.2.2 The number of persons visiting the AFI Mall Shopping Mall in 2012 increased by 5% per
month to an average of about 40 thousand visitors per day in December 2012, and an
average of about 36 thousand visitors on the weekend. This took place as a result of
significant advertising and marketing efforts during 2012, and this is compared to an average
of about 28 thousand visitors per day and an average of about 23 thousand visitors on the
27
weekend, in the corresponding period last year, that is an increase in the rates of about 36%
and about 57%, respectively. This increase in the number of visitors stems from among other
things, significant advertising and marketing efforts made by the Group in 2012, as well as
from full operation of the underground parking facility towards the end of 2012, which
offers over 2,000 parking spaces to persons visiting the AFI Mall Shopping Mall.
6.2.3 In addition, during 2012 the Group made efforts with respect to improvement of the
composition of its shopping-mall tenants, collection of rents and to improvement of the
overall profitability. Nonetheless, the occupancy rate remained at the same level as last year
at the rate of about 77%, however the NOI, revenues and collections increased significantly
during 2012.
6.2.4 In 2012, the NOI of the AFI Mall Shopping Mall, in the amount of about US 48.2 million,
compared with about $35.5 million in 2011, wherein the AFI Mall Shopping Mall operated
only starting from March 2011.
6.2.5 As part of the Group’s strategy to improve the credit terms in connection with rental
properties after their completion, in 2012 AFI Development executed a refinancing for the
AFI Mall Shopping Mall, whereby the aggregate credit framework will be US$666 million
(about 21 billion rubles), and the average interest for each loan will be reduced from an
average rate of about 9.62% to an average rate of about 8.22%. The amount of the credit
framework and its terms indicate the confidence of one of the large banks in the Russian
banking system in AFI Development, in general, and in the AFI Mall Shopping Mall, in
particular.
6.2.6 During 2012, the work continued with respect to construction of the new metro station,
which will create direct access to the AFI Mall Shopping Mall from the eastern part of
Moscow as well as from the northwest Moscow. Based on the official information published
by Moscow Metro, the new station is expected to enter into service by the end of 2013, and
thus to continue to improve the access roads to the Shopping Mall.
6.2.7 In addition, to the best of the Company’s knowledge, there has been progress with respect to
construction of the towers in the Moscow City site (on which the Shopping Mall is located)
and up to the end of 2012 construction of about 500 thousand square meters of office space
had been completed. Based on a report prepared by the appraisers Jones Lang LaSalle, up to
the end of 2013 construction of the buildings is expected to be completed on an aggregate
rentable area of about 308 thousand square meters. It is noted that the employees of the
office tower presently constitute a significant percentage of the total number of persons
visiting the AFI Mall Shopping Mall in the middle of the week and, therefore, completion of
entry of tenants into additional office areas on the site is expected to increase the number of
persons visiting the Shopping Mall.
6.2.8 In December 2012, AFI Development replaced the appraisers Jones Lang LaSalle,
(hereinafter – ―JLL‖) with Cushman & Wakefield (hereinafter, ―C&W‖). This replacement
28
was made as part of a rotation the Group makes of its outside advisors, after JLL served in
the position for 7 years. It is noted that to the best of the Company’s knowledge, two
international real estate consulting companies are involved, where in prior periods wherein
JLL performed the valuations of AFI Development’s properties C&W made a sample survey
and provided a second opinion for some of the properties. The valuations performed as at
December 31, 2012 were performed by C&W, whereas a sample survey and second opinion
for some of the properties was made/issued by JLL. C&W, similar to its predecessor JLL,
uses the ―discounted cash flows‖ (DCF) method in the valuations. Nonetheless, there are a
number of differences between the approaches of C&W and JLL. Among other things, the
differences between them are as follows: (1) forecast horizon – while the forecasted time
range up to theoretical realization in JLL’s models is between one year and 5 years, in
C&W’s models the range is between about 4 years and 7 years; (2) over the forecast years,
JLL used fixed prices whereas C&W assumed an annual growth rate in the price (lease/sale)
of between 2.5% and 5%, based on the market forecast for the upcoming years; (3) with
reference to properties under construction, C&W does not consider the initiator’s profit
separately as JLL did but, rather, they add it to the relevant risk factors for the project when
determining its discount rate; and (4) in light of the fact that C&W assumes a higher level of
risk for the anticipated cash flows (as stated, assumption of increase in price and the
initiator’s profit), the discount rate it adopts is significantly higher compared with the
discount rate used by JLL. It is noted that the differences in approach are reflected in the
discount rate and do not affect the yield rate assumptions in the representative year.
Notwithstanding the differences in approach, there is no significant difference in the value of
the properties, as at December 31, 2012, as determined in the valuations performed by
C&W, compared with the values of the properties determined in the valuations performed by
JLL, as at June 30, 2012.
7. Discussion and Examination of Remuneration to Parties at Interest and Senior
Executives
7.1 Following are details of the examination conducted into the connection between
remuneration paid to the Group’s senior executives and managers, and to parties at interest
in the Company (hereinafter jointly, ―the Executives‖) pursuant to the requirements of
Regulation 21 of the Securities Regulations (Periodic and Immediate Reports) 1970, and the
contribution of each of them to the Company in 2012.
7.2 How the remuneration is examined:
Prior to the discussion by the Company’s Board of Directors, a detailed discussion was held
on the remuneration for each of the Company’s executives and managers, noted in said
Regulation 21, by the Company’s Remuneration Committee (hereinafter, ―the
Remuneration Committee‖), which drafted its recommendations on the subject and
presented them to the Company’s Board of Directors.
29
The Remuneration Committee is a Board of Directors’ committee set up specially to
coordinate the matter of remuneration to the Company’s senior executives, which includes
the Company’s two external directors and an additional director in the Company (who is also
an independent director).
As part of the background material for discussions on the matter by members of the
Remuneration Committee, the main points of the conditions of employment of the
Executives and the remuneration paid to Company officers in 2012 were reviewed,
explanations were presented concerning the connection between the amount of remuneration
and the contribution of each of the Executives to the Company in the reporting period
(including data presented concerning the various aspects of the results of the Company’s
operations in the areas of responsibility of the Company’s officers.
This included a presentation to the members of the Remuneration Committee of the
employment terms of the officers in AFI Development (Mssrs. Lev Leviev, Mark Groisman,
and Ms. Tzvia Leviev-Alazarov), a public subsidiary whose shares are listed for train on the
main market of the London Stock Exchange (LSE) and officers in Africa Industries (Mssrs.
Abraham Novogrotzsky in respect of his term as CEO of Africa Industries, and Avi Motola),
a public subsidiary of the Company, as well as the main points of the discussions on
employment terms conducted by the Remuneration Committee and the Board of Directors of
AFI Development and AFI Industries, respectively, and their conclusions. In view of the
public nature of these companies, which have independent boards of directors that comply
with regulatory requirements in London and Israel, as the case may be, and in view of the
fact that a discussion of the remuneration of these officers was conducted in meetings of the
remuneration committees and boards of directors of AFI Development and AFI Industries,
the Company’s Board of Directors determined that it does not consider itself in a proper
position to examine this issue and that it is convinced that there is no justification for
intervening in the determinations made by the boards of these subsidiaries regarding the
remuneration of these officers.
After the discussion by the Remunerations Committee and the drafting of its
recommendations, the background material described above was also distributed to members
of the Company’s Board of Directors. During the discussion by the Board of Directors,
members of the board were shown the main points of the discussion by the Remuneration
Committee and its recommendations on the subject. Further to the above, after the topic was
discussed, the Company’s Board of Directors decided to adopt the recommendations of the
Remuneration Committee and determined its position regarding the fairness and
reasonableness of said remuneration.
7.3 Summary of the Board of Directors’ Explanations
A. Mark Groisman
31
For details of the remuneration paid to Mr. Groisman for 2012 see Regulation 21 of the
chapter on Additional Information in the Periodic Report.
It was stated, among other things, that under Mr. Groisman’s management, AFI
Development completed the year 2012 with operating income of NIS 59 million, which
represents an almost threefold increase over 2011.
Furthermore it was also stated that Mr. Groisman led AFI Development in a transaction for
the sale of the parking spaces in the AFI Mall project, for a consideration of USD 57 million;
a transaction for the sale of AFI Development’s share in the Four Winds office building,
which generated a net income of NIS 50 million; and a transaction for the purchase of the
partner’s share in the Ozarkovskaya III project for a consideration of USD 230 million.
Furthermore, under Mr. Groisman’s management and supervision, AFI Development
refinanced the AFI Mall project and a credit facility of a total of USD 666 million was
granted, at a reduced interest rate.
B. Ms. Tzvia Leviev-Alazarov
For details of the remuneration paid to Ms. Tzvia Leviev-Alazarov (hereinafter, ―Tzvia‖) for
2012 see Regulation 21 of the chapter on Additional Information in the Periodic Report.
It was stated that under Tzvia’s management, in her capacity in charge of the management of
AFI Development’s rental properties (which include the AFI Mall project), the number of
visitors to AFI Mall increased by 5% per month in 2012 to an average of 40,000 visitors
daily in December 2012, and the underground parking areas in the AFI Mall project were
also completed and opened.
Furthermore, under Tzvia’s management, in 2012, occupancy in the majority of AFI
Development’s rental properties was close to full (with the exception of AFI Mall), and the
sales of apartments in AFI Development’s projects were completed.
C. Mr. Lev Leviev
(1) Management fees for Memorand Management (1998) Ltd.)
For details of the management fees paid for 2012 to Memorand Management (1998) Ltd
(hereinafter, ―Memorand Management‖), which is a company owned and controlled by Mr.
Lev Leviev, chairman of the Company’s Board of Directors and its controlling owner, under
a management agreement between the Company and Memorand Management, see
Regulation 21 of the chapter on Additional Information in the Periodic Report.
It was stated among other things, that under the management services, in 2012 the Company
received board management services (chairman of the board services) and oversight of
material and strategic business moves through the service of Mr. Lev Leviev as Chairman of
the Board of Directors of the Company (in respect of which he is not entitled to separate
directors’ remuneration). It is the opinion of the Remuneration Committee and the Board of
Directors that in 2012, Mr. Lev Leviev devoted a large number of hours to the interests of
the Group Companies.
31
Considering the scope of the Company’s operations and its global distribution, it is
reasonable to assume that in the absence of the Management Agreement, the Company
would have born a similar or even higher cost to employ additional managerial functions,
without taking into account the additional services and added values conferred on the
Company by the Management Agreement.
In view of the above, in the opinion of the Company’s Remuneration Committee and Board
of Directors, and taking into account the conventional employment terms in companies with
similar features to those of the Company, the remuneration paid to Memorand Management
for 2012, under the Management Agreement, is fair and reasonable.
(2) Service as Acting Chairman of Board of AFI Development
It was stated, among other things, that in the months in 2012 in which Mr. Leviev served as
the acting Chairman of the Board of AFI Development, he led AFI Development to several
achievements of strategic significance for AFI Development, including, through the
management of the negotiations team in the transaction for the acquisition of the partner’s
share in the Ozarkovskaya III project for USD 230 million.
Furthermore, under Mr. Leviev’s management and supervision, AFI Development
refinanced the Ozarkovskaya III project, under which a total credit facility of USD 220
million was granted.
D. Mr. Avraham Novogrotsky
For details of the remuneration paid to Mr. Avraham Novogrotsky for 2012 see Regulation
21 of the chapter on Additional Information in the Periodic Report.
It was stated, among other things, that over the past several years (including in the first half
of 2012), Mr. Novogrotsky successfully established the position and financial strength of
AFI Industries, a Company subsidiary, which led, among other things, to his appointment as
the Company’s CEO in July 2012.
In his term as CEO of the company, Mr. Novogrotsky led the Company’s business
development in Israel and overseas.
Furthermore, Mr. Novogrotsky assumed a significant role in concluding the Share Exchange
Purchase Offer to the Company’s bondholders (Series Z), which generated a savings of NIS
100 million to the Company, and the conclusion of several transactions for the sale of the
Group Companies’ assets.
Regarding his term as CEO of Africa Industries, it was stated that in 2012, Mr. Novogrotsky
led several significant business development moves in the Africa Industries Group, both in
the holding company—which included the conclusion of the acquisition of the entire
shareholders’ equity of Negev Ceramics, and expansion of Series A bonds of Africa
Industries— and in Africa Industries’ subsidiaries—including an investment in the
renovation and expansion of Negev Ceramics’ factory in Yerucham.
32
Furthermore, in his term in 2012, Mr. Novogrotsky led the integration of the complementary
operations acquired by the Africa Industries Group in 2010-211 such as the construction
steel operations, integration of steel processing equipment acquired in the steel sector; and
the integration of Orgal, a company that is the exclusive distributor of Grohe products, and
the chain of Via Arcadia and Superceramic stores in the ceramics sector.
It was further stated that on March 10, 2013, the Remuneration Committee and Board of
Directors of Africa Industries decided to adopt the recommendations of the management of
Africa Industries, according to which, in view of Africa Industries’ business results in 2012,
no bonuses under Africa Industries’ 2012 Bonus Plan would be distributed, including to Mr.
Novogrotsky.
Furthermore, in the discussions of the Company’s Remuneration Committee and Board of
Directors to approve the bonuses for 2012 to all Company officers and managers, including
Mr. Novogrotsky, based on the quantitative criteria included in the Bonus Plan and the
CEO’s assessment, the bonus was calculated to be NIS 600 thousand (subject to approval of
the general meeting). However, in view of the Company’s financial results, Mr.
Novogrotsky announced that he wished to refrain from receiving said bonus. The
Company’s Remuneration Committee and Board of Directors subsequently accepted Mr.
Novogrotsky’s request and did not approve the bonus.
It is the opinion of the Company’s Board of Directors, in view of the above, and taking into
consideration, among other things, the Company’s results of its operations, and Mr.
Novogrotsky’s actions, that the remuneration paid to Mr. Novogrotsky for 2012 is fair and
reasonable.
E. Avi Motola
For details of the remuneration paid to Mr. Avi Motola for 2012 see Regulation 21 of the
chapter on Additional Information in the Periodic Report.
It was stated, among other things, that Mr. Avi Motola currently serves as CEO of Africa
Industries, CEO of Negev Ceramics, and acting manager of Packer Steel.
Furthermore, in the ceramics sector, under Mr. Motola’s management, the year 2012 ended
with a record income for Negev Ceramics, and the successful integration of the new
operations acquired in 2011. Furthermore, in 2012, under Mr. Motola’s supervision and
management, Negev Ceramics continued to reinforce its position as market leader. Negev
Ceramics continued its efforts to renovate and expand the factory in Yerucham, which is
expected to constitute a base for further growth in the scope of Negev Ceramic’s operations,
and especially its profitability.
In July 2012, Mr. Motola was appointed CEO of Africa Industries. In his position as CEO of
Africa Industries, Mr. Motola implemented the goal set by Africa Industries’ Board of
Directors to sell the holding in Apogey, through which the Group operates in the steel sector
in Russia.
33
As stated above, on March 10, 2012, the Remuneration Committee and Board of Directors of
Africa Industries decided to adopt the recommendations of the management of Africa
Industries, and not to distribute any bonuses under Africa Industries’ 2012 Bonus Plan,
including to Mr. Motola.
F. Mr. Nadav Grinshpon
For details of the remuneration paid to Mr. Grinshpon for 2012 see Regulation 21 of the
chapter on Additional Information in the Periodic Report.
It was stated, among other things, that in 2012 Mr. Grinshpon continued to provide
assistance to the CEO and to the Group’s management in meeting the work plans, including
plans concerning the sale of properties and performance of actions to increase the Group’s
cash flow.
Furthermore, it was stated that Mr. Grinshpon’s work with the banks and institutional bodies
with all aspects concerning improving the trust of the Group’s investors and lenders, and in
granting assistance in the Group’s issues of equity and debt, and support in the Group’s
expansion into synergetic areas of its subsidiaries.
In the opinion the Company’s Board of Directors, noting the aforesaid and taking into
consideration inter alia the results of the Company’s operations and Mr. Grinshpon’s
activities, the remuneration paid to Mr. Grinshpon for 2012 is fair and reasonable.
G. Mr. Menashe Sagiv
For details of the remuneration paid to Mr. Sagiv for 2012 see Regulation 21 of the chapter
on Additional Information in the Periodic Report.
It was noted inter alia that in 2012, under Mr. Sagiv’s management and supervision, the
Group Companies’ cash flow improved and ties with the banking system were reinforced.
It was also stated that Mr. Sagiv contributed to the examination of financing risks and
assisted in obtaining bank credit at a scope of several hundreds of shekels for the Group
Companies.
Mr. Sagiv led the Company to conclude the Share Exchange Purchase Offer to the
Company’s Series Z bondholders, which generated savings of NIS 100 million to the
Company and led to an increase in the Company’s rating.
Furthermore, in the capacity of his role, Mr. Sagiv played a leading role in enhancing the
professional standards of AFI Development in the areas of finance and control, and
appointed and trained the local team. Under his leadership and guidance, control was
integrated in AFI Development, including I-SOX procedures that are required by the
regulatory authorities in Israel.
Under Mr. Sagiv’s management, the Company completed the year 2012 with no I-SOX
defects in the areas of finance and accounting.
In the opinion the Company’s Board of Directors, noting the aforesaid and taking into
consideration inter alia the results of the Company’s operations, Mr. Sagiv’s activities, and

34
the details of the comparative remuneration presented to the board, the remuneration paid to
Mr. Sagiv for 2012 is fair and reasonable.
H. Directors’ remuneration
For details of the remuneration paid to external directors for 2012 see Regulation 21 of the
Additional Information chapter in the Periodic Report.
Directors’ remuneration is paid to each of the Company’s directors, including the external
directors (apart from the chairman of the Board of Directors, Mr. Lev Leviev, who is the
controlling shareholder in the Company and who is employed under a separate management
agreement).
It was stated that the annual remuneration and the attendance fee paid to directors for 2012 is in
accordance with the ―determined amounts‖ under the Companies Regulations (Rules Concerning
the Remuneration and Expenses of an External Director) 2000 (hereinafter, ―the Remuneration
Regulations‖).
The Remuneration Committee and the Board of Directors consider that the Remuneration
Regulations are an acceptable criterion for determining the remuneration of the directors in many
public companies. Noting the above and in consideration of the extent of the directors’
involvement in the Company’s operations and the responsibility involved in the duties of the
Company’s directors, this remuneration is fair and reasonable.
35
Chapter B – Exposure to Market Risks and Methods of Managing Them
1. The Officer Responsible for Financial Market Risk Management
Mr. Menashe Sagiv, the Company’s CFO, is responsible on behalf of the Board of Directors,
for the management of financial market risks in the Company (for information on Mr. Menashe
Sagiv, see Regulation 21 in the Additional Information about the Corporation). His
responsibilities include reporting on financial market risk management to the Company’s
management and Board of Directors, and he is responsible for carrying out their instructions.
Each senior manager and relevant CFO in the Group is responsible for risk management in his
sphere of responsibility. All of the aforesaid executives act to carry out the decisions of the
relevant company’s Board of Directors and management.
In the other Group Companies, the executives responsible for risks were appointed from the
executives in those companies according to the types of risks in these companies.
2. Description of the Main Market Risks to which the Company is Exposed and the Market
Risk Management Policy
―Market risk‖ – a risk to the business results, shareholders equity, cash flows or value of the
Company, stemming from changes in the macro-economic environment in which the Company
and the Group subsidiaries operate, including interest rates, exchange rates, inflation rates, raw
material prices, other prices, prices of securities in Israel and overseas, and economic indicators
that have a material impact on the Company’s assets or its liabilities, including the Company’s
liabilities to suppliers, the debts of Company customers, and other assets and loans.
A Currency risks
The Company and the Group Companies have loans and deposits in various foreign
currencies. Fluctuations in exchange rates (mainly relative to the USD or the Euro)
positively or negatively impact the Group’s (consolidated) financing income/expenses.
The Group operates in various countries where the reporting currency is not the Israeli
shekel (the reporting currency in the foreign countries in which the Company operates is
mainly the US dollar, the ruble or the euro). As a result, when there is change in the real
exchange rates of the shekel against the euro, ruble, or US dollar, Company’s reported
results and shareholders’ equity in the consolidated and in the separate companies are
subject to risk
A weakening of the exchange rates of the currencies against the shekel has a negative
impact on the Group’s consolidated and solo reported results and its shareholders’ equity.
Part of the payments due by the Company (especially in the construction and industry
sectors), generally relating to the cost of employing foreign workers, purchasing certain
raw materials, and importing construction inputs and/or construction equipment, are
directly or indirectly linked to foreign currencies. Changes in the exchange rates of
foreign currencies may also affect the Company’s operations indirectly by increasing the
prices of raw materials and other inputs, as a result of which the cost of commitments
36
with suppliers, sub-contractors, and other service providers increase. Therefore, changes
in the exchange rates of foreign currencies may affect the Company’s operations and its
results. We note that the Company has currency hedges on several of its transactions.
B. Changes in the Consumer Price Index
The Company is exposed to changes in the Consumer Price Index due to the impact
thereof on its CPI-linked liabilities, including CPI-linked bonds issued by the Company,
and bank loans in several cases. In specific cases, CPI-linked liabilities are ―naturally‖
hedged when the cash flows stemming from the project and/or properties financed by the
loan are also linked to the CPI. In other cases, hedging is determined at the discretion of
the officer responsible for risks in the Company according to the circumstances, and
subject to approval of the Board of Directors.
C. Changes in interest rates
The Company maintains a portfolio of short and long-term shekel liabilities at fixed and
variable interest rates. A change in interest rates may cause an increase in the Company’s
financing expenses and cash flows to service the debt. In some of the Group Companies
the Group hedges against changes in interest rates. It should be noted that part of the
interest rate risks are hedged naturally due to the correlation between the low interest
environment of the economic activity, such that when economic activity is at a low, there
is also a reasonable probability that the interest rate environment is also low, and when
economic activity improves, there is a reasonable probability that the interest rate is
higher. This means that when rising interest rates cause a rise in interest payments in
respect of the Company’s liabilities, there is a reasonable probability that the Company’s
results before financing expenses will also increase as a result of the improvement in
economic activity.
Changes in the prices of raw materials and merchandise
In the operations of one of the Group’s subsidiaries in the industrial sector, there is a lag
of several months between the ordering of raw materials from suppliers and the sale to
customers. This interval exposes the Company to changes in raw material prices
(particularly in steel) globally.
D. Other market risks
In addition to the aforesaid concerning market risks to which the Group is exposed, it
should be noted that the Group’s operations are exposed to other risks deriving from inter
alia the state of the economies and business sectors in which it operates. Following are
the main risk factors (for details see Section 1.33 in the Description of the Company’s
Business chapter).
(a) The Group’s overseas operations expose the Company to the risks of the countries in
which it operates. This exposure derives inter alia from political and policy changes liable
37
to have an effect on the economic state of these countries. Most of the countries in which
the Company operates as described above are rated ―investment rating‖.
(b) An economic slowdown in economies in which the Group operates is liable to result in a
reduction of the Company’s operations, in particular the development and residential
construction sector (for example, due to a drop in demand for residential units), in the
infrastructure sector (for example, due to a reduction in resources allocated by
government bodies to this sector), in the development and construction of income-
producing properties (for example, due to a reduction in demand for space to rent), in the
steel sector (due to a reduction in consumption of steel products), in the ceramics sector
(for example, due to a reduction in demand for ceramic products), and in the hotels and
leisure sector (due to a reduction in incoming tourism to Israel).
(c) A return of the global financial crisis (as stated above), or even the development of a local
financial crisis in countries in which the Group operates, may overshadow the Company’s
ability to enter into and conclude transactions and obtain financing for the furtherance of
its projects. All these take on greater force in respect of large-scale projects. Any
deepening of the crisis and changes in the market increase the risk of not being able to
complete new projects and regarding the ability to dispose of existing projects which have
been completed or projects that are due to be completed in the short and intermediate-
term.
(d) Any damage to the financial ability and strength of the financial institutions with which
the Company works may have a considerable adverse effect on the ability to undertake
and construct projects, and so also on the Company, the value of its properties, and its
liquidity, because the significant financing needs and the regulatory control applicable to
banking and non-banking financial institutions have a great influence on their ability to
finance the operations of Group Companies. In this matter it has been stated that the
capital requirements of Israeli banks have recently been tightened, which makes it
difficult for them to provide financing. There is also a specific restriction on banks in
Israel regarding the financing of real estate transactions, which restricts the supply of
bank credit, a key element of financing for real estate projects. Furthermore, in recent
years, the financing entities that belong to the non-banking financing system have
tightened their financing terms, and this fact may adversely affect companies’ ability to
receive credit from these entities, the costs of financing, and the various operating and
financial restrictions with which the companies must comply under financing agreements
with the non-banking system. Nonetheless, the Group Companies enjoy credit availability
from the banking system and from the non-banking system.
38
3. Market risk management policy
A. Management of currency risks, index risks, and interest rates
The Company and the Group subsidiaries maintain a portfolio of long-term and short-
term liabilities in various currencies with different linkage bases and different interest
rates. In international operations, the Group Companies’ ordinary practice in most
transactions is to finance the operations with loans from financing entities and/or owners’
loans denoted in the same currency as the currency in which the revenues are received
from the operations (operations, residential projects, construction of rental property, or
rental property). The Company and the Group Companies are not in the practice of
hedging the measurement bases of the results of its operations or its statement of
financial position against changes deriving from exchange rates of the different currencies
against the shekel.
In the local market the Company and the Group Companies maintain a dynamic credit
portfolio with different interest rates and time periods conducted according to the
Company’s cash requirements and prevalent market conditions from time to time. The
Company also sometimes is covered by hedging for economic purposes (in contrast to
hedging on the financial results presented in the financial statements), using forward
contracts, future contracts, swap transactions and options on the various currency rates.
The Company and the Group Companies have no fixed policy regarding the scope of
hedging on the credit portfolio and it is determined at the discretion of the officer
responsible for risks in each of the Group Companies in coordination with the board of
directors of that company.
B. Changes in the prices of raw materials and merchandise
A subsidiary in the steel sector deals with risks deriving from changes in world prices of
raw materials by constant monitoring of the prices of raw materials and implementing an
inventory policy that reduces these risks. When it purchases inventory from suppliers in
foreign currencies the Group hedges against the rate of that currency from the date of the
contract until the date the inventory is expected to be received.
C. Supervision of the market risks management policy
The supervision in the Company and the Group Companies in respect of market risks is
determined in discussions in the appropriate forums in the managements and the Boards
of Directors of the Company and the Group Companies, and in accordance with the
appropriate decisions that have been taken. Every quarter, when the Board of Directors
meets to approve the Financial Statements, an explanation is given of the effects of
market risks on the Company’s trading results.
4. Linkage bases
The Company is subject to changes in the CPI due to their impact on the Company’s
index-linked liabilities. In 2012, the known CPI increased cumulatively by 1.44%, a fact
39
that has an adverse impact on the Company’s financial results. Concurrently with the
increase in the CPI noted above, the shekel strengthened against the US dollar by 2.3%
and the strengthened against the euro by 0.35%. This depreciation led mainly to a
decrease in the Company’s shareholders equity in respect of its investments in AFI
Development and AFI Europe.
The Company’s exposure to changes in the exchange rates of the US dollar, the euro, the
ruble, and the koruna, stem mainly from outstanding short- and long-term liabilities to
banks in these currencies. The Company’s exposure to changes in the CPI stem mainly
from bonds.
In specific cases, there is a ―natural‖ hedge on the liabilities that are subject to certain
linkage risks, when the cash flows generated by the project and/or the assets financed by
the loans in these linkage bases are also linked to the same linkage base. The Company
and the Group Companies take steps, as far as possible, to match the linkage basis of the
liabilities to the linkage base of the property and/or cash flows that they are financing. In
other cases, the hedge is determined at the discretion of the officer responsible for risk
management in the Company and/or the subsidiaries, according to the circumstances and
subject to the required approvals. As at December 31, 2012, 28% of the credit is linked to
the CPI and 18% of the credit is unlinked.
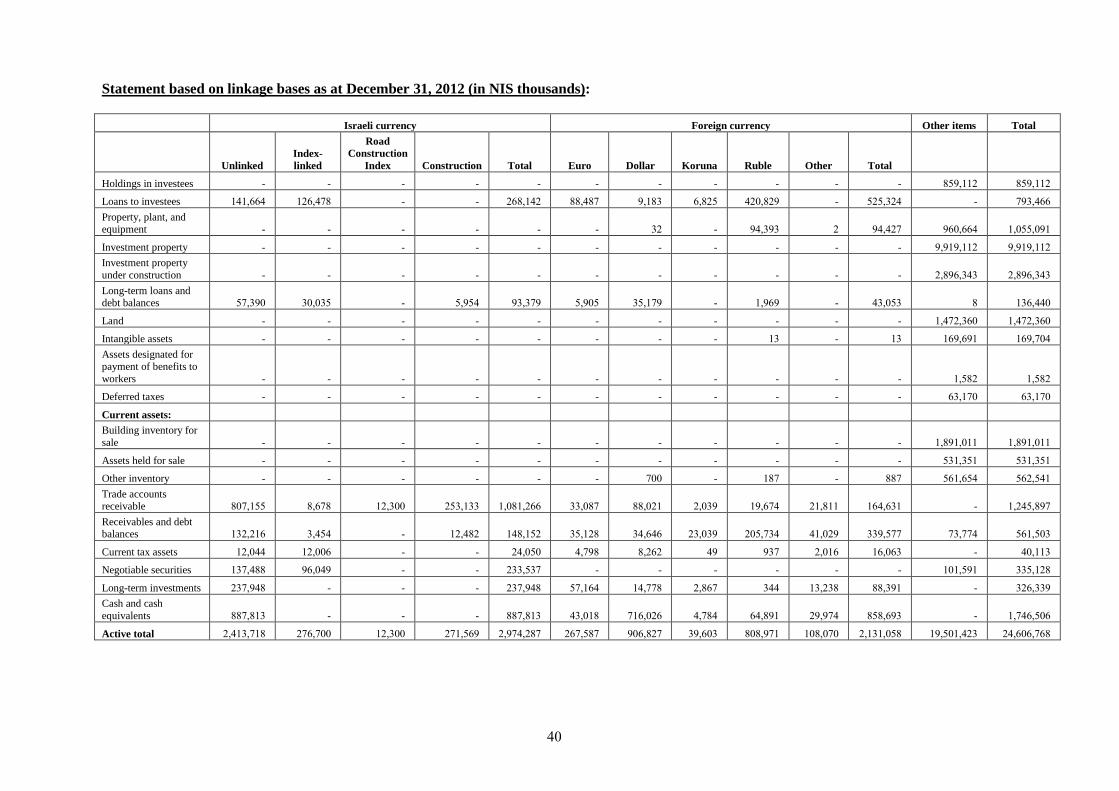
8.
Statement based on linkage bases as at December 31, 2012 (in NIS thousands):
Israeli currency Foreign currency Other items Total
Unlinked
Index-
linked
Road
Construction
Index Construction Total Euro Dollar Koruna Ruble Other Total
Holdings in investees - - - - - - - - - - - 466,881 466,881
Loans to investees 888,668 816,854 - - 164,881 44,845 6,846 6,416 81.,416 - 616,618 - 566,866
Property, plant, and equipment - - - - - - 61 - 68,666 1 68,815 66.,668 8,.66,.68
Investment property - - - - - - - - - - - 6,686,881 6,686,881
Investment property
under construction - - - - - - - - - - - 1,466,686 1,466,686
Long-term loans and debt balances 65,66. 6.,.66 - 6,668 66,656 6,6.6 66,856 - 8,666 - 86,.66 4 866,88.
Land - - - - - - - - - - - 8,851,66. 8,851,66.
Intangible assets - - - - - - - - 86 - 86 866,668 866,5.8
Assets designated for payment of benefits to
workers - - - - - - - - - - - 8,641 8,641
Deferred taxes - - - - - - - - - - - 66,85. 66,85.
Current assets5
Building inventory for
sale - - - - - - - - - - - 8,468,.88 8,468,.88
Assets held for sale - - - - - - - - - - - 668,668 668,668
Other inventory - - - - - - 5.. - 845 - 445 668,668 661,688
Trade accounts receivable 4.5,866 4,654 81,6.. 166,866 8,.48,166 66,.45 44,.18 1,.66 86,658 18,488 868,668 - 8,186,465
Receivables and debt balances 861,186 6,868 - 81,841 884,861 66,814 68,686 16,.66 1.6,568 88,.16 666,655 56,558 668,6.6
Current tax assets 81,.88 81,..6 - - 18,.6. 8,564 4,161 86 665 1,.86 86,.66 - 8.,886
Negotiable securities 865,844 66,.86 - - 166,665 - - - - - - 8.8,668 666,814
Long-term investments 165,684 - - - 165,684 65,868 88,554 1,465 688 86,164 44,668 - 616,666
Cash and cash
equivalents 445,486 - - - 445,486 86,.84 586,.16 8,548 68,468 16,658 464,666 - 8,586,6.6
Active total 1,886,584 156,5.. 81,6.. 158,666 1,658,145 165,645 6.6,415 66,6.6 4.4,658 8.4,.5. 1,868,.64 86,6.8,816 18,6.6,564
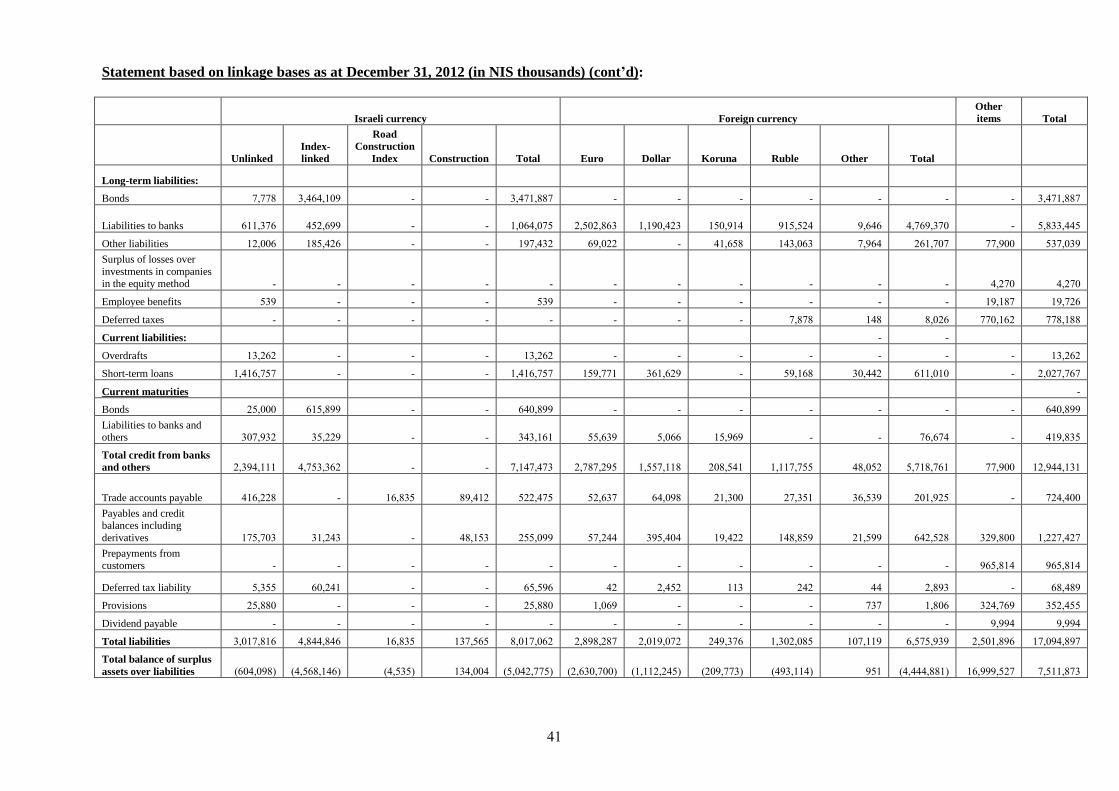
88
Statement based on linkage bases as at December 31, 2012 (in NIS thousands) (cont’d)5
Israeli currency Foreign currency
Other
items Total
Unlinked
Index-
linked
Road
Construction
Index Construction Total Euro Dollar Koruna Ruble Other Total
Long-term liabilities5
Bonds 5,554 6,868,8.6 - - 6,858,445 - - - - - - - 6,858,445
Liabilities to banks 688,656 861,666 - - 8,.68,.56 1,6.1,466 8,86.,816 86.,688 686,618 6,686 8,566,65. - 6,466,886
Other liabilities 81,..6 846,816 - - 865,861 66,.11 - 88,664 886,.66 5,668 168,5.5 55,6.. 665,.66
Surplus of losses over
investments in companies in the equity method - - - - - - - - - - - 8,15. 8,15.
Employee benefits 666 - - - 666 - - - - - - 86,845 86,516
Deferred taxes - - - - - - - - 5,454 884 4,.16 55.,861 554,844
Current liabilities5 - -
Overdrafts 86,161 - - - 86,161 - - - - - - - 86,161
Short-term loans 8,886,565 - - - 8,886,565 866,558 668,616 - 66,864 6.,881 688,.8. - 1,.15,565
Current maturities -
Bonds 16,... 686,466 - - 68.,466 - - - - - - - 68.,466
Liabilities to banks and others 6.5,661 66,116 - - 686,868 66,666 6,.66 86,666 - - 56,658 - 886,466
Total credit from banks
and others 1,668,888 8,566,661 - - 5,885,856 1,545,166 8,665,884 1.4,688 8,885,566 84,.61 6,584,568 55,6.. 81,688,868
Trade accounts payable 886,114 - 86,466 46,881 611,856 61,665 68,.64 18,6.. 15,668 66,666 1.8,616 - 518,8..
Payables and credit balances including
derivatives 856,5.6 68,186 - 84,866 166,.66 65,188 666,8.8 86,811 884,466 18,666 681,614 616,4.. 8,115,815
Prepayments from customers - - - - - - - - - - - 666,488 666,488
Deferred tax liability 6,666 6.,188 - - 66,666 81 1,861 886 181 88 1,466 - 64,846
Provisions 16,44. - - - 16,44. 8,.66 - - - 565 8,4.6 618,566 661,866
Dividend payable - - - - - - - - - - - 6,668 6,668
Total liabilities 6,.85,486 8,488,486 86,466 865,666 4,.85,.61 1,464,145 1,.86,.51 186,656 8,6.1,.46 8.5,886 6,656,666 1,6.8,466 85,.68,465
Total balance of surplus
assets over liabilities (6.8,.64) (8,664,886) (8,666) 868,..8 (6,.81,556) (1,66.,5..) (8,881,186) (1.6,556) (866,888) 668 (8,888,448) 86,666,615 5,688,456
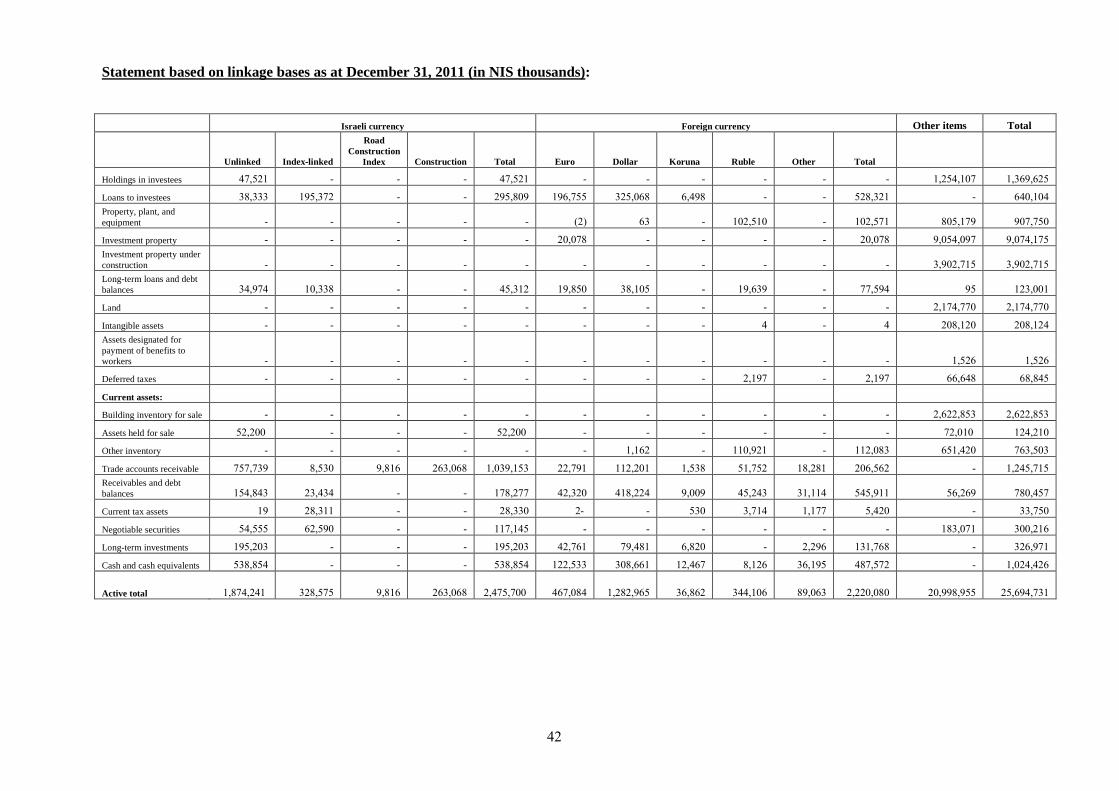
81
Statement based on linkage bases as at December 31, 2011 (in NIS thousands):
Israeli currency Foreign currency Other items Total
Unlinked Index-linked
Road
Construction
Index Construction Total Euro Dollar Koruna Ruble Other Total
Holdings in investees 85,618 - - - 85,618 - - - - - - 8,168,8.5 8,666,616
Loans to investees 64,666 866,651 - - 166,4.6 866,566 616,.64 6,864 - - 614,618 - 68.,8.8 Property, plant, and
equipment - - - - - (1) 66 - 8.1,68. - 8.1,658 4.6,856 6.5,56.
Investment property - - - - - 1.,.54 - - - - 1.,.54 6,.68,.65 6,.58,856 Investment property under
construction - - - - - - - - - - - 6,6.1,586 6,6.1,586 Long-term loans and debt
balances 68,658 8.,664 - - 86,681 86,46. 64,8.6 - 86,666 - 55,668 66 816,..8
Land - - - - - - - - - - - 1,858,55. 1,858,55.
Intangible assets - - - - - - - - 8 - 8 1.4,81. 1.4,818 Assets designated for
payment of benefits to
workers - - - - - - - - - - - 8,616 8,616
Deferred taxes - - - - - - - - 1,865 - 1,865 66,684 64,486
Current assets5
Building inventory for sale - - - - - - - - - - - 1,611,466 1,611,466
Assets held for sale 61,1.. - - - 61,1.. - - - - - - 51,.8. 818,18.
Other inventory - - - - - - 8,861 - 88.,618 - 881,.46 668,81. 566,6.6
Trade accounts receivable 565,566 4,66. 6,486 166,.64 8,.66,866 11,568 881,1.8 8,664 68,561 84,148 1.6,661 - 8,186,586 Receivables and debt
balances 868,486 16,868 - - 854,155 81,61. 884,118 6,..6 86,186 68,888 686,688 66,166 54.,865
Current tax assets 86 14,688 - - 14,66. -1 - 66. 6,588 8,855 6,81. - 66,56.
Negotiable securities 68,666 61,66. - - 885,886 - - - - - - 846,.58 6..,186
Long-term investments 866,1.6 - - - 866,1.6 81,568 56,848 6,41. - 1,166 868,564 - 616,658
Cash and cash equivalents 664,468 - - - 664,468 811,666 6.4,668 81,865 4,816 66,866 845,651 - 8,.18,816
Active total 8,458,188 614,656 6,486 166,.64 1,856,5.. 865,.48 8,141,666 66,461 688,8.6 46,.66 1,11.,.4.
1.,664,666 16,668,568
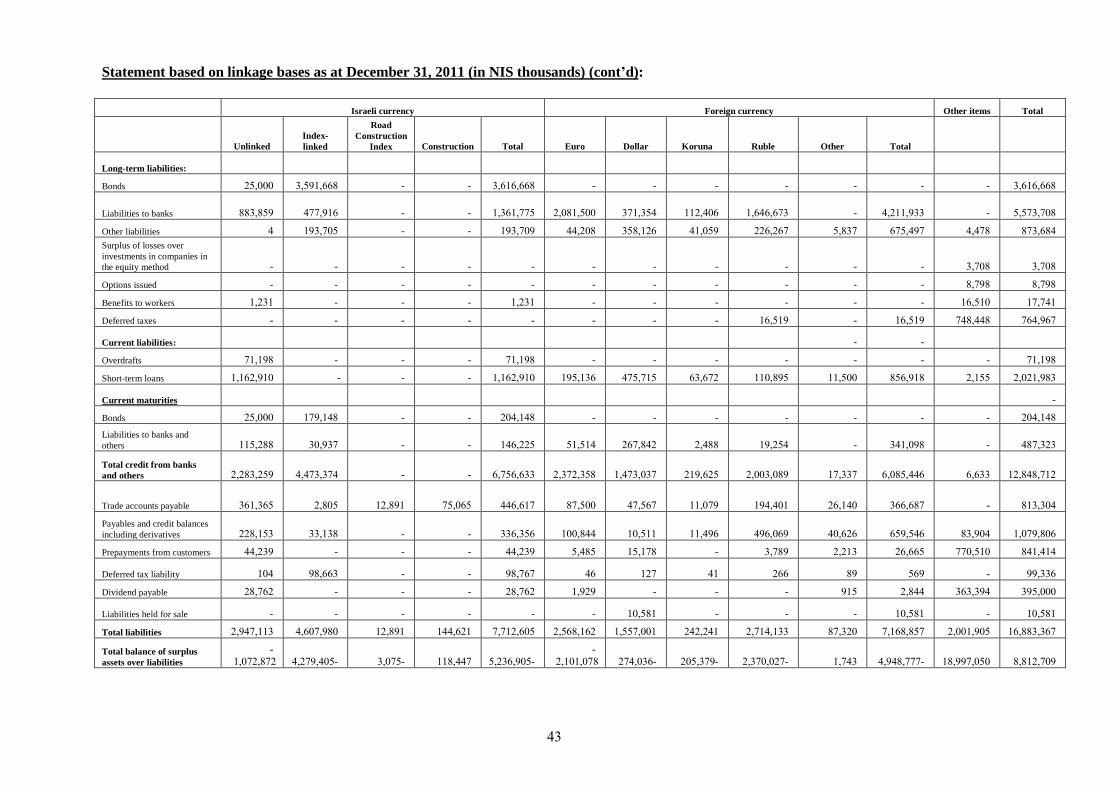
86
Statement based on linkage bases as at December 31, 2011 (in NIS thousands) (cont’d)5
Israeli currency Foreign currency Other items Total
Unlinked Index-
linked
Road
Construction
Index Construction Total Euro Dollar Koruna Ruble Other Total
Long-term liabilities5
Bonds 16,... 6,668,664 - - 6,686,664 - - - - - - - 6,686,664
Liabilities to banks 446,466 855,686 - - 8,668,556 1,.48,6.. 658,668 881,8.6 8,686,656 - 8,188,666 - 6,656,5.4
Other liabilities 8 866,5.6 - - 866,5.6 88,1.4 664,816 88,.66 116,165 6,465 656,865 8,854 456,648 Surplus of losses over
investments in companies in
the equity method - - - - - - - - - - - 6,5.4 6,5.4
Options issued - - - - - - - - - - - 4,564 4,564
Benefits to workers 8,168 - - - 8,168 - - - - - - 86,68. 85,588
Deferred taxes - - - - - - - - 86,686 - 86,686 584,884 568,665
Current liabilities5 - -
Overdrafts 58,864 - - - 58,864 - - - - - - - 58,864
Short-term loans 8,861,68. - - - 8,861,68. 866,866 856,586 66,651 88.,466 88,6.. 466,684 1,866 1,.18,646
Current maturities -
Bonds 16,... 856,884 - - 1.8,884 - - - - - - - 1.8,884 Liabilities to banks and
others 886,144 6.,665 - - 886,116 68,688 165,481 1,844 86,168 - 688,.64 - 845,616
Total credit from banks
and others 1,146,166 8,856,658 - - 6,566,666 1,651,664 8,856,.65 186,616 1,..6,.46 85,665 6,.46,886 6,666 81,484,581
Trade accounts payable 668,666 1,4.6 81,468 56,.66 886,685 45,6.. 85,665 88,.56 868,8.8 16,88. 666,645 - 486,6.8 Payables and credit balances
including derivatives 114,866 66,864 - - 666,666 8..,488 8.,688 88,866 866,.66 8.,616 666,686 46,6.8 8,.56,4.6
Prepayments from customers 88,166 - - - 88,166 6,846 86,854 - 6,546 1,186 16,666 55.,68. 488,888
Deferred tax liability 8.8 64,666 - - 64,565 86 815 88 166 46 666 - 66,666
Dividend payable 14,561 - - - 14,561 8,616 - - - 686 1,488 666,668 666,...
Liabilities held for sale - - - - - - 8.,648 - - - 8.,648 - 8.,648
Total liabilities 1,685,886 8,6.5,64. 81,468 888,618 5,581,6.6 1,664,861 8,665,..8 181,188 1,588,866 45,61. 5,864,465 1,..8,6.6 86,446,665
Total balance of surplus
assets over liabilities -
8,.51,451 -8,156,8.6 -6,.56 884,885 -6,166,6.6 -
1,8.8,.54 -158,.66 -1.6,656 -1,65.,.15 8,586 -8,684,555 84,665,.6. 4,481,5.6
88
5. Sensitivity Tests
Pursuant to the provisions of the Second Addendum to the Securities Regulations (Periodic and
Immediate Reports) 1970, the Company is required to perform sensitivity analyses with respect to
changes in risk factors impacting the fair value of ―sensitive instruments‖.
Description of parameters, assumptions, and models
The fair value of the financial instruments is determined as follows:
1. For every equity item, fair value includes only the fair value of the financial instruments whose
value is sensitive to that market factor to a material extent.
2. The fair value of short-term financial assets is determined based on their nominal values in NIS
or on their foreign-currency values multiplied by the representative rate of exchange on the
reporting date.
3. The fair value of the index-linked financial instruments is determined based on the known
index on the reporting date.
4. The fair value of securities held as short-term investments is determined based on the stock
market value on the reporting date.
5. The fair value of loans is calculated by discounting future cash flows at an annual interest rate,
at the interest received or that would have been received by the Company on loans for similar
periods on the reporting date.
6. The sensitivity analysis on long-term loans at variable interest is performed on the fixed
interest component.
7. The analysis of loans having no determined maturity is performed based on a projection of the
Company’s payments. If no maturity date is determined as at the reporting date, the loan is
taken at its book value.
8. In loans in which the counter-party is permitted to choose the timing of payment of an amount,
the liability is included on the basis of the earliest date on which the Company may be required
to make a payment.
9. According to our estimates of the stress tests on interest rates, the analysis was performed for
extreme changes of 50% in interest rates.
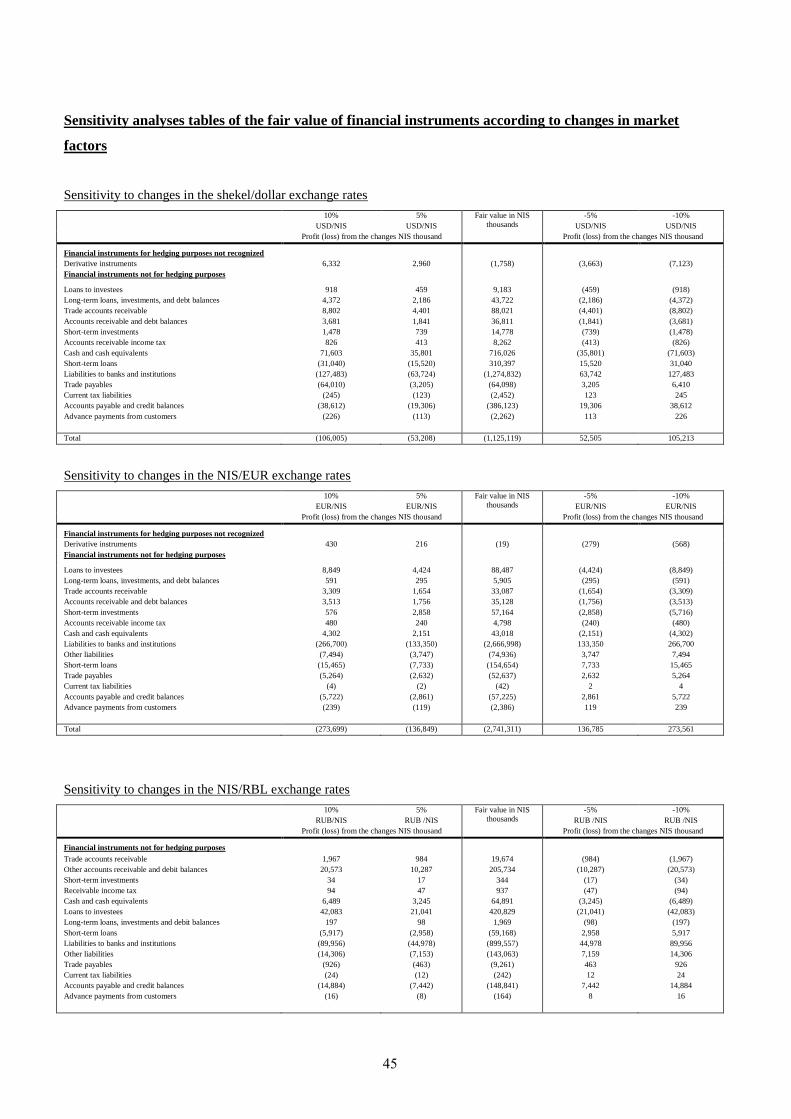
86
Sensitivity analyses tables of the fair value of financial instruments according to changes in market
factors
Sensitivity to changes in the shekel/dollar exchange rates
10%
USD/NIS
5%
USD/NIS
Fair value in NIS
thousands
-5%
USD/NIS
-10%
USD/NIS
Profit (loss) from the changes NIS thousand Profit (loss) from the changes NIS thousand
Financial instruments for hedging purposes not recognized
Derivative instruments 6,332 2,960 (1,758) (3,663) (7,123)
Financial instruments not for hedging purposes
Loans to investees
Long-term loans, investments, and debt balances
Trade accounts receivable
Accounts receivable and debt balances
Short-term investments
Accounts receivable income tax
Cash and cash equivalents
Short-term loans
Liabilities to banks and institutions
Trade payables
Current tax liabilities
Accounts payable and credit balances
Advance payments from customers
918
4,372
8,802
3,681
1,478
826
71,603
(31,040)
(127,483)
(64,010)
(245)
(38,612)
(226)
459
2,186
4,401
1,841
739
413
35,801
(15,520)
(63,724)
(3,205)
(123)
(19,306)
(113)
9,183
43,722
88,021
36,811
14,778
8,262
716,026
310,397
(1,274,832)
(64,098)
(2,452)
(386,123)
(2,262)
(459)
(2,186)
(4,401)
(1,841)
(739)
(413)
(35,801)
15,520
63,742
3,205
123
19,306
113
(918)
(4,372)
(8,802)
(3,681)
(1,478)
(826)
(71,603)
31,040
127,483
6,410
245
38,612
226
Total (106,005) (53,208) (1,125,119) 52,505 105,213
Sensitivity to changes in the NIS/EUR exchange rates
10%
EUR/NIS
5%
EUR/NIS
Fair value in NIS
thousands
-5%
EUR/NIS
-10%
EUR/NIS
Profit (loss) from the changes NIS thousand Profit (loss) from the changes NIS thousand
Financial instruments for hedging purposes not recognized
Derivative instruments 430 216 (19) (279) (568)
Financial instruments not for hedging purposes
Loans to investees
Long-term loans, investments, and debt balances
Trade accounts receivable
Accounts receivable and debt balances
Short-term investments
Accounts receivable income tax
Cash and cash equivalents
Liabilities to banks and institutions
Other liabilities
Short-term loans
Trade payables
Current tax liabilities
Accounts payable and credit balances
Advance payments from customers
8,849
591
3,309
3,513
576
480
4,302
(266,700)
(7,494)
(15,465)
(5,264)
(4)
(5,722)
(239)
4,424
295
1,654
1,756
2,858
240
2,151
(133,350)
(3,747)
(7,733)
(2,632)
(2)
(2,861)
(119)
88,487
5,905
33,087
35,128
57,164
4,798
43,018
(2,666,998)
(74,936)
(154,654)
(52,637)
(42)
(57,225)
(2,386)
(4,424)
(295)
(1,654)
(1,756)
(2,858)
(240)
(2,151)
133,350
3,747
7,733
2,632
2
2,861
119
(8,849)
(591)
(3,309)
(3,513)
(5,716)
(480)
(4,302)
266,700
7,494
15,465
5,264
4
5,722
239
Total (273,699) (136,849) (2,741,311) 136,785 273,561
Sensitivity to changes in the NIS/RBL exchange rates
10%
RUB/NIS
5%
RUB /NIS
Fair value in NIS
thousands
-5%
RUB /NIS
-10%
RUB /NIS
Profit (loss) from the changes NIS thousand Profit (loss) from the changes NIS thousand
Financial instruments not for hedging purposes
Trade accounts receivable
Other accounts receivable and debit balances
Short-term investments
Receivable income tax
Cash and cash equivalents
Loans to investees
Long-term loans, investments and debit balances
Short-term loans
Liabilities to banks and institutions
Other liabilities
Trade payables
Current tax liabilities
Accounts payable and credit balances
Advance payments from customers
1,967
20,573
34
94
6,489
42,083
197
(5,917)
(89,956)
(14,306)
(926)
(24)
(14,884)
(16)
984
10,287
17
47
3,245
21,041
98
(2,958)
(44,978)
(7,153)
(463)
(12)
(7,442)
(8)
19,674
205,734
344
937
64,891
420,829
1,969
(59,168)
(899,557)
(143,063)
(9,261)
(242)
(148,841)
(164)
(984)
(10,287)
(17)
(47)
(3,245)
(21,041)
(98)
2,958
44,978
7,159
463
12
7,442
8
(1,967)
(20,573)
(34)
(94)
(6,489)
(42,083)
(197)
5,917
89,956
14,306
926
24
14,884
16
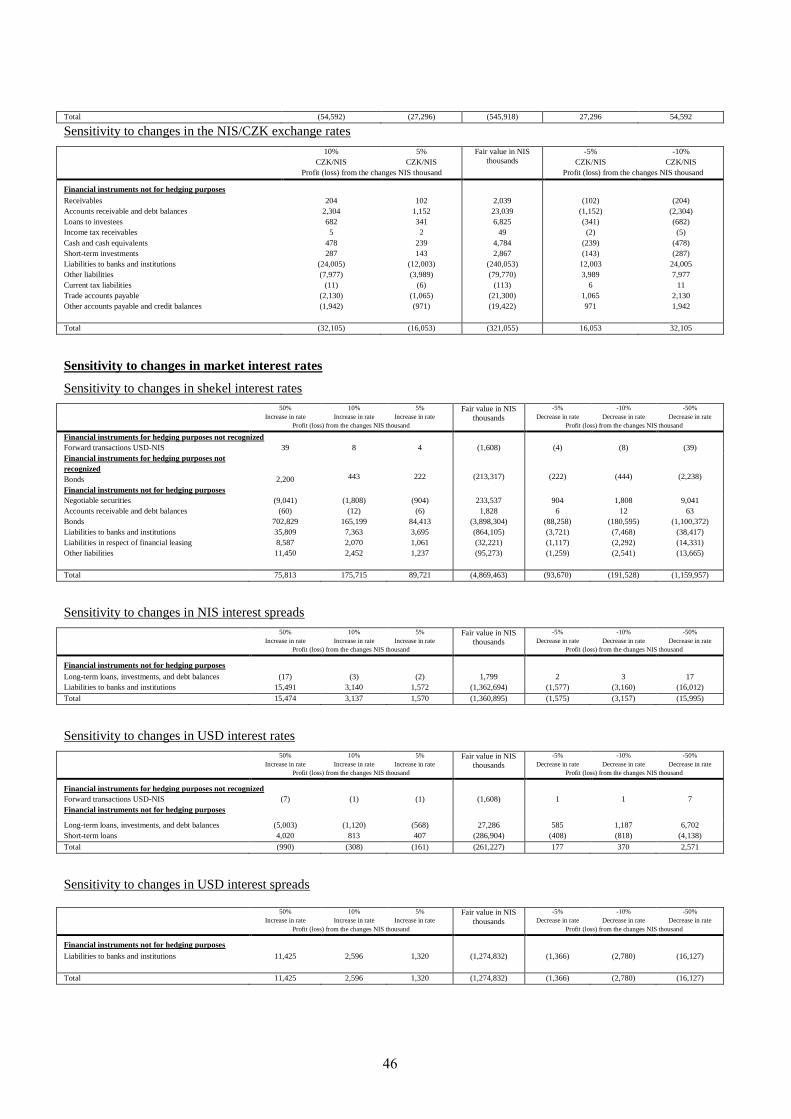
86
Total (54,592) (27,296) (545,918) 27,296 54,592
Sensitivity to changes in the NIS/CZK exchange rates
10%
CZK/NIS
5%
CZK/NIS
Fair value in NIS
thousands
-5%
CZK/NIS
-10%
CZK/NIS
Profit (loss) from the changes NIS thousand Profit (loss) from the changes NIS thousand
Financial instruments not for hedging purposes
Receivables
Accounts receivable and debt balances
Loans to investees
Income tax receivables
Cash and cash equivalents
Short-term investments
Liabilities to banks and institutions
Other liabilities
Current tax liabilities
Trade accounts payable
Other accounts payable and credit balances
204
2,304
682
5
478
287
(24,005)
(7,977)
(11)
(2,130)
(1,942)
102
1,152
341
2
239
143
(12,003)
(3,989)
(6)
(1,065)
(971)
2,039
23,039
6,825
49
4,784
2,867
(240,053)
(79,770)
(113)
(21,300)
(19,422)
(102)
(1,152)
(341)
(2)
(239)
(143)
12,003
3,989
6
1,065
971
(204)
(2,304)
(682)
(5)
(478)
(287)
24,005
7,977
11
2,130
1,942
Total (32,105) (16,053) (321,055) 16,053 32,105
Sensitivity to changes in market interest rates
Sensitivity to changes in shekel interest rates
50%
Increase in rate
10%
Increase in rate
5%
Increase in rate
Fair value in NIS
thousands
-5%
Decrease in rate
-10%
Decrease in rate
-50%
Decrease in rate
Profit (loss) from the changes NIS thousand Profit (loss) from the changes NIS thousand
Financial instruments for hedging purposes not recognized
Forward transactions USD-NIS 39 8 4 (1,608) (4) (8) (39)
Financial instruments for hedging purposes not
recognized
Bonds
Financial instruments not for hedging purposes
2,200
443
222
(213,317)
(222)
(444)
(2,238)
Negotiable securities
Accounts receivable and debt balances
Bonds
Liabilities to banks and institutions
Liabilities in respect of financial leasing
Other liabilities
(9,041)
(60)
702,829
35,809
8,587
11,450
(1,808)
(12)
165,199
7,363
2,070
2,452
(904)
(6)
84,413
3,695
1,061
1,237
233,537
1,828
(3,898,304)
(864,105)
(32,221)
(95,273)
904
6
(88,258)
(3,721)
(1,117)
(1,259)
1,808
12
(180,595)
(7,468)
(2,292)
(2,541)
9,041
63
(1,100,372)
(38,417)
(14,331)
(13,665)
Total 75,813 175,715 89,721 (4,869,463) (93,670) (191,528) (1,159,957)
Sensitivity to changes in NIS interest spreads
50%
Increase in rate
10%
Increase in rate
5%
Increase in rate
Fair value in NIS
thousands
-5%
Decrease in rate
-10%
Decrease in rate
-50%
Decrease in rate
Profit (loss) from the changes NIS thousand Profit (loss) from the changes NIS thousand
Financial instruments not for hedging purposes
Long-term loans, investments, and debt balances
Liabilities to banks and institutions
(17)
15,491
(3)
3,140
(2)
1,572
1,799
(1,362,694)
2
(1,577)
3
(3,160)
17
(16,012)
Total 15,474 3,137 1,570 (1,360,895) (1,575) (3,157) (15,995)
Sensitivity to changes in USD interest rates
50%
Increase in rate
10%
Increase in rate
5%
Increase in rate
Fair value in NIS
thousands
-5%
Decrease in rate
-10%
Decrease in rate
-50%
Decrease in rate
Profit (loss) from the changes NIS thousand Profit (loss) from the changes NIS thousand
Financial instruments for hedging purposes not recognized
Forward transactions USD-NIS (7) (1) (1) (1,608) 1 1 7
Financial instruments not for hedging purposes
Long-term loans, investments, and debt balances
Short-term loans
(5,003)
4,020
(1,120)
813
(568)
407
27,286
(286,904)
585
(408)
1,187
(818)
6,702
(4,138)
Total (990) (308) (161) (261,227) 177 370 2,571
Sensitivity to changes in USD interest spreads
50%
Increase in rate
10%
Increase in rate
5%
Increase in rate
Fair value in NIS
thousands
-5%
Decrease in rate
-10%
Decrease in rate
-50%
Decrease in rate
Profit (loss) from the changes NIS thousand Profit (loss) from the changes NIS thousand
Financial instruments not for hedging purposes
Liabilities to banks and institutions
11,425 2,596 1,320 (1,274,832) (1,366) (2,780) (16,127)
Total 11,425 2,596 1,320 (1,274,832) (1,366) (2,780) (16,127)
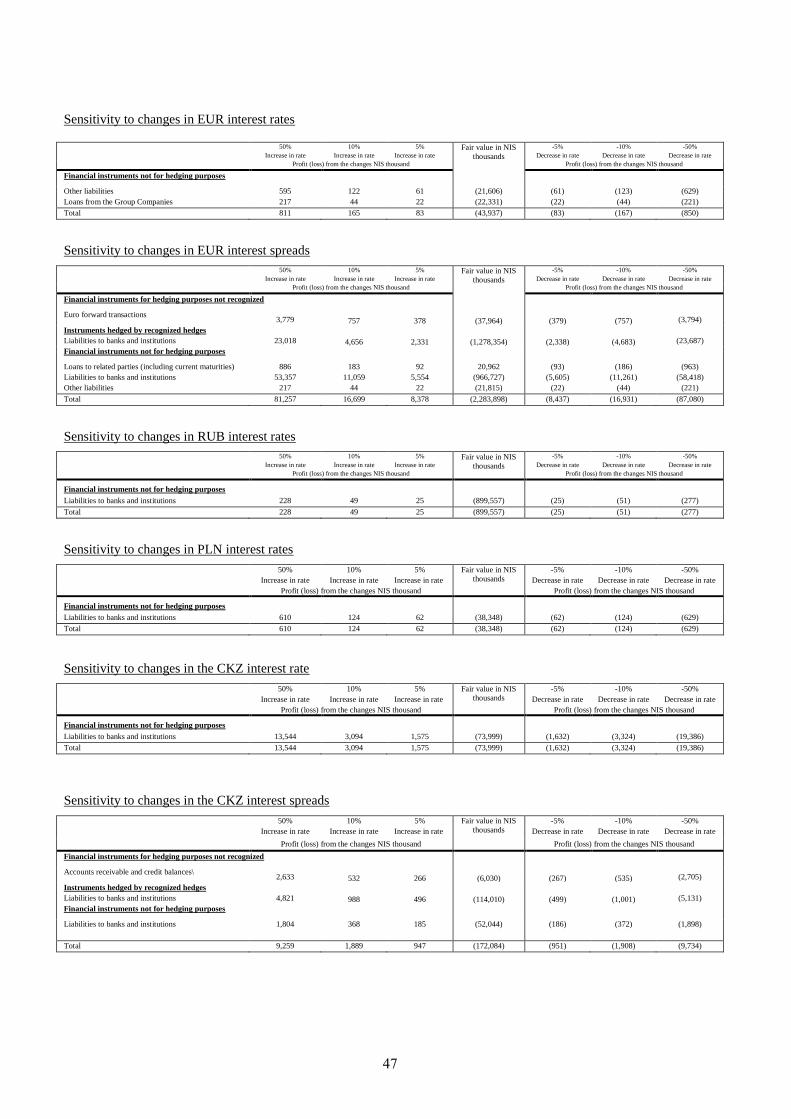
85
Sensitivity to changes in EUR interest rates
50%
Increase in rate
10%
Increase in rate
5%
Increase in rate
Fair value in NIS
thousands
-5%
Decrease in rate
-10%
Decrease in rate
-50%
Decrease in rate
Profit (loss) from the changes NIS thousand Profit (loss) from the changes NIS thousand
Financial instruments not for hedging purposes
Other liabilities
Loans from the Group Companies
595
217
122
44
61
22
(21,606)
(22,331)
(61)
(22)
(123)
(44)
(629)
(221)
Total 811 165 83 (43,937) (83) (167) (850)
Sensitivity to changes in EUR interest spreads
50%
Increase in rate
10%
Increase in rate
5%
Increase in rate
Fair value in NIS
thousands
-5%
Decrease in rate
-10%
Decrease in rate
-50%
Decrease in rate
Profit (loss) from the changes NIS thousand Profit (loss) from the changes NIS thousand
Financial instruments for hedging purposes not recognized
Euro forward transactions 3,779 757 378 (37,964) (379) (757) (3,794)
Instruments hedged by recognized hedges
Liabilities to banks and institutions
23,018 4,656 2,331 (1,278,354) (2,338) (4,683) (23,687)
Financial instruments not for hedging purposes
Loans to related parties (including current maturities)
Liabilities to banks and institutions
Other liabilities
886
53,357
217
183
11,059
44
92
5,554
22
20,962
(966,727)
(21,815)
(93)
(5,605)
(22)
(186)
(11,261)
(44)
(963)
(58,418)
(221)
Total 81,257 16,699 8,378 (2,283,898) (8,437) (16,931) (87,080)
Sensitivity to changes in RUB interest rates
50%
Increase in rate
10%
Increase in rate
5%
Increase in rate
Fair value in NIS
thousands
-5%
Decrease in rate
-10%
Decrease in rate
-50%
Decrease in rate
Profit (loss) from the changes NIS thousand Profit (loss) from the changes NIS thousand
Financial instruments not for hedging purposes
Liabilities to banks and institutions 228 49 25 (899,557) (25) (51) (277)
Total 228 49 25 (899,557) (25) (51) (277)
Sensitivity to changes in PLN interest rates
50%
Increase in rate
10%
Increase in rate
5%
Increase in rate
Fair value in NIS
thousands
-5%
Decrease in rate
-10%
Decrease in rate
-50%
Decrease in rate
Profit (loss) from the changes NIS thousand Profit (loss) from the changes NIS thousand
Financial instruments not for hedging purposes
Liabilities to banks and institutions 610 124 62 (38,348) (62) (124) (629)
Total 610 124 62 (38,348) (62) (124) (629)
Sensitivity to changes in the CKZ interest rate
50%
Increase in rate
10%
Increase in rate
5%
Increase in rate
Fair value in NIS
thousands
-5%
Decrease in rate
-10%
Decrease in rate
-50%
Decrease in rate
Profit (loss) from the changes NIS thousand Profit (loss) from the changes NIS thousand
Financial instruments not for hedging purposes
Liabilities to banks and institutions 13,544 3,094 1,575 (73,999) (1,632) (3,324) (19,386)
Total 13,544 3,094 1,575 (73,999) (1,632) (3,324) (19,386)
Sensitivity to changes in the CKZ interest spreads
50%
Increase in rate
10%
Increase in rate
5%
Increase in rate
Fair value in NIS
thousands
-5%
Decrease in rate
-10%
Decrease in rate
-50%
Decrease in rate
Profit (loss) from the changes NIS thousand Profit (loss) from the changes NIS thousand
Financial instruments for hedging purposes not recognized
Accounts receivable and credit balances\ 2,633 532 266 (6,030) (267) (535) (2,705)
Instruments hedged by recognized hedges
Liabilities to banks and institutions 4,821 988 496 (114,010) (499) (1,001) (5,131)
Financial instruments not for hedging purposes
Liabilities to banks and institutions
1,804 368 185 (52,044) (186) (372) (1,898)
Total 9,259 1,889 947 (172,084) (951) (1,908) (9,734)
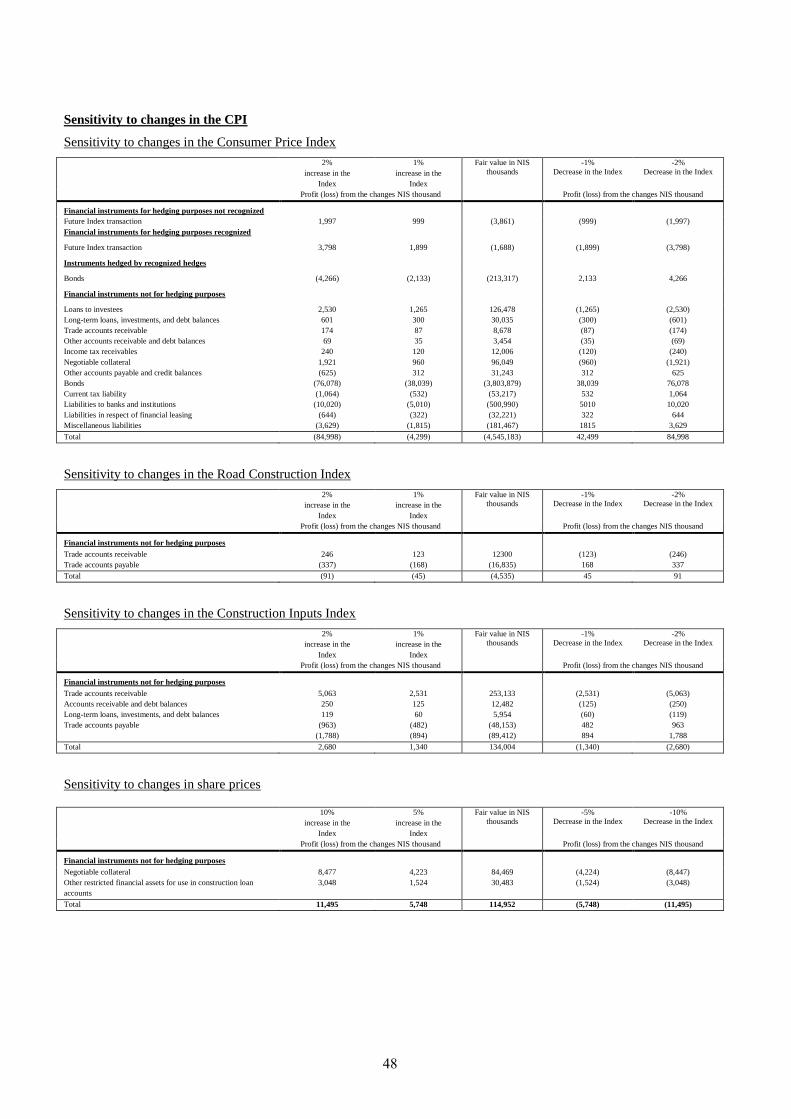
84
Sensitivity to changes in the CPI
Sensitivity to changes in the Consumer Price Index
2%
increase in the
Index
1%
increase in the
Index
Fair value in NIS
thousands
-1%
Decrease in the Index
-2%
Decrease in the Index
Profit (loss) from the changes NIS thousand Profit (loss) from the changes NIS thousand
Financial instruments for hedging purposes not recognized
Future Index transaction 1,997 999 (3,861) (999) (1,997)
Financial instruments for hedging purposes recognized
Future Index transaction 3,798 1,899 (1,688) (1,899) (3,798)
Instruments hedged by recognized hedges
Bonds (4,266) (2,133) (213,317) 2,133 4,266
Financial instruments not for hedging purposes
Loans to investees
Long-term loans, investments, and debt balances
Trade accounts receivable
Other accounts receivable and debt balances
Income tax receivables
Negotiable collateral
Other accounts payable and credit balances
Bonds
Current tax liability
Liabilities to banks and institutions
Liabilities in respect of financial leasing
Miscellaneous liabilities
2,530
601
174
69
240
1,921
(625)
(76,078)
(1,064)
(10,020)
(644)
(3,629)
1,265
300
87
35
120
960
312
(38,039)
(532)
(5,010)
(322)
(1,815)
126,478
30,035
8,678
3,454
12,006
96,049
31,243
(3,803,879)
(53,217)
(500,990)
(32,221)
(181,467)
(1,265)
(300)
(87)
(35)
(120)
(960)
312
38,039
532
5010
322
1815
(2,530)
(601)
(174)
(69)
(240)
(1,921)
625
76,078
1,064
10,020
644
3,629
Total (84,998) (4,299) (4,545,183) 42,499 84,998
Sensitivity to changes in the Road Construction Index
2%
increase in the
Index
1%
increase in the
Index
Fair value in NIS
thousands
-1%
Decrease in the Index
-2%
Decrease in the Index
Profit (loss) from the changes NIS thousand Profit (loss) from the changes NIS thousand
Financial instruments not for hedging purposes
Trade accounts receivable
Trade accounts payable
246
(337)
123
(168)
12300
(16,835)
(123)
168
(246)
337
Total (91) (45) (4,535) 45 91
Sensitivity to changes in the Construction Inputs Index
2%
increase in the
Index
1%
increase in the
Index
Fair value in NIS
thousands
-1%
Decrease in the Index
-2%
Decrease in the Index
Profit (loss) from the changes NIS thousand Profit (loss) from the changes NIS thousand
Financial instruments not for hedging purposes
Trade accounts receivable
Accounts receivable and debt balances
Long-term loans, investments, and debt balances
Trade accounts payable
5,063
250
119
(963)
(1,788)
2,531
125
60
(482)
(894)
253,133
12,482
5,954
(48,153)
(89,412)
(2,531)
(125)
(60)
482
894
(5,063)
(250)
(119)
963
1,788
Total 2,680 1,340 134,004 (1,340) (2,680)
Sensitivity to changes in share prices
10%
increase in the
Index
5%
increase in the
Index
Fair value in NIS
thousands
-5%
Decrease in the Index
-10%
Decrease in the Index
Profit (loss) from the changes NIS thousand Profit (loss) from the changes NIS thousand
Financial instruments not for hedging purposes
Negotiable collateral
Other restricted financial assets for use in construction loan
accounts
8,477
3,048
4,223
1,524
84,469
30,483
(4,224)
(1,524)
(8,447)
(3,048)
Total 11,495 5,748 114,952 (5,748) (11,495)
86
Chapter C – Corporate Governance
1. Charitable Contributions Policy
As part of the assistance it provides to the community, the Company is accustomed to contribute to
various causes. The amount contributed by the consolidated Group in was NIS 17,046 thousand,
NIS 17,798 thousand, and 15,982 thousand in 2012, 2011, and 2010, respectively. Of the above
total, NIS 15,678 thousand, NIS 16,048 thousand, and NIS 15,034 thousand, is permanent support a
subsidiary abroad provides to public institutions of the Jewish community in the CIS.
2. The company’s directors and management
In 2012, there were 31 meetings of the Board of Directors and its committees.
On January 1, 2012, Attorney Larissa Cohen assumed her position as Company Secretary.1
On July 22, 2012, Mr. Avraham Novogrotsky assumed his position as Company CEO,
replacing Mr. Izzy Cohen (who concluded his term as CEO in the Company on this date).
On August 17, 2012, Mr. Rammy Guzman concluded his term as external director of the
Company.
On August 19, 2012, Mr. Giora Ofer was appointed external director of the Company.
On March 17, 2013, Mr. Eitan Raff was appointed director of the Company.
3. Report on the activities of the Internal auditor in 2012
A. Details of the internal auditor
Since July 2009, Mr. Shaul Debi (CPA, MBA) has been the Company’s internal auditor.
The internal auditor is a certified public accountant and member of the Institute of Certified Public
Accountants in Israel. The internal auditor has a BA degree in accounting and finance from the
College of Administration and a graduate degree in finance and systems analysis from Manchester
Business School. The Internal Auditor meets the conditions of Section 146(b) of the Companies
Law and the conditions of Section 8 of the Internal Audit Law.
The Internal Auditor is also the internal auditor of Company subsidiaries, including the public
subsidiaries: Africa Residences, Danya Cebus, Africa Properties, AFI Development, and Africa
Industries.
The internal auditor is a Company employee. The audit team, as at the date of this Periodic Report,
comprises 5 employees (including the internal auditor).
B. Method of appointment
The appointment of the internal auditor was approved by the Company’s Board of Directors and the
Audit Committee on July 1, 2009.
1 Ms. Cohen serves as company secretary in several other Group Companies, including Africa Properties, Africa Industries, Africa
Residences and Danya Cebus.
6.
His education, qualifications, and familiarity with the Company are part of the Board of Directors’
reasons for approving the appointment.
C. Identity of the officer responsible for the internal auditor
The officer responsible for the internal auditor is the chairman of the Board of Directors.
D. Work plan
The Company’s internal auditor (in consultation with the Company’s CEO and its Board of
Directors) prepared an annual work plan, which were discussed by the Company’s Audit
Committee and received its approval on January 15, 2012, based on a multi-annual work plan for
four years beginning in 2007. The plan is based on a systematic mapping of the various commercial
units that comprise the Company and the operations with which they are tasked. The effect of the
multi-annual plan was extended, mutandis mutatis, until conclusion of the Company’s risk survey,
on which the Company’s new multi-annual plan will be based.
The annual work plan, which constitutes the detailed formal framework for the audit work, was
derived from the multi-annual work plan. The decision on the annual audit topics was made inter
alia after taking the following factors into consideration:
1. The exposure to risk of the activities, topics and operations;
2. The existence of relevant controls for said topic and the information available regarding the
effectiveness and weaknesses of such controls;
3. The probability that there are operational, managerial and administrative deficiencies;
4. The findings of previous audits and the period of time that has passed since the last audit of
that topic or other relevant topic;
5. The administrative, operational or economic importance of the matter from an internal
control standpoint.
The work plan includes an ad hoc allocation of resources to the audit, giving the internal auditor the
freedom, based on his discretion, to examine other topics not included in the annual work plan.
E. Overseas audits or audits of investees
The internal audit work plan relates to the Company and investee companies as well as to the
Company’s operation outside Israel.
68
F. Work scope
Following are details of the scope of work of the internal audit in 2012, including work outsourced:
Corporation Hours worked in Israel Hours worked outside of
Israel
The Company and its subsidiaries, not
including publicly traded companies
listed below (but including AFI
Development)
1,800 3,200
Africa Residences and its subsidiaries 8,4.. -----
Danya Cebus and its subsidiaries 2,000 -----
Africa Properties and its subsidiaries 800 8,6..
Africa Industries Ltd.* 1,950 6..
* Including Negev Ceramics, which ceased to be a public company in early 2012.
G. Conduct of the audit
The internal audit is conducted, as stated, in accordance with the professional standards generally
accepted in and outside of Israel, as stated in Section 4(b) of the Internal Audit Law 1992, and the
directives published by the Professional Council of the Institute of Internal Auditors in Israel. In the
opinion of the Company’s Board of Directors, considering his professionalism, qualifications, and
his experience, the internal auditor meets the requirements determined in said professional
standards.
H. Access to information
The Company’s Internal Auditor is given free, continuous and direct access to all the information in
the possession of the Company and the companies it controls in and outside of Israel, including
financial data as stated in Section 9 of the Internal Audit Law 1992.
I. Internal auditor’s report
Audit reports are made in writing. Audit reports are submitted to the Company’s CEO and
Chairman of the Board of Directors and are discussed by the Audit Committee.
Following are details of the dates the auditor submitted his reports and the dates of discussions by
the Audit Committee in the reporting period, reports the auditing work in respect of which was
done during the year but were not detailed in that context prior to being brought for discussion:
61
J. The Board of Director’s assessment of the internal auditor’s activities
The Company’s Audit Committee and Board of Directors consider that the scope, nature and
continuity of the Internal Auditor’s activities, as well as his work plan, are reasonable and are
sufficient to achieve the goals of the Company’s internal audit .
K. Remuneration
The remuneration of the internal auditor, including the audit team, is by means of a monthly salary.
It was furthermore noted that under the Company’s Option Plan (as stated in Section 1.17.6.2(B)(4)
of the Description of the Company’s Business), the internal auditor was issued 82,843 options,
convertible into Company shares. Furthermore, under the annual 2012 Bonus Plan, as stated in
Section 1.17.6.2(B)(5) of the Description of the Company’s Business, subject to meeting targets,
the internal auditor is entitled to an annual bonus of up to 4.5 monthly salaries. On March 21, 2013,
the Company’s Board of Directors approved a bonus to the internal auditor in the amount of NIS
94,000 for 2012. For additional information, see Section 1.17.6.2(B)(5) of the Description of the
Company’s Business.
The Company’s Board of Directors considers that the internal auditor’s remuneration does not
affect his professional discretion while conducting the audit .
4. Details of the auditing accountant’s fees
In recent years the work of auditing the financial statements of Africa Israel’s Group Companies
has been performed jointly by KPMG – Somekh Chaikin and Deloitte – Brightman Almagor Zohar
& Associates. As part of a re-examination of the arrangements for the audit in the Group
Report # Date submitted Date discussed
Report 1 March 2012 March 2012
Report 2 March 2012 March 2012
Report 3 March 2012 March 2012
Report 4 April 2012 July 2012
Report 5 March 2012 August 2012
Report 6 May 2012 August 2012
Report 7 August 2012 August 2012
Report 8 August 2012 August 2012
Report 9 May 2012 October 2012
Report 10 May 2012 October 2012
Report 11 October 2012 November 2012
Report 12 October 2012 December 2012
Report 13 December 2012 December 2012
66
Companies conducted jointly by the auditing accountants, the parties came to an agreement that for
Group Companies whose operations were mainly in Israel the conduct of the audit jointly by both
firms is in excess of requirements and even creates complications and causes delays in the
preparation of the Financial Statements.
Consequently, it was decided that for said companies the auditing work would be conducted by one
firm of accountants in coordination with the auditing accountants. The auditing work was
redistributed among the companies in the Company’s Group. It should be mentioned that for Africa
Properties, whose operations are mainly global, auditing work will continue to be done jointly by
both firms of accountants.
In accordance with the above, the auditing work for the publicly traded companies in the Group
Companies, in Israel, is performed as follows:
For the Company – KPMG and Deloitte (unchanged);
Africa Properties – KPMG and Deloitte (unchanged);
Africa Residences – Deloitte;
Danya Cebus – KPMG;
Africa Industries – KPMG;
Negev Ceramics – KPMG.
It should also be mentioned that for AFI Hotels, a private company, auditing work is being
performed by Deloitte.
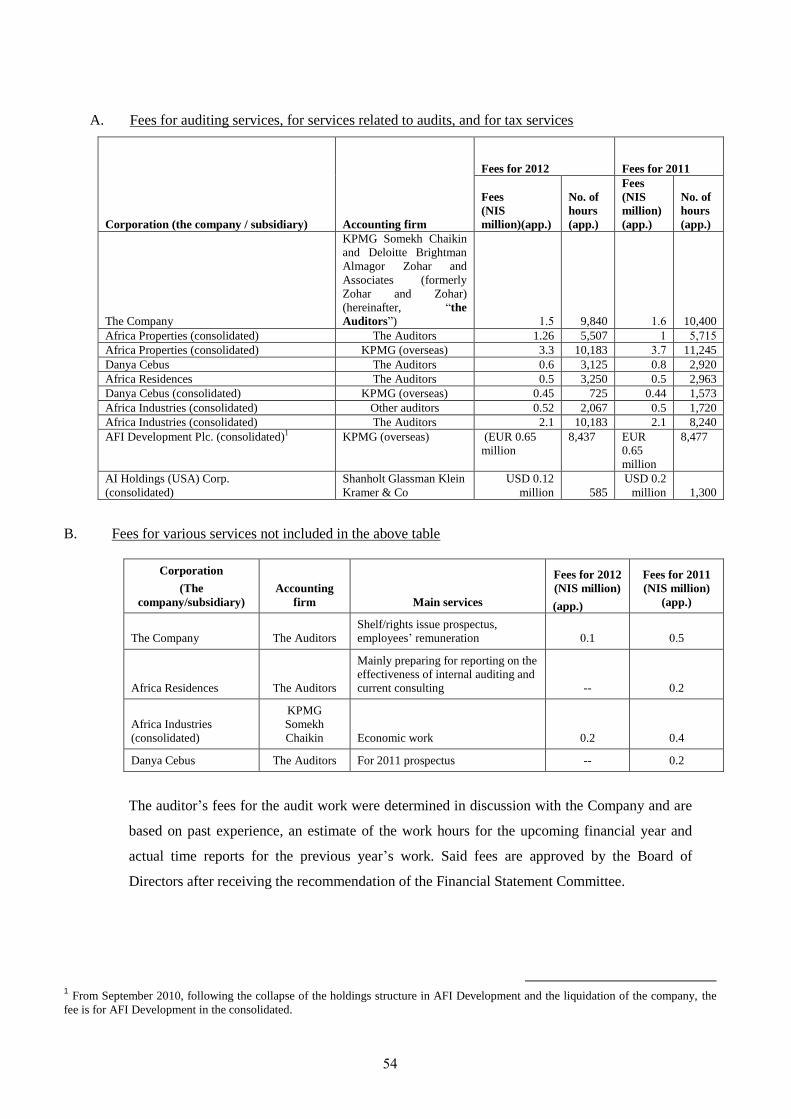
68
A. Fees for auditing services, for services related to audits, and for tax services
Corporation (the company / subsidiary) Accounting firm
Fees for 2012
Fees for 2011
Fees
(NIS
million)(app.)
No. of
hours
(app.)
Fees
(NIS
million)
(app.)
No. of
hours
(app.)
The Company
KPMG Somekh Chaikin
and Deloitte Brightman
Almagor Zohar and
Associates (formerly
Zohar and Zohar)
(hereinafter, ―the
Auditors‖) 8.6 9,840 8.6 10,400
Africa Properties (consolidated) The Auditors 1.26 5,507 8 6,586
Africa Properties (consolidated) KPMG (overseas) 3.3 10,183 6.5 11,245
Danya Cebus The Auditors 0.6 3,125 0.8 2,920
Africa Residences The Auditors 0.5 3,250 0.5 2,963
Danya Cebus (consolidated) KPMG (overseas) 0.45 725 0.44 1,573
Africa Industries (consolidated) Other auditors 0.52 2,067 0.5 1,720
Africa Industries (consolidated) The Auditors 2.1 10,183 2.1 8,240
AFI Development Plc. (consolidated)1 KPMG (overseas) (EUR 0.65
million
8,437 EUR
0.65
million
8,477
AI Holdings (USA) Corp.
(consolidated)
Shanholt Glassman Klein
Kramer & Co
USD 0.12
million 585
USD 0.2
million 1,300
B. Fees for various services not included in the above table
Corporation
(The
company/subsidiary)
Accounting
firm Main services
Fees for 2012
(NIS million)
(app.)
Fees for 2011
(NIS million)
(app.)
The Company The Auditors
Shelf/rights issue prospectus,
employees’ remuneration ..1 ..5
Africa Residences The Auditors
Mainly preparing for reporting on the
effectiveness of internal auditing and
current consulting -- ..2
Africa Industries
(consolidated)
KPMG
Somekh
Chaikin Economic work 0.2 0.4
Danya Cebus The Auditors For 2011 prospectus -- 0.2
The auditor’s fees for the audit work were determined in discussion with the Company and are
based on past experience, an estimate of the work hours for the upcoming financial year and
actual time reports for the previous year’s work. Said fees are approved by the Board of
Directors after receiving the recommendation of the Financial Statement Committee.
1 From September 2010, following the collapse of the holdings structure in AFI Development and the liquidation of the company, the
fee is for AFI Development in the consolidated.
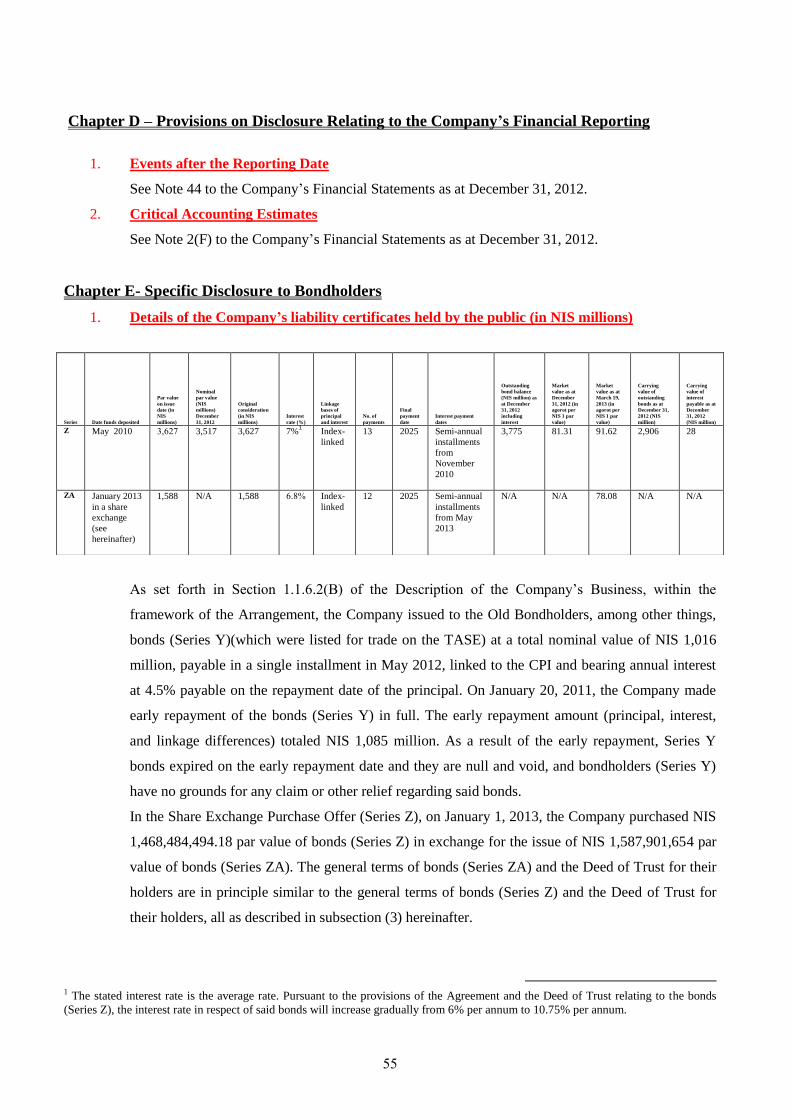
66
Chapter D – Provisions on Disclosure Relating to the Company’s Financial Reporting
1. Events after the Reporting Date
See Note 44 to the Company’s Financial Statements as at December 31, 2012.
2. Critical Accounting Estimates
See Note 2(F) to the Company’s Financial Statements as at December 31, 2012.
Chapter E- Specific Disclosure to Bondholders
1. Details of the Company’s liability certificates held by the public (in NIS millions)
As set forth in Section 1.1.6.2(B) of the Description of the Company’s Business, within the
framework of the Arrangement, the Company issued to the Old Bondholders, among other things,
bonds (Series Y)(which were listed for trade on the TASE) at a total nominal value of NIS 1,016
million, payable in a single installment in May 2012, linked to the CPI and bearing annual interest
at 4.5% payable on the repayment date of the principal. On January 20, 2011, the Company made
early repayment of the bonds (Series Y) in full. The early repayment amount (principal, interest,
and linkage differences) totaled NIS 1,085 million. As a result of the early repayment, Series Y
bonds expired on the early repayment date and they are null and void, and bondholders (Series Y)
have no grounds for any claim or other relief regarding said bonds.
In the Share Exchange Purchase Offer (Series Z), on January 1, 2013, the Company purchased NIS
1,468,484,494.18 par value of bonds (Series Z) in exchange for the issue of NIS 1,587,901,654 par
value of bonds (Series ZA). The general terms of bonds (Series ZA) and the Deed of Trust for their
holders are in principle similar to the general terms of bonds (Series Z) and the Deed of Trust for
their holders, all as described in subsection (3) hereinafter.
1 The stated interest rate is the average rate. Pursuant to the provisions of the Agreement and the Deed of Trust relating to the bonds
(Series Z), the interest rate in respect of said bonds will increase gradually from 6% per annum to 10.75% per annum.
Series Date funds deposited
Par value
on issue
date (in
NIS
millions)
Nominal
par value
(NIS
millions)
December
31, 2012
Original
consideration
(in NIS
millions)
Interest
rate (%)
Linkage
bases of
principal
and interest
No. of
payments
Final
payment
date
Interest payment
dates
Outstanding
bond balance
(NIS million) as
at December
31, 2012
including
interest
Market
value as at
December
31, 2012 (in
agorot per
NIS 1 par
value)
Market
value as at
March 19,
2013 (in
agorot per
NIS 1 par
value)
Carrying
value of
outstanding
bonds as at
December 31,
2012 (NIS
million)
Carrying
value of
interest
payable as at
December
31, 2012
(NIS million)
Z May 2010 6,615
3,517 3,627 7%1 Index-
linked
13 2025 Semi-annual
installments
from
November
2010
3,775 81.31 91.62 2,906 28
ZA January 2013
in a share
exchange
(see
hereinafter)
1,588 N/A 1,588 6.4% Index-
linked
12 2025 Semi-annual
installments
from May
2013
N/A N/A 78.08 N/A N/A
66
Regarding the bonds listed in the above table, the following should be noted:
A. Rating
Bonds (Series Z)
As part of the Company’s undertakings in the Arrangement and the Deed of Trust for bonds (Series
Z), the Company undertook to have its bonds (Series Z) rated by a rating company approved by the
Commissioner of the Capital Market no later than one year after the determining date for the
Arrangement (i.e., May 12, 2010), and to continue to have its bonds rated by a company approved
by the Commissioner of the Capital Market throughout the entire period of the bonds. On April
12,2011, Midroog Ltd (hereinafter, ―Midroog‖) published a preliminary rating report for bonds
(Series Z), in which said bonds were rated Baa2 (Ref. # 201-01-119025).
On March 29, 2012, the Company announced that Midroog published a rating report in which it
raised the rating of bonds (Series Z) to Baa1. For details see the immediate report published by the
Company on March 29, 2012 (Ref. # 2011-01-084903).
Subsequently, on August 13, 2012, the Company announced that Midroog published a rating report
in which it retained the rating of bonds (Series Z) at Baa1. For details see the immediate report
published by the Company on August 13, 2012 (Ref. # 2011-01-208923).
Bonds (Series ZA)
In the Deed of Trust for bondholders (Series ZA), attached as Appendix B to Chapter 2 of the
Company’s shelf prospectus dated May 9, 2011 and amended May 28,2012 and December 18,
2012, the Company undertook to take steps to have bonds (Series ZA) rated by a rating company
recognized by the Commissioner of the Capital Market.
Consequently, on May 29, 2012, Midroog approved the rating of Baa1 with a positive horizon for
issue of a new Series (ZA) in exchange for a portion of the bonds (Series Z), as an outline for an
exchange that includes early repayment of a portion of the outstanding bond debt in 2013-2015. For
additional information see immediate report dated May 29, 2012 (Re. # 2012-01-137736).
Midroog’s approval that the above rating is in effect as at December 18, 2012, is attached as
Appendix C to the shelf offer published by the Company on December 18, 2012 (and amended
December 26, 2012).
B. Collateral
To secure the Company’s undertakings pursuant to the Bonds (Series Z and ZA), the Company
created the collateral specified in the Arrangement, the Share Exchange Purchase Offer, and the
Deeds of Trust for bondholders (Series Z and ZA), all as set forth in Section 1.22.2.5(B) of the
Description of the Company’s Business.
65
C. Early redemption
(1) Under the Arrangement, provisions were determined concerning the early repayment of bonds
(Series Z), whether the Company elects to make said early repayment, or whether the Company is
obligated to make said early repayment.
AS noted above, on January 20, 2011, the Company made full early repayment of bonds (Series Y).
The amount (principal, interest, and linkage differences) of the early repayment was NIS 1,085
million. As a result of the early repayment, Series Y bonds expired on the early repayment date and
they are null and void, and bondholders (Series Y) have no grounds for any claim or other relief
regarding said bonds.
(2) Furthermore, provisions concerning early repayment of bonds (Series Z and ZA) were determined,
whether the Company elects or is obligated to make said early repayment. Also determined were
provisions concerning compensation for bondholders (Series Z and ZA)(in specific cases) in respect
of voluntary early repayment of bonds (Series Z and ZA). Following are the main provisions in this
matter:
1. In any event that the Company and/or any Group company receives, during the term of the
bonds (Series Z and ZA) funds from the sale of the pledged assets (in part or in entirety), the
net proceeds (defined in the Arrangement) will be divided between bondholders (Series ZA)
and bondholders (Series ZA) pro rata to the pari amount of debt of the bonds (Series Z and
ZA) on the sale date, and the Company will be obligated to make early repayment of the
balance of the bonds (Series Z and ZA), either in part or in entirety), in an amount equal to
the share of the bondholders (Series Z and ZA) in the net proceeds.
The early repayment will take place without any compensation in respect of early
repayment, according to the value of the liability in respect of the balance of bonds (Series Z
and ZA) on the effective repayment date (the pari value of the total debt including principal,
interest and linkage differences until the early repayment date). In this matter, early
repayment can and will take place, at the Company’s discretion in the following manner: (a)
early repayment of the bonds (Series Z and ZA); or (b) deposit with the trustee of the bonds
(Series Z and ZA) for the purpose of future payment/s according to the payment dates of the
bonds (Series Z and ZA); or (c) buy-back of the bonds (Series Z and ZA) in the form of a
purchase offer.
2. Furthermore, the Company may at any time during the term of the bonds (Series Z and ZA),
but no more than once every calendar quarter, give notice of early repayment, either partial
or complete, of the outstanding balance of the bonds (Series Z and ZA) and all the interest
accrued on the principal of the bonds (Series Z and ZA) and linkage differences on said
principal and interest, until the early repayment date, provided that the minimum amount for
early repayment is not less than NIS 50 million.
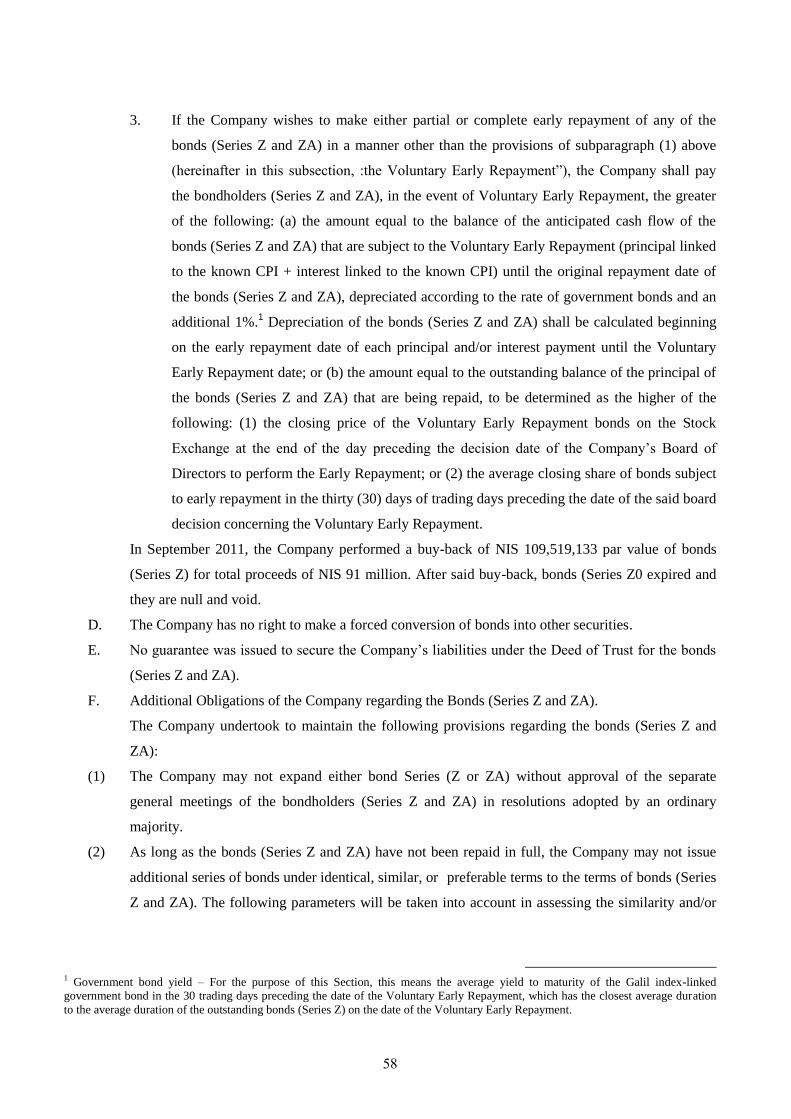
64
3. If the Company wishes to make either partial or complete early repayment of any of the
bonds (Series Z and ZA) in a manner other than the provisions of subparagraph (1) above
(hereinafter in this subsection, :the Voluntary Early Repayment‖), the Company shall pay
the bondholders (Series Z and ZA), in the event of Voluntary Early Repayment, the greater
of the following: (a) the amount equal to the balance of the anticipated cash flow of the
bonds (Series Z and ZA) that are subject to the Voluntary Early Repayment (principal linked
to the known CPI + interest linked to the known CPI) until the original repayment date of
the bonds (Series Z and ZA), depreciated according to the rate of government bonds and an
additional 1%.1 Depreciation of the bonds (Series Z and ZA) shall be calculated beginning
on the early repayment date of each principal and/or interest payment until the Voluntary
Early Repayment date; or (b) the amount equal to the outstanding balance of the principal of
the bonds (Series Z and ZA) that are being repaid, to be determined as the higher of the
following: (1) the closing price of the Voluntary Early Repayment bonds on the Stock
Exchange at the end of the day preceding the decision date of the Company’s Board of
Directors to perform the Early Repayment; or (2) the average closing share of bonds subject
to early repayment in the thirty (30) days of trading days preceding the date of the said board
decision concerning the Voluntary Early Repayment.
In September 2011, the Company performed a buy-back of NIS 109,519,133 par value of bonds
(Series Z) for total proceeds of NIS 91 million. After said buy-back, bonds (Series Z0 expired and
they are null and void.
D. The Company has no right to make a forced conversion of bonds into other securities.
E. No guarantee was issued to secure the Company’s liabilities under the Deed of Trust for the bonds
(Series Z and ZA).
F. Additional Obligations of the Company regarding the Bonds (Series Z and ZA).
The Company undertook to maintain the following provisions regarding the bonds (Series Z and
ZA):
(1) The Company may not expand either bond Series (Z or ZA) without approval of the separate
general meetings of the bondholders (Series Z and ZA) in resolutions adopted by an ordinary
majority.
(2) As long as the bonds (Series Z and ZA) have not been repaid in full, the Company may not issue
additional series of bonds under identical, similar, or preferable terms to the terms of bonds (Series
Z and ZA). The following parameters will be taken into account in assessing the similarity and/or
1 Government bond yield – For the purpose of this Section, this means the average yield to maturity of the Galil index-linked
government bond in the 30 trading days preceding the date of the Voluntary Early Repayment, which has the closest average duration
to the average duration of the outstanding bonds (Series Z) on the date of the Voluntary Early Repayment.
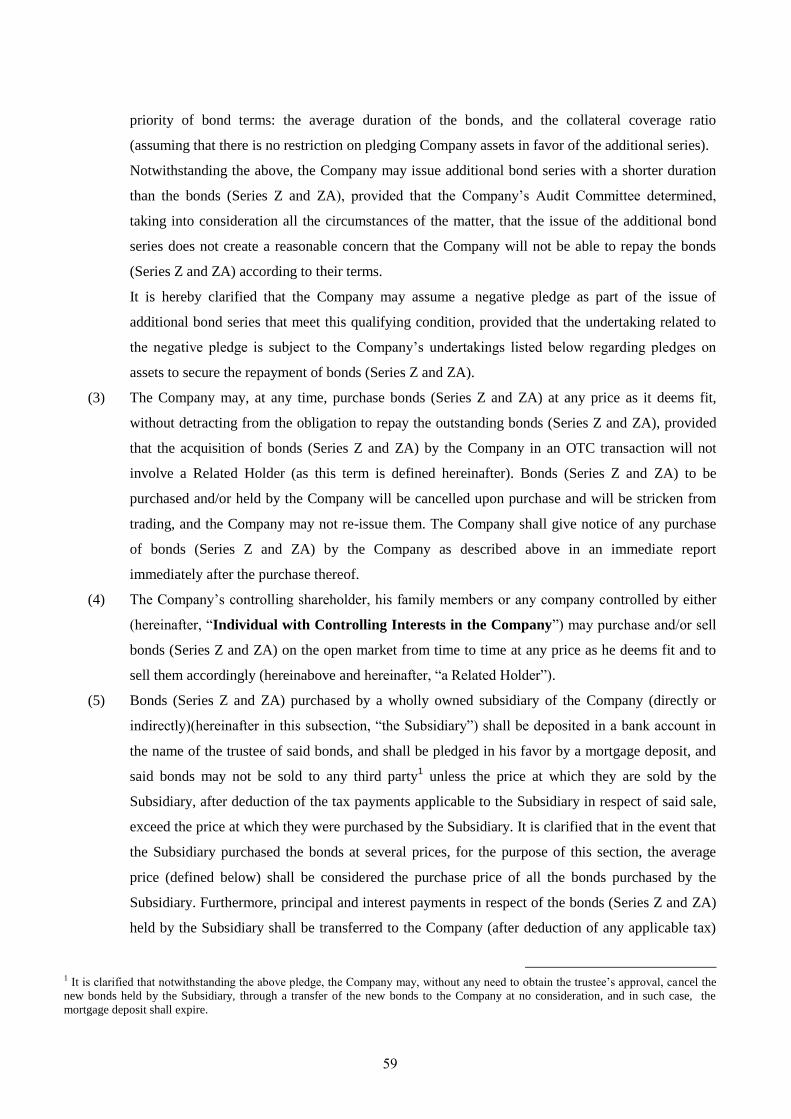
66
priority of bond terms: the average duration of the bonds, and the collateral coverage ratio
(assuming that there is no restriction on pledging Company assets in favor of the additional series).
Notwithstanding the above, the Company may issue additional bond series with a shorter duration
than the bonds (Series Z and ZA), provided that the Company’s Audit Committee determined,
taking into consideration all the circumstances of the matter, that the issue of the additional bond
series does not create a reasonable concern that the Company will not be able to repay the bonds
(Series Z and ZA) according to their terms.
It is hereby clarified that the Company may assume a negative pledge as part of the issue of
additional bond series that meet this qualifying condition, provided that the undertaking related to
the negative pledge is subject to the Company’s undertakings listed below regarding pledges on
assets to secure the repayment of bonds (Series Z and ZA).
(3) The Company may, at any time, purchase bonds (Series Z and ZA) at any price as it deems fit,
without detracting from the obligation to repay the outstanding bonds (Series Z and ZA), provided
that the acquisition of bonds (Series Z and ZA) by the Company in an OTC transaction will not
involve a Related Holder (as this term is defined hereinafter). Bonds (Series Z and ZA) to be
purchased and/or held by the Company will be cancelled upon purchase and will be stricken from
trading, and the Company may not re-issue them. The Company shall give notice of any purchase
of bonds (Series Z and ZA) by the Company as described above in an immediate report
immediately after the purchase thereof.
(4) The Company’s controlling shareholder, his family members or any company controlled by either
(hereinafter, ―Individual with Controlling Interests in the Company‖) may purchase and/or sell
bonds (Series Z and ZA) on the open market from time to time at any price as he deems fit and to
sell them accordingly (hereinabove and hereinafter, ―a Related Holder‖).
(5) Bonds (Series Z and ZA) purchased by a wholly owned subsidiary of the Company (directly or
indirectly)(hereinafter in this subsection, ―the Subsidiary‖) shall be deposited in a bank account in
the name of the trustee of said bonds, and shall be pledged in his favor by a mortgage deposit, and
said bonds may not be sold to any third party1 unless the price at which they are sold by the
Subsidiary, after deduction of the tax payments applicable to the Subsidiary in respect of said sale,
exceed the price at which they were purchased by the Subsidiary. It is clarified that in the event that
the Subsidiary purchased the bonds at several prices, for the purpose of this section, the average
price (defined below) shall be considered the purchase price of all the bonds purchased by the
Subsidiary. Furthermore, principal and interest payments in respect of the bonds (Series Z and ZA)
held by the Subsidiary shall be transferred to the Company (after deduction of any applicable tax)
1 It is clarified that notwithstanding the above pledge, the Company may, without any need to obtain the trustee’s approval, cancel the
new bonds held by the Subsidiary, through a transfer of the new bonds to the Company at no consideration, and in such case, the
mortgage deposit shall expire.
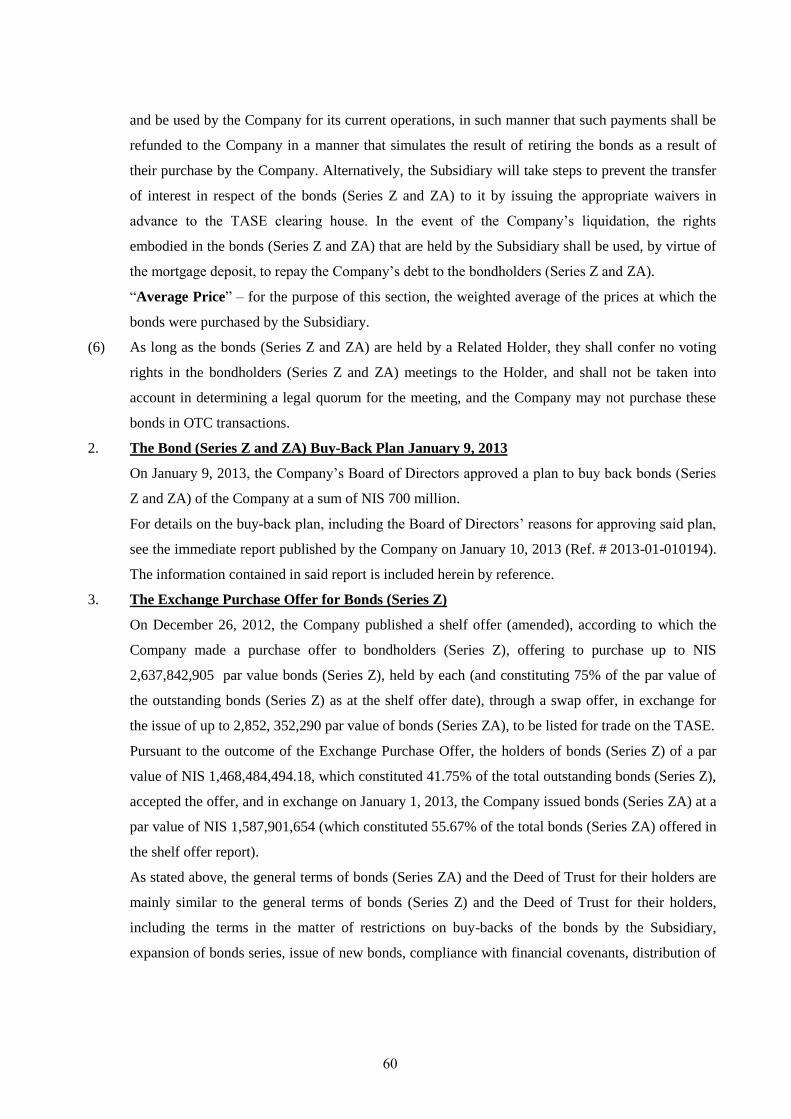
6.
and be used by the Company for its current operations, in such manner that such payments shall be
refunded to the Company in a manner that simulates the result of retiring the bonds as a result of
their purchase by the Company. Alternatively, the Subsidiary will take steps to prevent the transfer
of interest in respect of the bonds (Series Z and ZA) to it by issuing the appropriate waivers in
advance to the TASE clearing house. In the event of the Company’s liquidation, the rights
embodied in the bonds (Series Z and ZA) that are held by the Subsidiary shall be used, by virtue of
the mortgage deposit, to repay the Company’s debt to the bondholders (Series Z and ZA).
―Average Price‖ – for the purpose of this section, the weighted average of the prices at which the
bonds were purchased by the Subsidiary.
(6) As long as the bonds (Series Z and ZA) are held by a Related Holder, they shall confer no voting
rights in the bondholders (Series Z and ZA) meetings to the Holder, and shall not be taken into
account in determining a legal quorum for the meeting, and the Company may not purchase these
bonds in OTC transactions.
2. The Bond (Series Z and ZA) Buy-Back Plan January 9, 2013
On January 9, 2013, the Company’s Board of Directors approved a plan to buy back bonds (Series
Z and ZA) of the Company at a sum of NIS 700 million.
For details on the buy-back plan, including the Board of Directors’ reasons for approving said plan,
see the immediate report published by the Company on January 10, 2013 (Ref. # 2013-01-010194).
The information contained in said report is included herein by reference.
3. The Exchange Purchase Offer for Bonds (Series Z)
On December 26, 2012, the Company published a shelf offer (amended), according to which the
Company made a purchase offer to bondholders (Series Z), offering to purchase up to NIS
2,637,842,905 par value bonds (Series Z), held by each (and constituting 75% of the par value of
the outstanding bonds (Series Z) as at the shelf offer date), through a swap offer, in exchange for
the issue of up to 2,852, 352,290 par value of bonds (Series ZA), to be listed for trade on the TASE.
Pursuant to the outcome of the Exchange Purchase Offer, the holders of bonds (Series Z) of a par
value of NIS 1,468,484,494.18, which constituted 41.75% of the total outstanding bonds (Series Z),
accepted the offer, and in exchange on January 1, 2013, the Company issued bonds (Series ZA) at a
par value of NIS 1,587,901,654 (which constituted 55.67% of the total bonds (Series ZA) offered in
the shelf offer report).
As stated above, the general terms of bonds (Series ZA) and the Deed of Trust for their holders are
mainly similar to the general terms of bonds (Series Z) and the Deed of Trust for their holders,
including the terms in the matter of restrictions on buy-backs of the bonds by the Subsidiary,
expansion of bonds series, issue of new bonds, compliance with financial covenants, distribution of
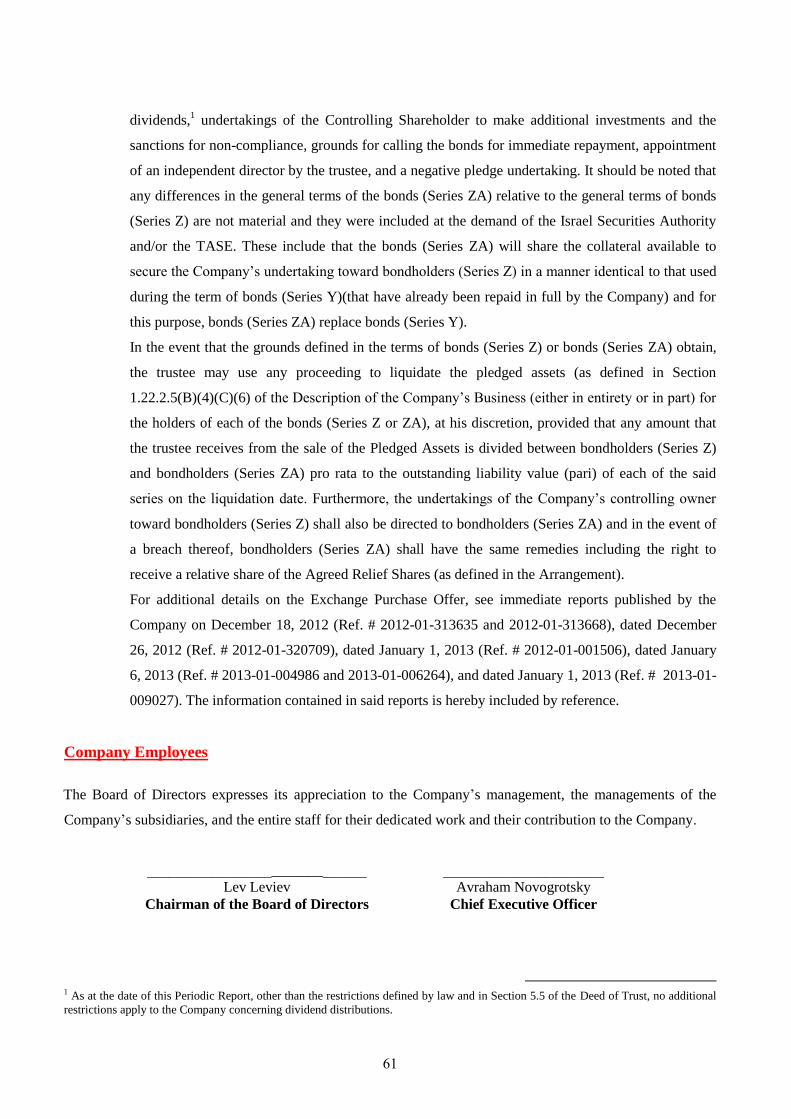
68
dividends,1 undertakings of the Controlling Shareholder to make additional investments and the
sanctions for non-compliance, grounds for calling the bonds for immediate repayment, appointment
of an independent director by the trustee, and a negative pledge undertaking. It should be noted that
any differences in the general terms of the bonds (Series ZA) relative to the general terms of bonds
(Series Z) are not material and they were included at the demand of the Israel Securities Authority
and/or the TASE. These include that the bonds (Series ZA) will share the collateral available to
secure the Company’s undertaking toward bondholders (Series Z) in a manner identical to that used
during the term of bonds (Series Y)(that have already been repaid in full by the Company) and for
this purpose, bonds (Series ZA) replace bonds (Series Y).
In the event that the grounds defined in the terms of bonds (Series Z) or bonds (Series ZA) obtain,
the trustee may use any proceeding to liquidate the pledged assets (as defined in Section
1.22.2.5(B)(4)(C)(6) of the Description of the Company’s Business (either in entirety or in part) for
the holders of each of the bonds (Series Z or ZA), at his discretion, provided that any amount that
the trustee receives from the sale of the Pledged Assets is divided between bondholders (Series Z)
and bondholders (Series ZA) pro rata to the outstanding liability value (pari) of each of the said
series on the liquidation date. Furthermore, the undertakings of the Company’s controlling owner
toward bondholders (Series Z) shall also be directed to bondholders (Series ZA) and in the event of
a breach thereof, bondholders (Series ZA) shall have the same remedies including the right to
receive a relative share of the Agreed Relief Shares (as defined in the Arrangement).
For additional details on the Exchange Purchase Offer, see immediate reports published by the
Company on December 18, 2012 (Ref. # 2012-01-313635 and 2012-01-313668), dated December
26, 2012 (Ref. # 2012-01-320709), dated January 1, 2013 (Ref. # 2012-01-001506), dated January
6, 2013 (Ref. # 2013-01-004986 and 2013-01-006264), and dated January 1, 2013 (Ref. # 2013-01-
009027). The information contained in said reports is hereby included by reference.
Company Employees
The Board of Directors expresses its appreciation to the Company’s management, the managements of the
Company’s subsidiaries, and the entire staff for their dedicated work and their contribution to the Company.
______________________ ______________________________
Avraham Novogrotsky Lev Leviev
Chief Executive Officer Chairman of the Board of Directors
1 As at the date of this Periodic Report, other than the restrictions defined by law and in Section 5.5 of the Deed of Trust, no additional
restrictions apply to the Company concerning dividend distributions.


![Grounding Visual Explanations - arXiv · Grounding Visual Explanations 3 Explainability.The importance of explanations for humans has been studied in the field of psychology [14,15],](https://img.pdfslide.us/doc/110x75/5eba384b92540b434d17a953/grounding-visual-explanations-arxiv-grounding-visual-explanations-3-importance.jpg)