Embed Size (px)
Citation preview

Chapter 9Uptake of Organic Contaminants from Soilinto Vegetables and Fruits
Stefan Trapp and Charlotte N. Legind
Abstract Contaminants may enter vegetables and fruits by several pathways: byuptake with soil pore water, by diffusion from soil or air, by deposition of soilor airborne particles, or by direct application. The contaminant-specific and plant-specific properties that determine the importance of these pathways are described inthis chapter. A variety of models have been developed, specific for crop types andwith steady-state or dynamic solutions. Model simulations can identify sensitiveproperties and relevant processes. Persistent, polar (log KOW < 3) and non-volatile(KAW < 10–6) contaminants have the highest potential for accumulation from soil,and concentrations in leaves may be several hundred times higher than in soil.However, for most contaminants the accumulation in vegetables or fruits is muchlower. Lipophilic (log KOW > 3) contaminants are mainly transported to leavesby attached soil particles, or from air. Volatile contaminants have a low poten-tial for accumulation because they quickly escape to air. Experimental data arelisted that support these model predictions, but underline also the high variabil-ity of accumulation under field conditions. Plant uptake predictions are uncertain,due to the immense variation in environmental and plant physiological conditions.Uptake of organic contaminants into vegetables and fruits may lead to human healthrisks, but it may also be used to delineate subsurface plumes and monitor NaturalAttenuation. Most models mentioned in this chapter are freely available from theauthors.
Contents
9.1 Introduction . . . . . . . . . . . . . . . . . . . . . . . . . . . . . . . . . . . . . . . . . . . 371
9.2 Uptake and Transport Processes . . . . . . . . . . . . . . . . . . . . . . . . . . . . . . . 371
9.3 Empirical Methods for Estimating Uptake of Contaminants into Plants . . . . . . . 372
S. Trapp (B)Department of Environmental Engineering, Technical Universityof Denmark, Lyngby, Copenhagen, Denmarke-mail: [email protected]
369F.A. Swartjes (ed.), Dealing with Contaminated Sites,DOI 10.1007/978-90-481-9757-6_9, C© Springer Science+Business Media B.V. 2011

370 S. Trapp and C.N. Legind
9.3.1 Bioconcentration Factors . . . . . . . . . . . . . . . . . . . . . . . . . . . . . . . 372
9.3.2 Regression Equations . . . . . . . . . . . . . . . . . . . . . . . . . . . . . . . . . 374
9.3.3 Root Concentration Factor . . . . . . . . . . . . . . . . . . . . . . . . . . . . . . 374
9.3.4 Partition Coefficients for Stem and Leaves . . . . . . . . . . . . . . . . . . . . 376
9.3.5 Translocation from Roots into Stem and Leaves . . . . . . . . . . . . . . . . . 377
9.4 Mechanistic Models for Estimating Uptake of Contaminants into Plants . . . . . . 377
9.4.1 Processes to Include in a Plant Uptake Model . . . . . . . . . . . . . . . . . . 378
9.4.2 Mass Balance for a Dynamic Plant Uptake Model . . . . . . . . . . . . . . . . 378
9.4.3 Steady-State Solution for the Root and Leaf Model . . . . . . . . . . . . . . . 381
9.4.4 General Solutions for a Cascade Model . . . . . . . . . . . . . . . . . . . . . . 381
9.4.5 Input Data for the Root and Leaf Model . . . . . . . . . . . . . . . . . . . . . . 384
9.5 Influence of Contaminant-Specific Parameters . . . . . . . . . . . . . . . . . . . . . . 384
9.5.1 KOW on Accumulation in Roots and Potatoes . . . . . . . . . . . . . . . . . . 384
9.5.2 KOW and KAW on Accumulation of Contaminants in Leaves . . . . . . . . . 385
9.5.3 Uptake from Air Versus Uptake from Soil . . . . . . . . . . . . . . . . . . . . . 387
9.5.4 Dissipation from Soil . . . . . . . . . . . . . . . . . . . . . . . . . . . . . . . . . 388
9.5.5 Impact of pKa and pH on Uptake of Ionisable Contaminants . . . . . . . . . 389
9.6 Influence of Plant-Specific Parameters . . . . . . . . . . . . . . . . . . . . . . . . . . . 390
9.6.1 Crop Types and Uptake Pathways . . . . . . . . . . . . . . . . . . . . . . . . . . 391
9.6.2 Physiological Parameters . . . . . . . . . . . . . . . . . . . . . . . . . . . . . . . 391
9.6.3 Plant Morphology and Collection Efficiency for Particles . . . . . . . . . . . 392
9.6.4 Variation of Partition Coefficients . . . . . . . . . . . . . . . . . . . . . . . . . . 394
9.6.5 Permeability . . . . . . . . . . . . . . . . . . . . . . . . . . . . . . . . . . . . . . . 394
9.6.6 Particle Deposition . . . . . . . . . . . . . . . . . . . . . . . . . . . . . . . . . . . 395
9.6.7 Metabolism in Plants . . . . . . . . . . . . . . . . . . . . . . . . . . . . . . . . . 395
9.7 Environmental Variables . . . . . . . . . . . . . . . . . . . . . . . . . . . . . . . . . . . 397
9.7.1 Climate . . . . . . . . . . . . . . . . . . . . . . . . . . . . . . . . . . . . . . . . . . 397
9.7.2 Bioavailability . . . . . . . . . . . . . . . . . . . . . . . . . . . . . . . . . . . . . 398
9.7.3 Soil pH . . . . . . . . . . . . . . . . . . . . . . . . . . . . . . . . . . . . . . . . . . 398
9.7.4 Uncertainties in Predictions . . . . . . . . . . . . . . . . . . . . . . . . . . . . . 398
9.8 Uptake Potential of Specific Substance Classes . . . . . . . . . . . . . . . . . . . . . 399
9.8.1 Chlorinated Solvents (PCE, TCE and Others) . . . . . . . . . . . . . . . . . . 399
9.8.2 Gasoline Contaminants . . . . . . . . . . . . . . . . . . . . . . . . . . . . . . . . 400
9.8.3 Heavy Petroleum Products . . . . . . . . . . . . . . . . . . . . . . . . . . . . . . 400
9.8.4 Polycyclic Aromatic Hydrocarbons . . . . . . . . . . . . . . . . . . . . . . . . . 400
9.8.5 Persistent Organic Pollutants POPs . . . . . . . . . . . . . . . . . . . . . . . . . 400
9.8.6 Explosives . . . . . . . . . . . . . . . . . . . . . . . . . . . . . . . . . . . . . . . . 400
9.8.7 Phenols . . . . . . . . . . . . . . . . . . . . . . . . . . . . . . . . . . . . . . . . . . 401
9.8.8 Cyanides . . . . . . . . . . . . . . . . . . . . . . . . . . . . . . . . . . . . . . . . . 401
9.9 Monitoring of Contaminants in Soils and Shallow Aquifers with Vegetation . . . . 401
9.10 Conclusions . . . . . . . . . . . . . . . . . . . . . . . . . . . . . . . . . . . . . . . . . . . 403
References . . . . . . . . . . . . . . . . . . . . . . . . . . . . . . . . . . . . . . . . . . . . . . . . 403

9 Organic Contaminants from Soil into Vegetables and Fruits 371
9.1 Introduction
A major concern of European citizens is residues of pesticides in fruits and veg-etables (EFSA 2006). But not just pesticides pose a risk. In fact, for a whole rangeof organic contaminants, uptake via diet is often the primary contribution to humanexposure (SCF 2002; Travis and Hattemer-Frey 1991). Contaminants may be takenup into plants and subsequently accumulate in the human food chain (Czub andMcLachlan 2004) and affect the health of humans. Consequently, uptake of contam-inants into plants is an essential part of most exposure models, for example CSOIL(Brand et al. 2007), CLEA (DEFRA 2002) and EUSES (EC 2003).
About 20,000 plant species are used by the human race, and about 600 speciesare cultivated (Franke 1987). Additionally, about 250,000 wild plants grow on earth(Sitte et al. 1991). Thus, there is a large variability in plant properties. Also thegrowth conditions vary, depending on soil type, soil properties, climatic conditionsand agricultural practice. Similarly, the number of organic contaminants is veryhigh. More than 5 million compounds have been synthesized. Around 30,000 com-pounds are marketed in Europe, and contaminants released to the environment mayalso be metabolized. Thus, from a researcher’s point of view, the number of possiblecombinations of plant species, contaminants and environmental conditions is closeto infinite. Nevertheless, general patterns are known and process-oriented modelshave been established.
This chapter will give an overview of uptake processes of organic contaminantsfrom soil into plants, on prediction methods and on experimental results. Modelsimulations will be carried out to identify the chemical properties that control theaccumulation in food crops. These predictions will be compared with experimentalresults, in order to determine the potential of soil contaminants for accumulationin food crops. For the calculation of exposure through vegetable consumption, seeChapter 11 by Elert et al., of this book.
9.2 Uptake and Transport Processes
Contaminants in the environment can enter plants by various ways (Fig. 9.1). Themain passive transport and uptake processes from soil are:
• uptake with transpiration water;• diffusion from soil into roots;• attachment of soil particles, eventually followed by diffusion into plant tissue.
However, contaminants can also be present in air. The main uptake processesfrom air are:
• diffusive (gaseous) exchange with air;• wet and dry particle deposition from air on plant surfaces followed by diffusion
into plant tissue.

372 S. Trapp and C.N. Legind
Fig. 9.1 Transport anduptake processes in thesoil-air-plant system
Inside the plant, the phloem and xylem flux may distribute the contaminants. Thexylem sap flows from the roots into the stem to the leaves and, to some extent, tofruits. The phloem sap flows from the leaves to all growing parts of the plant and tofruits and storage organs, such as tubers. The relative importance of these processesvaries with plant type, environmental conditions and properties of contaminants.Active uptake processes, which involve energy or enzymes of the plant, may alsoplay a role, but have not yet been shown to be of large relevance for environmentalorganic contaminants.
9.3 Empirical Methods for Estimating Uptake of Contaminantsinto Plants
Laboratory and field experiments have been conducted to determine the uptake ofcontaminants from soil into plants. Single bioconcentration factors for contami-nants as well as regressions were established for predicting the uptake of organiccontaminants from soil into plants.
9.3.1 Bioconcentration Factors
The ratio of contaminant concentration in an organism to contaminant concen-tration in the surrounding medium is called the bioconcentration factor (BCF).Measurements of concentrations in plant tissues and concentrations in soil will yielda BCF plant to soil, which is defined as
BCF = Cplant
Csoil(9.1)
9 Organic Contaminants from Soil into Vegetables and Fruits 373
where CPlant is the concentration in plant tissues and CSoil is the concentration insoil (ideally at steady state, but practically at harvest). This BCF will only apply tothe specific contaminant and soil type used for the determination.
Care must be taken in cases where a measurable background concentrationin plants is present. Because then, for low soil concentration (CSoil → 0), theconcentration ratio BCF can be very high (CPlant/CSoil → ∞). For higher soil con-centrations, however, the BCF decreases and approaches a constant value. Thispattern was occasionally interpreted as a variable BCF with soil concentration, i.e.a decreasing BCF with increasing soil concentration. A real-world example is theratio between the measured concentration of p,p′-DDT in radishes and in soil. Theconcentration ratio is high at low soil concentrations, and decreases for higher soilconcentrations. A plausible explanation for this pattern is that plants have a limitedsorption capacity for organic contaminants, which becomes saturated at higher soilconcentrations. However, a more likely interpretation is that the uptake into plants isfrom two different and independent sources, namely from soil and from air. Whensoil concentrations are very low there still is a background contamination of theplant tissue originating from air (Mikes et al. 2009).
Instead of simply calculating the concentration ratio of plant to soil, the relation-ship between concentrations in plant and soil can be quantified by a linear regressionbetween both if measurements at different concentration levels are available. Theslope of the regression between soil concentration as predictor variable and plantconcentration as estimated variable can be interpreted as the BCF plant to soil, whilethe y-axis-intercept can be interpreted as the constant background concentration dueto uptake from air.
CPlant = BCF × CSoil + CBackground (9.2)
where CBackground is the constant concentration due to uptake from air.This method has several advantages:
• all measured values contribute to the calculated BCF;• variations in the measured concentrations are adequately considered;• the y-axis gives the concentration in plants due to the (constant) concentration
in air;• the square of the correlation coefficient (r2) describes how much of the vari-
ance in the measured concentration in plants is explained by the variance of theconcentrations in soil.
An example is shown in Fig. 9.2. It shows the BCFs for p,p′-DDT in radisheswhich decrease with increasing soil concentration (Mikes et al. 2009), but withCplant plotted as a function of CSoil. The slope of the regression curve, i.e. the value0.17, is the BCF derived from all measured values minus the background concen-tration in air. The BCF is statistically highly significant. The explained variance r2
is 0.98, which means that the increase of concentrations in plants can be explainedalmost completely by the increase of concentration in soil.

374 S. Trapp and C.N. Legind
Fig. 9.2 Calculation of BCFfrom the slope of theregression betweenconcentrations in soil andplant root; calculation ofbackground concentrationdue to uptake from air fromthe y-axis intercept of theregression. Example from(Mikes et al. 2009), p,p′-DDTin roots and soil
9.3.2 Regression Equations
BCFs for neutral organic contaminants are related to contaminant properties. This isapplied in regression equations where physico-chemical properties like lipophilicityof the contaminants are correlated to the BCFs. These regressions based on mea-sured data allow us to estimate concentrations of contaminants in plant tissue fromthe octanol-water partitioning coefficient, KOW, in case of uptake from soil (e.g.(Travis and Arms 1988)) or from the octanol-air partitioning coefficient, KOA, incase of uptake from air (Kömp and McLachlan 1997).
A frequently applied regression for the uptake of organic contaminants from soilinto above-ground plants stems from Travis and Arms (1988):
log BCFV = 1.588 − 0.578 × log KOW (n = 29, r2 = 0.53) (9.3)
where BCFv is the bioconcentration factor of vegetation to soil (kg kgdw–1) and KOW
(L L–1) expresses the lipophilicity of the contaminant. The curve was fitted with 29data points in the range 1.15 ≤ log KOW ≤ 9.35. A limitation of the regression isthat the uptake from air remains unknown. This may lead to false predictions.
9.3.3 Root Concentration Factor
Phase equilibrium is the endpoint of diffusion and is achieved when the activity ofthe contaminant in the root tissue is equal to the activity of the contaminant in theexternal solution (Lewis 1907). The concentration ratio between root and aqueoussolution in phase equilibrium is called the root concentration factor RCF (L kg–1)(Shone and Wood 1974).
RCF = Concentration in root (mg g−1)
Concentration in solution (mg mL−1)(9.4)
The most widely applied regression for the RCF is from Briggs et al. (1982). Ithas been fitted to data derived from experiments with intact and macerated barley

9 Organic Contaminants from Soil into Vegetables and Fruits 375
roots. For neutral organic chemicals (phenylureas and o-methylcarbamoyloximes),the relation between log KOW and sorption to roots was:
log(RCF − 0.82) = 0.77 log Kow − 1.52 (n = 7, r2 = 0.96). (9.5)
The dependency on the log KOW was explained by lipophilic sorption of the con-taminants to plant lipids. The value of 0.82 was interpreted as water content ofthe roots. A similar result was obtained for cut pieces of bean roots and stems forN-methyl-arylcarbamates (Trapp and Pussemier 1991):
log(RCF − 0.85) = 0.557 log Kow − 1.34 (n = 12, r2 = 0.92). (9.6)
This equation gives lower root concentration factors for lipophilic contaminants(Fig. 9.3). Both RCF-regressions describe partitioning to water. But roots typi-cally grow in soil. The sorption of organic contaminants to soil is related to theorganic carbon content, OC. Many regressions for the organic carbon normalisedsorption to soil, KOC (L kgdw
–1), were established, for example for neutral organiccontaminants (EC 2003)
log KOC = 0.81 log KOW + 0.1 (n = 81, r2 = 0.89) (9.7)
Bulk soil consists of solids, water and air. For the concentration ratio betweenbulk soil and soil pore water, KSW (L kg–1) follows
KSW = CSoil
CW= OC × KOC × ρS,dry + θ × ρW
ρS,wet= 1
KSW(9.8)
where OC is the fraction of organic carbon in soil (kg kg–1), θ is the water contentof soil (L kg–1), ρW is the density of water (1 kg L–1), ρS,dry is the soil dry density(kgdw L–1) and ρS,wet is the soil wet density (kgww L−1). Division of RCF with KSW
gives the equilibrium concentration of the ratio of roots to soil.
0.1
1
10
100
–1 0 1 2 3 4 5
log Kow
RC
F, K
sw (
L/k
g)
Briggs meas Briggs regr
T&P regr Ksw
T&P meas
Fig. 9.3 Measured data androot concentration factor(RCF)-regression lines ofBriggs et al. (1982) and Trappand Pussemier (1991),compared to theconcentration ratio bulk soilto water (KSW)

376 S. Trapp and C.N. Legind
Both RCF-regressions (Eqs. 9.5 and 9.6), the experimental data of Briggs et al.(1982) and the concentration ratio between bulk soil and soil pore water, KSW, for atypical soil (OC = 0.025 kg kg−1 and W = 0.2 kg kg−1) are plotted in Fig. 9.3. Forlow KOW values RCF is higher than KSW, due to the higher water content of roots.For higher KOW values Briggs’ RCF regression and the KSW equation (Eq. 9.8) yieldsimilar results. This suggests that the sorption capacity of roots equals that of soil,because the content of organic carbon in soil (in this case 2.5%) is similar to thelipid content of roots (about 2−3%, including waxes and lignin), and the slope ofthe log KOW in the regressions is similar (0.81 for KOC in Eq. 9.7 and 0.77 for RCFin Eq. 9.5).
9.3.4 Partition Coefficients for Stem and Leaves
Briggs et al. (1983) measured the sorption to macerated barley stems and pre-dicted Kstem/xylem sap (L kg−1), which is the concentration of contaminants in stemtissue divided by the concentration in xylem sap, related to the log KOW of thecontaminants:
log(Kstem/xylemsap − 0.82) = 0.95 log KOW − 2.05 (n = 8, r2 = 0.96). (9.9)
Trapp et al. (1994) interpreted the regressions derived for sorption to roots andstems as equilibrium partition coefficients between plant tissue and water, KPW
(L kg−1), and introduced the general equation:
KPW = W + LaKbOW (9.10)
where W (L kg−1) and L (kg kg−1) are water and lipid content of the plant, b isa correction factor for differences between solubility in octanol and sorption toplant lipids (in the regressions of Briggs et al. (1982, 1983) b was 0.77 for rootsand 0.95 for leaves), and a is a factor correcting density differences between waterand n-octanol (1/ρOctanol = 1.22 L kg−1, where ρOctanol is the density of octanol).When parameterized accordingly, this equilibrium approach gives the same resultsfor roots as the Briggs RCF-regression.
Stems and leaves are in contact with air. The sorption equilibrium of contami-nants between leaves and air can be described as follows:
KLA = CL/CA = KLW/KAW (9.11)
where KLA is the partition coefficient between leaves and air (L kg−1), KLW (L kg−1)is the partition coefficient between leaves and water (Eq. 9.10) and KAW (L L−1) isthe partition coefficient between air and water (also known as the dimensionlessHenry’s Law constant). Instead of estimating KLA from KOW and KAW, KLA wasoften directly fitted to KOA, i.e. the partition coefficient between octanol and air(e.g., Kömp and McLachlan 1997).

9 Organic Contaminants from Soil into Vegetables and Fruits 377
9.3.5 Translocation from Roots into Stem and Leaves
Translocation of contaminants from roots into stems in the xylem is often describedby the transpiration stream concentration factor TSCF (Russell and Shorrocks1959):
TSCF = Concentration in xylem sap (mg mL−1)
Concentration in solution (mg mL−1)(9.12)
From experimental data, the concentration in xylem sap is found from the massof contaminant in shoots divided by the volume of transpired water. Briggs et al.(1982) fitted a Gaussian optimum curve to their data:
TSCF = 0.784 × e−(log KOW−1.78)2/2.44 (n = 17, r2 = 0.73) (9.13)
Later experiments by other research groups yielded similar results (Burken andSchnoor 1998; Hsu et al. 1990; Sicbaldi et al. 1997). However, recent research hasshown that these regressions might not be valid for the polar contaminants (log KOW
< 1) and a sigmoidal relationship between TSCF and log KOW has been established(Dettenmaier et al. 2009):
TSCF = 11
11 − 2.6log KOW(n = 118, r2 = 0.68) (9.14)
9.4 Mechanistic Models for Estimating Uptake of Contaminantsinto Plants
The first author met D. Mackay at his talk at the University of Bayreuth in 1986,where he encouraged his audience to develop mechanistic models for the plantuptake of organic contaminants. So we did (Trapp et al. 1990). D. Mackay andhis team also developed some of the early models for this purpose, formulated withthe fugacity approach (Paterson et al. 1994). These models were later simplifiedby Hung and Mackay (1997) to three mass balance equations and solved numeri-cally. At about the same time, the numerical model PlantX was developed (Trappet al. 1994). Later, crop-specific models were derived, i.e. specific models for roots(Trapp 2002), potatoes (Trapp et al. 2007a), leaves (Trapp and Matthies 1995) andfruits (Trapp 2007). These models are all based on the same physico-chemical prin-ciples and describe the same basic processes, such as advective uptake into plants,diffusive uptake, chemical equilibrium, transport in xylem and phloem, dilution bygrowth, and particle deposition from soil and air. The actually occurring processesand their parameterization depend on the type of crop (Fig. 9.4). Plant models werealso developed by other groups, for example a partition-limited model by Chiouet al. (2001) and the models for pesticide uptake by Fujisawa et al. (2002a, b). For

378 S. Trapp and C.N. Legind
Fig. 9.4 Overview of crop-specific plant uptake processes (Legind and Trapp 2009)
electrolytes, such as acids and bases, very different approaches were developed.Examples of such models are the phloem transport model by Kleier (1988), themodel relating to pesticide spray application by Satchivi (2000a, b) and the cellmodel (Trapp 2000, 2004).
9.4.1 Processes to Include in a Plant Uptake Model
A plant uptake model should consider both uptake from soil and air into plants. Arelatively simple model includes the compartments soil, roots and leaves (or fruitsor grains) and the processes:
• continuous and pulse input to all compartments (soil, roots and leaves);• degradation, leaching, run-off and plant uptake, resulting in loss from soil;• uptake into roots with the transpiration water;• growth dilution, degradation and metabolism in roots;• translocation from roots to leaves (or fruits) with the transpiration stream;• loss from leaves to air;• deposition from air to leaves;• transport to leaves with attached soil;• growth dilution, degradation and metabolism in leaves.
9.4.2 Mass Balance for a Dynamic Plant Uptake Model
Though not in the scope of this chapter, a mass balance for soil can be described asfollows.

9 Organic Contaminants from Soil into Vegetables and Fruits 379
Change of contaminant mass in soil is deposition from air minus leaching,run-off, volatilization, degradation and uptake into roots. Division by soil mass, MS,results in the concentration in soil:
dCs
dt= Is
Ms− ks × Cs (9.15)
where IS (mg d−1) is input to soil (including deposition from air), and kS (d−1) isthe sum of all first-order loss rates from soil. For parameters for the equation, seeother sections of this book.
The mass balance for thick roots, such as carrots, can be described as follows.Change of contaminant mass in roots is influx with water minus outflux with
xylem sap. Diffusive uptake is not considered, since it only makes a smallchange in the concentration in roots. The root is described with the followingequation:
dmR
dt= Q × CW − Q × CXy (9.16)
where mR is the mass of contaminant in roots (mg), Q is the transpiration stream(L d−1), CW is the concentration in soil pore water (mg L−1) and CXy is the con-centration in the xylem at the outflow of the root (mg L−1). If the xylem sap is inequilibrium with the root, the concentration is CXy = CR/KRW. KRW (L kg−1) is thepartition coefficient between root and water (Eq. 9.10). The concentration in soilpore water, CW, is CS × KWS. Substituting these expressions in Eq. 9.16 gives thefollowing equation:
d(CR × MR)
dt= dmR
dt= Q × KWS × CS − Q
KRW× CR (9.17)
If plant growth is exponential, and the ratio Q/MR (transpiration stream Q to rootmass MR (kg)) is constant, the growth by exponential dilution can be considered bya first-order growth rate kR (d−1). If first order degradation or metabolism occurs,the rate kR is the sum of the loss processes and the growth dilution. Division by massof the root results in the concentration in roots:
dCR
dt= Q
MR× KWS × CS − Q
MR × KRW× CR − KR × CR (9.18)
The mass balance for leaves can be described as follows.Change of contaminant mass in leaves is influx with transpiration water plus
gaseous and particulate deposition from air minus diffusion to air. This results inthe following equation:
dmL
dt= Q
KRWCR + AL × gL × (1 − fP) × CA + AL × vdep
2× fP × CA
− AL × gL × 1000 Lm−3
KLA× CL
(9.19)

380 S. Trapp and C.N. Legind
where AL is leaf area (m2), KLA is the partition coefficient between leaves and air(L kg−1), CA is the total concentration in air (mg m−3) and fP (−) is the fractionof the total concentration in air that is adsorbed on particles. Uptake from air caneither be by diffusive exchange in the gas phase with conductance gL (m d−1), orby deposition of particles on the surface of the leaves (AL/2) with velocity vdep
(m d−1). The concentration in leaves is as follows:
dCL
dt= Q
ML × KRW× CR + AL × g
ML× (1 − fP) × CA + AL × vdep
2 × ML× fP × CA
−AL × gL × 1000 Lm−3
KLA × ML× CL − kL × CL
(9.20)
where kL (d−1) again is the first-order rate that includes growth dilution and bioticand abiotic (photolysis) degradation processes. The first term of the equation quan-tifies translocation from roots to leaves and replaces the TSCF in earlier modelversions (Trapp and Matthies 1995). The advantages of this new formulation areas follows:
• There is a relation between concentrations in roots and in leaves. This allows, forexample, calculation of the fate of metabolites formed in roots.
• The TSCF is related to plant physiological parameters, such as transpiration Q,growth rate k and partitioning between root tissue and xylem, KRW (Eq. 9.10).
The calculated concentration ratio between the xylem and the external solution isclose to the calculated concentration resulting from the empirical TSCF-regressionby Dettenmaier et al. (2009) for all contaminants, and to the TSCF-regressions fol-lowing a Gaussian curve for contaminants with log KOW > 2 (Trapp 2007). Trapp(2007) speculates, based on this equation, that plants growing in soil outdoors wouldhave a different TSCF-curve than plants grown in hydroponic solutions. This is dueto the formation of root hairs in soil, which leads to better diffusive uptake of polarcontaminants and subsequently higher TSCF-values (the TSCF remains high (i.e.near 1) for contaminants with a log KOW < 1). Dettenmaier et al. (2009) suggeststhat differences in experimental methods and plant growth conditions cause thedisparity.
An additional process not considered in Eq. 9.20 is the contamination of leaveswith attached soil, R (kg soil kg plant−1 (wet weight)). A convenient way of cal-culation is to add the concentration due to attachment of particles from soil withsubsequent deposition on leaves to the calculated CL, as follows:
CL, Final = CL,Calc + R × CSoil (9.21)
Default values for R range from 0.001 kg kg−1 to 0.01 kg kg−1 (seeSection 9.6.3).

9 Organic Contaminants from Soil into Vegetables and Fruits 381
Mass balances for fruit and grain can be set up analogous to Eq. (9.20). However,the processes and parameters differ. For grain, we assume no particle deposition anda lower soil attachment value.
9.4.3 Steady-State Solution for the Root and Leaf Model
The steady-state (t → ∞) concentration in roots, CR, with constant concentration insoil, CSoil, is as follows:
CR = QQ
KRW+ KR × MR
× KWS × CSoil (9.22)
For leaves, the steady state concentration is:
CL = I
a(9.23)
where I is the sum of all input terms (mg kg−1 d−1):
I = Q
ML × KRW× CR + AL × gL
ML× (1 − fP) × CA + AL × vdep
2ML× fp × CA (9.24)
and a is the sum of all loss processes (d−1):
a = AL × gL × 1000 Lm−3
KLA × ML+ kL (9.25)
9.4.4 General Solutions for a Cascade Model
The system of three linear differential equations (Eqs. 9.15, 9.18 and 9.20) can besolved analytically or numerically for continuous or pulse input. Continuous inputoccurs from atmospheric deposition to soil and leaves, whereas pulse inputs vary,e.g. inputs from accidents, pesticide spray application and application of manure orcompost.
The differential equations for the contaminant concentration in soil, root andleaves can be treated as a diagonal matrix, so that:
dC1
dt= −k1C1 + I1/M1 (9.26)
dC2
dt= +k12C1 − k2C2 + I2/M2 (9.27)
dC3
dt= +k23C2 − k3C3 + I3/M3 (9.28)
382 S. Trapp and C.N. Legind
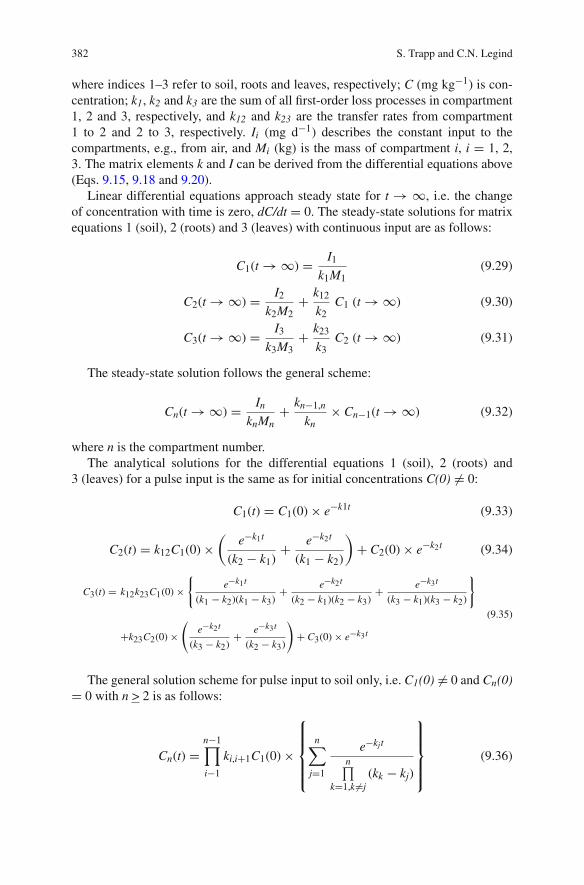
where indices 1–3 refer to soil, roots and leaves, respectively; C (mg kg−1) is con-centration; k1, k2 and k3 are the sum of all first-order loss processes in compartment1, 2 and 3, respectively, and k12 and k23 are the transfer rates from compartment1 to 2 and 2 to 3, respectively. Ii (mg d−1) describes the constant input to thecompartments, e.g., from air, and Mi (kg) is the mass of compartment i, i = 1, 2,3. The matrix elements k and I can be derived from the differential equations above(Eqs. 9.15, 9.18 and 9.20).
Linear differential equations approach steady state for t → ∞, i.e. the changeof concentration with time is zero, dC/dt = 0. The steady-state solutions for matrixequations 1 (soil), 2 (roots) and 3 (leaves) with continuous input are as follows:
C1(t → ∞) = I1
k1M1(9.29)
C2(t → ∞) = I2
k2M2+ k12
k2C1 (t → ∞) (9.30)
C3(t → ∞) = I3
k3M3+ k23
k3C2 (t → ∞) (9.31)
The steady-state solution follows the general scheme:
Cn(t → ∞) = In
knMn+ kn−1,n
kn× Cn−1(t → ∞) (9.32)
where n is the compartment number.The analytical solutions for the differential equations 1 (soil), 2 (roots) and
3 (leaves) for a pulse input is the same as for initial concentrations C(0) �= 0:
C1(t) = C1(0) × e−k1t (9.33)
C2(t) = k12C1(0) ×(
e−k1t
(k2 − k1)+ e−k2t
(k1 − k2)
)+ C2(0) × e−k2t (9.34)
C3(t) = k12k23C1(0) ×{
e−k1t
(k1 − k2)(k1 − k3)+ e−k2t
(k2 − k1)(k2 − k3)+ e−k3t
(k3 − k1)(k3 − k2)
}
+k23C2(0) ×(
e−k2t
(k3 − k2)+ e−k3t
(k2 − k3)
)+ C3(0) × e−k3t
(9.35)
The general solution scheme for pulse input to soil only, i.e. C1(0) �= 0 and Cn(0)= 0 with n > 2 is as follows:
Cn(t) =n−1∏i−1
ki,i+1C1(0) ×
⎧⎪⎪⎪⎨⎪⎪⎪⎩
n∑j=1
e−kjt
n∏k=1,k �=j
(kk − kj)
⎫⎪⎪⎪⎬⎪⎪⎪⎭
(9.36)

9 Organic Contaminants from Soil into Vegetables and Fruits 383
and for pulse input into all compartments, i.e. Cn(0) �= 0 with n ≥ 1:
Cn(t) =n−1∑a=1
⎛⎜⎜⎜⎝Ca(0)
n−1∏i=1
ki,i+1 ×n∑
j=a
e−kjt
n∏k=a,k �=j
(kk − kj)
⎞⎟⎟⎟⎠+ Cn(0) × e−knt (9.37)
This solution scheme can offer solutions for several soil-plant-air cascade systemvariations. For example, in analogy with this example, compartment 1 could be soil,compartment 2 roots, and compartment 3 leaves. Or, alternatively, compartment 1could be parent contaminant in soil, compartment 2 metabolite in soil, compart-ment 3 metabolite in root, compartment 4 metabolite in leaves, and compartment 5metabolite of metabolite in leaves.
Also for repeated applications there is a solution. This is a situation in which one,two or more subsequent pulse inputs occur. In that case, the resulting concentrationcan be calculated by adding the concentrations resulting from steady state and one,two or more pulse inputs. To this purpose, the simulation is split up into severalperiods. The concentration vector C(t) at the end of a specific period serves as initial
Table 9.1 Input data set for the standard model for the calculation of plant uptake (normalised to1 m2 of soil)
Parameter Symbol Value Unit
SoilSoil wet density ρwet 1.95 kgww L–1
Organic carbon content OC 0.02 kg kgww−1
Soil water content θ 0.35 L L−1
Soil dry density ρdry 1.6 (ρwet – θ) kgdw L−1
Mass of soil MS 1,000 kgww
RootsWater content of roots WR 0.89 L kg−1
Lipid content of roots LR 0.025 kg kgww−1
Transpiration stream Q 1 L d−1
Root mass MR 1 kgww
1st order growth rate kR 0.1 d−1
LeavesShoot mass ML 1 kgww
Leaf area AL 5 m2
Shoot density ρL 1,000 kgww m−3
Lipid content leaves LL 0.02 kg kgww−1
Water content leaves WL 0.8 L kg−1
Conductance leaves gL 86.4 m d−1
Deposition velocity from air vdep 86.4 m d−1
Growth rate leaves kL 0.035 d−1
Transfer with attached soil RL 0.01 kg kg−1
Time to harvest tL 60 d

384 S. Trapp and C.N. Legind
concentration vector C(0) for the next period. This refers to concentrations in anycompartment (i.e. soil, roots and leaves).
9.4.5 Input Data for the Root and Leaf Model
Input data are the same for the steady state and the dynamic model version and aremostly taken from the carrot model (Trapp 2002) and the leafy vegetables model(Trapp and Matthies 1995) (Table 9.1).
9.5 Influence of Contaminant-Specific Parameters
The uptake of contaminants into plants and their accumulation depends oncontaminant-specific parameters. The importance of some of these parameters isinvestigated in this section by using the models described before. Also, experimen-tal results are reported, not only with the intention to give a review, but also in orderto confirm (or to falsify) the processes and the principal outcomes of the model sim-ulations. Many experimental studies on plant uptake of organic contaminants areavailable, but most of them are from laboratory or greenhouse experiments, and theresults may not always be applicable to field conditions. Results from field studies,however, are less often published. This may be due to high expenses, analytical diffi-culties or other research priorities. But a reason may also be that the results of uptakestudies from outdoors often show a very large variation and are difficult to interpret.
9.5.1 KOW on Accumulation in Roots and Potatoes
Figure 9.5 shows the calculated concentration in roots (steady-state solutionEq. 9.22) and potatoes (Trapp et al. 2007a) for a constant soil concentration of 1 mgkg−1 (wet weight). The most relevant contaminant-specific parameter in the rootand potato model is the log KOW, which is varied from 0 (polar contaminants) to 8(super-lipophilic contaminants). The concentrations are compared to the concentra-tions resulting from the equilibrium partition coefficient approach (RCF, Eqs. 9.5and 9.10) and to the Travis and Arms-regression (“T&A”, Eq. 9.3). For very polarcontaminants, the concentration in roots and potatoes is predicted to be higher thanthe concentration in soil. This is because very polar contaminants are mainly foundin aqueous phases, and roots and potatoes contain usually more water (up to 95%)than soil (about 30%). For more lipophilic contaminants, the RCF (here related tosoil, i.e. RCF/KSW) approaches a value of 1, due to the similar sorption capacity ofroots and soil.
For polar contaminants, the regression of T&A and the two dynamic modelsgive results close to the equilibrium (RCF). With increasing lipophilicity, the pre-dicted concentration decreases and the deviation from equilibrium increases. The

9 Organic Contaminants from Soil into Vegetables and Fruits 385
0.0001
0.001
0.01
0.1
1
10
0 2 4 6 8
log KowC
ro
ot
(mg
/kg
ww
)T&A RCF
root model potato model
Fig. 9.5 Concentration inroot (fresh weight) withvarying log KOW, predictedwith the regression of Travisand Arms (T&A), the rootconcentration factor (RCF),the root model and the potatomodel. Concentration in soilis equal to 1 mg kg−1 (wetweight)
root and the potato model include growth dilution, and the effect of this growthdilution increases with increasing log KOW. The BCF predicted by the root modelat log KOW 7 is more than a factor 1000 below chemical equilibrium. Chemicalequilibrium may be found in the peel or close to the peel. But the inner substance ofroots and potatoes will have much lower concentrations (Trapp 2002, 2007).
Interestingly, the T&A regression was originally established for above-groundcrops. But Fig. 9.5 shows that the predicted bioconcentration in plants is veryclose to that predicted by the root model (advective uptake) and the potato model(diffusive uptake).
In current chemical Risk Assessment (EC 2003) and in some Risk Assessmenttools for contaminated soils, predictions of concentrations in root vegetables arebased on the equilibrium approach. This will lead to an overestimation of theconcentration in roots and, hence, of human exposure (Legind and Trapp 2009).Recent studies showed that uptake into root vegetables (radishes) may also befrom air (Mikes et al. 2009). This has not yet been considered in any available rootuptake model.
9.5.2 KOW and KAW on Accumulation of Contaminants in Leaves
Simulations were done with the leaf model described in Section 9.4.3 (Eq. 9.23). Avalue of 0.1% attached soil was chosen as default. This gives a minimum BCF of0.001 kg kg−1 (wet weight) for all contaminants.
Figure 9.6a shows the calculated concentration in leaves for a concentration insoil of 1 mg kg−1, and in air of 0 mg m−3. Log KOW (x-axis) is varied for volatile(KAW: 0.2 L L−1), semi-volatile (KAW: 0.001 L L−1) and non-volatile contaminants(KAW: is 10−6 L L−1). For all volatile contaminants, the concentration in leavesis low (0.001 mg kg−1) over the whole range of log KOW. This means that theiraccumulation due to translocation to leaves is low; the plotted concentration is dueto attachment of soil particles only (default 0.1%).
The semi-volatile contaminants show some accumulation, up to a BCF of 0.01kg kg−1 for the most polar contaminants. With increasing lipophilicity of the

386 S. Trapp and C.N. Legind
0 1 2 3 4 5 6
0.20.0011.E–060.001
0.01
0.1
1
10
C le
aflog Kow
Kaw
01
23
45
60.2
0.00
1
1.E
–06
0.01
0.1
1
10
C le
af
log Kow
Kaw
(a)
(b)
Fig. 9.6 Simulatedconcentration in leaves forcompounds with varying logKOW and varying partitioncoefficient air-water (KAW),for a concentration in soilequal to 1 mg kg−1 (wetweight). Concentration in airis (a) 0 and (b) in phaseequilibrium with soil
contaminants the accumulation decreases. The largest accumulation is seen fornon-volatile contaminants, in particular for the polar ones (low KOW). These con-taminants are readily soluble in soil pore water, taken up by plants with the soilpore water and translocated to the leaves. From the leaves, the water evaporates, butthe contaminants remain. For non-volatile chemicals (KAW → 0), calculated con-centrations of polar contaminants in leaves are more than 100 times higher thanin soil.
Sulfolane (tetrahydrothiophene 1,1-dioxide) is an organo-sulfur contaminantused as solvent that accumulates in leaves. Sulfolane is neutral, polar (log KOW of–0.77) and non-volatile (KAW of 2.14×10⁻⁴). The uptake of sulfolane into wetlandvegetation was measured in field and greenhouse studies (Doucette et al. 2005). Themeasured RCF was between 0.3 and 1.4 L kg−1 (related to the initial concentra-tion in solution). High translocation to leaves was found. The BCF values for shootswere up to 160. Another experiment with sulfolane was done for apples (Chard et al.2006). The concentration ratio of fruit to soil was 2.8. For leaves, a BCF of 652 wasfound. As far as the authors are aware, this is the highest BCF plant to soil thatwas ever measured, and confirms model predictions in which polar, non-volatilecontaminants are best translocated to and accumulated in leaves. Also measured

9 Organic Contaminants from Soil into Vegetables and Fruits 387
BCFs for hexahydro-1,3,5-trinitro-1,3,5-triazine (RDX) (McKone and Maddalena2007) confirm model predictions for polar non-volatile contaminants.
Contrarily, trichloroethene (TCE) is a volatile chlorinated solvent (KAW: 0.5L L−1) that does not accumulate in leaves. A study on trichloroethylene uptake byapple and peach trees and transfer to fruit was performed by Chard et al. (2006).No TCE could be detected in fruits, but 14C from unidentified metabolites wasfound. In leaves, the metabolites dichloroacetic acid (DCAA) and trichloroaceticacid (TCAA) could be detected. The article cites a field study where TCE could bedetected in several fruits, but only in traces. Overall, the findings confirm the modelprediction (Fig. 9.6a) that volatile contaminants do not show high accumulation inabove-ground plant parts like leaves.
9.5.3 Uptake from Air Versus Uptake from Soil
A frequent experimental result is that contaminants are found in moderate or evenhigh concentrations in plants even though concentrations in soil are low (Delschenet al. 1996, 1999; Mikes et al. 2009). This is typically the case when uptake is mainlyfrom air (compare Section 9.3.1). The simulations displayed in Fig. 9.6b were donefor identical conditions as for Fig. 9.6a, except that the concentration in air was set tophase equilibrium to soil (i.e., CAir = KAW × CSoil/KSW), with concentration in soilequal to 1 mg kg−1). The development of the concentration in plants is completelydifferent from Fig. 9.6a (note that the figure was rotated and the z-axis crosses nowat CLeaf equal to 1 mg kg−1). The concentration in leaves is higher than in Fig. 9.6awhere there was no contaminant present in the air, in particular for volatile contam-inants (KAW: 0.2 L L−1). Also, the concentration is less variable, with most valuesbetween 1 and 10 mg kg−1. This is because for most contaminants the system isclose to equilibrium in regard to soil with air and air with leaves. An exception arethe non-volatile contaminants, their predicted concentration does not change sub-stantially. For the polar and non-volatile contaminants, the calculated concentrationin leaves is particularly high.
From Fig. 9.6a and b it can be seen that the partition coefficient between airand water (also known as the dimensionless Henry’s Law constant) is a veryimportant parameter for calculation of the accumulation in leaves, because KOA
(the ratio of KOW and KAW) determines partitioning into leaves. Leaves have avery high exchange with air (that is their role in plant physiology), and anyvolatile contaminant (with high KAW) will escape from leaves into air and will notaccumulate.
The pattern of uptake of contaminants from soil into fruits is very similar (notshown), although the level of concentrations is typically about a factor of 10 lower(Trapp 2007). This means that also, in fruits, polar and non-volatile contaminantshave the highest potential for accumulation from soil.
Uptake into fruits of lipophilic contaminants is preferably from air. An exam-ple is the transfer of PCDD/F from contaminated sites into field crops, whichhas been intensively studied. Müller et al. (1994) found an increase of PCDD/F

388 S. Trapp and C.N. Legind
concentrations in the peel of carrots, when grown at a PCDD/F-contaminated site.No increase of the concentration in lettuce and peas was found. In a similar study,it could be shown that the transfer of PCDD/F into apples and pears is exclusivelyfrom air (Müller et al. 1993). The results from these studies confirm the modelpredictions in which uptake of lipophilic contaminants into above-ground plant partsis primarily from air. However, there are exceptions. Hülster et al. (1994) could proofa transfer of PCCD/F into zucchini and pumpkins in field experiments, which wasmuch higher than for other fruits.
Another example is benzo(a)pyrene (BaP). The range of measured concentra-tions of BaP in food crops is quite large, from 0.01 to 48 μg kg−1. Generally, leafyvegetables and lettuce had the highest concentrations, followed by grains, potatoand root vegetables (Kazerouni et al. 2001; Samsøe-Petersen et al. 2002; SCF 2002).This indicates air as the primary source for contamination of vegetables with PAHs.
Uptake of organochlorine pesticides and polychlorinated biphenyls (PCBs) fromsoil and air into radishes were measured at a contaminated field site in the CzechRepublic (Mikes et al. 2009). Root concentration factors (RCF) and bioconcentra-tion factors for leaves (BCFL) were determined by linear regression. The transferfrom soil into leaves (average BCFL 0.08 kg kgdw
−1) was rather constant for allcontaminants and could best be explained by soil particle attachment. Generally,uptake from air was higher than uptake from soil. Uptake from air into radishroots and bulbs was observed. The example in Section 9.3.1 was taken from thisstudy.
9.5.4 Dissipation from Soil
The simulations above were done for the steady-state situation, with constant con-centration in soil. However, contaminants can rapidly dissipate from soil by severalremoval processes, such as degradation, plant uptake, leaching, volatilization andsequestration.
An example is shown in Fig. 9.7. Ortho-xylene is a moderately lipophilic con-taminant which is rapidly degraded in soil. Søvik et al. (2002) give a first-orderdegradation rate constant of 0.11 d−1, i.e. a half-life of about 1 week. After a fewweeks, the concentration in soil has approached zero. The simulated concentrationin roots closely follows this pattern: About four days after the pulse input, the calcu-lated concentration in root is already close to equilibrium to soil, and parallel withthe concentration in soil, concentration in roots falls to very low values within a fewweeks, in any case before the harvest. A steady state simulation with constant soilconcentration would overpredict concentrations in the harvest product by severalorders of magnitude.
The degradation or total dissipation rate is a key variable. To some extent,elimination in soil is related to physico-chemical properties. Bacterial degradationdepends on the bioavailable fraction of the contaminants (Alexander 2000;Reichenberg and Mayer 2006), which is typically higher at low sorption and lowsequestration. Plant uptake and leaching are important for soluble contaminants

9 Organic Contaminants from Soil into Vegetables and Fruits 389
0.0
0.2
0.4
0.6
0.8
1.0
1.2
0 10 20 30 40Time (d)
C (
mg
/kg
)
soil root
Fig. 9.7 Simulatedconcentration of o-xylene insoil and roots as a function oftime, with a degradation rateof 0.11 d−1
with low KOW. Volatilization to air depends on KAW (or KOA). Therefore, polar andvolatile contaminants (low KOW, high KAW) show shorter residence time in soil.The actual dissipation rate, however, cannot be predicted from physico-chemicalproperties alone but is an input data usually derived from experiments.
9.5.5 Impact of pKa and pH on Uptake of Ionisable Contaminants
Ionisable contaminants, i.e. acids, bases, zwitterions or amphoters, may be presentin soils as neutral or ionic molecules. The neutral and the ionic molecules havecompletely different physico-chemical properties. The ion is usually much morepolar and water soluble and has a very low vapor pressure compared to the neutralspecies. Thus, the ion is a polar and non-volatile contaminant, and as such has ahigh potential for accumulation in plants. On the other hand, cations have a strongtendency to adsorb to soil organic matter and/or clay (Franco and Trapp 2008).Besides, charged contaminants cross biomembranes slowly (Trapp 2004), whichlimits their uptake.
A process that may lead to high accumulation of ionisable contaminants is theion trap. This principle is described in Fig. 9.8, for an acid. If the pH outside inthe soil pore water is low, a weak acid is at least partly neutral. The uptake intothe cell is rapid (provided that the contaminant is not too hydrophilic). The pH incell sap (cytosol) is about 7 to 7.5, in xylem about 5.5, and in phloem about 8. Inparticular in cytosol and phloem, weak acids dissociate and form the anion. Themembrane permeability of the anion is very low, and reverse diffusion is slow. Asa consequence, the anion is trapped inside the cytosol or the phloem. The sameprocess occurs for a base, when the cell sap is acid, compared to the outsidesoil pore water, for example in the vacuoles of plant cells and in the xylem (pHis 5.5).
Summarizing, the ion trap requires a gradient in pH between outside and insideof the plant, so that the outside pH is lower (for bases: higher) than the inside pH.Second, a pKa at or somewhat below (for bases: above) the outside pH is neces-sary, so that a relevant fraction of contaminants is neutral outside, but most of it is

390 S. Trapp and C.N. Legind
Fig. 9.8 Principle of the iontrap. AH is the neutralcontaminant (here an acid),and A− is the ion (here ananion)
ionic inside. This means that weak acids (pKa 2–6) may accumulate in the alkalinephloem (and are in consequence transported to fruits), while weak bases (pKa 6–10)tend to accumulate in the acidic xylem (and are translocated to leaves). Examples ofsuch contaminants are herbicides like 2,4-D (Shone and Wood 1974) and sulfony-lureas (Fahl et al. 1995), and drugs like the base trimethropin (Boxall et al. 2006)and the acid ibuprofen.
Briggs et al. (1987) determined the RCF and TSCF of weak organic acids withlog KOW between 0.06 and 4.51 and pKa-values near 3. At pH 7 in external solution,RCF-values were low, between 0.5 and 4.5 L kg−1. At pH 4, the RCF-values werehigher and ranged from 2.6 to 72 L kg−1. Similar, the TSCF-values of weak acids atpH 7 were low, 0.04 to 0.05 L L−1, while at pH 4 TSCF-values up to 4.2 L L−1 werefound. Briggs et al. used the ion trap process to interpret their results. Chamberlainet al. (1998) studied the uptake into roots and translocation to shoots of two weakbases, i.e. dodemorph (pKa 7.8) and tridemorph (pKa 7.4). At pH 5, RCF-values ofdodemorph were < 10 L kg−1, and of tridemorph about 20 L kg−1. With increasingpH, RCF increased to 49 L kg−1 for dodemorph and 183 L kg−1 for tridemorphat pH 8. In parallel, the TSCF increased from < 1 L L−1 for both bases at pH 5 to24 L L−1 for dodemorph and slightly below 10 L L−1 for tridemorph at pH 8. Toour knowledge, the TSCF of dodemorph in this experiment was the highest TSCFever determined. A similar study was done by Inoue et al. (1998), who also founda large increase of uptake and translocation of weak bases in plants with increasingpH. The results from these studies underline the importance of pH in the soil porewater for uptake and translocation of weak electrolytes. However, the results havenot yet been confirmed by field studies.
9.6 Influence of Plant-Specific Parameters
As pointed out in the introduction, there are a very high number of plant-contaminant combinations, and the simulations done for a generic plant are notnecessarily valid for the whole plant empire and all contaminants. In this sec-tion, some properties of plants are discussed, which vary and may lead to differentaccumulation of contaminants.

9 Organic Contaminants from Soil into Vegetables and Fruits 391
9.6.1 Crop Types and Uptake Pathways
The crop type has a very large impact on uptake processes, e.g. roots and potatoesare in close contact to soil, while apples are not. As a consequence, the accumulationof contaminants from soil is much lower in apples and other tree fruits, whereasthe accumulation by uptake directly from air is higher for fruits. It is obvious thatcrop-specific models will give more realistic predictions of concentrations.
Even between different species of the same crop type differences in uptake canexist. For zucchini and pumpkin (Cucurbita pepo), both members of the plant familyCucurbitaceae and the genus Cucurbita, root uptake and subsequent translocationto shoots and fruits was the main uptake route of PCDD/F, probably due to root exu-dates which mobilize lipophilic contaminants (Hülster and Marschner 1995) and anincreased mobility in the transpiration stream (Gent et al. 2007). However, fruitsand leaves from other plant species, even for the closely related cucumber plant(Cucumis sativus), were mainly contaminated by airborne PCDD/F (Hülster andMarschner 1994; Hülster et al. 1994). The exact reason for the ability of cucurbitaplants to extract lipophilic contaminants from soil and transport them with the xylemsap is yet unknown, but it was observed repeatedly, and for a number of lipophilicorganic contaminants, such as p,p′-DDE (White 2002), DDT (Lunney et al. 2004),PCB (Whitfield Åslund et al. 2007) and PBDE (Mueller et al. 2006). For phenan-threne, unusual high adsorption to a range of plant species was observed (Zhu et al.2007).
9.6.2 Physiological Parameters
The importance of physiological plant-specific parameters, such as transpirationrate, leaf area, conductance, water and lipid contents as well as growth rate, dependslargely on the properties of the contaminant. For water soluble contaminants, whichare rapidly translocated from soil to leaves, the transpiration rate is among the mostimportant parameters, since the accumulation in leaves is almost directly dependenton the transpiration.
This is illustrated with the example of carbofuran in Fig. 9.9. The log KOW of thiscontaminant is 1.6–2.07 (Trapp and Pussemier 1991). Two calculations were done,one with the standard transpiration of 1 L d−1, the other with an increased transpira-tion of 5 L d−1. The simulated concentration in roots remains nearly constant withincreasing transpiration, only the time period until steady state is reached is shorter.However, the breakthrough of contaminant into leaves is faster and the calculatedconcentration in leaves is a factor of 5 higher for the increased transpiration ratedue to their direct relationship. The translocation of carbofuran in bean plants wasdetermined experimentally, and the concentration pattern as well as the close rela-tion between transpiration and concentration in leaves was confirmed (Trapp andPussemier 1991).
In turn, the amount of transpired water depends on temperature, humidity, leafarea and stomata permeability. However, the transpiration depends also on the

392 S. Trapp and C.N. Legind
0
2
4
6
8
10
12
0 5 10 15 20
Time (d)
C (
mg
/kg
)root low Q leaf low Qroot high Q leaf high Q
Fig. 9.9 Simulation of theconcentration of carbofuranin plants as a function oftime, with low transpiration(Q is 1 L d−1) and hightranspiration (Q is 5 L d−1).Dynamic model version, dataTable 9.1
availability of water. Students in a field course at the Technical University ofDenmark noticed that concentrations of chlorinated solvents (PCE and TCE) mea-sured in wood cores taken from trees growing at the Glostrup site (Denmark) weremuch lower in the very dry June 2008 than in the very wet June 2007 (MetteBroholm, personal communication). A plausible explanation is a reduced transpi-ration due to water stress in 2008. Transpiration in field settings can be estimatedusing the Penman-Monteith model by Penman (1948) and Monteith (1964) (cited in(Monteith 1995)).
Leaves grow and contaminants entering the leaf with the transpiration stream arenot uniformly distributed in the leaf, but tend to accumulate in the leaf tip (Doucetteet al. 2005).
9.6.3 Plant Morphology and Collection Efficiency for Particles
The resuspension of contaminated soil particles from soil to plant surfaces is animportant transport mechanism for lipophilic contaminants. This transfer pathwaywas well studied using insoluble radionuclides, and large variations were found insoil attachment among plant species. Soil particles may reach leaf surfaces mainlyby three mechanisms, namely rain splash, wind erosion and erosion due to agricul-tural practice (ploughing, harvesting et cetera). Table 9.2 shows measured valuesfor the transfer of radionuclides (Li et al. 1994). The transfer range varies from1.1 to 260 mg soil gplant
−1 (dry weight), depending on the species. But also, theintraspecies variation was considerable, as can be seen from the standard devia-tions given in Table 9.2. The highest value was found for lettuce, with 260 mg soilgplant
−1 (dry weight), probably due to the small size of the plant (< 40 cm), the leafmorphology where leaves are collecting particles to the interior of the plant, andthe surface structure. It was also demonstrated that particle-bound organic contami-nants migrate from the leaf surface to the interior of the leaf (i.e. are overgrown bysurface waxes), from where they can not be washed off (Kaupp 1996). A BCF forradish leaves to soil of 0.08 kg kgdw
−1 was recently measured at a Czech site for

9 Organic Contaminants from Soil into Vegetables and Fruits 393
Table 9.2 Transfer of attached soil particles to leaf surfaces (Li et al. 1994); expressed as mg soilgplant dw
−1 ± standard deviation
Plant species Amount of soil (mg soil gplant dw−1)
Lettuce 260 ± 100Turnip 32 ± 11Grass 18 ± 48Tomato 17Broccoli 10 ± 8.1Bean leaves 9.5Grass (Lolium) 5.8Wheat 4.8Sun flowers 2.6 ± 0.9Tobacco 2.1 ± 0.6Soy bean 2.1Maize 1.4Cabbage 1.1 ± 1.1Average 28.2Average (for fresh weight)∗ 1.4
∗Based on 95% water content of plants
persistent lipophilic contaminants and was contributed to soil particle attachment(Mikes et al. 2009).
A default value of 10 mg soil gplant−1 (fresh weight) for transfer of attached
soil was chosen for lettuce in the New Model Framework for dietary exposure ofchildren and adults (Legind and Trapp 2009) (for lettuce, ρL,wet = 1 kgfw L−1 andρL,dry = 0.2 kgdw L−1, so this corresponds to 50 mg soil gplant
−1 (dry weight)).For grains, 1 mg soil gplant
−1 (fresh weight) transfer with attached soil particles wasassumed, due to pollution at harvest. In models predicting the exposure to radio-nuclides, the default value for the transfer of attached soil is 5 mg soil gplant
−1
(fresh weight) (25 mg soil gplant−1 (dry weight)) for pasture grass, and 1 mg soil
gplant−1 (fresh weight) for other plants (Paretzke and Garland 1990).
In systematic experiments, Delschen et al. (1996, 1999) investigated the uptakeand the uptake pathways of PAHs (polycyclic aromatic hydrocarbons) into vegeta-bles and crops. They found that uptake of PAHs can both be from contaminated sitesand from the atmosphere. In some experiments, the soil was covered with fine sandor a gas-permeable foliage. This avoided soil particle attachment, but allowed forvolatilization with subsequent adsorption to leaves. In fact, this coverage reduced theuptake of 15 PAHs from soil almost completely, indicating soil particle attachmentto leaves as a major transfer pathway of PAHs (in particular benzo(a)pyrene anddibenz(a,h)-anthracene) from soil to vegetables. Thus, crops with harvested partsclose to the soil surface have the highest affinity for accumulation, because soil par-ticle attachment by rain splashing rarely affects plants with a height above 40 cm(Dreicer et al. 1984; Li et al. 1994). No systemic uptake of PAHs via plant roots wasfound. Concentrations of PAHs in peels of potato and carrots from organic farmingwere generally higher than in the core of potatoes and carrots (Zohair et al. 2006).The BCF for individual PAHs ranged from 0.0002 to 0.3 kg kg−1 and decreased with

394 S. Trapp and C.N. Legind
log KOW (Trapp et al. 2007a; Zohair et al. 2006). The results from the experimentsare in good accordance with the model predictions.
Note that the ingestion of soil attached to the daily vegetable diet may be higherthan the current estimate for direct soil ingestion used in Exposure Assessmentsfor humans. The direct ingestion of soil is 50 mg/day for adults and 100 mg/dfor children (ECETOC 2001). The average lettuce consumption in Denmark is6 g/d for children and 9 g/d for an adult woman. A transfer of 1% (10 mg soilgplant
−1 (fresh weight)) due to attached soil corresponds to 60 mg/d and 90 mg/dsoil ingestion with lettuce only. Other vegetables and fruits are consumed at 389 g/d(children) and 475 g/d (mother). If on average 0.1% soil were attached, this cor-responds to 389 mg/d and 475 mg/d of soil, which is much more than the valueof direct ingestion of soil and deserves consideration in Human Health ExposureAssessment.
9.6.4 Variation of Partition Coefficients
The RCF regressions for barley (Briggs et al. 1982) and bean plants (Trapp andPussemier 1991) differ (Fig. 9.3). Also, the partition coefficients between leaves andair, KLA, vary with plant species. The KLA depends both on plant-specific parameters(such as plant lipid content and empirical exponent b (Eq. 9.10)) and contaminant-specific parameters (KOW and KAW or KOA). Kömp and McLachlan (1997) founddifferences in the uptake of PCB between five different plant species of up to afactor of 20. There was a linear relationship between log KPA and log KOA valueswithin each plant species, but the slopes of the regressions ranged from 0.57 to 1.15.The standard value for leaves (slope = b = 0.95, Eq. 9.9) was determined by Briggset al. (1983) and lies in this range.
9.6.5 Permeability
The velocity of diffusive uptake from air and loss to air is controlled by the per-meability of leaves (synonyms exchange velocity, conductance or transfer velocity).Three major resistances control the exchange: air boundary layer resistance, stom-ata resistance and cuticle resistance (Riederer 1995). Their importance depends onthe chemical properties but varies for each leaf. Volatile and gaseous contaminantswill prefer stomata for the entry to or escape from plants, while lipophilic contami-nants will preferably diffuse through cuticles. The stomata resistance for water andcontaminants can be calculated from the transpiration rate, leaf area, temperatureand humidity (Trapp 1995, 2007). The cuticle resistance depends on thickness anddiffusivity inside the cuticle (Schönherr and Riederer 1989). The latter is highlyvariable with species and temperature (Buchholz et al. 1998): at high temperatures,the surface waxes liquidize and get more permeable.
A method for estimation of conductance g (m s−1, related to gas phase) is givenby Trapp (1995, 2007). Values for g estimated with this method range from 9×10⁻³

9 Organic Contaminants from Soil into Vegetables and Fruits 395
m s−1 for non-volatile, lipophilic contaminants to 0.2×10⁻³ m s−1 for volatile orpolar contaminants. A default value of 10−3 m s−1 was suggested, to avoid lenghtycalculations (Trapp and Matthies 1995).
9.6.6 Particle Deposition
A similar variability can be observed for the particle deposition rate. Particle depo-sition depends on the fraction of contaminant adsorbed to particles, the depositionvelocity of particles, as well as characteristics of the leaves. The fraction adsorbedto particles, fP, is often calculated from the Junge equation, using vapor pressure asinput data (Junge 1977; cited in EC 2003). Newer methods are based on the KOA
(Cousins and Mackay 2001).The particle deposition rate for wet and dry deposition, vdep, changes with the
diameter of the particles. Default values are given in the German TA-Luft and arelisted in Table 9.3. Generally, diameters and thus deposition velocities are higherclose to the source of emission. At larger distance the coarse particles have settled,and finer particles remain. The deposition rate of fine particles is similar to the con-ductance of gases, and the default value of vdep (10−3 m s−1) is the same as forconductance g. Thus, uncertainties in fP and vdep are not crucial for the calculatedresult.
Bakker et al. (1999) studied the deposition of polycyclic aromatic hydrocarbons(PAHs) on leaves from three closely related Plantago species and found variationsup to a factor of five, which could be explained solely by plant morphology andsurface structure.
Table 9.3 Depositionvelocities of particles(TA-Luft 1986)
Diameter (μm) vdep (mm s−1)
< 5 15 to 10 1010 to 50 50> 50 100unknown 70
9.6.7 Metabolism in Plants
Rapid metabolism in plants will significantly decrease the contaminant concen-tration in plants. Transformation of contaminants may occur in the rhizosphere,inside the plant and on the leaf surface. Often, it is difficult to differentiate betweenmetabolism by fungi or bacteria living on and in plants and metabolism by plantcells. Stimulation of bacterial degradation in the root zone has been observed fre-quently and is a key process in phytoremediation projects (Trapp and Karlson 2001).Therefore, it may happen that non-persistent contaminants do not reach the roots butare degraded by bacteria living on or in the vicinity of roots.

396 S. Trapp and C.N. Legind
The role of the plant enzyme system is detoxification, and there is an upperlimit, beyond which plants suffer from toxic effects and probably die (Trapp et al.2007b). This contamination of plants may limit activities in gardening, agricultureand forestry on contaminated sites.
Metabolism by plants has been described by the green liver concept, becauseplant metabolism rather resembles the processes in the animal liver than the bacterialmetabolism (Sandermann 1994). The first step (phase I reaction) is typically an oxy-genation with cytochrome P-450, followed by conjugation reactions (phase II) withglutathione-S-transferases (GST) (Barret 1995; Pflugmacher and Schröder 1995).Unlike animals, plants are not able to excrete conjugates via the urine. Instead, phaseIII of plant xenobiotic metabolism involves storage of soluble conjugates in the vac-uole and of insoluble conjugates in the cell wall (Komossa et al. 1995). This maylead to so-called bound residues. These bound unextractable residues resist solubi-lization in common laboratory solvents and are therefore not accessible to standardresidue analysis. It was found that bound residues can be present in larger amountsthan the parent contaminant and could therefore represent a source of significantconsumer exposure (Sandermann 2004).
Little is known about metabolism rates of contaminants by vegetation. Cyanide(HCN) was used as model contaminant to study the variation of rates among plantspecies. Even though inorganic, cyanide behaves like an organic contaminant interms of lipid solubility, volatility and metabolism. The removal of free cyanidefollowed Michael-Menten kinetics (Larsen et al. 2004). Adding Michaelis-Mentenkinetics to the mass balance equation for roots (Eq. 9.18) leads to the followingnon-linear equation:
dCR
dt= Q
MR× CW −
(Q
MR × KRW+ kR
)× CR − vmax × CR
KM × KRW + CR(9.38)
where vmax (mg kg−1 d−1) is the maximal metabolism velocity of the contaminantand KM (mg L−1) is the half-saturation constant and (Larsen et al. 2005).
At a low external concentration in soil pore water, all contaminants that are takenup are metabolized (Fig. 9.10). At higher concentrations, however, the enzyme sys-tem is overloaded. Then, uptake is linearly related to the external concentration.This was shown experimentally for free cyanide (HCN) by Larsen et al. (2005). Anon-linear BCF relation indicating enzymatic activity of plants was found repeat-edly, e.g. for phenol (Ucisik and Trapp 2006) and salt, NaCl (Trapp et al. 2008). Inthese cases, the BCF was low at a low external concentration in soil pore water, butincreased at higher external concentrations.
The Michaelis-Menten parameters KM and vmax varied with plant species, butless than expected. Values of vmax of 12 species from nine plant families were foundin a relatively narrow range between 6.7 and 21.9 mg CN kgplant
−1 h−1 and werenormally distributed with a mean of 13 mg CN kgplant
−1 h−1 (Yu et al. 2004). Theauthors concluded that the variation of metabolism rates between plant species was

9 Organic Contaminants from Soil into Vegetables and Fruits 397
Fig. 9.10 Calculation ofconcentration in roots ofcyanide as a function of theconcentration in externalaqueous solution (CW), usingMichaelis-Menten kineticsfor metabolism; vmax is6.9 mg kg−1 h−1; KM is0.44 mg L−1 (Larsen et al.2005)
small, and that it is likely that all investigated plants used the same enzyme fordetoxification. Another sign for common pathways and rates of metabolism in plantspecies is the difficulty to find selectively acting herbicides: it is rare that a toxin hitsweeds but not crops (Börner 1995).
9.7 Environmental Variables
Which contaminants are taken up into plants and the variation in the affinity foruptake, and hence accumulation, depends also on environmental parameters. Theimportance of some of these parameters is investigated in this section by using themodels described before and some experimental results.
9.7.1 Climate
Principally, the models can be adapted to all climatic conditions at which plantsgrow. In particular temperature influences uptake and fate of xenobiotics in variousways. At higher temperatures plant physiological processes such as transpiration,growth and metabolism are stimulated. According to Claudius-Clapeyron’s law, thevapor pressure increases exponentially with temperature, so the vapor pressure ofwater in air is 872 Pa at 5◦C but 5635 Pa at 35◦C, i.e. a factor of 6.5 higher.The potential transpiration is directly proportional to the vapor pressure of water.Similarly, metabolic reactions are stimulated at higher temperatures. For example,the removal rate of cyanide was 3−5 times higher at 30◦C than at 11◦C (Yu et al.2005a, 2007). Also, contaminant properties change with temperature. Like the vaporpressure, the partition coefficient air to water, KAW also increases exponentially withtemperature. For chlorinated solvents, such as TCE, the KAW at 5◦C is about a factorof 3 below that at 35◦C (Kühne et al. 2005). This means less accumulation in leavesand more volatilization to air at higher temperatures.

398 S. Trapp and C.N. Legind
9.7.2 Bioavailability
The concentration in the soil pore water is for neutral organic contaminants cal-culated from the KOC. The bioavailability of contaminants may be reduced due toaging (Alexander 2000). At contaminated sites the soil pore water concentrationscan be much lower and sorption coefficients can be much higher than equilibriumpartitioning models predict (Ter Laak et al. 2006). Cations are attracted by the elec-trical potential of living cells, but also adsorb to soil organic carbon and to negativelycharged clay particles (Franco and Trapp 2008). This reduces their bioavailabil-ity and, hence, uptake. Also, a depletion of contaminants in soil due to uptakeinto plants should be taken into account. In Chapter 16 an extended descriptionof bioavailability is given.
9.7.3 Soil pH
Soil pH directly affects the speciation of acids and bases, as described by theHenderson-Hasselbalch law (log [A−]/[HA] = pH − pKa). Uptake of anions isgenerally lower than of neutral molecules, due to electrical repulsion and slow trans-fer across membranes. Both weak acids and bases can undergo the ion trap process(Section 9.5.5). This will lead to an accumulation of weak acids from acidic soils,and of bases from alkaline soils. This conclusion is based on a model prediction andhas not yet been confirmed by experiments. The pH also has an indirect effect onuptake: many plants do not grow well outside their optimum pH range. Extreme pH(high or low), will lead to reduced growth, and this may be accompanied by reduceduptake of contaminants.
9.7.4 Uncertainties in Predictions
Sections 9.5, 9.6 and 9.7 list parameters and variables that influence the uptake ofcontaminants into plants. Most likely, this list is far from complete. This may explainwhy under some conditions, in some experiments, a high uptake of a contaminantinto a plant may be found, while this may not be the case in the next investiga-tion, under other conditions. It also explains why data from experiments with plantsoften suffer from large scatter. Besides, care must be taken when results obtainedfrom uptake studies are translated to other crop types, other climates, and otheragricultural practices.
Models may help to design and interpret uptake experiments, in indicating rel-evant processes and pathways, and hence in translating results to other conditions.But due to the large number of parameters and their high variability in space andtime, these models can not be expected to give exact results. Some studies testedthe validity of model approaches (Fryer and Collins 2003; Legind and Trapp 2009;McKone and Maddalena 2007; Rikken et al. 2001; Trapp and Schwartz 2000).
9 Organic Contaminants from Soil into Vegetables and Fruits 399
Often, the results were ambiguous, because the influence of concentrations in aircould not be quantified (compare Section 9.3.1), but also due to large uncertaintiesin measured as well as predicted concentrations in plants (McKone and Maddalena2007). The primary role of models is to indicate relevant processes and the potentialfor accumulation of contaminants in plants. Good decision making needs to considerboth model predictions and experimental data.
In a critical review of uncertainties related to soil-to-plant bioconcentrationfactors by McKone and Maddalena (2007), BCF-values for the explosive RDX(hexahydro-1,3,5-trinitro-1,3,5-triazine) are listed. RDX is a quite persistent, rel-atively polar (log KOW: 0.87) and non-volatile contaminant (KAW: 6.3 × 10⁻⁸ atmm3 mol−1). BCF-values range from 0.06 (mg kgww plant
−1: mg kgdw soil−1) in bean
pods and 0.07 (mg kg ww plant−1: mg L water−1) in bean fruits at the lower end to
19.2 (mg kgww plant−1: mg Lwater
−1) in bean leaves and 28.6 (mg kgdw plant−1: mg
kgdw soil−1) in carrot shoots at the upper end. Overall, fruits tend to have lower BCF
values than roots, and leaves have the highest accumulation, but there is a very largevariation in the data. The BCF values for fruits range from 0.07 to 5.50, for rootsfrom 0.08 to 4.50 and for leaves from 0.30 to 28.6, i.e. the maximum BCF is 79fold, 56 fold or 93 fold larger than the minimum BCF. Even though the units are notuniform (i.e. a mix of wet weight and dry weight, soil and water), this variation isquite impressive for one single contaminant and similar crop type.
9.8 Uptake Potential of Specific Substance Classes
This section gives a short classification of several frequently found soil and ground-water contaminants with respect to their uptake into plants. It is based on the modelsimulations, measured data and the process review above, but also on the experienceof the authors.
9.8.1 Chlorinated Solvents (PCE, TCE and Others)
Chlorinated solvents such as perchloroethene (PCE) and trichloroethene (TCE) areprobably the most frequently found groundwater contaminants world-wide. Theyare water-soluble, relatively persistent and very volatile. Uptake of chlorinated sol-vents into tree trunks has been reported frequently (Chard et al. 2006; Larsen et al.2008; Sorek et al. 2008; Vroblesky et al. 1999). However, these contaminants arehighly volatile and escape rapidly from branches, small stems and leaves into the air(Baduru et al. 2008). Thus, in fruits, only metabolites of chlorinated solvents couldbe detected (Chard et al. 2006). Accumulation in root crops and potatoes is likely,though not described yet. During storage and cooking, chlorinated solvents couldbe eliminated from food stuff, due to their high volatility. Moreover, these contam-inants are not expected to be present in high concentrations in top soil, i.e. the rootzone, due to volatilization to the air and leaching to the groundwater.

400 S. Trapp and C.N. Legind
9.8.2 Gasoline Contaminants
Gasoline is a mixture of light petroleum products (for example alkanes such as hex-ane, and aromates such as benzene and toluene) plus additives like ethanol andMTBE. They frequently occur in the groundwater due to leaching storage tanks.Gasoline contaminants are volatile and usually rapidly degraded. Thus, concentra-tions in aerated soil are generally low (Fig. 9.7). Accumulation in crops from soilhas not been described, except in laboratory experiments. An exception is MTBE,which is less volatile and more persistent. MTBE was not metabolized in any of24 plant species tested (Trapp et al. 2003). Uptake of benzene from air is rapid butlevels are low, due to a low KOA, and insignificant for human exposure (Collins et al.2000).
9.8.3 Heavy Petroleum Products
The heavy fraction of petroleum products consists of long-chain alkanes and somepolycyclic aromatic hydrocarbons. These contaminants are lipophilic, volatile anddegradable under aerobic conditions. Significant uptake from soil into plants has notbeen observed and is not expected from the properties of petroleum components.
9.8.4 Polycyclic Aromatic Hydrocarbons
Polycyclic aromatic hydrocarbons (PAHs) is a group of contaminants with two(naphthalene) to seven or more condensed aromatic rings with wide-spread occur-rence in the environment from incomplete combustion. Most of these contaminantsare very lipophilic (log KOW 5−7) and have a very low water-solubility. Uptakeinto plants with transpiration water is therefore unlikely. Contamination of plants ismainly via attached soil particles or from air (Delschen et al. 1999). Uptake from soilinto the peel of carrots or potatoes may occur. Solubilization by cucurbita species(pumpkin and zucchini) is likely.
9.8.5 Persistent Organic Pollutants POPs
Persistent Organic Pollutants (POPs) are chlorinated contaminants like the pesti-cides DDT, dieldrin and lindane, but also polychlorinated biphenyls (PCB) andpolychlorinated dibenzo-p-dioxins and -furans (PCDD/F). POPs are persistent,semi-volatile and lipophilic. Similar to PAHs, the uptake with transpiration waterinto plants is very unlikely, while attached soil particles can lead to contamination ofplants. Solubilization with subsequent translocation by cucurbita species (pumpkinand zucchini) has been observed repeatedly.
9.8.6 Explosives
Explosives such as trinitrotoluene (TNT) and hexahydro-1,3,5-trinitro-1,3,5-triazine(RDX) are relatively polar contaminants with low vapor pressure. High uptake into

9 Organic Contaminants from Soil into Vegetables and Fruits 401
plants has been observed (McKone and Maddalena 2007, Thompson et al. 1998).Inside plants, a reduction of the nitro groups to amino groups is likely and wouldlead to an increase of the toxic potential. Furthermore, bound residues may beformed.
9.8.7 Phenols
Phenol is the common name for a class of contaminants with a phenolic ring. A vari-ety of chemical groups may be attached to the ring. This leads to contaminants with alarge variety of properties (nitrophenols, anilines, chlorinated phenols). Phenols areless volatile than the aromatics benzene, toluene, ethylbenzene and xylene (BTEX).The contaminant phenol as well as monochlorophenol were degraded rapidly in theroot zone (Ucisik and Trapp 2006, 2008), while 2,4-dichlorophenol was taken upinto roots and translocated to stem, and to some extent also to leaves (Ucisik et al.2007).
9.8.8 Cyanides
Cyanides are contaminants with a CN-group. They are often found at (abandoned)gasworks sites and gold mines. Free cyanide (HCN, CN−) is rapidly taken up intoroots and metabolized. An accumulation in healthy plants was not observed, becausefree CN is highly toxic (Larsen et al. 2004, 2005; Yu et al. 2004, 2005b). Iron-complexed cyanide (ferri- and ferrocyanide) is taken up by plants and translocatedupwards, while slow metabolism was observed (Ebbs et al. 2003; Larsen and Trapp2006; Samiotakis and Ebbs 2003). Field measurements at a former gas works siteshowed no accumulation of total cyanide (sum of free and complexed CN) in leaves(Trapp and Christiansen 2003, and own results, unpublished). Surface contamina-tion of crops by solid iron cyanide (such as Prussian blue) is possible and has beenobserved (“blue strawberries”).
9.9 Monitoring of Contaminants in Soils and Shallow Aquiferswith Vegetation
The uptake of soil and groundwater contaminants into plants has also positiveaspects: contaminants such as chlorinated solvents in soils and shallow aquifers canbe monitored using plant samples. In principle, every tree could be considered asa well, a pump and a passive sampler, all in one. Plant samples can be taken fromstems of trees (Fig. 9.11) and analyzed to identify and map subsurface contamina-tion. The method is rapid and cheap. Screening an area suspect of contamination inthe upper aquifer with the tree core method prior to boring observation wells cansupport the determination of optimal location of these wells, instead of arbritrarilyplacing wells. This reduces the number of wells necessary for the investigation andthus reduces overall costs. Besides, tree cores can be sampled at sites which are

402 S. Trapp and C.N. Legind
Fig. 9.11 Demonstration ofthe tree core method by oneof the authors
difficult to access with heavy equipment, for example gardens in residential areasor dense forests. Even better, the effect on trees of the contaminants in a plume isreflected by the size of tree rings, and dendrochronology can be used to determinewhen a plume passed below the tree (Balouet et al. 2007).
The potential of this monitoring procedure is large. Tree core sampling as mon-itoring method was successfully applied for chloroethenes (Gopalakrishnan et al.2007; Vroblesky et al. 1999). Larsen et al. (2008) found a good agreement betweenthe plume delineation by traditional well drilling and by tree core sampling, but onlymonotone (and not linear) relations. The authors could also use the method to mon-itor Natural Attenuation of a PCE spill. Sorek et al. (2008) even detected severalbefore unknown spills in Tel Aviv by a random sampling of trees in the city. Butthere are also limitations. Tree core sampling should rather be used for assessingthe presence of contaminants than for determining exact subsurface concentrations.Because from tree core measurements alone, precise evaluation of subsurface con-tamination will not be possible, due to varying concentrations in wood (Larsen et al.2008; Sorek et al. 2008).
The method could also be successful for some heavy metals such as cadmiumand copper, and it may also work for MTBE, perchlorate and dichlorophenol. Fora number of contaminants the method was not successful, to mention are BTEX,PAHs (except naphthalene), free and iron complexed cyanide, long-chain alkanes(generally petroleum products), phenol, monochlorophenol, iron and lead.

9 Organic Contaminants from Soil into Vegetables and Fruits 403
A free guide to vegetation sampling for screening of subsurface pollution isavailable from the web (Trapp et al. 2009).
9.10 Conclusions
What can be concluded from this review? An important conclusion is that the polarcontaminants are preferably translocated from soil and accumulate in leaves andfruits. Lipophilic contaminants will be retained in soil, roots and the lower stemand will not reach the leaves or fruits in significant amounts. Thus, polar and non-volatile contaminants, i.e. contaminants with low KOW and KAW, have the highestaccumulation potential from soil into plants. This is in conflict with the usual con-cept of bioaccumulation, where high bioaccumulation is assumed to occur for highlylipophilic contaminants (EC 2003; Mackay and Fraser 2000). Furthermore, underbackground conditions, all contaminants except the polar and non-volatile contam-inants will preferably be taken up from air and the concentration in soil does nothave much impact on the concentration in leaves, unless it is far above chemicalequilibrium.
The number of available experimental data on plant uptake of contaminantsincreases. Often, model concepts and measurements are in good agreement, butwe may also encounter surprises. Plants are living organisms, and the uptake pro-cesses are complex and variable. Uncertainties in the model predictions are high,and large variations may be expected in predicted, but also in experimental data,due to the variations of contaminant-specific, plant physiological and environmentalparameters as described in this chapter.
Acknowledgement We thank our editor, Frank Swartjes, for his initiative, patience and help. Ourwork is supported by the European Union 6th Framework Program of Research, Thematic Priority6 (Global change and ecosystems), contract number GOCE-CT-2007–036976, project 2-FUN, andcontract number GOCE 037017, project OSIRIS. This work received also financial support fromthe Danish Council for Strategic Research, project REMTEC, contract 2104-07-0009. Support forthis work was furthermore provided through a PhD grant of the University of Copenhagen forCharlotte N. Legind.Model Availability Most models mentioned in this chapter are freely available via the authors.Please send an email if you are interested.
References
Alexander M (2000) Aging, bioavailability, and overestimation of risk from environmentalpollutants. Environ Sci Technol 34:4259–4265
Baduru KK, Trapp S, Burken JG (2008) Direct measurement of VOC diffusivities in tree tissues:impacts on tree-based phytoremediation. Environ Sci Technol 42:1268–1275
Bakker M, Vorenhout M, Sijm DTHM, Kollöffel C (1999) Dry deposition of atmospheric poly-cyclic aromatic hydrocarbons in three plantago species. Environ Toxicol Chem 18, 2289–2294
Balouet J-C, Oudijk G, Smith KT, Petrisor I, Grudd H, Stocklassa B (2007) Applied dendroe-cology and environmental forensics. Characterizing and age dating environmental releases:fundamentals and case studies. Environ Forensics 8:1–17

404 S. Trapp and C.N. Legind
Barret M (1995) Metabolism of herbicides by cytochrome P 450 in corn. Drug Metabol DrugInteractions 12:299–315
Boxall ABA, Johnson P, Smith EJ, Sinclair CJ, Stutt E, Levy LS (2006) Uptake of veterinarymedicines from soils into plants. J Agric Food Chem 54(6):2288–2297
Börner H (1995) Unkrautbekämpfung. Gustav Fischer, Jena, DBrand E, Otte PF, Lijzen JPA (2007) CSOIL 2000: an exposure model for human risk assessment of
soil contamination. RIVM Report 711701054/2007, National Institute of Public Health and theEnvironment. http://rivm.openrepository.com/rivm/bitstream/10029/13385/1/711701054.pdf.Accessed 13 August 2010
Briggs GG, Bromilow RH, Evans AA (1982) Relationship between lipophilicity and root uptakeand translocation of non-ionised chemicals by barley. Pestic Sci 13:495–504
Briggs GG, Bromilow RH, Evans AA, Williams M (1983) Relationships between lipophilicity andthe distribution of non-ionised chemicals in barley shoots following uptake by the roots. PesticSci 14:492–500
Briggs GG, Rigitano RLO, Bromilow RH (1987) Physicochemical factors affecting uptake by rootsand translocation to shoots of weak acids in barley. Pestic Sci 19:101–112
Buchholz A, Baur P, Schönherr J (1998) Differences among plane species in cuticular per-meabilities and solute mobilities are not caused by differential size selectivities. Planta206:322–328
Burken JG, Schnoor JL (1998) Predictive relationships for uptake of organic contaminants byhybrid poplar trees. Environ Sci Technol 32:3379–3385
Chamberlain K, Patel S, Bromilow RH (1998) Uptake by roots and translocation to shoots of twomorpholine fungicides in barley. Pestic Sci 54:1–7
Chard BK, Doucette WJ, Chard JK, Bugbee B, Gorder K (2006) Trichloroethylene uptake by appleand peach trees: greenhouse study. Environ Sci Technol 40:4788–4793
Chiou CT, Sheng GY, Manes M (2001) A partition-limited model for the plant uptake of organiccontaminants from soil and water. Environ Sci Technol 35(7):1437–1444
Collins CD, Bell JNB, Crews C (2000) Benzene accumulation in horticultural crops. Chemosphere40:109–114
Cousins I, Mackay D (2001) Gas-particle partitioning of organic compounds and its interpretationusing relative solubilities. Environ Sci Technol 35:643–647
Czub G, McLachlan MS (2004) A food chain model to predict the levels of lipophilic organiccontaminants in humans. Environ Toxicol Chem 23:2356–2366
DEFRA (Department for Environment Food and Rural Affairs) (2002) The Contaminated landexposure assessment model (CLEA): technical basis and algorithms. R & D PublicationsCLR 10, Environment Agency. http://publications.environment-agency.gov.uk/pdf/SCLR10-e-p.pdf?lang=_e. Accessed 13 August 2010
Delschen T, Hembrock-Heger A, Necker U (1996) Systematische Untersuchungen zum Verhaltenvon PAK und PCB im System Boden/Pflanze auf der Lysimeter-Anlage Waldfeucht (1989–1994). In: Landesumweltamt NRW (eds) Materialien zur Ermittlung und Sanierung vonAltlasten, LUA Essen, Germany, pp 1–214
Delschen T, Hembrock-Heger A, Leisner-Saaber J, Sopczak D (1999) Bedeutung verschiedenerBelastungsursachen für den PAK-Gehalt von Kulturpflanzen. Umweltwissenschaften undSchadstoff-Forschung, UWSF – Z Umweltchem Ökotox 11:79–87
Dettenmaier EM, Doucette WJ, Bugbee B (2009) Chemical hydrophobicity and uptake by plantroots. Environ Sci Technol 43(2):324–329
Doucette WJ, Chard TJK, Moore BJ, Staudt WJ, Headley JV (2005) Uptake of sulfolane anddiisopropanolamine (DIPA) by cattails (Typha latifolia). Microchem J 81:41–49
Dreicer M, Hakonson TE, White GC, Whicker FW (1984) Rainsplash as a mechanism for soilcontamination of plant surfaces. Health Phys 46:177–187
Ebbs S, Bushey J, Poston S, Kosma D, Samiotakis M, Dzombak D (2003) Transport andmetabolism of free cyanide and iron cyanide complexes by willow. Plant Cell Environ26:1467–1478

9 Organic Contaminants from Soil into Vegetables and Fruits 405
EC (European Commission) (2003) Technical guidance document on risk assessment in support ofcommission directive 93/67/EEC on risk assessment for new notified substances, CommissionRegulation (EC) No 1488/94 on Risk Assessment for existing substances, and Directive98/8/EC of the European Parliament and of the Council concerning the placing of biocidalproducts on the market, European Communities, Italy. http://ecb.jrc.it/documents/. Accessed13 August 2010
ECETOC (European Centre for Ecotoxicology and Toxicology of Chemicals) (2001) Exposurefactors sourcebook for european populations (with focus on UK data). Technical Report No.79, Brussels, Belgium
EFSA (European Food Safety Authority) (2006) Pesticides are EU citizens’ top food-related healthconcern. Available online at http://www.euractiv.com. Accessed 17 March 2006
Fahl GM, Kreft L, Altenburger R, Faust M, Boedeker W, Grimme LH (1995) pH-Dependentsorption, bioconcentration and algal toxicity of sulfonylurea herbicides. Aquat Toxicol31(2):175–187
Franco A, Trapp S (2008) Estimation of the soil-water partition coefficient normalized to organiccarbon for ionizable organic chemicals. Environ Toxicol Chem 27(10):1995–2004
Franke W (1987) Nutzpflanzenkunde. Thieme Verlag, Stuttgart, GermanyFryer ME, Collins CD (2003) Model intercomparison for the uptake of organic chemicals by plants.
Environ Sci Technol 37:1617–1624Fujisawa T, Ichise K, Fukushima M, Katagi T, Takimoto Y (2002a) Mathematical model for the
uptake of non-ionized pesticides by edible root of root crops. J Pesticide Sci 27:242–248Fujisawa T, Ichise K, Fukushima M, Katagi T, Takimoto Y (2002b) Improved uptake mod-
els of non-ionized pesticides to foliage and seed of crops. J Agric Food Chem 50:532–537
Gent MPN, White JC, Parrish ZD, Isleyen M, Eitzer BD, Mattina MI (2007) Uptake and translo-cation of p,p′-dichlorodiphenyldichloroethylene supplied in hydroponics solution to Cucurbita.Environ Toxicol Chem 26(12):2467–2475
Gopalakrishnan G, Negri MC, Minsker BS, Werth CJ (2007) Monitoring subsurface contaminationusing tree branches. Ground Wat Monit Rem 27:65–74
Hsu FC, Marxmiller RL, Yang AYS (1990) Study on root uptake and xylem translocation ofcinmethylin and related compounds in detopped soybean roots using a pressure chambertechnique. Plant Physiol 93:1573–1578
Hülster A, Marschner H (1994) PCDD/PCDF-Transfer in Zucchini und Tomaten. Veröff PAÖ8:579–589
Hülster A, Marschner H (1995) Identifizierung PCDD/PCDF-mobilisierender Verbindungen inWurzelexudaten von Zucchini. Veröff PAÖ 12:359–369
Hülster A, Müller JF, Marschner H (1994) Soil-plant transfer of polychlorinated dibenzo-p-dioxinsand dibenzofurans to vegetables of the cucumber family (Cucurbitaceae). Environ Sci Technol28:1110–1115
Hung H, Mackay D (1997) A novel and simple model of the uptake of organic chemicals byvegetation from air and soil. Chemosphere 35:959–977
Inoue J, Chamberlain K, Bromilow RH (1998) Physicochemical factors affecting the uptake byroots and translocation to shoots of amine bases in barley. Pestic Sci 54:8–21
Kaupp H (1996) Atmosphärische Eintragswege und Verhalten von polychlorierten Dibenzo-p-dioxinen und -furanen sowie polyzyklischen Aromaten in einem Maisbestand. PhD thesis,faculty of biology, chemistry and earth science, University of Osnabrück
Kazerouni N, Sinha R, Hsu CH, Greenberg A, Rothman N (2001) Analysis of 200 food itemsfor benzo[a]pyrene and estimation of its intake in an epidemiologic study. Food Chem Toxicol39:423–436
Kleier DA (1988) Phloem mobility of xenobiotics. Plant Physiol 86:803–810Komossa D, Langebartels C, Sandermann H Jr (1995) Metabolic processes for organic chemicals
in plants. In: Trapp S, Mc Farlane C (eds) Plant contamination – modeling and simulation oforganic chemical processes. Lewis, Boca Raton, Florida, pp 69–103

406 S. Trapp and C.N. Legind
Kömp P, McLachlan M (1997) Interspecies variability of the plant/air partitioning of polychlori-nated biphenyls. Environ Sci Technol 31:2944–2948
Kühne R, Ebert RU, Schüürmann G (2005) Prediction of the temperature dependency of Henry’sLaw constant from chemical structure. Environ Sci Technol 39:6705–6711
Larsen M, Trapp S (2006) Uptake of iron cyanide complexes into willow trees. Environ Sci Technol40:1956–1961
Larsen M, Trapp S, Pirandello A (2004) Removal of cyanide by woody plants. Chemosphere54:325–333
Larsen M, Ucisik A, Trapp S (2005) Uptake, metabolism, accumulation and toxicity of cyanide inwillow trees. Environ Sci Technol 39:2135–2142
Larsen M, Burken J, Machackova J, Karlson UG, Trapp S (2008) Using tree core samples tomonitor natural attenuation and plume distribution after a PCE spill. Environ Sci Technol42:1711–1717
Legind CN, Trapp S (2009) Modeling the exposure of children and adults via diet to chemicals inthe environment with crop-specific models. Environ Pollut 157:778–785
Lewis GN (1907) A new system of thermodynamic chemistry. Proc Am Acad Arts Sci 43: 259–297Li JG, Gerzabek MH, Mück K (1994) An experimental study on mass loading of soil particles on
plant surfaces. Bodenkultur 45:15–24Lunney AI, Zeeb BA, Reimer K (2004) Uptake of weathered DDT in vascular plants: potential for
phytoremediation. Environ Sci Technol 38:6147–6154Mackay D, Fraser A (2000) Bioaccumulation of persistent organic chemicals: mechanisms and
models. Environ Pollut 110:375–391McKone TE, Maddalena RL (2007) Plant uptake of organic pollutants from soil: bioconcentration
estimates based on models and experiments. Environ Toxicol Chem 26:2494–2504Mikes O, Cupr P, Trapp S, Klanova J (2009) Uptake of polychlorinated biphenyls and organochlo-
rine pesticides from soil and air into radishes (Raphanus sativus). Environ Pollut 157(2):488–496
Monteith JL (1995) Accommodation between transpiring vegetation and the convective boundary-layer. J Hydrol 166(3–4):251–263
Müller JF, Hülster A, Päpke O, Ball M, Marschner H (1993) Transfer pathways of PCDD/F intofruits. Chemosphere 27:195–201
Müller JF, Hülster A, Päpke O, Ball M, Marschner H (1994) Transfer of PCDD/F fromcontaminated sites into carrots, lettuce and peas. Chemosphere 29:2175–2181
Mueller KE, Mueller-Spitz SR, Henry HF, Vonderheide AP, Soman RS, Kinkle BK, Shann JR(2006) Fate of pentabrominated diphenyl ethers in soil: abiotic sorption, plant uptake, and theimpact of interspecific plant interactions. Environ Sci Technol 40:6662–6667
Paretzke HG, Garland JA (1990) Assessment of the radiological significance of surface contami-nation in entrained radioactivity. Final Report, EC-contract No 90-ET-015
Paterson S, Mackay D, McFarlane C (1994) A model of organic-chemical uptake by plants fromsoil and the atmosphere. Environ Sci Technol 28:2259–2266
Penman HL (1948) Natural evaporation from open water, bare soil and grass. Proc R Soc Lon A193(1032):120–145
Pflugmacher S, Schröder P (1995) Glutathione S-transferases in trees: inducibility by variousorganic xenobiotics. Z Pflanzenernähr Bodenk 158:71–73
Reichenberg F, Mayer P (2006) Two complementary sides of bioavailability: accessibility andchemical activity of organic chemicals in sediments and soils. Environ Toxicol Chem 25:1239–1245
Riederer M (1995) Partitioning and transport of organic chemicals between the atmospheric envi-ronment and leaves. In: Trapp S, Mc Farlane JC (eds) Plant contamination. Modeling andsimulation of organic chemical processes. Lewis, Boca Raton, FL, pp 153–190
Rikken MGJ, Lijzen JPA, Cornelese AA (2001) Evaluation of model concepts on human exposure.Proposals for updating the most relevant exposure routes of CSOIL. RIVM report 711 701 022,Bilthoven, NL

9 Organic Contaminants from Soil into Vegetables and Fruits 407
Russell RS, Shorrocks VM (1959) The relationship between transpiration and the absorption ofinorganic ions by intact plants. J Exp Bot 10(29):301–316
Samiotakis M, Ebbs SD (2003) Possible evidence for transport of an iron cyanide complex byplants. Environ Pollut 127:169–173
Samsøe-Petersen L, Larsen EH, Larsen PB, Bruun P (2002) Uptake of trace elements and PAHsby fruit and vegetables from contaminated soils. Environ Sci Technol 36:3057–3063
Sandermann H (1994) Higher plant metabolism of xenobiotics: the ‘green liver’ concept.Pharmacogenetics 4:225–241
Sandermann H (2004) Bound and unextractable pesticidal plant residues: chemical characterizationand consumer exposure. Pest Manag Sci 60:613–623
Satchivi NM, Stoller EW, Wax LM, Briskin DP (2000a) A nonlinear dynamic simulation modelfor xenobiotic transport and whole plant allocation following foliar application I. Conceptualfoundation for model development. Pestic Biochem Phys 68:67–84
Satchivi NM, Stoller EW, Wax LM, Briskin DP (2000b) A nonlinear dynamic simulation modelfor xenobiotic transport and whole plant allocation following foliar application II. Modelvalidation. Pestic Biochem Phys 68:85–95
SCF (Scientific Committee on Food) (2002) Annex: background document to the opinion of thescientific committee on food on the risks to human health of polycyclic aromatic hydrocarbonsin food. Polycyclic aromatic hydrocarbons – occurrence in foods, dietary exposure and healtheffects. http://ec.europa.eu/food/fs/sc/scf/out154_en.pdf. Accessed 13 August 2010
Schönherr J, Riederer M (1989) Foliar penetration and accumulation of organic-chemicals in plantcuticles. Rev Environ Contam Toxicol 108:1–70
Shone MGT, Wood AV (1974) Comparison of uptake and translocation of some organic herbicidesand a systemic fungicide by barley 1. Absorption in relation to physicochemical properties. JExp Bot 25(85):390–400
Sicbaldi F, Sacchi GA, Trevisan M, Del Re AAM (1997) Root uptake and xylem translocation ofpesticides from different chemical classes. Pestic Sci 50:111–119
Sitte P, Ziegler H, Ehrendorfer F, Bresinsky A (1991) Lehrbuch der Botanik für Hochschulen, 33rdedn. Gustav Fischer, Stuttgart
Sorek A, Atzmon N, Dahan O, Gerstl, Z, Kushisin, L, Laor Y, Mingelgrin U, Nasser A, Ronen D,Tschachansky L, Weisbrod N, Graber ER (2008) “Phytoscreening”: the use of trees fordiscovering subsurface contamination by VOCs. Environ Sci Technol 42:536–542
Søvik AK, Alfnes E, Breedveld GD, French HK, Pedersen TS, Aagaard P (2002) Transport anddegradation of toluene and o-xylene in an unsaturated soil with dipping sedimentary layers. JEnviron Qual 31:1809–1823
TA-Luft (Technische Anleitung zur Reinhaltung der Luft) (1986) In: Handbuch desUmweltschutzes, Vol. II-2, appendix 3.1. ecomed, Landsberg aL, D
Ter Laak TL, Barendregt A, Hermens JLM (2006) Freely dissolved pore water concentrationsand sorption coefficients of PAHs in spiked, aged, and field-contaminated soils. Environ SciTechnol 40:2184–2190
Thompson PL, Ramer LA, Guffey AP, Schnoor JL (1998) Decreased transpiration in poplar treesexposed to 2,4,6-trinitrotoluene. Environ Toxicol Chem 17:902–906
Trapp S (1995) Model for uptake of xenobiotics into plants. In: Trapp S, Mc Farlane JC (eds) Plantcontamination. Modeling and simulation of organic chemical processes. Lewis, Boca Raton,FL, pp 107–152
Trapp S (2000) Modeling uptake into roots and subsequent translocation of neutral and ionisableorganic compounds. Pest Manage Sci 56:767–778
Trapp S (2002) Dynamic root uptake model for neutral lipophilic organics. Environ Toxicol Chem21:203–206
Trapp S (2004) Plant uptake and transport models for neutral and ionic chemicals. Environ SciPollut Res 11:33–39
Trapp S (2007) Fruit Tree model for uptake of organic compounds from soil and air. SAR QSAREnviron Res 18:367–387
408 S. Trapp and C.N. Legind
Trapp S, Christiansen H (2003) Phytoremediation of cyanide-polluted soils. In: McCutcheon SC,Schnoor JL (eds) Phytoremediation: transformation and control of contaminants. Wiley,Hoboken, NJ, pp 829–862
Trapp S, Karlson U (2001) Aspects of phytoremediation of organic compounds. J Soils Sed 1:37–43
Trapp S, Matthies M (1995) Generic one-compartment model for uptake of organic chemicals byfoliar vegetation. Environ Sci Technol 29:2333–2338; erratum 30, 360
Trapp S, Pussemier L (1991) Model calculations and measurements of uptake and translocation ofcarbamates by bean plants. Chemosphere 22:327–339
Trapp S, Schwartz S (2000) Proposals to overcome limitations in the EU chemical risk assessmentscheme. Chemosphere 41:965–971
Trapp S, Matthies M, Scheunert I, Topp EM (1990) Modeling the bioconcentration of organicchemicals in plants. Environ Sci Technol 24:1246–1252
Trapp S, Matthies M, Mc Farlane C (1994) Model for uptake of xenobiotics into plants: validationwith bromacil experiments. Environ Toxicol Chem 13:413–422
Trapp S, Yu X, Mosbæk H (2003) Persistence of methyl tertiary butyl ether (MTBE) againstmetabolism by Danish vegetation. Environ Sci Pollut Res 10:357–360
Trapp S, Cammarano A, Capri E, Reichenberg F, Mayer P (2007a) Diffusion of PAH in potato andcarrot slices and application for a potato model. Environ Sci Technol 41:3103–3108
Trapp S, Ucisik AS, DelChicca Romano P, Larsen M (2007b) The role of plants and bacteria inphytoremediation – kinetic aspects. In: Heipieper HJ (ed) Bioremediation of soils contaminatedwith aromatic compounds. NATO science series, IV. Earth and environmental sciences – vol 76.Springer, Dordrecht, NL, pp 41–49
Trapp S, Feificova D, Rasmussen NF, Bauer-Gottwein P (2008) Plant uptake of NaCl in relation toenzyme kinetics and toxic effects. Environ Exp Bot 64: 1–7
Trapp S, Larsen M, Legind CN, Burken J, Machackova J, Karlson UG (2009) Aguide to vegetation sampling for screening of subsurface pollution. Freely available athttp://homepage.env.dtu.dk/stt/. Accessed 13 August 2010
Travis CC, Arms AD (1988) Bioconcentration of organics in beef, milk, and vegetation. EnvironSci Technol 22:271–274
Travis CC, Hattemer-Frey HA (1991) Human exposure to dioxin. Sci Total Environ 104:97–127Ucisik AS, Trapp S (2006) Uptake, removal, accumulation, and phytotoxicity of phenol in willow
trees (Salix viminalis). Environ Toxicol Chem 25:2455–2460Ucisik AS, Trapp S (2008) Uptake, accumulation, phytotoxicity and removal of 4-chlorophenol in
willow trees. Arch Environ Contam Toxicol 54:619–627Ucisik AS, Trapp S, Kusk KO (2007) Uptake, accumulation, phytotoxicity and removal of
2,4-dichlorophenol in willow trees. Environ Toxicol Chem 26:1165–1171Vroblesky DA, Nietch CT, Morris JT (1999) Chlorinated ethenes from groundwater in tree trunks.
Environ Sci Technol 33:510–515Whitfield Åslund ML, Zeeb BA, Rutter A, Reimer KJ (2007) In situ phytoextraction of polychlo-
rinated biphenyl – (PCB) contaminated soil. Sci Total Environ 374:1–12White JC (2002) Differential bioavailability of field-weathered p,p′-DDE to plants of the Cucurbita
and Cucumis genera. Chemosphere 49:143–152Yu X, Trapp S, Puhua Z, Chang W, Xishi Z (2004) Metabolism of cyanide by Chinese vegetation.
Chemosphere 56:121–126Yu X, Trapp S, Zhou P, Hu H (2005a) The effect of temperature on the rate of cyanide metabolism
of two woody plants. Chemosphere 59:1099–1104Yu XZ, Trapp S, Zhou P (2005b) Phytotoxicity of cyanide to weeping willow trees. Environ Sci
Pollut Res 12:109–113Yu XZ, Trapp S, Zhou PH, Chen L (2007) Effect of temperature on the uptake and metabolism of
cyanide by weeping willows. Int J Phytorem 9:243–255Zhu Y, Zhang S, Zhu Y-G, Christie P, Shan X (2007) Improved approaches for modeling the
sorption of phenanthrene by a range of plant species. Environ Sci Technol 41:7818–7823Zohair A, Salim A-B, Soyibo AA, Beck AJ (2006) Residues of polycyclic aromatic hydrocarbons
(PAHs), polychlorinated biphenyls (PCBs) and organochlorine pesticides in organically-farmedvegetables. Chemosphere 63:541–553