Embed Size (px)
Citation preview

• A General Government Deficit (GG Deficit) of €12,460 million or 7.6% of GDP wasrecorded in 2012, significantly lower than the 2011 GG Deficit of €21,267 million or13.1% of GDP.
• The General Government Debt (GG Debt) as a percentage of GDP fell from 94.2% in1990 to a low of 24.6% in 2006, before rising rapidly again to 117.4% at the end of2012.
• The more narrowly defined National Debt fell from 87.7% of GDP in 1990 to a low of19.8% in 2007, before rising rapidly again to 83.9% at the end of 2012.
• Indebtedness of Irish households to resident credit institutions fell from €161bn in2011 to €154bn in 2012, a drop of 4.6%.
Public Finance
and Banking
9

Contents
Introductory text 153
Table 9.1 Credit institutions – aggregate balance sheet at end of year 158
Table 9.2 Irish private sector credit and deposits end of year 159
Table 9.3 Irish resident private-sector enterprises - sectoral distributionof advances and deposits, end of year 160
Table 9.4 Irish Stock Exchange 161
Table 9.5 Exchequer and General Government balances 162
Table 9.6 General Government Debt and National Debt 163
Table 9.7 Exchequer receipts 164-165
Table 9.8 Exchequer issues 166
Table 9.9 Summary National Debt statement at end of year 167
Table 9.10 Public Capital Programme 168
Table 9.11 Revenue and expenditure of general government 169
Table 9.12 Expenditure of general government by purpose ofexpenditure and economic category 170
152 Statistical Yearbook of Ireland

Introduction
This chapter contains information on the Banking and Public Finance sectors in theIrish economy. Tables 9.1 to 9.3 are compiled from the Money and Banking Statisticspublished by the Central Bank of Ireland (www.centralbank.ie) and Table 9.4 usesdata published by the Irish Stock Exchange (www.ise.ie).
Banking and finance
Table 9.1 shows the assets and liabilities of all credit institutions resident in Ireland. Itis important to note that Credit Unions entered the reporting population in January2009 and are therefore included in these tables from 2009 onwards. In addition, from2010, the outstanding amount of loans is reported on a nominal basis (i.e. gross ofimpairment provisions) and this should be taken into account when comparing pre andpost-2010 data.
Table 9.2 shows the outstanding amount of credit extended by credit institutionsresident in Ireland to Irish private sector residents. The amount of securitized loans isalso presented in this table to show the complete private sector liability to Irish banks.It is important to note that the loans granted by non-resident credit institutions to Irishresidents are not included in these tables. Hence, if a bank changes its jurisdiction thiswill affect the amounts.
Table 9.3 provides a table of credit advanced to and deposits received from Irishresident private-sector enterprises by sector of economic activity. As with the previoustables, the outstanding amounts are reported by credit institutions resident in Ireland.
Table 9.4 provides summary data relating to the Irish Stock Exchange (including theGovernment Securities Market).
The balance sheet of the credit institution sector continued to decrease in 2012, adecline of €153bn in the year. Total assets were €873bn at the end of 2012.
The amount owed by households to Irish banks decreased by €7.5bn in 2012. Thisreflects the continued trend in recent years where households are primarily no longerborrowing but repaying existing loans.
Deposits held by households rose by €1.0bn in 2012 and indebtedness on the 2 millioncredit cards in issue decreased to €2.6bn in the same period.
Capitalisation of the Irish Stock Market (based on equities included in ISEQ only) roseto €57.3bn by the end of 2012, an increase of 82% over its recent low in 2008.
Public finance
The public finance area is the subject of the remaining nine tables. Tables 9.5 and 9.6examine the National and General Government Balances and Debt. Tables 9.7 and 9.8detail the movements of all Exchequer receipts and issues. Table 9.9 provides asummary of National Debt while table 9.10 examines the Public Capital Programme.
Statistical Yearbook of Ireland 153

Tables 9.11 and 9.12 move to the areas of general government. Details are providedfor revenue and expenditures, with expenditure being classified by purpose andeconomic category.
154 Statistical Yearbook of Ireland

Technical Notes
Table 9.1
The reporting population covered in these tables is all credit institutions resident inIreland. Credit institutions, as defined in Community Law, are undertakings whosebusiness is to receive deposits or other repayable funds from the public and to grantcredits for their own account and/or issue means of payment in the form of electronicmoney. In the Irish case, resident credit institutions comprise licensed banks, buildingsocieties and, since January 2009, credit unions as regulated by the Registrar of CreditUnions. A resident office means an office or branch of the reporting institution which islocated in ‘the State’ (the Republic of Ireland). These are: institutions incorporatedand located in the Republic of Ireland, including subsidiaries of parent companieslocated outside the Republic of Ireland; and branches of institutions that have theirhead office outside the Republic of Ireland. Reporting institutions report the data inrespect of their resident offices only.
Table 9.2
Securitised loans include the outstanding amount of loans transferred to anon-monetary financial institution by the originating credit institution and continue tobe serviced by that credit institution. Loans transferred to NAMA are not currentlyincluded in the outstanding amounts of securitized loans.
The figures for the number of credit cards in issue represent credit cards issued bycredit institutions resident in Ireland. Debit cards or store cards are excluded. TypicalAnnualised Percentage Rate (APR) charged on credit cards is calculated as a simplenon-weighted average of the advertised APR charged by the issuers on standardcredit cards.
Table 9.3
The sector breakdown provided in this table is defined by the functional sectorclassification based on NACE Rev. 2. This allows credit and deposit trends to beanalysed on the basis of the primary economic activity of the counterparty (for creditand deposits) and/or the purpose of the credit. Where there is a conflict betweenthese criteria in classifying a particular credit amount, it is classified based on thepurpose for which the credit was sought.
Table 9.4
Turnover is the sum of purchases and sales by stockbrokers’ personal and corporateclients.
Money raised is the cash value of funds raised by new issues of securities. The figuresinclude all domestic companies and companies who have their centre of economicinterest in Ireland.
Capitalised value is the market value of all issues on the last trading day of eachperiod. The price used to value each individual issue is the last trading price at close ofbusiness on the last trading day of a trading period.
Table 9.5
The Total Exchequer Balance is the sum of the current and capital balances of theExchequer. It is the traditional domestic budgetary aggregate which measures thedifference between total cash receipts into and total cash outflows from the ExchequerAccount of the Central Fund.
EDP net lending/net borrowing of General Government (also known as theGeneral Government Balance (GGB) or the GGDeficit), is the standard Europeanmeasure of the fiscal balance, which is used to monitor compliance with the Stability and
Statistical Yearbook of Ireland 155

Growth Pact. It is defined in the EU regulation governing reporting of deficit and debtlevels for the Excessive Deficit Procedure as the difference between revenue andexpenditure of the consolidated General Government economic sector in a particular year.
Revenue and expenditure are defined using the accounting rules of the EuropeanSystem of Accounts 1995 (ESA95) as transactions which increase or decrease financialnet worth: this means that they are on an accrual basis, and exclude acquisitions anddisposals of financial assets and liabilities.
The Irish General Government sector consists of three subsectors:
• Central Government: The Exchequer and associated Departments and Offices, theextra-budgetary funds of government (except the Social Insurance Fund), publiclyfunded primary and secondary schools (except VECs), public hospitals, and anyState bodies or companies which do not cover a majority of their operating coststhrough sales.
• Local Government: The Local Authorities, the VECs and Institutes of Technology,and the Health Boards (prior to their abolition on 31 December 2004).
• Social Security: The Social Insurance Fund.
The GG Deficit may alternately be derived from the Exchequer Balance as a series ofadjustments:
Cash inflows and outflows which affect the Exchequer balance but which donot affect financial net worth are excluded.
Next, non-cash revenues and expenditures affecting this adjusted ExchequerBalance are added. These represent the difference between cashreceipts/cash payments and the accrued revenue/expenditure of theExchequer. Adding these non-cash transactions to the adjusted Exchequercash balance from (1) gives the EDP net lending/net borrowing of theExchequer.
The net lending (surplus)/net borrowing (deficit) of the extra-budgetary fundsand accounts and other Central Government bodies is then added to theExchequer net lending/net borrowing to give the (EDP) net lending/netborrowing of the Central Government subsector of General Government (GGDeficit).
Finally, the net lending/net borrowing of the Social Insurance Fund and LocalGovernment are added to Central Government net lending/net borrowing togive the GG Deficit.
Note that the estimates of the GG Deficit for years prior to 1990 are calculated usingthe accounting rules of an earlier (1979) version of the European System of Accounts.
Table 9.6
The General Government Debt is the standardised measure of indebtedness of EUgovernments. It takes account of all liabilities included in the National Debt, withoutany offsetting of liquid assets, together with the liabilities of non-commercial Stateagencies and local authorities. In addition it includes the build-up of accrued intereston certain government borrowings, in particular on small savings schemes such asSaving Certificates, Savings Bonds and National Instalment Savings, as well as the thePromissory Notes issued to financial institutions in 2010.
National Debt is calculated in accordance with domestic conventions. Details arepublished annually in the Department of Finance’s Finance Accounts and the reportand accounts of the National Treasury Management Agency (NTMA). In calculatingthe National Debt, certain liquid assets held by the State are offset.
156 Statistical Yearbook of Ireland

Tables 9.5 and 9.6
In line with other CSO publications, the GDP and GNP figures used as the denominatorin these tables include the impact of FISIM (Financial Intermediation ServicesIndirectly Measured) for years from 1995 onwards.
Statistical Yearbook of Ireland 157

Table 9.1 Credit institutions – aggregate balance sheet at end of year
€m
2007 2008 20091
2010 2011 2012
Assets
1 Loans to Irish Residents 481,821 532,559 505,271 467,544 383,645 331,404
1.1 Monetary financial institutions 117,034 173,134 175,356 174,629 113,322 69,253
1.2 General government 1,047 1,306 1,310 31,607 29,687 27,965
1.3 Private Sector 363,740 358,119 328,605 261,308 240,636 234,186
2 Holdings of securities issued by Irish Residents 23,467 60,788 82,110 101,700 113,613 107,323
2.1 Monetary financial institutions 11,036 23,130 27,663 16,602 17,638 19,757
2.2 General government 638 2,138 8,219 11,808 13,029 19,589
2.3 Private Sector 11,793 35,520 46,228 73,290 82,946 67,977
3 Loans to non-residents 334,906 362,544 338,956 344,121 305,272 233,506
3.1 Euro area 108,996 110,998 84,734 114,793 114,759 71,125
3.2 Rest of world 225,910 251,546 254,222 229,328 190,513 162,381
4 Holdings of securities issued by non-residents 360,425 353,052 313,418 185,365 147,346 139,343
4.1 Euro area 167,430 160,189 149,857 85,876 69,336 70,645
4.2 Rest of the World 192,995 192,863 163,561 99,489 78,010 68,698
5 Central Bank Balances 22,752 21,140 16,288 12,319 6,765 3,899
5.1 Resident 22,428 20,215 16,123 12,319 6,765 3,899
5.2 Non-Resident 324 925 165 - - -
6 Remaining Assets 113,985 82,114 67,541 56,959 69,256 57,205
6.1 Resident 65,465 28,329 35,435 27,537 27,517 25,196
6.2 Non-Resident 48,520 53,785 32,106 29,422 41,739 32,009
Total 1,337,356 1,412,197 1,323,584 1,168,008 1,025,897 872,680
Liabilities
1 Deposits from Irish Residents 302,676 351,053 358,312 346,604 277,537 240,937
1.1 Monetary financial institutions 119,937 171,691 171,275 174,895 112,228 68,484
1.2 General government 2,573 3,155 3,276 3,410 2,725 5,978
1.3 Private Sector 180,166 176,207 183,761 168,299 162,584 166,475
2 Debt Securities Issued 254,022 187,128 179,181 119,813 95,485 81,364
2.1 Irish Resident 30,588 36,636 50,754 33,885 30,503 23,454
2.2 Euro Area 46,301 32,547 26,979 22,418 20,446 18,102
2.3 Rest of the world 177,133 117,945 101,448 63,510 44,536 39,808
3 Deposits from non-residents 533,307 600,671 524,624 347,086 299,086 241,438
3.1 Euro area 191,955 243,773 199,688 151,799 141,710 112,963
3.2 Rest of world 341,352 356,898 324,936 195,287 157,376 128,475
4 Capital & Reserves 74,353 73,650 90,015 111,097 127,350 136,395
4.1 Resident 44,961 41,952 59,174 84,793 109,522 118,214
4.2 Non-Resident 29,392 31,698 30,841 26,304 17,828 18,181
5 Borrowing from the Eurosystem relating tomonetary policy operations 40,088 98,125 90,899 132,010 108,407 71,410
6 Remaining Liabilities 132,910 101,570 80,553 111,398 118,032 101,136
6.1 Resident 67,180 37,333 42,193 72,924 67,869 61,587
6.2 Non-Resident 65,730 64,237 38,360 38,474 50,163 39,549
Total 1,337,356 1,412,197 1,323,584 1,168,008 1,025,897 872,680
1 Credit Unions included only from 2009 onwardsSource: Central Bank of Ireland
158 Statistical Yearbook of Ireland

Table 9.2 Irish private sector credit and deposits end of year
€m
2007 2008 20091
2010 2011 2012
Credit Advanced to Irish Private sector 375,533 393,639 374,833 334,598 323,582 302,164
1 Households 153,014 144,576 140,084 130,089 110,288 111,076
1.1 Loans for house purchase 123,722 114,978 110,210 99,578 80,396 84,973
1.2 Consumer credit 20,791 21,723 23,802 18,999 16,617 14,206
1.3 Other loans 8,501 7,875 6,072 11,512 13,275 11,897
2 Non-financial corporations 158,403 166,798 146,547 92,791 88,344 84,330
2.1 Loans 156,691 164,952 145,448 92,660 88,185 84,204
2.2 Securities 1,712 1,846 1,099 131 159 126
3 Insurance corporations and pension funds/Other financial intermediaries 64,116 82,265 88,202 111,718 124,950 106,758
3.1 Loans 54,034 48,591 43,072 38,559 42,163 38,907
3.2 Securities 10,082 33,674 45,130 73,159 82,787 67,851
Loans to Irish Private sector (securitised) 16,840 33,825 42,671 38,960 52,015 43,543
1 Households 16,840 33,825 37,737 37,050 50,944 42,696
1.1 Loans for house purchase 16,840 33,825 37,737 36,228 50,172 41,771
1.2 Consumer credit - - - 822 772 925
2 Non-financial corporations
2.1 Loans - - 4,934 1,910 1,071 847
Total credit advanced to Irish Private sector (incl. Securitised Loans) 392,373 427,464 417,504 373,558 375,597 345,707
1 Households 169,854 178,401 177,821 167,139 161,232 153,772
2 Non-financial corporations 158,403 166,798 151,481 94,701 89,415 85,177
3 Insurance corporations and pension funds/Other financial intermediaries 64,116 82,265 88,202 111,718 124,950 106,758
Deposits of Irish Private Sector 80,166 176,207 183,761 168,299 162,584 166,474
4 Households 82,863 85,247 99,148 94,620 91,314 92,391
5 Non-financial corporations 45,547 43,157 40,613 33,537 30,870 30,888
6 Insurance corporations and pension funds/Other financial intermediaries 51,756 47,803 44,000 40,142 40,400 43,195
Credit Card Statistics
Number of credit cards in issue (000) 2,303 2,381 2,333 2,228 2,143 2,055
Outstanding indebtedness on credit cards (€m) 2,992 3,129 3,106 2,911 2,789 2,620
1 Credit Unions included only from 2009 onwardsSource: Central Bank of Ireland
Statistical Yearbook of Ireland 159

Table 9.3 Irish resident private-sector enterprises – sectoral distribution of advances anddeposits, end of year
€m
2005 2006 2007 2008 2009 2010 2011 2012
Advances
Primary industries 4,416 5,164 5,577 6,341 5,658 5,323 5,069 4,977
Manufacturing 5,838 6,593 7,791 8,632 6,875 5,268 5,248 5,018
Electricity, gas, steam and air conditioningsupply 942 1,224 1,309 1,333 1,065 915 785 578
Water supply, sewerage, wastemanagement and remediation activities 94 111 159 164 158 128 143 112
Construction 6,096 8,381 10,280 8,840 5,761 3,466 3,005 2,821
Wholesale/retail trade and repairs 10,092 11,118 13,374 14,091 12,575 9,720 9,430 8,554
Transportation and storage 2,062 2,124 2,877 3,078 2,558 1,567 1,469 1,355
Hotels and restaurants 9,043 10,897 11,510 11,462 10,753 8,184 7,720 7,490
Information and communication 692 756 1,103 884 799 638 583 442
Financial intermediation (excl. monetaryfinancial institutions) 46,630 49,956 64,493 83,502 82,626 109,179 124,188 106,135
Real estate, land and development activities 47,486 74,952 96,019 103,072 92,489 55,185 54,907 52,231
Business and administrative services 5,157 6,400 6,015 7,183 5,759 5,522 5,138 4,855
Other community, social and personalservices 2,317 2,415 3,129 2,909 2,766 2,379 2,160 2,099
Education 508 646 663 765 851 724 565 568
Human health and social work 1,311 1,861 2,569 2,726 2,679 2,049 1,999 2,014
Extra-territorial organisations and bodies 0 0 0 0 0 2 0 0
Total 142,684 182,598 226,868 254,982 233,372 210,251 222,409 199,251
Deposits
Primary industries 3,563 3,908 3,243 2,968 2,865 3,030 2,986 2,807
Manufacturing 5,614 5,366 5,954 6,290 5,740 4,703 4,413 4,307
Electricity, gas, steam and air conditioningsupply
262 342 873 470 836 765 524 583
Water supply, sewerage, wastemanagement and remediation activities 222 268 209 224 218 45 49 52
Construction 3,656 4,102 3,459 3,081 3,093 2,282 1,965 1,835
Wholesale/retail trade and repairs 4,577 5,041 5,349 4,725 4,592 4,435 4,348 4,204
Transportation and storage 2,551 3,591 3,628 3,338 3,180 2,842 2,397 2,203
Hotels and restaurants 846 893 907 893 655 665 615 639
Information and communication 1,696 2,323 1,741 1,749 1,644 1,062 1,106 1,054
Financial intermediation (excl. monetaryfinancial institutions) 45,362 54,639 53,831 48,550 46,542 40,399 40,303 43,201
Real estate, land and development activities 7,191 8,730 7,802 8,031 7,413 6,226 3,782 3,545
Business and administrative services 5,816 7,563 7,857 8,418 7,142 5,034 7,035 7,995
Other community, social and personalservices 3,997 4,283 4,812 4,769 4,675 4,473 4,168 4,179
Education 1,299 1,538 1,615 1,664 1,666 1,839 1,714 1,795
Human health and social work 3,525 4,286 1,434 2,024 2,277 1,110 1,024 1,067
Extra-territorial organisations and bodies 15 42 6 9 10 0 0 0
Total 90,192 106,915 102,720 97,203 92,548 78,910 76,429 79,464
Source: Central Bank of Ireland
160 Statistical Yearbook of Ireland

Table 9.4 Irish Stock Exchange
€m
2005 2006 2007 2008 2009 2010 2011 2012
Main Securities Market
Turnover 108,067 127,705 195,413 110,948 52,732 44,909 34,947 36,867Money raised 1,435 2,761 5,376 401 2,027 5,056 2,709 54Capitalised value at end of period
(Equities included in ISEQ Only) 93,925 116,987 90,460 31,398 43,182 45,906 48,990 57,274
Enterprise Securities Market
Turnover 418 1,256 3,152 1,036 593 631 721 469Money raised 69 941 1,241 154 79 270 7,420 392Capitalised value at end of period 850 2,464 3,083 964 1,613 2,147 37,913 29,138
Irish Government Bonds
Turnover 51,297 37,457 51,994 50,185 149,054 208,090 64,125 64,748Money raised 1,440 0 5,959 10,929 34,897 19,884 0 9,715Capitalised value at end of period 33,062 32,413 31,190 42,552 71,831 74,892 72,455 90,176
Price Index of ordinary stocks and shares
(ISEQ) at end-year
(Base Jan 4th 1988, 9am=1000) 7,364 9,408 6,934 2,343 2,975 2,885 2,902 3,397
Source: Irish Stock Exchange
Statistical Yearbook of Ireland 161

Table 9.5 Exchequer and General Government balances
Year
Currentbudget
balance
Capitalbudget
balance
TotalExchequer
balance
Generalgovernment
balance
€m % of GNP
with FISIM
allocated
€m % of GNP
with FISIM
allocated
€m % of GNP
with FISIM
allocated
€m % of GDP
with FISIM
allocated
1983 -1,219 -7.0 -1,011 -5.8 -2,230 -12.8 n/a n/a1984 -1,319 -7.0 -998 -5.2 -2,317 -12.2 n/a n/a1985 -1,630 -8.0 -928 -4.6 -2,559 -12.6 n/a n/a1986 -1,771 -7.9 -952 -4.2 -2,724 -12.1 n/a n/a1987 -1,498 -6.2 -769 -3.2 -2,268 -9.4 -2,409 -9.01988 -403 -1.6 -383 -1.5 -786 -3.1 -1,416 -4.91989 -334 -1.2 -274 -1.0 -608 -2.2 -902 -2.81990 -193 -0.6 -427 -1.3 -620 -1.9 -996 -2.81991 -379 -1.1 -275 -0.8 -654 -1.9 -53 -2.91992 -566 -1.6 -349 -1.0 -915 -2.6 -46 -3.01993 -481 -1.2 -399 -1.0 -880 -2.3 -13 -2.71994 19 0.0 -873 -2.1 -854 -2.0 -47 -2.01995 -459 -1.0 -337 -0.7 -796 -1.7 -1,186 -2.21996 371 0.7 -925 -1.8 -554 -1.1 -167 -0.31997 767 1.3 -1,052 -1.8 -298 -0.5 689 1.01998 2,654 3.8 -1,694 -2.5 948 1.4 1,695 2.21999 4,367 5.7 -2,855 -3.7 1,512 2.0 2,321 2.62000 6,967 7.7 -3,794 -4.2 3,173 3.5 4,987 4.72001 4,725 4.8 -4,075 -4.1 650 0.7 1,051 0.92002 5,402 5.0 -5,307 -5.0 95 0.1 -460 -0.42003 4,410 3.7 -5,390 -4.5 -980 -0.8 559 0.42004 5,620 4.4 -5,587 -4.4 33 0.0 2,066 1.42005 6,353 4.6 -6,852 -4.9 -499 -0.4 2,710 1.72006 9,069 5.9 -6,886 -4.5 2,183 1.4 5,193 2.92007 6,992 4.3 -8,610 -5.3 -1,618 -1.0 143 0.12008 -3,069 -2.0 -9,645 -6.2 -12,714 -8.2 -13,160 -7.32009 -11,367 -8.5 -13,274 -9.9 -24,641 -18.4 -22,368 -13.82010 -12,580 -9.5 -6,165 -4.7 -18,745 -14.2 -48,277 -30.52011 -11,225 -8.6 -13,693 -10.5 -24,918 -19.1 -21,267 -13.12012 -10,098 -7.6 -4,792 -3.6 -14,891 -11.2 -12,460 -7.6
Source: CSO (General Government Balance), Department of Finance (Exchequer Balance)
162 Statistical Yearbook of Ireland
-32.0
-30.0
-28.0
-26.0
-24.0
-22.0
-20.0
-18.0
-16.0
-14.0
-12.0
-10.0
-8.0
-6.0
-4.0
-2.0
0.0
2.0
4.0
6.0
8.0
2005 2006 2007 2008 2009 2010 2011 2012
%General Government balance as a % of GDP
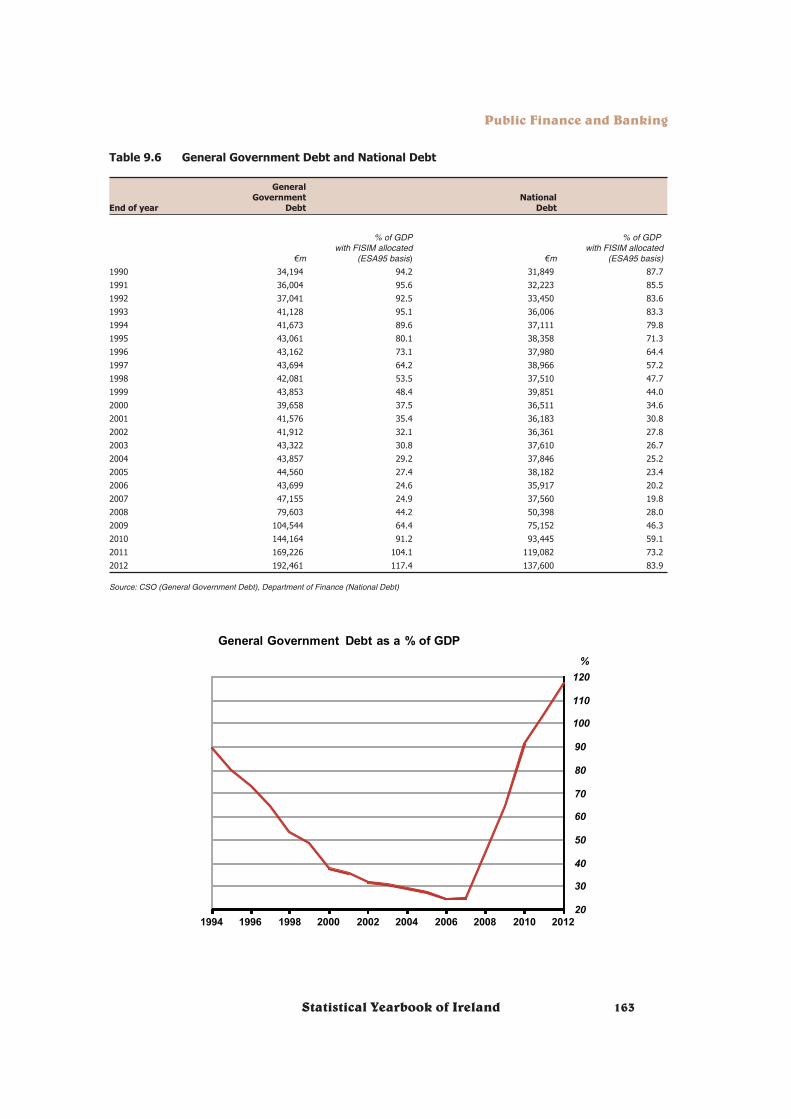
Table 9.6 General Government Debt and National Debt
End of year
GeneralGovernment
DebtNational
Debt
€m
% of GDP
with FISIM allocated
(ESA95 basis) €m
% of GDP
with FISIM allocated
(ESA95 basis)
1990 34,194 94.2 31,849 87.7
1991 36,004 95.6 32,223 85.5
1992 37,041 92.5 33,450 83.6
1993 41,128 95.1 36,006 83.3
1994 41,673 89.6 37,111 79.8
1995 43,061 80.1 38,358 71.3
1996 43,162 73.1 37,980 64.4
1997 43,694 64.2 38,966 57.2
1998 42,081 53.5 37,510 47.7
1999 43,853 48.4 39,851 44.0
2000 39,658 37.5 36,511 34.6
2001 41,576 35.4 36,183 30.8
2002 41,912 32.1 36,361 27.8
2003 43,322 30.8 37,610 26.7
2004 43,857 29.2 37,846 25.2
2005 44,560 27.4 38,182 23.4
2006 43,699 24.6 35,917 20.2
2007 47,155 24.9 37,560 19.8
2008 79,603 44.2 50,398 28.0
2009 104,544 64.4 75,152 46.3
2010 144,164 91.2 93,445 59.1
2011 169,226 104.1 119,082 73.2
2012 192,461 117.4 137,600 83.9
Source: CSO (General Government Debt), Department of Finance (National Debt)
Statistical Yearbook of Ireland 163
20
30
40
50
60
70
80
90
100
110
120
1994 1996 1998 2000 2002 2004 2006 2008 2010 2012
%
General Government Debt as a % of GDP
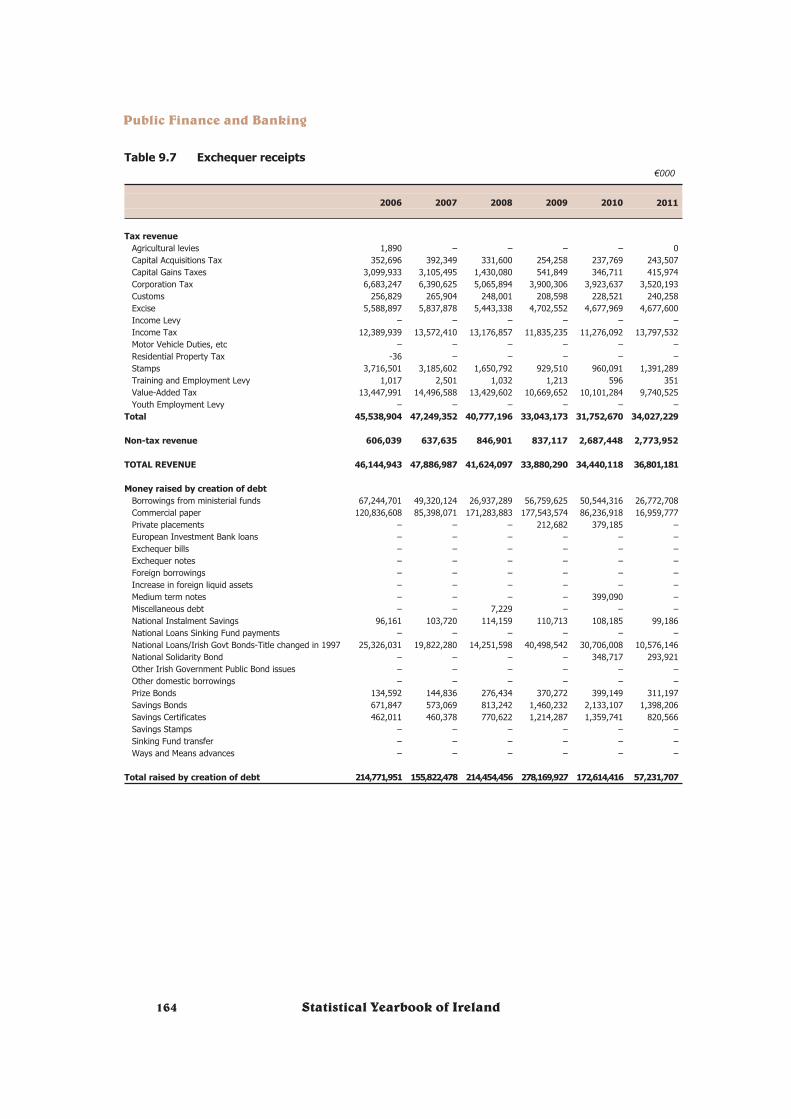
Table 9.7 Exchequer receipts
€000
2006 2007 2008 2009 2010 2011
Tax revenue
Agricultural levies 1,890 – – – – 0Capital Acquisitions Tax 352,696 392,349 331,600 254,258 237,769 243,507Capital Gains Taxes 3,099,933 3,105,495 1,430,080 541,849 346,711 415,974Corporation Tax 6,683,247 6,390,625 5,065,894 3,900,306 3,923,637 3,520,193Customs 256,829 265,904 248,001 208,598 228,521 240,258Excise 5,588,897 5,837,878 5,443,338 4,702,552 4,677,969 4,677,600Income Levy – – – – – –Income Tax 12,389,939 13,572,410 13,176,857 11,835,235 11,276,092 13,797,532Motor Vehicle Duties, etc – – – – – –Residential Property Tax -36 – – – – –Stamps 3,716,501 3,185,602 1,650,792 929,510 960,091 1,391,289Training and Employment Levy 1,017 2,501 1,032 1,213 596 351Value-Added Tax 13,447,991 14,496,588 13,429,602 10,669,652 10,101,284 9,740,525Youth Employment Levy – – – – – –
Total 45,538,904 47,249,352 40,777,196 33,043,173 31,752,670 34,027,229
Non-tax revenue 606,039 637,635 846,901 837,117 2,687,448 2,773,952
TOTAL REVENUE 46,144,943 47,886,987 41,624,097 33,880,290 34,440,118 36,801,181
Money raised by creation of debt
Borrowings from ministerial funds 67,244,701 49,320,124 26,937,289 56,759,625 50,544,316 26,772,708Commercial paper 120,836,608 85,398,071 171,283,883 177,543,574 86,236,918 16,959,777Private placements – – – 212,682 379,185 –European Investment Bank loans – – – – – –Exchequer bills – – – – – –Exchequer notes – – – – – –Foreign borrowings – – – – – –Increase in foreign liquid assets – – – – – –Medium term notes – – – – 399,090 –Miscellaneous debt – – 7,229 – – –National Instalment Savings 96,161 103,720 114,159 110,713 108,185 99,186National Loans Sinking Fund payments – – – – – –National Loans/Irish Govt Bonds-Title changed in 1997 25,326,031 19,822,280 14,251,598 40,498,542 30,706,008 10,576,146National Solidarity Bond – – – – 348,717 293,921Other Irish Government Public Bond issues – – – – – –Other domestic borrowings – – – – – –Prize Bonds 134,592 144,836 276,434 370,272 399,149 311,197Savings Bonds 671,847 573,069 813,242 1,460,232 2,133,107 1,398,206Savings Certificates 462,011 460,378 770,622 1,214,287 1,359,741 820,566Savings Stamps – – – – – –Sinking Fund transfer – – – – – –Ways and Means advances – – – – – –
Total raised by creation of debt 214,771,951 155,822,478 214,454,456 278,169,927 172,614,416 57,231,707
164 Statistical Yearbook of Ireland

Table 9.7 Exchequer receipts (continued)
€000
2006 2007 2008 2009 2010 2011
Other receipts
Bord Iascaigh Mhara 216 214 500 1,085 – –Bord Na Móna – – – – – –Cohesion Fund 39,513 – – 10,700 – –Coillte Teoranta – – – – – –European Regional Development Fund 133,010 95,572 113,533 56,668 66,269 33,050Feoga Guarantee 650,289 730,146 740,000 741,000 790,000 673,000Feoga Intervention – – – – – –Local Loans Funds Acts, 1935-87 27,568 16,478 8,749 7,823 3,467 9,567Miscellaneous Capital 539,216 97,563 44,652 60,867 320,491 1,148,813National Building Agency Ltd Acts, 1963-74 – – – – – –Nitrigin Éireann Teo Acts, 1963-87 – – – – – –Shannon Free Airport Development Co Ltd Acts – – – – – –Insurance Compensation Fund – – – – – –EIB-EEA Financial Mechanism 5 – – 3 – –Trans European Network 4,860 2,800 2,188 11,735 1,288 1,154Turkish Aid Protocol 33 33 33 33 33 33
Total other receipts 1,394,710 942,806 909,655 889,914 1,181,548 1,865,617
TOTAL EXCHEQUER RECEIPTS 262,311,604 204,652,271 256,988,208 312,940,131 208,236,082 95,898,505
Source: Department of Finance
Statistical Yearbook of Ireland 165

Table 9.8 Exchequer issues
€000
2006 2007 2008 2009 2010 2011
Current payments
Voted Departmental expenditures 32,915,380 36,958,658 40,756,518 40,255,879 40,516,550 41,419,069Servicing national debt 2,379,583 2,141,090 2,099,138 3,213,969 4,836,105 4,774,685Payments to EU budget 1,529,743 1,570,041 1,586,709 1,486,308 1,352,369 1,349,700Other non-voted expenditures 265,024 226,215 251,093 291,862 314,907 482,824
Total 37,089,730 40,896,004 44,693,458 45,248,018 47,019,931 48,026,278
Issues for redemption of debt
Borrowings from ministerial funds 68,156,216 49,723,078 26,590,629 57,581,376 50,803,802 26,600,068Commercial paper 120,830,381 82,218,296 152,858,535 183,071,860 95,527,319 21,011,811European Investment Bank loans – – 74,575 34,092 – –Exchequer bills – – – – – –Exchequer notes – – – – – –Foreign borrowings – – – – – –Medium term notes – – – – – –Miscellaneous debt 713 893 11,121 126 382,477 126National Instalment savings 87,164 89,580 90,623 86,867 95,358 94,439National loans 25,448,099 20,110,939 3,405,744 11,601,544 11,603,716 15,367,844National Solidarity Bond – – – – 6,880 28,891Other Irish Government Public Bond issues – – 35,242 – 399,090 –EU/IMF Programme Funding _ _ _ _ _ 9,457,327Private placements – – – – – –Other domestic borrowings – – – – – –Prize Bonds 106,660 102,131 104,600 100,862 142,406 192,558Savings Bonds 547,746 606,932 535,957 652,009 654,627 855,189Savings Certificates 455,148 452,649 460,001 644,095 505,858 544,453Tax Reserve Certificates – – – – – –
Total 215,632,127 153,304,498 184,167,027 253,772,831 160,121,533 74,152,706
Capital payments
Voted Departmental expenditures 6,475,790 7,650,077 8,556,276 6,907,395 5,917,656 4,291,536Funding of superannuation liabilities 1,446,500 1,615,500 1,690,000 3,000,000 – –Loans issued 730,400 740,000 741,000 790,000 1,317,202 1,000,000Share capital acquired in State Bodies 460 1,661 597 4,001,740 725,000 2,300,000Other non-voted capital expenditures 9,117 11,298 54,922 37,585 3,314 8,605,873
Total 8,662,267 10,018,536 11,042,795 14,736,720 7,963,172 16,197,409
TOTAL EXCHEQUER ISSUES 261,384,124 204,219,038 239,903,280 313,757,569 215,104,636 138,376,393
Source: Department of Finance
166 Statistical Yearbook of Ireland

Table 9.9 Summary National Debt statement at end of year
€m
2005 2006 2007 2008 2009 2010 2011
Medium/long term debt
Borrowing from Central Bank – – – – – – –
European Investment Bank loans 118 120 112 29 – – –
Irish Government Bonds listed on Irish Stock Exchange 31,311 31,189 30,946 41,863 70,858 90,102 85,310
Medium term notes 496 443 400 439 422 66 66
EU/IMF Programme Funding – – – – – – 34,629
Miscellaneous debt -26 26 69 15 31 5 5
Other Irish Government Public Bond Issues 37 38 35 – – – –
Private placements – – – – 217 602 602
Total 31,936 31,816 31,562 42,346 71,528 90,775 120,612
Short term debt
Borrowings from funds under the control of the Minister for Finance 3,573 2,661 2,258 2,605 1,783 1,524 1,696
Commercial paper 115 118 3,286 21,783 16,261 6,972 2,920
Total 3,688 2,779 5,544 24,388 18,044 8,496 4,616
National Savings Schemes
National Instalment Savings 385 394 409 432 456 468 473
National Solidarity Bond – – – – – 342 607
Prize Bonds 561 590 632 804 1,073 1,330 1,449
Saving Certificates 2,208 2,215 2,223 2,533 3,104 3,957 4,233
Savings Stamps 2 2 2 2 2 2 2
Savings Bonds 1,585 1,709 1,675 1,952 2,761 4,239 4,782
Total 4,741 4,910 4,941 5,723 7,396 10,338 11,546
Less liquid assets 2,183 3,588 4,487 22,059 21,816 16,164 17,692
NATIONAL DEBT 38,182 35,917 37,560 50,398 75,152 93,445 119,082
Source: Department of Finance
Statistical Yearbook of Ireland 167

Table 9.10 Public Capital Programme
€m
2005 2006 2007 2008 2009 2010 2011 2012
Sources of funds
Exchequer 5,674 6,423 8,034 8,915 7,211 6,256 4,512 3,701
Non-Exchequer 2,885 2,963 3,771 3,580 4,125 4,110 2,451 1,998
Total 8,559 9,386 11,805 12,495 11,335 10,366 6,963 5,698
Use of funds
Sectoral economic investment
Agriculture and Food 117 123 217 542 429 396 111 69
Industry 470 670 570 598 601 562 552 514
Tourism 43 57 77 90 37 41 29 32
Fisheries 44 54 42 71 56 30 41 24
Forestry 133 196 147 177 169 161 157 127
Total 807 1,100 1,053 1,478 1,292 1,190 890 766
Productive Infrastructure
Energy 1,249 1,188 1,281 1,435 2,112 2,549 1,422 1,356
Transport 2,448 2,647 3,992 4,003 3,539 2,643 2,042 1,479
Environmental services 548 655 713 711 726 672 587 417
Telecommunications, RTÉ, postal service 39 70 68 147 98 94 72 45
Total 4,284 4,560 6,054 6,296 6,475 5,958 4,123 3,297
Social Infrastructure
Housing 1,546 1,612 2,181 2,206 1,576 1,543 628 532
Education and Science 558 675 828 809 800 766 633 447
Health 516 502 659 673 673 391 355 355
Government Construction, Computerisation, etc 848 939 1,031 1,033 691 517 334 302
Total 3,468 3,728 4,699 4,721 3,740 3,217 1,950 1,636
Source: Department of Public Expenditure & Reform
168 Statistical Yearbook of Ireland
0
1,000
2,000
3,000
4,000
5,000
6,000
7,000
2005 2006 2007 2008 2009 2010 2011 2012
€ mUse of Public Capital Programme Funds
Series1
Series2
Series3

Table 9.11 Revenue and expenditure of general government
€m
2005 2006 2007 2008 2009 2010 2011 2012
Current receipts
Gross rental income 495 611 645 834 682 654 679 722
Gross trading income -7 – – – – – – –
Investment income 937 1,239 1,588 2,142 1,985 2,113 2,000 2,257
Miscellaneous receipts 2,581 2,906 2,931 3,053 3,572 4,306 4,123 3,862
Taxes on expenditure (including rates) 21,812 24,666 25,216 22,246 18,275 17,926 17,682 18,032
Taxes on income and wealth 17,751 19,945 20,904 19,231 16,848 16,335 18,821 20,489
Social Insurance contributions 7,322 8,159 9,053 9,259 8,924 8,701 7,532 6,786
Transfers from the rest of the world (notelsewhere included) 250 210 55 149 97 113 52 52
Total receipts – current 51,140 57,736 60,392 56,914 50,382 50,147 50,888 52,200
Capital receipts
Borrowing 191 -3,963 7,224 14,464 28,572 50,808 22,360 12,826
Loan repayments and equity sales 323 771 861 849 766 885 776 776
Other receipts 1,508 1,930 2,369 1,766 628 200 254 91
Taxes on capital 2,231 3,442 3,488 1,767 801 582 1,123 1,172
Transfers from the rest of the world 230 193 162 76 175 48 132 112
Total receipts – capital 4,483 2,374 14,103 18,922 30,941 52,523 24,645 14,978
TOTAL RECEIPTS – CURRENT AND CAPITAL 55,624 60,110 74,496 75,836 81,323 102,670 75,534 67,178
Current expenditure
Expenditure on goods and services 24,362 26,845 29,560 31,202 30,638 28,254 27,598 26,928
National debt interest (including land bondinterest) 1,737 1,846 1,979 2,398 3,290 4,984 5,190 5,912
Subsidies 1,512 1,512 1,658 1,762 1,690 1,577 1,349 1,540
Transfer payments 17,710 19,782 22,450 25,519 27,678 27,259 27,798 27,505
Total expenditure – current 45,321 49,985 55,646 60,879 63,296 62,074 61,936 61,885
Capital expenditure
Grants to enterprises 776 593 823 2,046 4,728 32,137 7,089 701
Gross physical capital formation 5,705 6,810 8,788 9,769 6,084 5,425 4,144 2,700
Loans and share capital 1,128 1,315 1,373 1,447 1,429 1,907 1,167 1,171
Other transfer payments 559 596 980 954 223 -400 333 469
Payments to the rest of the world 24 105 35 31 18 27 27 60
Redemption of securities and loan repayments 2,110 706 6,850 711 5,545 1,499 837 192
Total expenditure – capital 10,303 10,125 18,849 14,957 18,028 40,596 13,598 5,293
TOTAL EXPENDITURE – CURRENT AND
CAPITAL 55,624 60,110 74,496 75,836 81,323 102,670 75,534 67,178
Source: CSO
Statistical Yearbook of Ireland 169

Table 9.12 Expenditure of general government by purpose of expenditure and economic category
€m
2004 2005 2006 2007 2008 2009 2010 2011 2012
Defence 890 855 907 970 1,073 1,051 957 936 883
Other general government services 5,568 5,876 6,303 7,165 7,315 5,701 3,465 5,545 5,357
Education 6,442 7,077 7,734 8,691 9,301 9,191 8,710 8,545 8,075
Health 10,479 11,670 12,119 13,605 14,470 14,668 13,851 13,241 13,494
Social security and welfare 11,859 13,076 14,906 17,278 19,664 21,912 22,264 21,609 21,259
Housing 2,069 2,597 3,202 4,001 3,712 2,890 2,470 2,138 2,096
Other community and social services 1,994 2,266 2,625 3,035 3,552 2,761 2,855 2,460 2,329
Agriculture, forestry and fishing 1,666 2,173 2,278 2,570 3,621 2,582 2,247 2,093 2,191
Mining, manufacturing and construction 564 571 697 723 1,085 810 715 849 830
Transport and communication 3,277 3,402 4,243 4,737 5,707 4,112 3,695 2,930 1,939
Other economic services 1,907 2,215 2,545 2,892 3,230 6,811 34,958 9,160 2,622
Public debt 4,983 3,847 2,552 8,829 3,108 8,834 6,483 6,028 6,103
Total Expenditure 51,696 55,624 60,110 74,496 75,836 81,323 102,670 75,534 67,178
Source: CSO
170 Statistical Yearbook of Ireland