Embed Size (px)
Citation preview

CHAPTER 9
PROJECTS PROPOSED BY VARIOUS ENTITIES AND PRE-SCREENING OF PROPOSED
PROJECTS

9-1
CHAPTER 9 ROAD PROJECTS PROPOSED BY VARIOUS ENTITIES
AND PRE-SCREENING OF PROPOSED PROJECTS 9.1 PROPOSED PROJECTS BY VARIOUS ENTITIES
Information on existing, on-going and proposed road projects was collected and summarized in Table 9.1-1 and shown in Figure 9.1-1.

9-2
TABLE 9.1-1(1/3) MAJOR ROAD PROJECTS IN NORTH OF METRO MANILA
PROPONENT /OPERATOR
REF NO.
HIGH STANDARD HIGHWAY PROJECTS
DESCRIPTION STATUS
(Segment 1) Widening from Balintawak to Tabang (27.62 kms).
(Segment 2) Widening from Burol to San Fernando (32.8 kms).
(Segment 3) Widening from San Fernando to Santa Ines (22.2 kms).
Completed / Operational (opened to traffic Feb. 2005)
1 North Luzon Expressway
(NLEx) Phase 1
(Segment 7 - Subic-Tipo Tollway) Construction of from Bo. Tipo to SBMA (8.5 kms).
Completed / Operational
(Segment 8.1) Construction of C-5 section from Mindanao Ave. to NLE (2.34 kms).
NTP issued by TRB to MNTC last 15 April 2009. Construction works is ongoing.
(Segment 8.2) Construction of C-5 section from C.P Garcia to Mindanao Ave. (10.23 kms).
MNTC is putting on-hold plans for this section in view of the Government's ongoing widening of Katipunan Ave. and the construction of fly-over that will cross commonwealth Ave. and connect to Katipunan Ave., to Segment 8.1 at Mindanao Ave. via Luzon and Congressional Ave.
(Segment 9) Construction of C-5 Section from NLE to Mc Arthur (4.06 kms).
Detailed Engineering Design is ongoing.
2
North Luzon Expressway
(NLEx) Phase 2 Circumferential
Road C-5
(Segment 10) Construction of Section from Mc Arthur Highway to C-3 (5.63 kms).
MNTC will be conducting an alternative alignment study with the view of identifying shorter alignment.
(Segment 4) Construction of San Simon to Guagua (17 kms).
(Segment 5) Construction of Guagua to Dinalupihan (31 kms).
Manila North Tollway
Corporation (MNTC)
3
North Luzon Expressway
(NLEx) Phase 3 Subic Expressway (Segment 6) Construction of Dinalupihan to
Tipo (10.50 kms).
Construction scheduled 2012-2014
(Package 1) Construction of 4-lane expressway to connect end of Subic Bay - Tipo Expressway to Clark Special Economic Zone (50kms.)
Completed. Opened to traffic April 2008.
BCDA 4 Subic-Clark-
Tarlac Expressway (SCTEx) (Package 2) Construction of 4-lane
expressway from Clark Special Economic Zone to Tarlac City running parallel to Manila North Road (43kms.)
Completed. Opened to traffic July 2008.
DPWH 5 Cabanatuan Bypass
From PPH in San Leonardo to Pan Philippine Highway in Talavera, both in the province of Neva Ecija (35 kms).
Construction deferred

9-3
PROPONENT /OPERATOR
REF NO.
HIGH STANDARD HIGHWAY PROJECTS
DESCRIPTION STATUS
6 Plaridel Bypass From NLEX Guguinto to PPH in San Rafael, both in the province of Bulacan (23 kms).
On-going Construction
7 San Jose Bypass San Jose City, Nueva Ecija (8 kms). Detailed Design Completed (Route A) From the alignment of the proposed TPLEX in Ramos, Tarlac to PPH in Muñoz, Nueva Ecija.
(Route B) From the alignment of the proposed TPLEX in Pura, Tarlac to PPH in Sto Domingo, Nueva Ecija.
8 Central Luzon Expressway
(CLEX) Phase 1 (Route C) From Tarlac City to the vivinity of the intersection of the north end of Cabanatuan Bypass and PPH in Nueva Ecija.
F-S is on-going. (JICA Yen Loan)
9 Central Luzon Expressway
(CLEX) Phase 2
With 3 alternatives route both beginning at the vicinity of the intersection of Cabanatunan bypass, PPH and Proposed CLEX Phase 1.
F-S is on-going. (JICA Yen Loan)
10
North Luzon
Expressway East (NLEE)
Construction of 4-lane expressway to run parallel and East of Pan Philippine Highway from C5 in Quezon City to San Jose City in Nueva Ecija (126 kms).
Pre- feasibility study completed in 2000. Project was found not feasible for private sector.
(Phase 1) Construction of 2-lane (initial) expressway from La Paz interchange of SCTEx to Rosario, La Union (88 kms.)
Philippine Infrastructure Development Corporation
(PIDC)
11
Tarlac-Pangasinan-La Union
Expressway (TPLEx)
(Phase 2) Expansion to 4-lane expressway when traffic volume reaches 25,000/day), and extension from Rosario to San Fernando, La Union
Detailed engineering, including parcellary survey by PIDC is ongoing. ROW acquisition from Tarlac City to Carmen, Pangasinan (49 kms) by DPWH is ongoing.
(Phase 1) Connecting Plaridel Bypass and Cabanatuan Bypass running parallel and to the west of PPH.
JICA 12 2nd Pan Philippine Highway (Phase 2) Connecting Cabanatuan Bypass
and San Jose running parallel and to the west of PPH.
Conceptual Stage
13
Manila Cavite Toll Expressway
Phase 1 (R-1 Expressway)
Upgrading of existing R-1 Expressay into a dual 3-lane expressway from Airport Road to Junction to Zapote (6.75 kms).
Completed last May 1998.
14 Phase 2
(C-5 Link Expressway)
Design and construction of dual 3-lane expressway from R-1 Expressway to SLEX and C-5 in Parañaque and Taguig (7.50 kms).
Detailed Design completed. UEM-MARA Phillippines
Corp.
15 Phase 3
(R-1 Expressway Extension)
Design and construction of dual 2-lane expressway from R-1 Expressway at Zapote to Noveleta, Cavite (11.24 kms, of which 4.0 kms will be reclaimed land).
On- going construction from end of R-1 expressway in Bacoor to Kawit on land reclamation along the coast of Manila Bay.
9-4
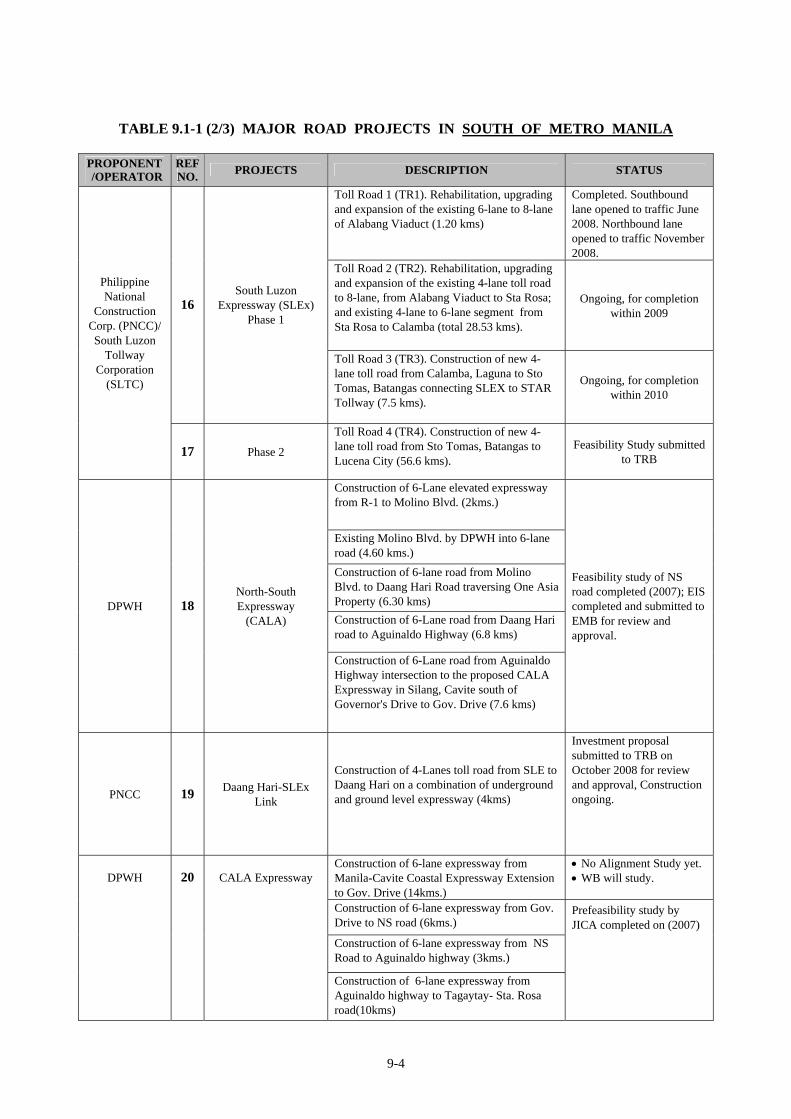
TABLE 9.1-1 (2/3) MAJOR ROAD PROJECTS IN SOUTH OF METRO MANILA
PROPONENT /OPERATOR
REF NO. PROJECTS DESCRIPTION STATUS
Toll Road 1 (TR1). Rehabilitation, upgrading and expansion of the existing 6-lane to 8-lane of Alabang Viaduct (1.20 kms)
Completed. Southbound lane opened to traffic June 2008. Northbound lane opened to traffic November 2008.
Toll Road 2 (TR2). Rehabilitation, upgrading and expansion of the existing 4-lane toll road to 8-lane, from Alabang Viaduct to Sta Rosa; and existing 4-lane to 6-lane segment from Sta Rosa to Calamba (total 28.53 kms).
Ongoing, for completion within 2009
16 South Luzon
Expressway (SLEx) Phase 1
Toll Road 3 (TR3). Construction of new 4-lane toll road from Calamba, Laguna to Sto Tomas, Batangas connecting SLEX to STAR Tollway (7.5 kms).
Ongoing, for completion within 2010
Philippine National
Construction Corp. (PNCC)/ South Luzon
Tollway Corporation
(SLTC)
17 Phase 2
Toll Road 4 (TR4). Construction of new 4-lane toll road from Sto Tomas, Batangas to Lucena City (56.6 kms).
Feasibility Study submitted to TRB
Construction of 6-Lane elevated expressway from R-1 to Molino Blvd. (2kms.)
Existing Molino Blvd. by DPWH into 6-lane road (4.60 kms.) Construction of 6-lane road from Molino Blvd. to Daang Hari Road traversing One Asia Property (6.30 kms) Construction of 6-Lane road from Daang Hari road to Aguinaldo Highway (6.8 kms)
DPWH 18 North-South Expressway
(CALA)
Construction of 6-Lane road from Aguinaldo Highway intersection to the proposed CALA Expressway in Silang, Cavite south of Governor's Drive to Gov. Drive (7.6 kms)
Feasibility study of NS road completed (2007); EIS completed and submitted to EMB for review and approval.
PNCC 19 Daang Hari-SLEx Link
Construction of 4-Lanes toll road from SLE to Daang Hari on a combination of underground and ground level expressway (4kms)
Investment proposal submitted to TRB on October 2008 for review and approval, Construction ongoing.
Construction of 6-lane expressway from Manila-Cavite Coastal Expressway Extension to Gov. Drive (14kms.)
• No Alignment Study yet.• WB will study.
Construction of 6-lane expressway from Gov. Drive to NS road (6kms.)
Construction of 6-lane expressway from NS Road to Aguinaldo highway (3kms.)
DPWH 20 CALA Expressway
Construction of 6-lane expressway from Aguinaldo highway to Tagaytay- Sta. Rosa road(10kms)
Prefeasibility study by JICA completed on (2007)

9-5
PROPONENT /OPERATOR
REF NO. PROJECTS DESCRIPTION STATUS
Construction of 6-lane expressway from Tagaytay- Sta. Rosa Road to SLEX (5kms.)
(Alternative Route 1) From junction of Quezon Blvd. in Cardona, Rizal and pass through Binangonan peninsula and Talim island in Laguna de Bay and end at the junction of Greenfield Exit of SLEX. (35 kms)
IDI (International Development
Institution, Japan)
21 Laguna de Bay Crossing Road
(Alternative Route 2) From junction of Quezon Blvd. in Cardona, Rizal and pass through Binangonan peninsula and Talim island in Laguna de Bay and the towns of Los Baños and Bay in Laguna and ends at the intersection with Maharlika Highway near town of Alaminos, Laguna (46.2 kms)
Still Conceptual Stage
DPWH 22 Calamba-Los Banos Toll Expressway
Construction of 4-lane expressway starting at the entrance of Greenfields and ends at Bgy. Masili, Calamba then crosses the rail line, close to the coastal areas going to Los Baños and finnaky terminates at the town of Bay (15.50 kms)
Feasibility study completed.
(Stage I) Existing 4-lane expressway from Sto. Tomas to Lipa, Batangas (22 kms)
Operational. Star Infrastructure Development Corp. (SIDC)
23 Southern Tagalog Arterial Road (STAR) (Stage II) Construction of 4-lane toll road
(initial 2-lane southbound) from Lipa to Batangas City (20 kms)
South Bound (2-lane) Completed October 2008. Opened to traffic April 2008.
PNCC Skyway Corp. 24 Metro Manila Skyway
(Stage 1)
(Stage 1) Construction of 6-lane elevated expressway from Bicutan to Buendia, with Ayala Central Business District Access Ramps (9.38 kms); and rehabilitation of South Luzon Expressway from Magallanes to Alabang (13.43 kms).
Operational. Completed in December 1999.
25 Metro Manila Skyway (Stage 2)
(Stage 2) Construction of 6-lane elevated expressway from Bicutan to Alabang (6.88 kms).
Noticed to Proceed (NTP) issued by TRB last 27 April 2009 and acknowledge by proponent on same date. Ongoing construction works.
26 Metro Manila Skyway (Stage 3)
(Stage 3, with 3 Alternative Alignment) Construction of 6-lane elevated expressway from Buendia to NLE. PNCC/Skyway Corp. withdrew its franchise.
Updating of feasibility study.
MNTC/PNR 26 NLEx-SLEx Link Expressway
NLEx and SLEx are to be connected utilizing PNR ROW
• MNTC completed Pre-F/S.• METI Study completed. • MNTC is undertaking detailed F/S.
9-6
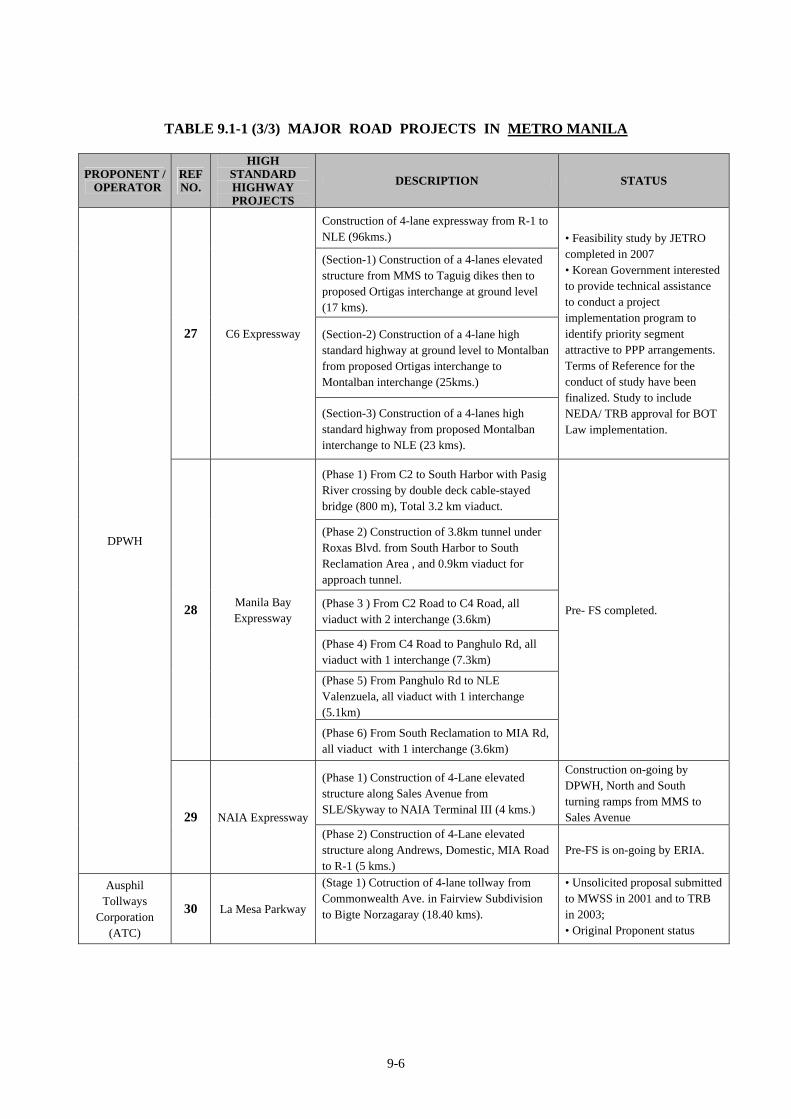
TABLE 9.1-1 (3/3) MAJOR ROAD PROJECTS IN METRO MANILA
PROPONENT / OPERATOR
REF NO.
HIGH STANDARD HIGHWAY PROJECTS
DESCRIPTION STATUS
Construction of 4-lane expressway from R-1 to NLE (96kms.)
(Section-1) Construction of a 4-lanes elevated structure from MMS to Taguig dikes then to proposed Ortigas interchange at ground level (17 kms).
(Section-2) Construction of a 4-lane high standard highway at ground level to Montalban from proposed Ortigas interchange to Montalban interchange (25kms.)
27 C6 Expressway
(Section-3) Construction of a 4-lanes high standard highway from proposed Montalban interchange to NLE (23 kms).
• Feasibility study by JETRO completed in 2007 • Korean Government interested to provide technical assistance to conduct a project implementation program to identify priority segment attractive to PPP arrangements. Terms of Reference for the conduct of study have been finalized. Study to include NEDA/ TRB approval for BOT Law implementation.
(Phase 1) From C2 to South Harbor with Pasig River crossing by double deck cable-stayed bridge (800 m), Total 3.2 km viaduct.
(Phase 2) Construction of 3.8km tunnel under Roxas Blvd. from South Harbor to South Reclamation Area , and 0.9km viaduct for approach tunnel.
(Phase 3 ) From C2 Road to C4 Road, all viaduct with 2 interchange (3.6km)
(Phase 4) From C4 Road to Panghulo Rd, all viaduct with 1 interchange (7.3km)
(Phase 5) From Panghulo Rd to NLE Valenzuela, all viaduct with 1 interchange (5.1km)
28 Manila Bay Expressway
(Phase 6) From South Reclamation to MIA Rd, all viaduct with 1 interchange (3.6km)
Pre- FS completed.
(Phase 1) Construction of 4-Lane elevated structure along Sales Avenue from SLE/Skyway to NAIA Terminal III (4 kms.)
Construction on-going by DPWH, North and South turning ramps from MMS to Sales Avenue
DPWH
29 NAIA Expressway (Phase 2) Construction of 4-Lane elevated structure along Andrews, Domestic, MIA Road to R-1 (5 kms.)
Pre-FS is on-going by ERIA.
Ausphil Tollways
Corporation (ATC)
30 La Mesa Parkway
(Stage 1) Cotruction of 4-lane tollway from Commonwealth Ave. in Fairview Subdivision to Bigte Norzagaray (18.40 kms).
• Unsolicited proposal submitted to MWSS in 2001 and to TRB in 2003; • Original Proponent status

9-7
PROPONENT / OPERATOR
REF NO.
HIGH STANDARD HIGHWAY PROJECTS
DESCRIPTION STATUS
(Stage 2) On-grade rehabilitation/widening of the existing 2-lane national road from Bigte junction in Norzagaray to Baliuag Bypass in Bulacan Province (38 kms)
Unsolicited Proposal BOT
Law
given to ATC in 2007; • ATC submitted preliminary engineering plans and traffic study last January 2009; • ATC still to submit Final Feasibility Study, Financial Model, ECC from EMB, and RDC Clearance.
(Component 1) Construction of 4-lane elevated expressway from Buendia Avenue-Ayala intersection following the alignment of the proposeed C-3 Road, then along both baks of Pasig River to the vicinity of Fort Bonifacio Gate
STRADEC to submit the final feasibility. Note: Design conflict with the MRT structure at Guadalupe.
(Component 2) Construction of 4-lane elevated expressway from Fort Bonifacio Gate to C-5 Road along the existing Kalayaan Ave.
STRADEC 31 Pasig Expressway
(Component 3) Combination of elevated and ground level expressway from C-5, Mangahan floodway, to Ortigas-Imelda Avenue Intersection.
Elevated structure over MRT in Guadalupe to reach C-3 difficult and expensive.
MRT-7 Consortium
32 NLEx-MRT 7 Terminal Link
MRT-7 Consortium is proposing to build this road, which is a part of C-6.
DPWH (PMO -URPO)
33 C-5/FTI/ Skyway Connector Road
This connector road links C-5 with Skyway via FTI area.
Detailed Design is on-going.
DPWH 34 Manila-Bataan Coastal Road
Proposed early 1970s. • Conceptual Stage
DPWH 35 C-6 Extension
along Laguna de Bay
Proposed to be constructed together with flood control dike.
• Conceptual Stage
DPWH 36 Manila Bay Crossing Road
Proposed to connect Cavite Province with Bataan Peninsula.
• Conceptual Stage
Green Square Properties Corp.
37 Quezon City – Dingalan Road
Intended to provide access from Metro Manila to Dingalan Road.
• Conceptual Stage
DPWH 38 Marikina – Infanta Road
Intended to provide access to Pacific Ocean Area.
• Gradually extending by local fund.
DPWH 39
Tarlac – Nueva Ecija –
Aurora – Dingalan Port Road
Intended to provide access to Pacific Ocean Area.
• Existing (National Road + Provincial Road)

9-8
Source: Prepared by the Study Team based on various proposal documents
FIGURE 9.1-1 (1/3) EXISTING, ON-GOING/COMMITTED AND PROPOSED EXPRESSWAYS: NORTH OF METRO MANILA
9-9
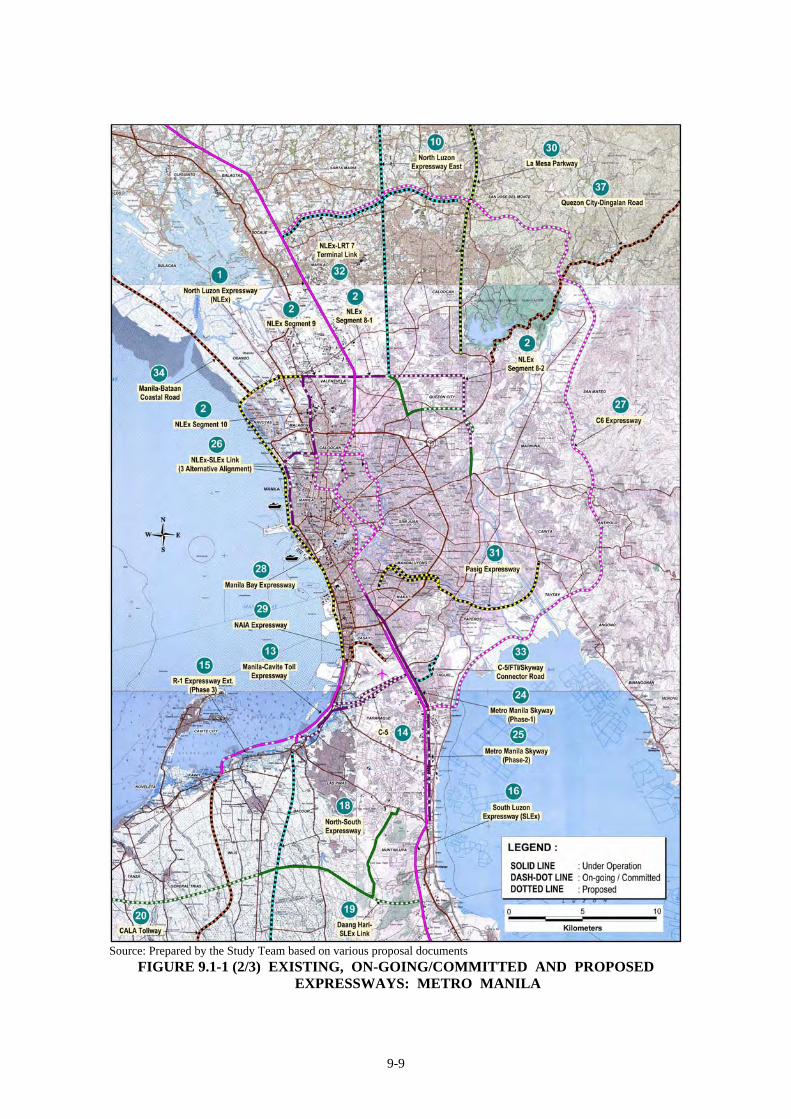
Source: Prepared by the Study Team based on various proposal documents
FIGURE 9.1-1 (2/3) EXISTING, ON-GOING/COMMITTED AND PROPOSED EXPRESSWAYS: METRO MANILA

9-10
Source: Prepared by the Study Team based on various proposal documents
FIGURE 9.1-1 (3/3) EXISTING, ON-GOING/COMMITTED AND PROPOSED EXPRESSWAYS: SOUTH OF METRO MANILA
9-11
9.2 INTEGRATION OF ROAD PROJECTS PROPOSED ALONG THE SAME CORRIDOR AND PRE-SCREENING OF PROPOSED PROJECTS
(1) Integration of Road Projects Proposed Along the Same Corridor
As shown in Figure 9.1-1, in some cases, there are several proposed projects along the same corridor and these are called in different project names. Projects proposed along the same corridor were integrated into one project and its project name was selected. Table 9.2-1 shows which projects were integrated and representative name of the project.
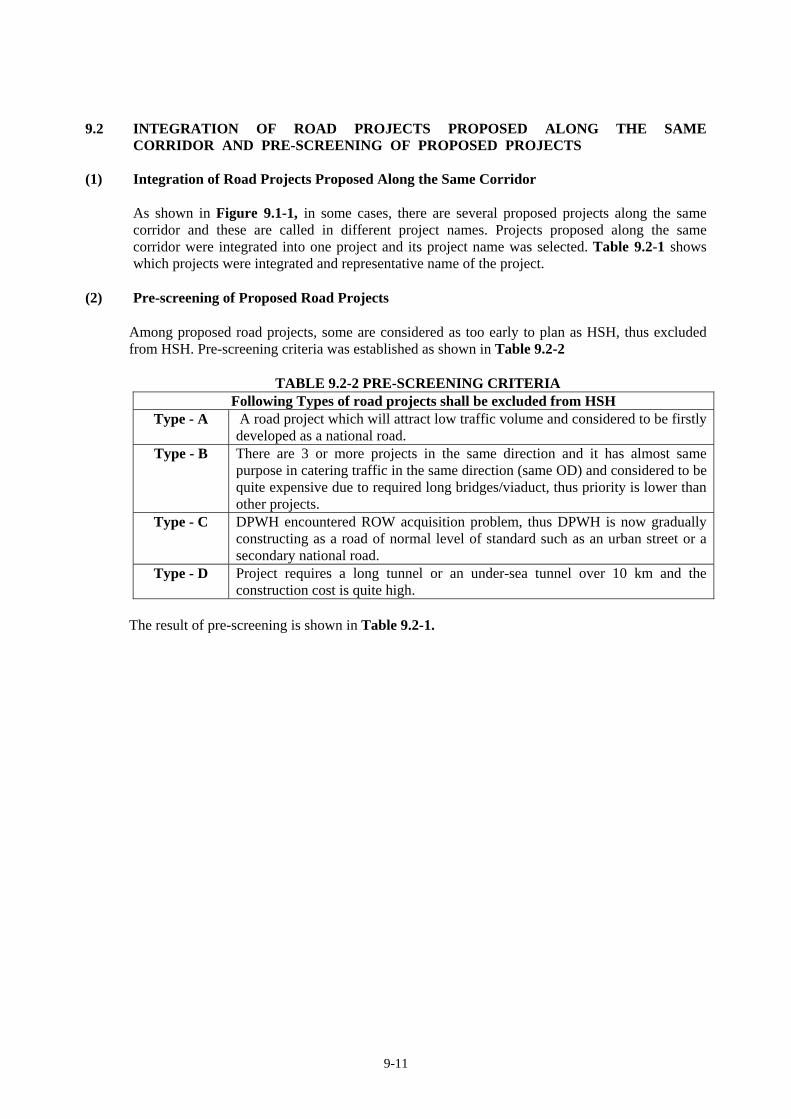
(2) Pre-screening of Proposed Road Projects
Among proposed road projects, some are considered as too early to plan as HSH, thus excluded from HSH. Pre-screening criteria was established as shown in Table 9.2-2
TABLE 9.2-2 PRE-SCREENING CRITERIA Following Types of road projects shall be excluded from HSH
Type - A A road project which will attract low traffic volume and considered to be firstly developed as a national road.
Type - B There are 3 or more projects in the same direction and it has almost same purpose in catering traffic in the same direction (same OD) and considered to be quite expensive due to required long bridges/viaduct, thus priority is lower than other projects.
Type - C DPWH encountered ROW acquisition problem, thus DPWH is now gradually constructing as a road of normal level of standard such as an urban street or a secondary national road.
Type - D Project requires a long tunnel or an under-sea tunnel over 10 km and the construction cost is quite high.
The result of pre-screening is shown in Table 9.2-1.

9-12
TABLE 9.2-1 PRE-SCREENING OF PROPOSED PROJECTS BY VARIOUS ENTITIES
No. PROJECT NAME COMMENTS INTEGRATION OF PROJECTS ALONG THE SAME CORRIDOR PRE-SCREENING RESULT
5 Cabanatuan Bypass • City Bypass already constructed. • No fixed construction schedule. • Planned to be a part of NLEx-East
(proposed bypass alignment to be used as a part of NLEx-East alignment.
10 North Luzon Expressway - East
• Originally proposed alignment is too far from urban centers.
• Passes through the same corridor as 2nd Pan Philippine Highway
12 2nd Pan Philippine Highway • To be named as NLEx-East
30 La Mesa Parkway • To be connected with NLEx-East
• Proposed projects of 5, 10, 12, and 30 are located along the same corridor.
• These are integrated and called as “NLEx-East”
• La Mesa Parkway is considered as Phase-1 of NLEx-East.
• Important corridor to develop Eastern Central Luzon and provide vital access to Region II.
• Pan-Philippine Highway south of Cabanatuan City is suffering traffic congestion.
• To be developed as HSH-1.
Metro Manila Skyway Stage 3
• One of alternative alignments of NLEx-SLEx Link Expressway
26
NLEx-SLEx Link Expressway
• One of alternative alignments of NLEx-SLEx Link Expressway
• After evaluation of alternative alignments, most optimum alignment will be selected for NLEx-SLEx Link Expressway.
• One of the most important links of expressway network in Metro Manila.
• To be developed as HSH-1.
27 C-6 Expressway
32 NLEx-MRT 7 Terminal Link
• Almost same alignment is proposed for the northern section of C-6 and NLEx- MRT 7 Terminal Link.
• Both are integrated and named as “C-6 Expressway”.
• NLEx-MRT 7 Terminal Link is called “Northern Section of C-6 Expressway”
• To function as a traffic distributor of NLEx-East, and Skyway.
• To support urban development of Eastern area of Metro Manila.
• To be developed as HSH-1. 3 NLEx-Phase 3
34 Manila-Bataan Coastal Road
• Both projects pass through almost the same alignment between Calumpit, Bulacan and Dinalupihan, Bataan.
• The section between Calumpit , Bulacan and Dinalupihan, Bataan is named as “NLEx-Phase 3”.
• Both roads are to be developed as HSH-1, although implementation priority is not high.
7 San Jose Bypass
8 & 9
Central Luzon Expressway (CLEx)
• San Jose Bypass conflicts with Phase-2 of CLEx.
• San Jose Bypass to be developed as an arterial urban road of San Jose City.
• Project is named as CLEx”.
• CLEx will function to divert traffic on PPH to SCTEx/NLEx until such time NLEx-East is completed.
• When NLEx-East is completed, CLEx will function to connect SCTEx/NLEx and NLEx-East.
• To be developed as HSH-1.
9-12

9-13
No. PROJECT NAME COMMENTS INTEGRATION OF PROJECTS
ALONG THE SAME CORRIDOR PRE-SCREENING RESULT
14 Manila-Cavite Coastal Expressway: Phase 2 (C-5 Link Expressway)
• Connection with SLEx is quite difficult.• Encountered ROW acquisition problem.• DPWH is partially developing as an
urban road.
• Continue to be developed as an urban road. • To be excluded from HSH. [ Type C ]
17 South Luzon Expressway: Phase 2 (to Lucena City)
• SLTC has a franchise. • Important link for development of Region IV-A and Region V.
• To be developed as HSH-1. 18 North-South Expressway
(CALA) • Originally proposed as a bus-way. • Due to rapid progress of land
development by various real estate companies, ROW acquisition is now quite difficult.
• The proposed alignment passes very close to Aguinaldo Highway.
• In consideration of development of Aguinaldo Highway and CALA Expressway as well as ROW acquisition problems, this project is proposed to be developed as a national road.
• To be excluded from HSH-1. [ Type C ]
20 CALA Expressway • Many economic zones were developed along the corridor.
• This will relieve traffic congestion of Aguinaldo Highway.
• WB is going to study Phase-1.
• One of the most important links in Cavite Province.
• To be developed as HSH-1.
21 Laguna de Bay Crossing Road
• Still conceptual stage. • This route conflicts with SLEx,
Skyway, CALA Expressway and C-6 Extension along Laguna de Bay.
• Development of this project should be considered as a long-term project beyond 2030, thus excluded from HSH. [Type B]
22 Calamba-Los Banos Toll Expressway
• Los Banos Area is a tourist attraction area. To promote tourism industry in this area, the project is important.
• Existing national road is highly congested.
• To be developed as HSH-1.
28 Manila Bay Expressway • This expressway should be connected with Manila-Cavite Coastal Expressway and NAIA Expressway.
• To relieve the traffic congestion of Roxas Blvd. and to provide access to
• To be developed as HSH-1.
9-13

9-14
No. PROJECT NAME COMMENTS INTEGRATION OF PROJECTS
ALONG THE SAME CORRIDOR PRE-SCREENING RESULT
Manila Port. This is an important link.
29 NAIA Expressway • Construction of Phase-1 is almost completed.
• Important link to connect Skyway with Manila-Cavite Coastal Expressway and Manila Bay Expressway.
• Important to provide access to NAIA.
• To be developed as HSH-1.
31 Pasig Expressway • Important link to provide new access to Makati CBD from eastern area of Metro Manila.
• Due to difficulty to acquire ROW in eastern area, the alignment is proposed to be amended to pass along Pasig River and Marikina River.
• Modified alignment is called as “Pasig-Marikina Expressway.”
• To be developed as HSH-1.
33 C-5/FII/Skyway Connector Road
• Detailed design is on-going by DPWH. • Important link to re-develop Food
Terminal and to connect Skyway with C-5.
• To be developed as HSH-1.
35 C-6 Extension along Laguna de Bay
• Proposed to be developed as a combined facility of flood control and land transportation.
• Traffic generated areas between SLEx and Laguna de Bay is to be attracted by this road.
• To be developed as HSH-1.
36 Manila Bay Crossing Road • Intended to connect Cavite Province with Bataan Peninsula.
• Requires about 25 km of under-sea tunnel.
• Still to be considered as a dream project.
• Too early to be planned as HSH, thus excluded from HSH network. [ Type D ]
9-14

9-15
No. PROJECT NAME COMMENTS INTEGRATION OF PROJECTS
ALONG THE SAME CORRIDOR PRE-SCREENING RESULT
37 Quezon City-Dingalan Road • The proposed route has to cross Sierra Madre Range, thus difficult to develop as a high standard road.
• Traffic will be less than 3,000 veh./day, since Pacific Ocean Area at Dingalan is still to be developed.
• To be developed as a national road, and excluded from HSH network. [ Type A ]
38 Marikina-Infanta Road • DPWH is continuing to develop this road.
• This road has to cross Sierra Madre Range, thus difficult to develop as a high standard road.
• Due to under-development of Infanta Area along Pacific Coast, traffic will be less than 3,000 veh./day.
• To be developed as a national road, and excluded from HSH network. [ Type A ]
39 Tarlac-Nueva Ecija-Aurora- Dingalan Port Road
• There is an existing road, composed of national road and provincial road.
• The existing road should be firstly improved as national road standard.
• To provide reliable access to the Pacific Ocean Area for development of the area, this link included as HSH-2.
9-15
9-16
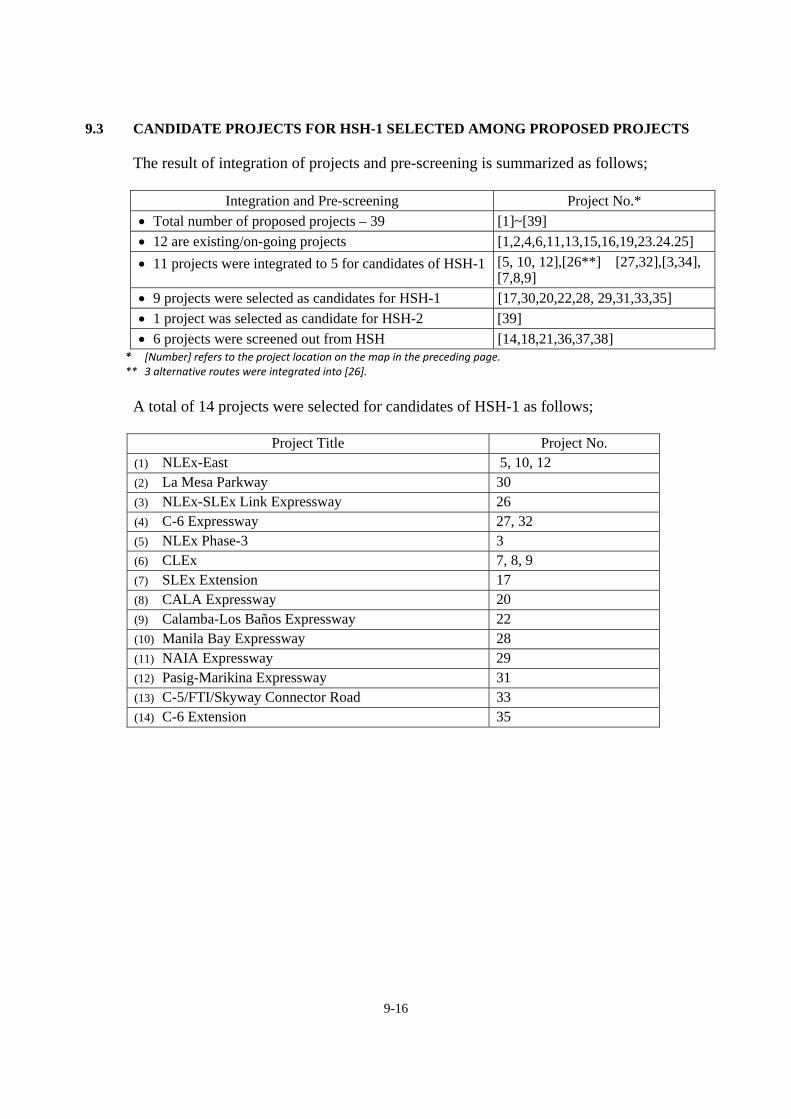
9.3 CANDIDATE PROJECTS FOR HSH-1 SELECTED AMONG PROPOSED PROJECTS The result of integration of projects and pre-screening is summarized as follows;
Integration and Pre-screening Project No.* • Total number of proposed projects – 39 [1]~[39] • 12 are existing/on-going projects [1,2,4,6,11,13,15,16,19,23.24.25] • 11 projects were integrated to 5 for candidates of HSH-1 [5, 10, 12],[26**] [27,32],[3,34],
[7,8,9] • 9 projects were selected as candidates for HSH-1 [17,30,20,22,28, 29,31,33,35] • 1 project was selected as candidate for HSH-2 [39] • 6 projects were screened out from HSH [14,18,21,36,37,38]
* [Number] refers to the project location on the map in the preceding page. ** 3 alternative routes were integrated into [26].
A total of 14 projects were selected for candidates of HSH-1 as follows;
Project Title Project No. (1) NLEx-East 5, 10, 12 (2) La Mesa Parkway 30 (3) NLEx-SLEx Link Expressway 26 (4) C-6 Expressway 27, 32 (5) NLEx Phase-3 3 (6) CLEx 7, 8, 9 (7) SLEx Extension 17 (8) CALA Expressway 20 (9) Calamba-Los Baños Expressway 22 (10) Manila Bay Expressway 28 (11) NAIA Expressway 29 (12) Pasig-Marikina Expressway 31 (13) C-5/FTI/Skyway Connector Road 33 (14) C-6 Extension 35

CHAPTER 10
FUTURE SOCIO-ECONOMIC FRAMEWORK AND REGIONAL DEVELOPMENT SCENARIO

10-1
CHAPTER 10 FUTURE SOCIO-ECONOMIC FRAMEWORK
AND REGIONAL DEVELOPMENT SCENARIO 10.1 FUTURE SOCIO-ECONOMIC FRAMEWORK
Future socio-economic framework was established for items which are closely related to traffic generation/attraction as follows; ● Population ● GDP and GRDP of concerned regions ● Number of employment at job-site
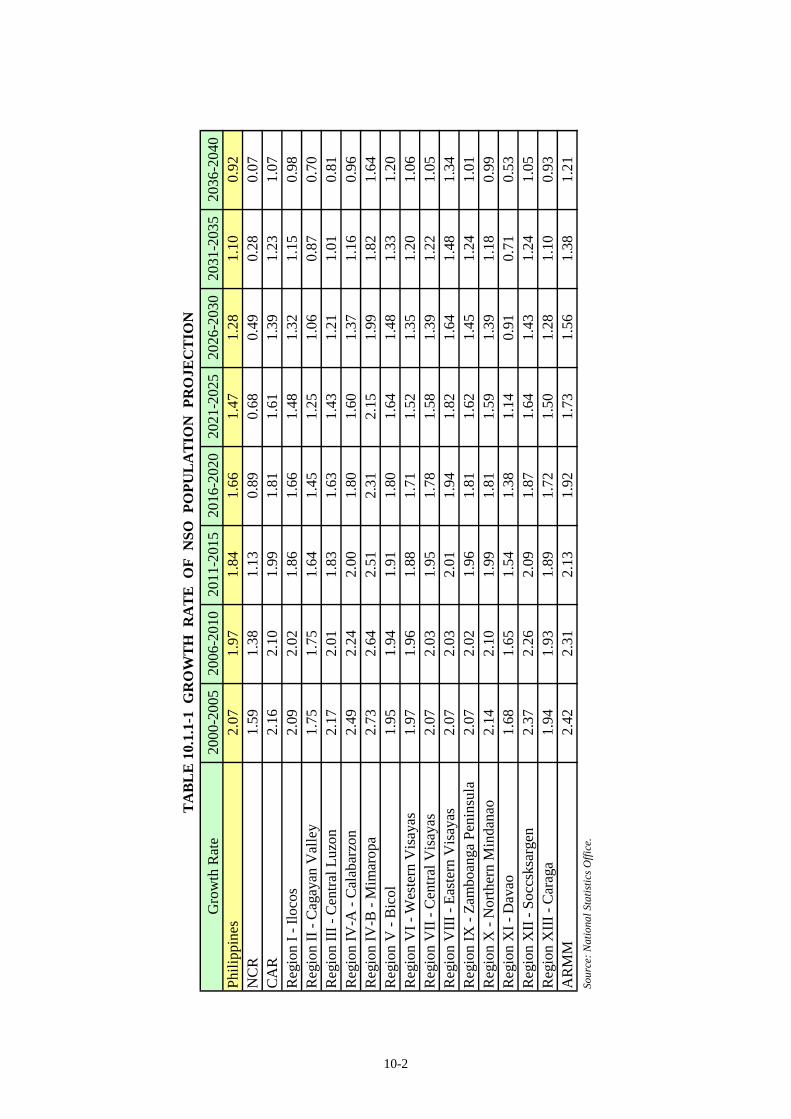
10.1.1 Future Population
National Statistics Office (NSO) made the population projection in 2004 based on the 2000 census results. Population growth rate for the country and each region estimated by NSO is shown in Table 10.1.1-1. In 2007, another census was undertaken. Comparing NSO projection based on the 2000 census and 2007 census results, it can be said that population growth rate made by NSO projection is slightly lower than that of the actual at least up to 2007. For example, national level projection and actual have following difference; NSO Projection Actual based on Census 2000-2005: 2.07% 2000-2007: 2.11% 2006-2010: 1.97% Since there is no other official population projection, the Study adopted NSO projection with adjustment of population growth rate by population decrease pattern by copying population growth rates of Nation level, NCR, Region III and Region IV-A is shown in Figure 10.1.1-1. Breakdown of regional population to province and traffic zone was made by referencing the past population growth rate and urbanization trend. Projected population is shown in Table 10.1.1-2.
10.1.2 Economic Framework
Economic framework for the future was established for GDP and GRDP of concerned Regions. Past economic performance represented by GDP was as follows;
PAST ECONOMIC PERFORMANCE Period Annual Average Growth Rate (%)
1993 – 2007 (14 years) 4.55%
1997 – 2007 (10 years) 4.36%
2002 – 2007 (5 years) 5.77% As a long term average, the country made the economic growth rate of 4.5%. As a short term average, about 6% growth was achieved.
10-2
TA
BL
E 1
0.1.
1-1
GR
OW
TH
RA
TE
OF
NSO
PO
PUL
AT
ION
PR
OJE
CT
ION
Gro
wth
Rat
e20
00-2
005
2006
-201
020
11-2
015
2016
-202
020
21-2
025
2026
-203
020
31-2
035
2036
-204
0Ph
ilipp
ines
2.07
1.97
1.84
1.66
1.47
1.28
1.10
0.92
NC
R1.
591.
381.
130.
890.
680.
490.
280.
07C
AR
2.16
2.10
1.99
1.81
1.61
1.39
1.23
1.07
Reg
ion
I - Il
ocos
2.09
2.02
1.86
1.66
1.48
1.32
1.15
0.98
Reg
ion
II - C
agay
an V
alle
y1.
751.
751.
641.
451.
251.
060.
870.
70R
egio
n III
- C
entra
l Luz
on2.
172.
011.
831.
631.
431.
211.
010.
81R
egio
n IV
-A -
Cal
abar
zon
2.49
2.24
2.00
1.80
1.60
1.37
1.16
0.96
Reg
ion
IV-B
- M
imar
opa
2.73
2.64
2.51
2.31
2.15
1.99
1.82
1.64
Reg
ion
V -
Bic
ol1.
951.
941.
911.
801.
641.
481.
331.
20R
egio
n V
I - W
este
rn V
isay
as1.
971.
961.
881.
711.
521.
351.
201.
06R
egio
n V
II - C
entra
l Vis
ayas
2.07
2.03
1.95
1.78
1.58
1.39
1.22
1.05
Reg
ion
VIII
- Ea
ster
n V
isay
as2.
072.
032.
011.
941.
821.
641.
481.
34R
egio
n IX
- Za
mbo
anga
Pen
insu
la2.
072.
021.
961.
811.
621.
451.
241.
01R
egio
n X
- N
orth
ern
Min
dana
o2.
142.
101.
991.
811.
591.
391.
180.
99R
egio
n X
I - D
avao
1.68
1.65
1.54
1.38
1.14
0.91
0.71
0.53
Reg
ion
XII
- Soc
csks
arge
n2.
372.
262.
091.
871.
641.
431.
241.
05R
egio
n X
III -
Car
aga
1.94
1.93
1.89
1.72
1.50
1.28
1.10
0.93
AR
MM
2.42
2.31
2.13
1.92
1.73
1.56
1.38
1.21
Sour
ce: N
atio
nal S
tatis
tics O
ffice
.

10-3
(thousands)
2009 2010 2015 2020 2025 2030 2030/2009
92,171 94,024 103,201 112,276 121,013 129,213 1.40National Capital Region 11,960 12,200 13,331 14,362 15,180 15,810 1.32
City of Manila 1,681 1,691 1,733 1,768 1,786 1,795 1.07 Kalookan City 1,429 1,455 1,559 1,623 1,655 1,664 1.16 Las Pinas City 551 560 608 658 705 749 1.36 Makati City 530 541 594 646 696 732 1.38 Malabon 371 375 394 414 434 454 1.22 Mandaluyong City 314 318 337 357 375 393 1.25 Marikina City 435 440 466 492 517 541 1.24 Muntinlupa City 476 488 549 615 683 754 1.58 Navotas 248 249 253 255 257 257 1.04 Parañaque City 586 603 692 779 861 927 1.58 Pasay City 416 423 453 481 506 526 1.26 Pasig City 651 669 738 795 836 870 1.34 Pateros 63 64 67 71 74 78 1.23 Quezon City 2,837 2,919 3,319 3,701 3,987 4,190 1.48 San Juan 128 129 134 140 145 150 1.18 Taguig 651 670 755 825 876 911 1.40 Valenzuela City 595 608 678 741 787 819 1.38
Cordillera Administrative Region 1,565 1,588 1,698 1,807 1,913 2,016 1.291 Ilocos Region 4,650 4,703 4,968 5,234 5,501 5,767 1.242 Cagayan Valley 3,122 3,158 3,336 3,514 3,694 3,872 1.243 Central Luzon 10,454 10,454 11,748 13,085 14,464 15,860 1.52
Aurora 192 194 205 216 228 241 1.25Bataan 694 711 799 895 1,000 1,115 1.61Bulacan 3,022 3,125 3,658 4,200 4,752 5,298 1.75Nueva Ecija 1,913 1,944 2,094 2,234 2,359 2,480 1.30Pampanga 2,005 2,053 2,300 2,565 2,845 3,126 1.56Tarlac 1,297 1,325 1,471 1,624 1,784 1,950 1.50Zambales 511 520 567 617 670 725 1.42Angeles City 330 339 383 432 488 550 1.66Olongapo City 238 243 272 303 338 375 1.58
4A Calabarzon 12,530 12,946 15,143 17,534 19,977 22,283 1.78Batangas 2,355 2,411 2,715 3,057 3,433 3,847 1.63Cavite 3,126 3,269 4,035 4,910 5,831 6,760 2.16Laguna 2,624 2,703 3,103 3,511 3,876 4,196 1.60Quezon 1,696 1,722 1,855 1,993 2,137 2,285 1.35Rizal 2,480 2,584 3,144 3,734 4,329 4,779 1.93Lucena City 249 256 291 329 371 416 1.67
5 Bicol 5,238 5,304 5,641 5,996 6,371 6,763 1.29Source: JICA Study Team.
Philippines
Population Projection Region/Province
TABLE 10.1.1-2 POPULATION PROJECTION: LUZON

10-4
2.27
2.48
2.20
2.11
0.99
2.18
3.53
4.07
3.36
3.76
2.96
5.0
2.0
3.0
4.0
1.0
1990
1995
2000
2007
Regio
n I
V-A
2.45
Regio
n I
II
NC
RP
hili
ppin
es
FIG
UR
E 1
0.1.
1-1
PAST
PO
PUL
AT
ION
GR
OW
TH
RA
TE
: N
CR
, R
EG
ION
III
AN
D R
EG
ION
IV
-A

10-5
Figure 10.1.2-1 shows GDP growth targets adopted by the Medium Term Philippine Development Plans and the actual growth rates. Due to international economic crisis in 2008, the Philippine economy was also greatly affected and dropped to 3.8%. NEDA’s estimate for the economic growth rates for years 2009 and 2010 are as follows;
NEDA’s ESTIMATE OF GDP GROWTH RATE
2009 0.8% - 1.8%
2010 2.6% - 3.6%
NEDA does not release economic growth rates beyond 2011. The Study assumed that economic growth will be recovered by year 2012, than make sustainable economic growth at the rate of 5.0% to 6.0%. Figure 10.1.2-2 shows proposed targets of GDP growth rate and assumed growth rate to be used for the Study. For GRDP of concerned Regions, following assumptions were made; NCR: The country’s economic growth has been propelled by the economic performance of NCR. This will continue even in the future. Higher growth rate than GDP by 1 to 2% was assumed for this Region. Region III: Taking advantages of proximity to NCR, and expected growth of the Subic-Clark corridor, economy of the Region will grow higher level than GDP. Region IV-A: It is envisioned that existing Eco-zones will be expanded further and the manufacturing industry will recover the present economic crisis soon and further expanded in the future. Due to proximity to NCR, the service industry will also grow at high level. Economy of the Region will grow higher level than GDP. Region VII: As the center of Visayas Regions, logistic center to connect Luzon, Visayas and Mindanao, and the center of tourism development, the Region’s economy will grow sustainably with higher level than GDP. Region XI: As the business, commercial, agro-industrial and educational center of Mindanao, and the Philippine side core of BIMP-East Asian Growth Area, the Region’s economy envisaged to grow faster than GDP. Region XII: The Region will grow as the food supply base to the rest of the Philippines, agri-fishery production and agro-industry will grow. The Region’s economy will grow faster than GDP. GDP and GRDP growth rate projection is shown in Table 10.1.2-1. Estimated GDP and GRDPs at constant 1985 prices are shown in Table 10.1.2-2.

10-6
7.8
8.0
8.0
7
.5 7
.3
7.19
7.0
7.0
6.8
6.38
6
.3 6
.5
5.8
6.3
5
.9
5.
3 5
.45.
4
4.95
4
.54.
93
4.9
4.4
5
4.0
3
.8
3.6
3
.3
2.
6
1.
8
0.
81.
76
Rev
ised
Tar
get
M
TP
DP
199
8 -
2004
M
TP
DP
200
4 -
2010
200
92
010
200
52
006
20
0720
08
2001
200
22
003
2004
2% 1%10%
6% 5% 4% 3%9% 8% 7%
Lege
nds:
T
arg
et
Rev
ised
Tar
get
A
ctua
l Gro
wth
Rat
e
FIG
UR
E 1
0.1.
2-1
GD
P G
RO
WT
H T
AR
GE
TS
BY
MT
PDP
AN
D A
CT
UA
L G
DP
GR
OW
TH

10-7
Nex
t Med
ium
Ter
m P
erio
d (2
010
- 201
6)
6
.0
6.0
6
.0
6.0
6
.0
5.
5
5.5
5
.55.
5
5.5
5.
05.
05.
05.
05.
05.
0 4
.54.
54.
54.
54.
54.
5
3.
84.
0
3.6
3.1
2.6
1.
8
1.
3
0.8
2% 1%10%
6% 5% 4% 3%9% 8% 7%
2008
2009
2010
2011
2012
2013
2014
2015
2016
2020
2021
2025
2026
2030
Lege
nds:
Ass
umed
Tar
get
Ass
umed
Gro
wth
Rat
e fo
r the
Stu
dy
Sour
ce: S
tudy
Tea
m
FIG
UR
E 1
0.1.
2-2
PRO
POSE
D T
AR
GE
T O
F G
DP
GR
OW
TH
RA
TE

10-8
Reg
ion
2007
2008
2009
2010
2011
2012
-201
420
15-2
020
2021
-202
520
26-2
030
2030
/200
9
Phili
ppin
es1,
369
1,
421
1,
439
1,
484
1,
550
1,
795
2,
475
3,
235
4,
128
2.
87
NC
RN
atio
nal C
apita
l Reg
ion
447
467
479
502
530
640
934
1,28
0
1,71
3
3.58
IIIC
entra
l Luz
on
114
117
120
125
131
156
227
311
427
3.56
IV-A
CA
LAB
AR
ZON
16
6
17
2
17
6
18
4
19
4
23
5
35
2
49
4
67
7
3.
84
VII
Cen
tral V
isay
as98
101
103
107
113
132
188
251
328
3.18
XI
Dav
ao R
egio
n
62
64
66
68
72
86
126
172
230
3.51
XII
SOC
CSK
SAR
GEN
48
49
50
52
55
64
91
122
160
3.18
So
urce
: N
atio
nal S
tatis
tical
Coo
rdin
atio
n B
oard
.TA
BL
E 1
0.1.
2-2
EST
IMA
TE
D G
DP
AN
D G
RD
PS (2
007-
2030
)
2008
2009
2010
2011
2012
-201
420
15-2
020
2021
-202
520
26-2
030
3.8
1.3
3.1
4.5
5.0
5.5
5.5
5.0
NC
RN
atio
nal C
apita
l Reg
ion
4.5
2.5
5.0
5.5
6.5
6.5
6.5
6.0
IIIC
entra
l Luz
on
3.0
2.0
4.0
5.0
6.0
6.5
6.5
6.5
GR
DP
IV-A
CA
LAB
AR
ZON
3.
52.
54.
55.
56.
57.
07.
06.
5
VII
Cen
tral V
isay
as3.
02.
04.
05.
05.
56.
06.
05.
5
XI
Dav
ao R
egio
n
3.5
2.5
4.5
5.5
6.0
6.5
6.5
6.0
XII
SOC
CSK
SAR
GEN
3.
02.
04.
05.
05.
56.
06.
05.
5So
urce
: JIC
A St
udy
Team
.
GD
PTA
BL
E 1
0.1.
2-1
GD
P an
d G
RD
P G
RO
WT
H R
AT
E P
RO
JEC
TIO
N

10-9
10.1.3 Employment at Job Site Employment at job site was selected as an index to reflect traffic attraction/generation. Number of employment by major industrial group was used as a control total of number of employment. Number of employment obtained by the Establishment survey was adjusted to meet the said control total. Break down of number of employment was made based on the development direction of the area and land uses. Project employment at job site is shown in Table 10.1.3-1. TABLE 10.1.3-1 PROJECTED EMPLOYMENT AT JOBSITE BY REGION: LUZON
2009 2010 2015 2020 2025 2030 2030/2009PHILIPPINES 22,881 23,443 26,524 29,645 32,730 35,696 1.56 NATIONAL CAPITAL REGION 4,581 4,710 5,422 6,105 6,721 7,380 1.61
Manila 628 650 748 847 933 1,023 1.63 Kalookan (North) 78 80 87 91 94 96 1.23 Kalookan (South) 87 85 92 98 101 103 1.18 Las Pinas 64 66 76 91 107 110 1.72 Makati 1,120 1,154 1,344 1,518 1,677 1,855 1.66 Malabon 69 66 76 79 81 81 1.18 Mandaluyong 92 94 103 110 107 110 1.21 Marikina 55 57 65 73 81 88 1.61 Muntinlupa 257 268 309 354 403 456 1.78 Navotas 46 47 49 49 49 50 1.09 Paranaque 64 66 81 98 107 132 2.07 Pasay 257 264 309 354 396 434 1.69 Pasig 538 556 645 732 812 898 1.67 Pateros 23 24 24 24 25 25 1.09 Quezon 879 904 1,046 1,183 1,302 1,435 1.63 San Juan 37 38 38 39 39 40 1.10 Taguig 183 184 206 226 242 258 1.41 Valenzuela 105 108 125 140 168 184 1.75 CAR 315 318 335 352 366 377 1.20 1 ILOCOS REGION 1,095 1,110 1,173 1,239 1,295 1,341 1.23 2 CAGAYAN VALLEY 568 576 609 643 672 696 1.23 3 CENTRAL LUZON 2,640 2,734 3,205 3,708 4,187 4,689 1.78 BATAAN 227 235 263 297 327 356 1.57 BULACAN 676 705 840 975 1,105 1,243 1.84 NUEVA ECIJA 293 303 356 412 465 520 1.78 PAMPANGA 800 828 971 1,124 1,273 1,425 1.78 TARLAC 282 293 343 397 448 506 1.79 ZAMBALES 341 350 410 478 540 605 1.78 AURORA 21 19 22 26 29 33 1.55 4-A CALABARZON 3,631 3,755 4,364 5,018 5,666 6,330 1.74 BATANGAS 487 503 589 682 776 874 1.80 CAVITE 1,093 1,149 1,353 1,581 1,813 2,057 1.88 LAGUNA 1,369 1,393 1,593 1,807 2,011 2,216 1.62 RIZAL 454 473 559 652 737 823 1.81 QUEZON 229 237 271 296 329 361 1.58 5 BICOL REGION 1,058 1,067 1,121 1,178 1,226 1,263 1.19LUZON TOTAL 13,888 14,270 16,227 18,243 20,133 22,077 1.59SOURCE: JICA Study Team
Region/City/Municipality Employment Projection (thousands)

10-10
10.1.4 Per Capita GDP and GRDP
Based on the future economic growth prediction and the future population projection, per capita GDP and GRDP was estimated and summarized in Table 10.1.4-1.
TABLE 10.1.4-1 ESTIMATED PER CAPITA GDP AND GRDP (pesos at 1985 constant price)
2009 2010 2015 2020 2025 2030 2030/2009
15,614 15,780 18,262 22,043 26,729 31,949 2.05
NCR National Capital Region 40,014 41,188 51,159 65,061 84,336 108,363 2.71
Region III Central Luzon 11,457 11,915 14,055 17,370 21,530 26,902 2.35
Region IV-A CALABARZON 14,061 14,222 16,502 20,082 24,722 30,366 2.16
Region VII Central Visayas 15,602 15,983 19,258 24,075 30,078 36,850 2.36
Region XI Davao Region 15,226 15,638 19,137 24,284 30,898 38,544 2.53
Region XII SOCCSKSARGEN 12,499 12,696 14,710 17,675 21,146 24,867 1.99SOURCE: JICA Study Team
Philippines
Region/ProvinceGDP/GRDP Projection
10.2 REGIONAL DEVELOPMENT SCENARIO 10.2.1 Trends and Directions of Regional Comprehensive Development
The preceding sections have provided the outlook for the regional development of the three regions that comprise the study area in Luzon. The direction of study area’s development still follows the cluster development and integrative approach, which is aimed towards decongesting Metro Manila and enhancing the promotion and encouragement of development in the adjacent regions of the metropolis. As already mentioned previously, the necessary infrastructure support is needed to ensure the regional development of the regions covered in the study area. This is notably true in the provision of an appropriate transport system that will complete the intermodal logistics network system in support of the development of the study area. For this end, there is a need for a comprehensive planning, notably in the provision of the necessary infrastructure support such as strategic infrastructure. Notable of these strategic infrastructure facilities are the following:
Transport infrastructure (highway systems and facilities) Power supply Communication systems Water supply Housing
The provision of the above strategic infrastructure is essential in ensuring urban competitiveness, poverty alleviation that will not only facilitate economic growth but also stimulate it for the study area and the country in general. Furthermore, the direction of regional development is towards the development and strengthening of local comparative advantages in order to contribute in significantly improving the quality of life of the residents in the study area. Moreover, at the macro level this will also be a factor for national economic development. In summary, the outlook of the regional development of the study area supports the clustering development approach that is consistent with the economic framework defined earlier that is anchored on the following: a) urban development, b) industrial development, c) agricultural

10-11
development and d) tourism development. As defined, the economic framework is characterized by the geographical pattern and resources of the regions covered by the study area. Finally, a key factor in here is the strong involvement of the private sector not only in regional development, but also in the provision of infrastructure facilities, particularly in highway development.
10.2.2 Regional Development Scenario
National development policies as expressed in the 10-point Agenda in relation to regional development are as follows:
NATIONAL DEVELOPMENT POLICIES
Due to economic growth in the capital regions, economic sphere is expanding from Metro Manila towards its neighboring regions of Region III and Region IV-A. Thus, the development strategy cannot be planned only for Metro Manila but involving Region III and Region IV-A as a whole. Overall development strategy will be as follows;
1) Study Area as a whole
● Metro Manila together with Region III and Region IV-A will continue to propel the country’s
economy.
● To promote decentralization and to mitigate overconcentration of Metro Manila, regional urban centers outside Metro Manila will be developed. (see Figure 10.2.2-1)
● Strategic areas along the Pacific coast shall be designated as the core development areas for
universal development and accessibility to those areas shall be strengthened. (see Figure 10.2.2-2)
● In order to support tourism development, the tourism development axes will be developed for
the strategic areas of tourism development. (see Figure 10.2.2-1)
2) Metro Manila and its suburbs ● Due to accumulation of infrastructure of expressways, international airports and ports and
economic zones along the north-south direction, the north-south industrial development beltway which connects Batangas-Metro Manila-Clark-Tarlac will be the key axis for the development of the Metropolitan areas and the country as a whole. (see Figure 10.2.2-3)
● Sound urbanization of Metro Manila and its suburbs will be achieved. (see Figure 10.2.2-1)
3) North of Metro Manila
● Clark-Subic corridor will be developed as a logistic axis not only for the country but also for
the southeast and ASEAN countries. (see Figure 10.2.2-3) ● To support the development of CAR and Region I, the North-West Luzon development axis
will be developed. (see Figure 10.2.2-3)
• Promotion of decentralization through infrastructure development. • To decongest Metro Manila. • To develop Clark and Subic corridor as international logistics center.

10-12
● For the development of Region II, the North-East Luzon development axis will be developed. (see Figure 10.2.2-3)
4) South of Metro Manila
● To support the development of Region V, the South-Luzon development axis will be
developed. (see Figure 10.2.2-3)
FIGURE 10.2.2-1 URBAN DEVELOPMENT STRUCTURE

10-13
FIGURE 10.2.2-2 AGRICULTURE AND TOURISM DEVELOPMENT
AND PACIFIC COAST DEVELOPMENT

10-14
FIGURE 10.2.2-3 DEVELOPMENT AXES

10-15
Overall regional development strategy is shown in Figure 10.2.2-4.
FIGURE 10.2.2-4 DEVELOPMENT STRATEGY: 200KM RADIUS SPHERE
OF METRO MANILA

CHAPTER 11
FUTURE TRAFFIC DEMAND FORECAST

11-1
CHAPTER 11 FUTURE DEMAND FORECAST
11.1 ANALYSES OF TRAFFIC SURVEY RESULTS
This Section describes the OD Survey results. Other traffic survey results were discussed in Chapter 8.
11.1.1 Traffic Characteristics
(1) General
Roadside OD survey was conducted at twenty-one (21) stations. A number of samples and sample rate is shown in Table 11.1-1.
TABLE 11.1-1 ROADSIDE OD SURVEY STATION AND SAMPLE RATE No. Station No. of
Sample AADT Sample Rate
1 Manila North Road Sison, Pang. & Rosario, LU 2438 9179 26.6%
2 Maharlika Highway San Jose & Carranglan 1765 4252 41.5%
3 Camiling Road Camiling, Tarlac & Mangatarem 1457 2532 57.5%
4 Tarlac-LaPaz-Sta. Rosa Tarlac City & SCTEx 1965 5649 34.8%
5 Manila North Road Capas & Tarlac City 1742 16837 10.3%
6 NLEx-Dau Exit, National Highway After NLEx Dau Exit 2350 9584 24.5%
7 Olongapo-Gapan Road San Fernando & Bacoor 3033 20713 14.6%
8 Olongapo-Gapan Road Before Tipo-Subic gate 1169 6039 19.4%
9 Roman Highway After junction to Hermosa 1606 7194 22.3%
10 Maharlika Highway After Sta. Rita Exit to Plaridel 1508 17214 8.8%
11 McArthur Highway Malolos & Balagtas 1776 16785 10.6%
12 SJDM-Norzagaray Road SJDM & Norzagaray 1876 6603 28.4%
13 Tanay-Famy Road Rizal-Laguna Provinces 1074 2393 44.9%
14 Noveleta-Rosario-Naic Road Noveleta & Rosario towns 1156 15380 7.5%
15 Aguinaldo Highway Imus & Dasmariñas towns 1199 26621 4.5%
16 Carmona-Trece Martires Road Carmona & GMA towns 896 11974 6.4%
17 Sta. Rosa-Tagaytay Road After Paseo Sta. Rosa Complex 1391 14919 9.3%
18 SLEx exit, Calamba After Calamba Ex. Sto. Tomas 1328 41085 3.2%
19 Maharlika Highway Sariaya-Lucena City 722 13449 5.4%
20 Lipa-Cuenca-San Jose Road Cuenca & San Jose towns 803 9592 8.4%
21 STAR Access Road Star exit to Batangas City 801 12010 6.7%
Average 1526 12953 11.8%

11-2
(2) Traffic by Trip Purpose
Trip purpose is estimated through the OD data as illustrated in Figure 11.1.1-1. Of the total car trips 37% were ‘Business’ trips, 23% were ‘Private’ trips, 21% were ‘To/From Work’ trips.
Business37%
Others12%
Leisure/Tourism6%
Private23%
To/From School1%
To/From Work21%
FIGURE 11.1.1-1 TRIP PURPOSE
(3) Average Number of Passengers by Vehicle Category
Vehicle OD is linked to passenger OD through the average number of passenger on board by type of vehicles as the vehicle occupancy rate. Table 11.1.1-2 shows the average number of passenger on board by type of vehicles. The survey results of 3.5 passengers for Car and 9.3 passengers for Jeepney, 30.8 passengers for Bus are used in this study (see Table 11.1.2-3).
TABLE 11.1.1-3 AVERAGE NUMBER OF PASSENGERS ON BOARD BY VEHICLE CATEGORY
Vehicle Category Type of Vehicles Average No. of Passengers(Person / veh.)
Passenger Car Car/Taxi/Van 3.5 Jeepney Jeepney 9.3
Bus Mini-Bus, Large-Bus 30.8
Truck 2-Axle Truck, 3-Axle Truck, Truck-Trailer, Delivery Van 2.6
(4) Traffic Type of Commodity
Three representative commodity items were selected in this study. They are Agri./ Fishery / Forestry Sectors, Mining/Construction Sectors, and Manufacturing Sectors. Others commodities not included in the first two categories are considered to include in the third. The results of total commodity volume by road, which are summarized in Table11.1.1-4.

11-3
TABLE 11.1.1-2 AVERAGE NUMBER OF PASSENGERS BY VEHICLE CATEGORY AND BY ROAD
(Person/vehicle, including Driver)
Station Car/ Taxi/ Van
Jeepney Mini-bus
Large Bus
2-Axle Truck
3-Axle Truck
Truck- Trailer
Delivery Van
1. Manila North Rd Sison, Pang. & Rosario, LU
4.6 6.6 18.0 26.8 3.1 2.5 2.5 2.9
2. Maharlika Highway San Jose & Carranglan 4.6 13.0 13.0 41.5 3.3 2.8 2.5 2.6
3. Camiling Road Camiling, Tarlac &
Mangatarem 4.1 9.3 2.0 20.3 3.3 2.7 2.0 2.4
4. Tarlac-La Paz-Sta Rosa Tarlac City & SCTEX 3.2 10.8 11.3 38.3 3.0 2.5 2.4 2.5
5. Manila North Rd Capas & Tarlac City 3.2 7.3 14.1 39.6 2.6 2.4 2.3 2.5
6. NLEX-Dau Exit, Nat’l Hwy After NLEX Dau Exit 3.2 18.5 12.7 35.9 2.6 2.4 2.3 2.4
7. Olongapo-Gapan Road San Fernando & Bacoor 2.9 7.6 16.2 28.8 2.7 2.2 2.5 2.4
8. Olongapo-Gapan Road Before Tipo-Subic gate 3.5 6.7 16.2 31.1 2.5 2.2 2.8 2.7
9. Roman Hwy After junction to Hermosa 3.2 6.8 30.0 19.1 2.9 2.1 2.1 2.5
10. Maharlika Highway After Sta Rita Exit to Plaridel 2.9 6.5 2.0 47.0 2.6 2.7 2.5 2.4
11. McArthur Highway Malolos & Balagtas 2.5 7.0 5.7 31.5 2.4 2.4 2.5 2.3
12.SJDM-Norzagaray Road SJDM & Norzagaray 2.9 8.6 16.2 22.1 2.5 2.4 2.7 2.6
13.Tanay-Famy Road Rizal-Laguna Provinces 5.1 19.7 21.5 54.1 3.4 2.8 2.3 2.7
14.Noveleta-Rosario-Naic Rd. Noveleta & Rosario towns 3.2 8.3 17.7 29.9 2.5 2.4 2.4 2.5
15.Aguinaldo Highway Imus & Dasmarinas towns 3.7 8.9 14.5 30.9 2.7 4.5 2.5 2.6
16.Carmona-Trece Martires Rd Carmona & GMA towns 3.1 9.6 16.2 39.8 2.3 2.3 2.7 2.4
17.Sta. Rosa-Tagaytay Road After Paseo Sta Rosa Cmplx. 3.0 12.7 16.5 25.0 2.8 2.3 2.7 2.4
18.SLEX exit, Calamba After Calamba Ex. Sto.
Tomas 3.9 12.0 25.4 37.1 2.5 2.7 3.1 2.6
19.Maharlika Highway Sariaya-Lucena City 3.6 8.7 18.0 29.9 2.6 2.8 2.6 2.5
20.Lipa-Cuenca-San Jose Rd Cuenca & San Jose towns 2.8 8.4 21.0 39.8 2.8 2.5 2.7 2.4
21.STAR access road Star exit to Batangas City 2.7 6.1 6.4 20.9 2.5 2.3 2.1 2.4
Average 3.5 9.3 16.2 31.5 2.8 2.4 2.5 2.5

11-4
TABLE 11.1.1-4 TRAFFIC BY COMMODITY TYPE BY ROAD
(ton/day)
Station Agri./
Fishery / Forestry
Mining/ Construction Manufacturing Total
1. Manila North Rd Sison, Pang. & Rosario, LU 1,418.7 331.7 250.5 2,001.0
2. Maharlika Highway San Jose & Carranglan 1,871.6 - 116.9 1,988.5
3. Camiling Road Camiling, Tarlac & Mangatarem 173.9 41.8 38.9 254.6
4. Tarlac-La Paz-Sta Rosa Tarlac City & SCTEX 193.4 198.0 232.8 624.2
5. Manila North Rd Capas & Tarlac City 517.2 312.2 133.7 963.1
6. NLEX-Dau Exit, Nat’l Hwy After NLEX Dau Exit 98.1 339.3 344.7 782.1
7. Olongapo-Gapan Road San Fernando & Bacoor 785.9 2,621.4 738.7 4,146.0
8. Olongapo-Gapan Road Before Tipo-Subic gate 114.5 208.9 345.3 668.7
9. Roman Hwy After junction to Hermosa 388.1 949.8 701.2 2,039.1
10. Maharlika Highway After Sta Rita Exit to Plaridel 524.6 47.4 391.4 963.4
11. McArthur Highway Malolos & Balagtas 5,146.9 2,699.6 1,937.2 9,783.6
12. SJDM-Norzagaray Road SJDM & Norzagaray 26.6 1,794.2 184.5 2,005.3
13. Tanay-Famy Road Rizal-Laguna Provinces 59.1 316.6 16.7 392.3
14. Noveleta-Rosario-Naic Rd. Noveleta & Rosario towns 249.3 370.0 112.5 731.7
15. Aguinaldo Highway Imus & Dasmarinas towns 542.6 247.7 517.3 1,307.5
16. Carmona-Trece Martires Rd Carmona & GMA towns 636.4 37.5 420.0 1,093.9
17. Sta. Rosa-Tagaytay Road After Paseo Sta Rosa Cmplx. 240.8 1,013.5 575.2 1,829.5
18. SLEX exit, Calamba After Calamba Ex. Sto. Tomas 1,251.1 3,283.9 2,229.2 6,764.2
19. Maharlika Highway Sariaya-Lucena City 1,137.2 600.0 324.3 2,061.5
20. Lipa-Cuenca-San Jose Rd Cuenca & San Jose towns 874.1 1,181.0 2,567.5 4,622.6
21. STAR access road Star exit to Batangas City 2,126.2 115.6 615.7 2,857.4
Total 18,376.1 16,710.0 12,794.2 47,880.3 Share (%) 38.4% 34.9% 26.7% 100.0%

11-5
(5) Average Loading by Type of Truck
Vehicle OD is linked to commodity OD through the average weight loaded by type of truck. Table 1.1.1-5 shows the average weight loaded by type of truck.
TABLE 11.1.1-5 AVERAGE LOADING BY TYPE OF TRUCK
(unit;kg) Agri./
Fishery / Forestry
Mining/ Construction Manufacturing
Gross Average
Loading*
Net Average Loading**
2-AXLE TRUCK 5,840 5,060 3,589 4,917 2,401 3-AXLE TRUCK 14,069 13,990 11,509 13,323 6,943
TRUCK-TRAILER 16,067 18,197 11,911 15,663 8,294
DELIVERY VAN 3,370 2,960 1,760 2,573 1,559 Weighted Mean
TRUCK 7,667 10,694 5,033 7,413 4,008
* Empty trucks are excluded. ** Empty trucks are included.
The average loaded volume by 2-AXLE TRUCK is 2.4 tons, by 3-AXLE TRUCK 6.9 tons, by Trailer 8.2 tons and by Delivery Van 1.6 tons. The survey results, 4.0 tons for truck, are used in this report.
11.1.2 Present OD Table
(1) Procedure of Estimating the Present OD Tables
(a) The maximum entropy method was applied to obtain the OD tables of aggregated 4 vehicle
types. For the application of the maximum entropy method, it is necessary to utilize the traffic volumes by type of vehicle crossing the zones of the network.
(b) The traffic volumes crossing zone border were obtained from the traffic counting survey results
and supplemented by DPWH survey records.
(c) Under the process described above, the maximum entropy method was applied and the OD tables by vehicle category (Car, Jeepney, Bus and Truck) were produced. All Vehicle OD, Passenger car (including Jeepney and Bus) OD and Truck OD (large zone) are shown in Tables 11.1.2-1, 11.1.2-2 and 11.1.2-3.
(d) The average vehicle passenger occupancy rates and loading rates by commodity category
obtained from the roadside interview survey were then applied to each OD pair by vehicle classification, and the passengers and commodity for the OD pairs were obtained.
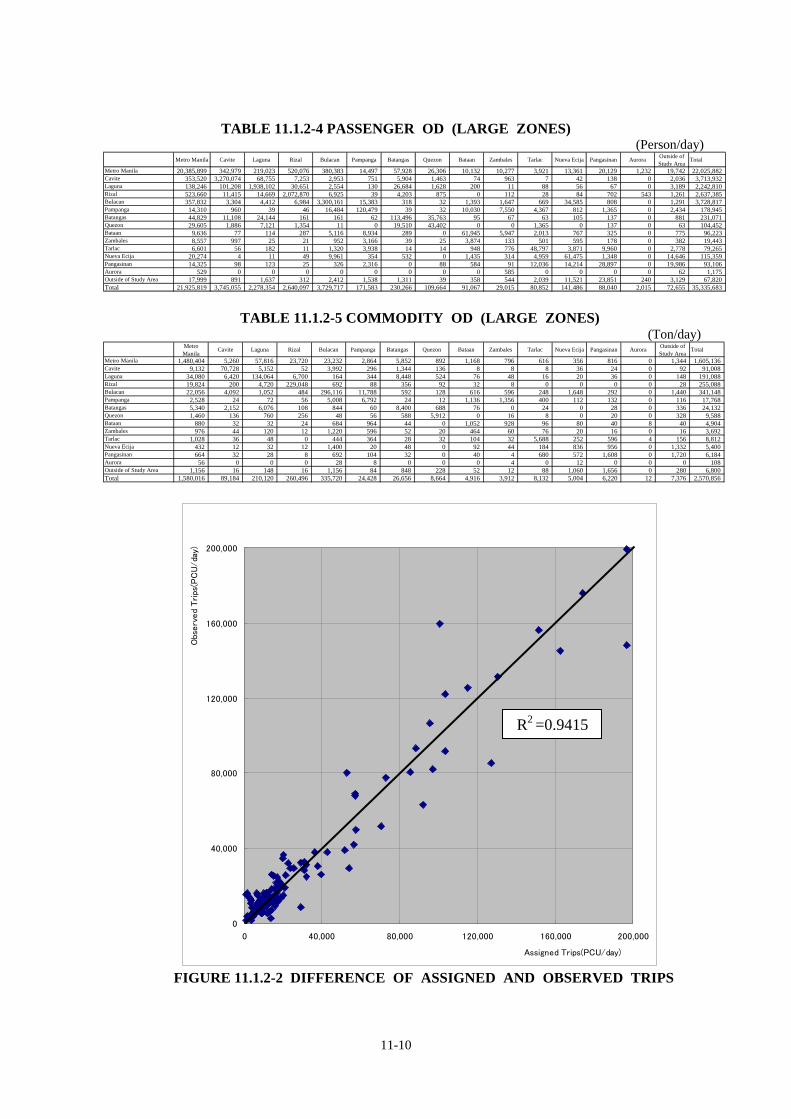
(e) Passenger OD of large zoning is shown in Table 11.1.2-4 and total commodity trips in Table
11.1.2-5.
(f) For the examination of the accuracy of OD tables, the established All vehicle OD was assigned on the present road network. Figure 11.1.2-1 shows the traffic volumes which resulted through traffic assignment procedure of the OD tables in the road network. The differences between surveyed traffic volumes and assigned volumes are presented in Figures 11.1.2-2. The assigned volumes in this manner show good consistency to the observed traffic.

11-6
(2) OD Tables and Traffic Flow
The concluded OD trips are presented in tables and the corresponding traffic flow is shown in figures. All of OD tables were obtained on small zoning base, and aggregated to large zoning base. Traffic zoning system is shown in Table 11.2.1-1. ODs trips presented in the report are those of All vehicles, Passenger Car, Truck and each of them is assigned graphically on the road network as traffic flow.
TABLE 11.1.2-1 ALL VEHICLES OD (LARGE ZONES) (Vehicle)
Metro Manila
Cavite Laguna Rizal Bulacan Pampanga Batangas Quezon Bataan Zambales Tarlac Nueva Ecija Pangasinan Aurora Outside of Study Area
Total
Metro Manila 3,236,908 53,738 62,265 87,708 51,167 2,479 8,345 2,357 1,256 1,291 814 1,542 1,548 352 2,792 3,514,562Cavite 57,966 400,538 12,428 666 1,590 140 1,199 452 23 51 4 21 22 0 315 475,415Laguna 38,890 17,094 301,024 6,718 754 123 5,670 596 76 15 29 21 28 0 494 371,532Rizal 87,686 1,487 4,226 328,458 1,442 33 314 273 8 19 3 24 88 155 190 424,406Bulacan 46,617 1,668 1,514 1,531 491,407 7,231 219 41 514 580 253 5,171 296 0 621 557,663Pampanga 2,342 136 29 27 5,467 24,750 17 12 1,523 1,667 1,019 260 203 0 390 37,842Batangas 6,182 2,219 5,531 73 257 26 19,184 3,407 46 19 24 30 46 0 328 37,372Quezon 2,551 385 1,185 443 15 14 2,549 9,786 0 4 392 0 44 0 100 17,468Bataan 1,238 30 25 49 819 1,595 82 0 12,686 1,289 599 200 93 2 161 18,868Zambales 1,022 54 37 9 538 698 24 12 753 43 162 136 47 0 82 3,617Tarlac 1,021 20 64 3 488 985 11 12 250 222 9,681 672 1,909 1 466 15,805Nueva Ecija 2,390 4 11 17 3,196 106 164 0 238 85 1,066 11,599 624 0 2,051 21,551Pangasinan 1,366 36 42 9 266 490 8 25 109 27 2,300 3,685 6,053 0 2,313 16,729Aurora 165 0 0 0 7 2 0 0 0 168 0 3 0 0 2 347Outside of Study Area 2,589 159 298 93 978 307 464 68 53 135 351 1,786 2,640 14 314 10,249Total 3,488,933 477,568 388,679 425,804 558,391 38,979 38,250 17,041 17,535 5,615 16,697 25,150 13,641 524 10,619 5,523,426
TABLE 11.1.2-2 PASSENGER CAR (INCLUDING JEEPNEY & BUS) OD (LARGE ZONES)
(Vehicle) Metro Manila
Cavite Laguna Rizal Bulacan Pampanga Batangas Quezon Bataan Zambales Tarlac Nueva Ecija Pangasinan Aurora Outside of Study Area
Total
Metro Manila 2,866,807 52,423 47,811 81,778 45,359 1,763 6,882 2,134 964 1,092 660 1,453 1,344 352 2,456 3,113,278Cavite 55,683 382,856 11,140 653 592 66 863 418 21 49 2 12 16 0 292 452,663Laguna 30,370 15,489 267,508 5,043 713 37 3,558 465 57 3 25 16 19 0 457 323,760Rizal 82,730 1,437 3,046 271,196 1,269 11 225 250 0 17 3 24 88 155 183 360,634Bulacan 41,103 645 1,251 1,410 417,378 4,284 71 9 360 431 191 4,759 223 0 261 472,376Pampanga 1,710 130 11 13 4,215 23,052 11 9 1,239 1,328 919 232 170 0 361 33,400Batangas 4,847 1,681 4,012 46 46 11 17,084 3,235 27 19 18 30 39 0 244 31,339Quezon 2,186 351 995 379 3 0 2,402 8,308 0 0 390 0 39 0 18 15,071Bataan 1,018 22 17 43 648 1,354 71 0 12,423 1,057 575 180 83 0 151 17,642Zambales 778 43 7 6 233 549 11 7 637 28 143 131 43 0 78 2,694Tarlac 764 11 52 3 377 894 4 4 224 214 8,259 609 1,760 0 427 13,602Nueva Ecija 2,282 1 3 14 2,846 101 152 0 215 74 1,020 11,390 385 0 1,718 20,201Pangasinan 1,200 28 35 7 93 464 0 25 99 26 2,130 3,542 5,651 0 1,883 15,183Aurora 151 0 0 0 0 0 0 0 0 167 0 0 0 0 2 320Outside of Study Area 2,300 155 261 89 689 286 252 11 40 132 329 1,521 2,226 14 244 8,549Total 3,093,929 455,272 336,149 360,680 474,461 32,872 31,586 14,875 16,306 4,637 14,664 23,899 12,086 521 8,775 4,880,712
TABLE 11.1.2-3 TRUCK OD (LARGE ZONES) (Vehicle)
Metro Manila
Cavite Laguna Rizal Bulacan Pampanga Batangas Quezon Bataan Zambales Tarlac Nueva Ecija Pangasinan Aurora Outside of Study Area
Total
Metro Manila 370,101 1,315 14,454 5,930 5,808 716 1,463 223 292 199 154 89 204 0 336 401,284Cavite 2,283 17,682 1,288 13 998 74 336 34 2 2 2 9 6 0 23 22,752Laguna 8,520 1,605 33,516 1,675 41 86 2,112 131 19 12 4 5 9 0 37 47,772Rizal 4,956 50 1,180 57,262 173 22 89 23 8 2 0 0 0 0 7 63,772Bulacan 5,514 1,023 263 121 74,029 2,947 148 32 154 149 62 412 73 0 360 85,287Pampanga 632 6 18 14 1,252 1,698 6 3 284 339 100 28 33 0 29 4,442Batangas 1,335 538 1,519 27 211 15 2,100 172 19 0 6 0 7 0 84 6,033Quezon 365 34 190 64 12 14 147 1,478 0 4 2 0 5 0 82 2,397Bataan 220 8 8 6 171 241 11 0 263 232 24 20 10 2 10 1,226Zambales 244 11 30 3 305 149 13 5 116 15 19 5 4 0 4 923Tarlac 257 9 12 0 111 91 7 8 26 8 1,422 63 149 1 39 2,203Nueva Ecija 108 3 8 3 350 5 12 0 23 11 46 209 239 0 333 1,350Pangasinan 166 8 7 2 173 26 8 0 10 1 170 143 402 0 430 1,546Aurora 14 0 0 0 7 2 0 0 0 1 0 3 0 0 0 27Outside of Study Area 289 4 37 4 289 21 212 57 13 3 22 265 414 0 70 1,700Total 395,004 22,296 52,530 65,124 83,930 6,107 6,664 2,166 1,229 978 2,033 1,251 1,555 3 1,844 642,714

11-7
FIGURE 11.1.2-1 (1/3) PRESENT TRAFFIC FLOW: NORTH OF METRO MANILA (YEAR 2009)
11-8
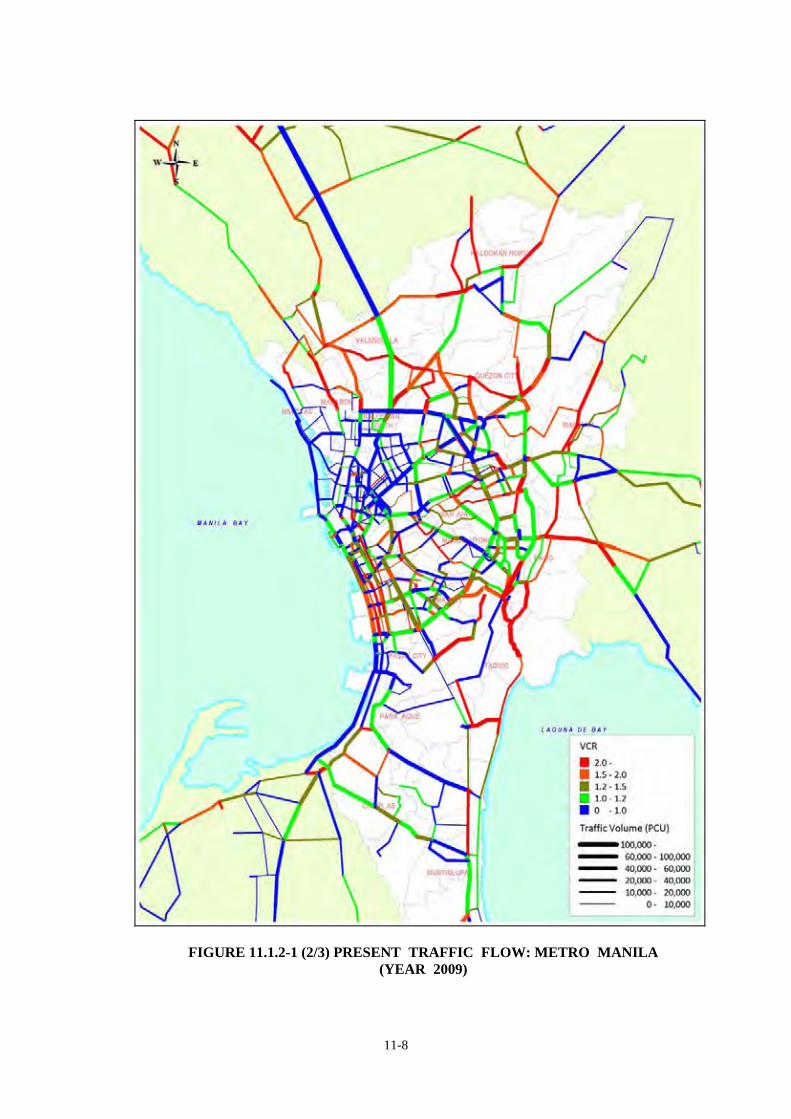
FIGURE 11.1.2-1 (2/3) PRESENT TRAFFIC FLOW: METRO MANILA (YEAR 2009)

11-9
FIGURE 11.1.2-1 (3/3) PRESENT TRAFFIC FLOW: SOUTH OF METRO MANILA (YEAR 2009)
11-10
TABLE 11.1.2-4 PASSENGER OD (LARGE ZONES) (Person/day)
Metro Manila Cavite Laguna Rizal Bulacan Pampanga Batangas Quezon Bataan Zambales Tarlac Nueva Ecija Pangasinan Aurora Outside of Study Area
Total
Metro Manila 20,385,899 342,979 219,023 520,076 380,383 14,497 57,928 26,306 10,132 10,277 3,921 13,361 20,129 1,232 19,742 22,025,882Cavite 353,520 3,270,074 68,755 7,253 2,953 751 5,904 1,463 74 963 7 42 138 0 2,036 3,713,932Laguna 138,246 101,208 1,938,102 30,651 2,554 130 26,684 1,628 200 11 88 56 67 0 3,189 2,242,810Rizal 523,660 11,415 14,669 2,072,870 6,925 39 4,203 875 0 112 28 84 702 543 1,261 2,637,385Bulacan 357,832 3,304 4,412 6,984 3,300,161 15,383 318 32 1,393 1,647 669 34,585 808 0 1,291 3,728,817Pampanga 14,310 960 39 46 16,484 120,479 39 32 10,030 7,550 4,367 812 1,365 0 2,434 178,945Batangas 44,829 11,108 24,144 161 161 62 113,496 35,763 95 67 63 105 137 0 881 231,071Quezon 29,605 1,886 7,121 1,354 11 0 19,510 43,402 0 0 1,365 0 137 0 63 104,452Bataan 9,636 77 114 287 5,116 8,934 289 0 61,945 5,947 2,013 767 325 0 775 96,223Zambales 8,557 997 25 21 952 3,166 39 25 3,874 133 501 595 178 0 382 19,443Tarlac 6,601 56 182 11 1,320 3,938 14 14 948 776 48,797 3,871 9,960 0 2,778 79,265Nueva Ecija 20,274 4 11 49 9,961 354 532 0 1,435 314 4,959 61,475 1,348 0 14,646 115,359Pangasinan 14,325 98 123 25 326 2,316 0 88 584 91 12,036 14,214 28,897 0 19,986 93,106Aurora 529 0 0 0 0 0 0 0 0 585 0 0 0 0 62 1,175Outside of Study Area 17,999 891 1,637 312 2,412 1,538 1,311 39 358 544 2,039 11,521 23,851 240 3,129 67,820Total 21,925,819 3,745,055 2,278,354 2,640,097 3,729,717 171,583 230,266 109,664 91,067 29,015 80,852 141,486 88,040 2,015 72,655 35,335,683
TABLE 11.1.2-5 COMMODITY OD (LARGE ZONES)
(Ton/day) Metro Manila
Cavite Laguna Rizal Bulacan Pampanga Batangas Quezon Bataan Zambales Tarlac Nueva Ecija Pangasinan Aurora Outside of Study Area
Total
Metro Manila 1,480,404 5,260 57,816 23,720 23,232 2,864 5,852 892 1,168 796 616 356 816 0 1,344 1,605,136Cavite 9,132 70,728 5,152 52 3,992 296 1,344 136 8 8 8 36 24 0 92 91,008Laguna 34,080 6,420 134,064 6,700 164 344 8,448 524 76 48 16 20 36 0 148 191,088Rizal 19,824 200 4,720 229,048 692 88 356 92 32 8 0 0 0 0 28 255,088Bulacan 22,056 4,092 1,052 484 296,116 11,788 592 128 616 596 248 1,648 292 0 1,440 341,148Pampanga 2,528 24 72 56 5,008 6,792 24 12 1,136 1,356 400 112 132 0 116 17,768Batangas 5,340 2,152 6,076 108 844 60 8,400 688 76 0 24 0 28 0 336 24,132Quezon 1,460 136 760 256 48 56 588 5,912 0 16 8 0 20 0 328 9,588Bataan 880 32 32 24 684 964 44 0 1,052 928 96 80 40 8 40 4,904Zambales 976 44 120 12 1,220 596 52 20 464 60 76 20 16 0 16 3,692Tarlac 1,028 36 48 0 444 364 28 32 104 32 5,688 252 596 4 156 8,812Nueva Ecija 432 12 32 12 1,400 20 48 0 92 44 184 836 956 0 1,332 5,400Pangasinan 664 32 28 8 692 104 32 0 40 4 680 572 1,608 0 1,720 6,184Aurora 56 0 0 0 28 8 0 0 0 4 0 12 0 0 0 108Outside of Study Area 1,156 16 148 16 1,156 84 848 228 52 12 88 1,060 1,656 0 280 6,800Total 1,580,016 89,184 210,120 260,496 335,720 24,428 26,656 8,664 4,916 3,912 8,132 5,004 6,220 12 7,376 2,570,856
FIGURE 11.1.2-2 DIFFERENCE OF ASSIGNED AND OBSERVED TRIPS
R2 = 0.9415
0
40,000
80,000
120,000
160,000
200,000
0 40,000 80,000 120,000 160,000 200,000
Assigned Trips(PCU/day)
Obs
erv
ed
Tri
ps(P
CU
/da
y)
R2 =0.9415
11-11
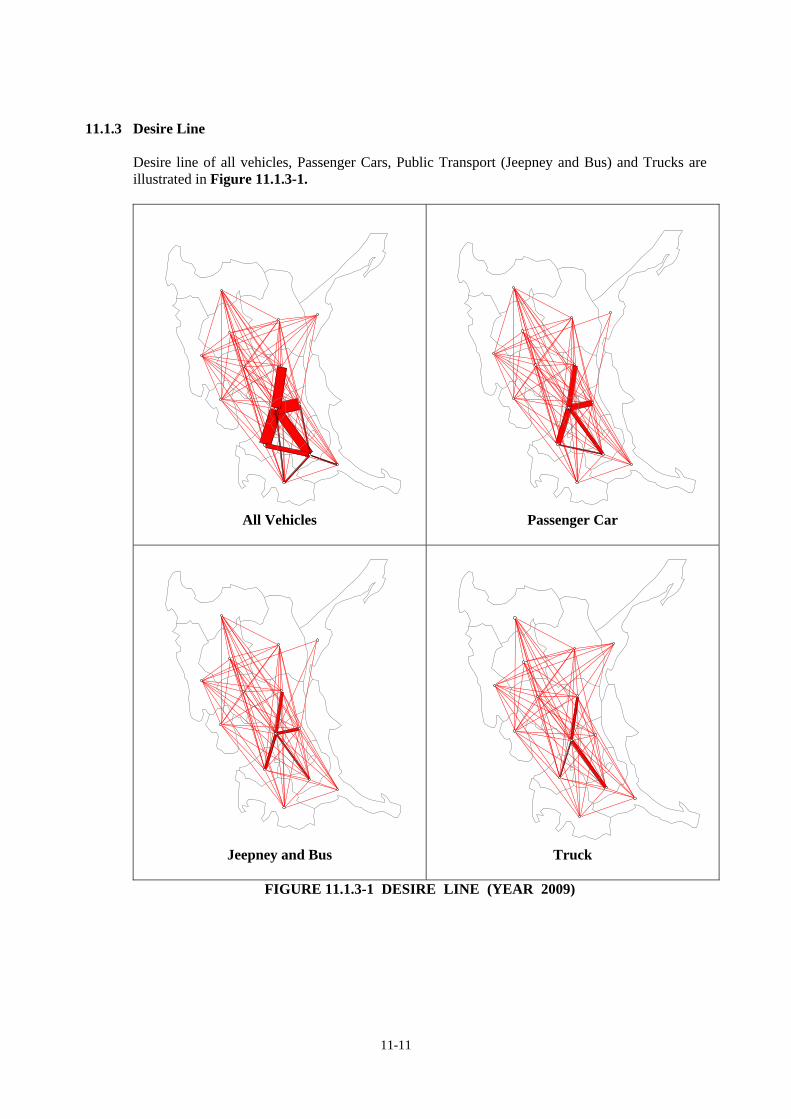
11.1.3 Desire Line
Desire line of all vehicles, Passenger Cars, Public Transport (Jeepney and Bus) and Trucks are illustrated in Figure 11.1.3-1.
All Vehicles
Passenger Car
Jeepney and Bus
Truck
FIGURE 11.1.3-1 DESIRE LINE (YEAR 2009)

11-12
11.2 TRAFFIC DEMAND FORECAST 11.2.1 Approach
(1) Four Step Approach
Traffic demand forecast was carried out using four steps estimation procedure as shown in Figure 11.2-1.
Trip Generation and Attraction – the prediction of trips produced and attracted to each zone; Trip Distribution – the prediction of origin-destination flows, the linking of trip ends
predicted by trip generation; Modal Split – the estimation of percentages of trip flows made by each transportation mode
in the model; and Traffic Assignment – the allocation of trips to routes in the road network.
FIGURE 11.2-1 TRAFFIC DEMAND FORECAST PROCEDURE
Legend: : Data Input (Requirement for Input) : Calculation Model : Output
Step
1:
Gen
erat
ion
& A
ttrac
tion
Step
2:
Dis
tribu
tion
Step
3:
Mod
al S
plit
Step
4:
Traf
fic
Ass
ignm
ent
Present Socio -Economic Indicators
by zone
Present OD Matrix
Future Socio -Economic Indicators
by zone
Future Road Network
Generation and Attraction Model
Distribution Model
Modal Split Model
• No. of Average Passengers • No. of Average Cargo Volume
Traffic Assignment Model
Forecast of Scale of Generation & Attraction by Zone
(No. of passengers &Carge Volume)
Traffic Volume Distribution Forecast
Modal Split Traffic Volume Forecast
Traffic Assignment Forecast(No. of Vehicles by Vehicle Type)

11-13
(2) Zone System in the Study Area The model predicts trips over the road network based on the attributes of traffic analysis zones (TAZ). Zonal Attributes used in trip generation including population and employment. A key component of the model development process was the development of zone system to cover the Study Area. The study area is defined from zone 1 to 283 (Metro Manila (1~ 94), other area (98 ~ 283)) in traffic zoning system, and outside the study area is defined from zone, 284 and 319 and Manila port is defined as zone 320. (See Table 11.2.1-1 and Figure 11.2.1-2, 11.2.1-3).
(3) Modeling and Forecasting tolls In all steps of travel model calibrations and demand forecast, JICA STRADA system and EXCEL spread sheet are employed. JICA STRADA is a software tool for the planning, managing, and analyzing of transportation systems. The software provides a set of tools for traffic demand modeling as well as capabilities for presentation graphics and transportation models. JICA STRADA system applied for simulation of travel time and cost. Modeling and forecasting in trip generation, trip distribution and traffic assignment is computed by JICA STRADA system. For better efficiency, modal split steps is calculated by using Excel spread sheet.

11-14
TABLE 11.2.1-1 (1) TRAFFIC ZONING SYSTEM Small Zone Barangay Medium
Zone City/Municipality Large Zone Province Region
1 City of Manila 1 - Barangay 202 City of Manila 2 - Barangay 1053 City of Manila 3 - Barangay 3754 City of Manila 4 - Barangay 485 City of Manila 5 - San Nicolas6 City of Manila 6 - Binondo7 City of Manila 7 - Barangay 3108 City of Manila 8 - Quiapo9 City of Manila 9 - Barangay 413
10 City of Manila 10 - San Miguel11 City of Manila 11 - Barangay 57012 City of Manila 12 - Barangay 45013 City of Manila 13 - Port Area14 City of Manila 14 - Intramuros, Ermita15 City of Manila 15 - Paco16 City of Manila 16 - Malate17 City of Manila 17 - Santa Ana18 City of Manila 18 - Barangay 60119 City of Manila 19 - Pandacan20 Pasay City 1 - Barangay 4621 Pasay City 2 - Barangay 13222 Pasay City 3 - Barangay 18324 Pasay City 4 - Barangay 182 Pasay City 5 - Barangay 76 23 Parañaque City 1 - Don Bosco25 Paranaque City 2 - Baclaran84 Parañaque City 2 - Sun Valley, San Martin De Porre85 Parañaque City 3 - Marcelo Green Village 86 Parañaque City 4 - B.F. Homes92 Parañaque City 5 - San Isidro93 Parañaque City 6 - San Dionisio26 Makati City 1 - Bangkal, San Lorenzo27 Makati City 2 - Palanan28 Makati City 3 - Olympia29 Makati City 4 - Guadalupe Viejo30 Makati City 5 - Bel-Air31 Makati City 6 - Rizal, Pembo34 Makati City 7 - Magallanes32 Santa Ana Pateros33 Taguig 1 - Western Bicutan81 Taguig 2 - Upper Bicutan83 Taguig 3 - Signal Village, Lower Bicutan35 Mandaluyong City 1 - Poblacion36 Mandaluyong City 2 - Plainview37 Mandaluyong City 3 - Mauway39 Mandaluyong City 4 - Wack-wack Greenhills40 San Juan 1 - West Crame41 San Juan 2 - Corazon de Jesus38 Pasig City 1 - Ugong78 Pasig City 2 - Santolan79 Pasig City 3 - Santa Lucia80 Pasig City 4 - Pinagbuhatan42 Quezon City 1 - Tatalon, Damayang Lagi43 Quezon City 2 - Santo Domingo (Matalahib)44 Quezon City 3 - Baesa, Sangandaan45 Quezon City 4 - Bagong Pag-asa46 Quezon City 5 - Pinyahan, (Trinoma/SM West)47 Quezon City 6 - Paltok, Del Monte48 Quezon City 7 - Kamuning49 Quezon City 8 - E. Rodriguez, Crame50 Quezon City 9 - Camp Aguinaldo51 Quezon City 10 - Kamias (East/West)52 Quezon City 11 - U.P. Campus53 Quezon City 12 - Pasong Tamo54 Quezon City 13 - Batasan Hills55 Quezon City 14 - Commonwealth56 Quezon City 15 - Payatas57 Quezon City 16 - North Fairview61 Quezon City 17 - Greater Lagro, Novaliches Proper62 Quezon City 18 - Tandang Sora75 Quezon City 19 - Pansol, Loyola Heights77 Quezon City 20 - White Plains, Libis (Eastwood)58 Kalookan City (North) 1 - Barangay 17859 Kalookan City (North) 2 - Barangay 17660 Kalookan City (North) 3 - Barangay 17163 Valenzuela City 1 - Ugong64 Valenzuela City 2 - Canumay, Maysan65 Valenzuela City 3 - Malinta66 Valenzuela City 4 - Malanday71 Valenzuela City 5 - Marulas
7
8
9
10
1
2
3
4
5
6
Metro Manila NCR
Quezon City
Kalookan City (North)
Valenzuela City
1Taguig
Mandaluyong City
San Juan
Pasig City
City of Manila
Pasay City
Parañaque City
Makati City

11-15
TABLE 11.2.1-1 (2) TRAFFIC ZONING SYSTEM
Small Zone
Barangay Medium Zone
City/Municipality Large Zone
Province Region
67 Malabon 1 - Concepcion70 Malabon 2 - Potrero68 Navotas - North Bay Blvd South Navotas69 Kalookan City (South) 1 - Barangay 1272 Kalookan City (South) 2 - Baranagay 13273 Kalookan City (South) 3 - Barangay 12074 Marikina City 1 - Concepcion Uno, Parang76 Marikina City 2 - Malanday87 Muntinlupa City 1 - Sucat88 Muntinlupa City 2 - Alabang89 Muntinlupa City 3 - Putatan90 Las Pinas City 1 - Almanza (Uno, Dos)91 Las Pinas City 2 - B.F. International Village94 Las Pinas City 3 - Zapote
320 Manila Port - - 1 Metro Manila NCR133 BACOOR 134 IMUS 135 CAVITE CITY 136 KAWIT 137 NOVELETA 138 ROSARIO 139 Tejero140 Pasong Camachile II 141142 Amaya143 Halayhay144 Bagtas146 Ibayo Silangan147 Palangue 2 & 3 161 GENERAL EMILIO AGUINALDO 145 TRECE MARTIRES CITY (Capital) 148 Datu Esmael (Bago-a-ingud) 149 Paliparan III 150 Langkaan II151 SILANG 153 GEN. MARIANO ALVAREZ 154 CARMONA 162 AMADEO 163 ALFONSO 164 TAGAYTAY CITY 152 SAN PEDRO 155 BIÑAN 156 CITY OF SANTA ROSA157 CABUYAO 158 Pansol, Parian159 Canlubang160 BAY 165 SANTA MARIA 166 MABITAC 167 FAMY 168 KALAYAAN 169 CAVINTI 170 LILIW 171 PAGSANJAN 172 ALAMINOS 173 Del Remedio 174 Santisimo Rosario 175 San Francisco176 Santo Angel116 San Jose117 Burgos118 SAN MATEO 119 Cupang120 San Jose (Pob.)121 Inarawan122 CAINTA123 TAYTAY 124 ANGONO 125 BINANGONAN 126 TERESA 127 MORONG 128 CARDONA 129 BARAS 130 TANAY 131 PILILLA 132 JALA-JALA 95 CITY OF MEYCAUAYAN96 MARILAO 97 OBANDO 98 BULACAN 99 BOCAUE
13 Las Pinas City
1 Metro Manila NCR
CITY OF ANTIPOLO (Capital)
TANZA
NAIC
DASMARIÑAS
CITY OF CALAMBA
Marikina City
Muntinlupa City
GENERAL TRIAS
SAN PABLO CITY
RODRIGUEZ (MONTALBAN)
14
15
21
22
23
32
33
34
19
11
12
24
25
26
27
20
Region III
2
3
4
5
30
31
BULACAN
Region IV-A
CAVITE
LAGUNA
RIZAL
28
29
Malabon
Kalookan City (South)

11-16
TABLE 11.2.1-1 (3) TRAFFIC ZONING SYSTEM
Small Zone
Barangay Medium Zone
City/Municipality Large Zone
Province Region
100 BALAGTAS (BIGAA) 101 GUIGUINTO 102 CITY OF MALOLOS (Capital) 1 103 PAOMBONG 104 HAGONOY 105 CALUMPIT 106 PULILAN 107 PLARIDEL 108 PANDI 109 Poblacion, Guyong110 Pulong Buhangin111 Muzon112 Gumaoc 113 Kaypian114 Tigbe115 San Mateo205 BALIUAG 206 BUSTOS 207 ANGAT 208 SAN ILDEFONSO 209 DOÑA REMEDIOS TRINIDAD 214 APALIT 220 CANDABA 215 MINALIN 219 BACOLOR 224 Dolores225 Bulaon216 MASANTOL 217 LUBAO 218 FLORIDABLANCA 221 ARAYAT 222 MAGALANG 223 PORAC 226 Dau227 Mabiga, Calumpang228 Cutcut229 Santo Domingo230 Balibago231 Malabanias177 BALAYAN 178 AGONCILLO 179 LAUREL 180 CITY OF TANAUAN181 SANTO TOMAS 182 BALETE 188 Marauoy189 Antipolo Del Norte190 Lodlod191 San Jose183 CUENCA 187 ALITAGTAG 184 PADRE GARCIA 185 SAN JUAN 186 LOBO 192 Santa Rita Karsada 193 Gulod Itaas194 Libjo195 Pinamucan196 GENERAL NAKAR 197 LUCBAN 198 CITY OF TAYABAS203 LUCENA CITY (Capital) 204 AGDANGAN 199 SARIAYA 200 CANDELARIA 201 DOLORES 202 SAN ANTONIO 210 LIMAY 211 ABUCAY 212 BAGAC 213 DINALUPIHAN 249 Barreto250 East Bajac-bajac251 Santa Rita252 New Cabalan253 Calapacuan254 Cawag255 Pamatawan256 Naugsol257 58 CASTILLEJOS
ANGELES CITY
LIPA CITY
BATANGAS CITY (Capital)
OLONGAPO CITY
SAN JOSE DEL MONTE
NORZAGARAY
CITY OF SAN FERNANDO
MABALACAT
SANTA MARIA
38
39
46
47
48
49
50
35
36
37
17
18
43
44
15
16
Region III
5
Region III
Region IV-A
7
6
QUEZON8
10
42
SUBIC
40
41
45
56
57
BATAAN
ZAMBALES
BULACAN
PAMPANGA
BATANGAS
9

11-17
TABLE 11.2.1-1 (4) TRAFFIC ZONING SYSTEM Small Zone
Barangay Medium Zone
City/Municipality Large Zone
Province Region
258 59 BOTOLAN 259 60 CANDELARIA 232 BAMBAN 234 CAPAS 233 CONCEPCION 236 LA PAZ 246 Matatalaib247 San Rafael248 Maliwalo235 SAN JOSE 240 CAMILING 237 VICTORIA 238 PURA 239 GERONA 241 RAMOS 242 ANAO 243 SAN MANUEL 244 Poblacion Norte245 Balaoang260 San Nicolas261 San Roque262 CABIAO 263 JAEN 264 SAN LEONARDO 265 GENERAL TINIO (PAPAYA) 266 SANTA ROSA 267 GABALDON (BITULOK & SABANI) 268 BONGABON 282 CARRANGLAN 269 GENERAL MAMERTO NATIVIDAD 270 SANTO DOMINGO 275 SCIENCE CITY OF MUÑOZ276 LUPAO 281 SAN JOSE CITY 271 ALIAGA 272 LICAB 277 Bantug Norte278 Caalibangbangan279 San Josef Norte280 Campo Tinio273 GUIMBA 274 CUYAPO 284 UMINGAN 285 NATIVIDAD 286 ASINGAN 287 SAN MANUEL 298 BALUNGAO 288 POZZORUBIO 289 BUGALLON 290 CALASIAO 291 BINMALEY 294 AGUILAR 295 BASISTA 296 BAUTISTA 297 VILLASIS 299 Bayaoas300 Pinmaludpod301 Palina East292 CITY OF ALAMINOS293 AGNO 283 67 All Municipalities 14 AURORA Region III302303308309312 Mt. Province313 Kalinga 314 Abra316 Apayao 304305306 Quirino307 Isabela317 CAGAYAN310 LA UNION 311 ILOCOS SUR 315 ILOCOS NORTE 318 All Provinces Region IV-B319 All Provinces Region V
Zone 302-319 Out of Study Area.
ZAMBALES
Region I
CAR
Region II
TARLAC
NUEVA ECIJA
PANGASINAN
Benguet
Region I
Ifugao
Nueva Vizcaya72 15
13
12
PANIQUI
CITY OF GAPAN
CABANATUAN CITY
CITY OF URDANETA
71
64
65
62
63
51
52
53
54
10
11
CITY OF TARLAC
69
70
66
68
55
61
Region III
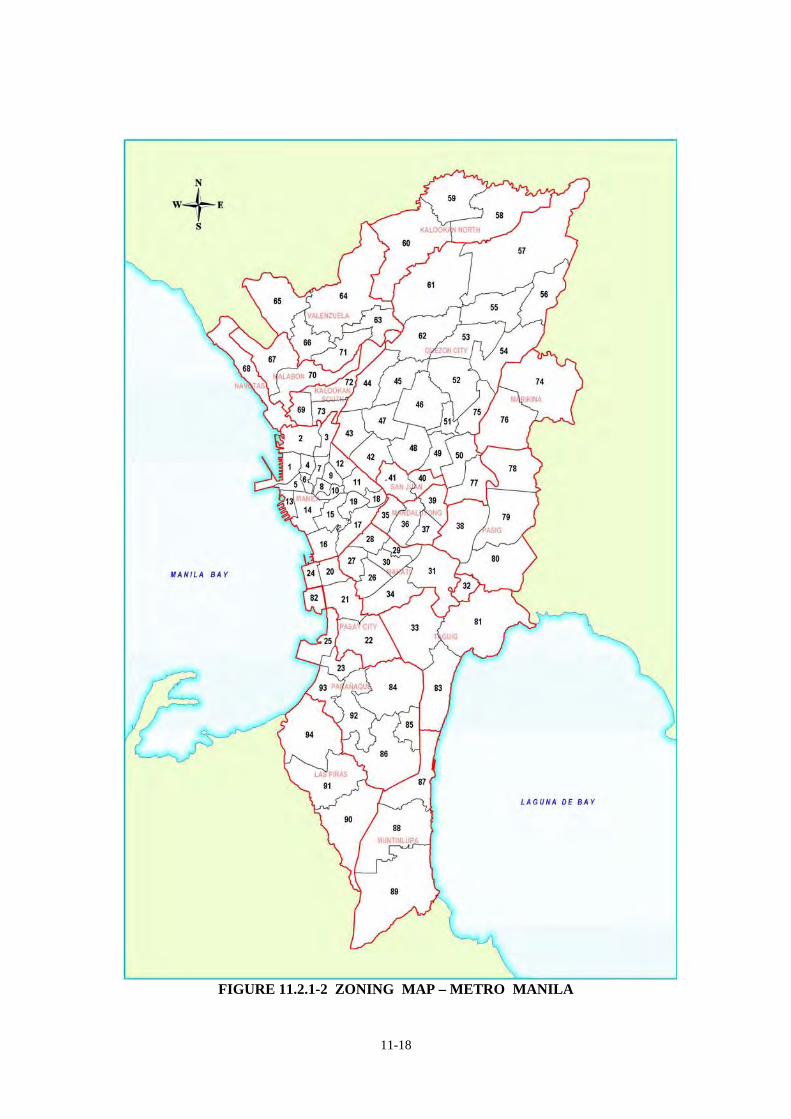
11-18
FIGURE 11.2.1-2 ZONING MAP – METRO MANILA

11-19
FIGURE 11.2.1-3 ZONING MAP – OUTSIDE METRO MANILA

11-20
11.2.2 Forecasting Trip Generation and Attraction 11.2.2.1 Modeling Trip Generation and Attraction
The objective of trip generation and attraction model is to forecast the number of trips that will start and arrive in each traffic zone within the study area. The linear regression models are adopted in the study. The model parameters are calibrated shown in Table 11.2.2.1-1 and Table 11.2.2.1-2.
Gi = ai * X1i + bi * X2i + ci * Di + C Aj = aj * X1j + bj * X2j + cj * Dj + C Where, Gi – Trip Generation in zone i Aj – Trip Attraction in zone j X1i, X2j – Attributes in zone i,j Di, Dj – Dummy Variables ai, aj, bi,bj – Coefficients C – Constant
TABLE 11.2.2.1-1 GENERATION/ATTRACTION MODELS (PASSENGER TRIPS) Attributes
Model Type The Subject Area Population Employment
Dummy Variable Constant
R2 Multiple Correlation Coefficient
Metro Manila (MM) 2.0928 1.0289 -1,005,653 -206,717
0.9860
Neighboring Province of
MM (Cavite, Rizal, Laguna,
Bulacan)
1.3837 - 619,554 -164,274 0.9378 Trip Generation
Other Areas 0.0680 - 47,542 -6,448
0.9013
Metro Manila (MM) 1.9863 1.0075 -835,149 -238,716
0.9829
Neighboring Province of
MM (Cavite, Rizal, Laguna,
Bulacan)
1.3981 - 612,567 -168,183 0.9375 Trip Attraction
Other Areas 0.0616 - 55,612 -4,920
0.9117

11-21
TABLE 11.2.2.1-2 GENERATION/ATTRACTION MODELS (CARGO MOVEMENT) Attributes
Model Type The Subject Area Population Employment
Dummy Variable Constant
R2 Multiple Correlation Coefficient
Metro Manila (MM) - 271.5 201,652 -206,717
0.9808
Neighboring Province of
MM (Cavite, Rizal, Laguna,
Bulacan)
- 135.9 66,565 -164,274 0.8267 Trip
Generation
Other Areas - 17.2 5,910 -6,448
0.7675
Metro Manila (MM) - 241.4 -835,149 195,530
0.9638
Neighboring Province of
MM (Cavite, Rizal, Laguna,
Bulacan)
- 156.8 612,567 66,185 0.8171 Trip Attraction
Other Areas - 19.7 55,612 6,269
0.7934
11.2.2.2 Verification of Trip Generation and Attraction Models
Figure 11.2.2.2-1 shows the verification results between observed and estimated trips for passenger trips.
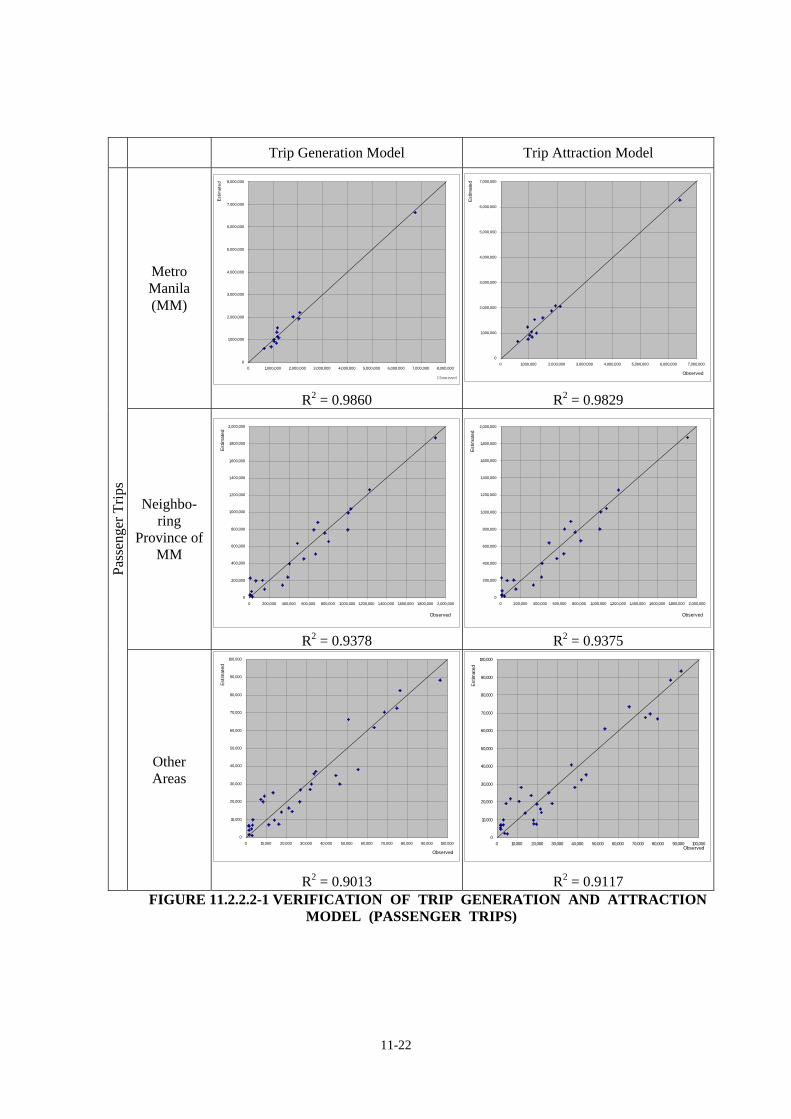
11-22
Trip Generation Model Trip Attraction Model
Metro Manila (MM)
R2 = 0.9860
R2 = 0.9829
Neighbo-ring
Province of MM
R2 = 0.9378
R2 = 0.9375
Pass
enge
r Trip
s
Other Areas
R2 = 0.9013
R2 = 0.9117 FIGURE 11.2.2.2-1 VERIFICATION OF TRIP GENERATION AND ATTRACTION
MODEL (PASSENGER TRIPS)
0
1,000,000
2,000,000
3,000,000
4,000,000
5,000,000
6,000,000
7,000,000
8,000,000
0 1,000,000 2,000,000 3,000,000 4,000,000 5,000,000 6,000,000 7,000,000 8,000,000
Observed
Est
imat
ed
0
1,000,000
2,000,000
3,000,000
4,000,000
5,000,000
6,000,000
7,000,000
0 1,000,000 2,000,000 3,000,000 4,000,000 5,000,000 6,000,000 7,000,000
Observed
Estim
ated
0
200,000
400,000
600,000
800,000
1,000,000
1,200,000
1,400,000
1,600,000
1,800,000
2,000,000
0 200,000 400,000 600,000 800,000 1,000,000 1,200,000 1,400,000 1,600,000 1,800,000 2,000,000
Observed
Estim
ated
0
200,000
400,000
600,000
800,000
1,000,000
1,200,000
1,400,000
1,600,000
1,800,000
2,000,000
0 200,000 400,000 600,000 800,000 1,000,000 1,200,000 1,400,000 1,600,000 1,800,000 2,000,000
Observed
Estim
ated
0
10,000
20,000
30,000
40,000
50,000
60,000
70,000
80,000
90,000
100,000
0 10,000 20,000 30,000 40,000 50,000 60,000 70,000 80,000 90,000 100,000
Observed
Estim
ated
0
10,000
20,000
30,000
40,000
50,000
60,000
70,000
80,000
90,000
100,000
0 10,000 20,000 30,000 40,000 50,000 60,000 70,000 80,000 90,000 100,000Observed
Estim
ated

11-23
Figure 11.2.2.2-2 shows the verification results between observed and estimated trips for cargo movement.
Trip Generation Model Trip Attraction Model
Metro Manila (MM)
R2 = 0.9808
R2 = 0.9638
Neighbo-ring
Province of MM
R2 = 0.8267
R2 = 0.8171
Car
go M
ovem
ent
Other Areas
R2 = 0.7675
R2 = 0.7934 FIGURE 11.2.2.2-2 VERIFICATION OF TRIP GENERATION AND ATTRACTION
MODEL (CARGO MOVEMENT)
0
50,000
100,000
150,000
200,000
250,000
300,000
350,000
400,000
450,000
0 50,000 100,000 150,000 200,000 250,000 300,000 350,000 400,000 450,000
Observed
Estim
ated
0
50,000
100,000
150,000
200,000
250,000
300,000
350,000
400,000
450,000
500,000
0 50,000 100,000 150,000 200,000 250,000 300,000 350,000 400,000 450,000 500,000
Observed
Estim
ated
0
10,000
20,000
30,000
40,000
50,000
60,000
70,000
80,000
90,000
100,000
110,000
120,000
0 10,000 20,000 30,000 40,000 50,000 60,000 70,000 80,000 90,000 100,000 110,000 120,000
Observed
Estim
ated
0
10,000
20,000
30,000
40,000
50,000
60,000
70,000
80,000
90,000
100,000
110,000
120,000
0 10,000 20,000 30,000 40,000 50,000 60,000 70,000 80,000 90,000 100,000 110,000 120,000
Observed
Estim
ated
0
1,000
2,000
3,000
4,000
5,000
6,000
7,000
8,000
9,000
10,000
11,000
0 1,000 2,000 3,000 4,000 5,000 6,000 7,000 8,000 9,000 10,000 11,000Observed
Estim
ated
0
1,000
2,000
3,000
4,000
5,000
6,000
7,000
8,000
9,000
10,000
11,000
0 1,000 2,000 3,000 4,000 5,000 6,000 7,000 8,000 9,000 10,000 11,000 12,000
Observed
Estim
ated
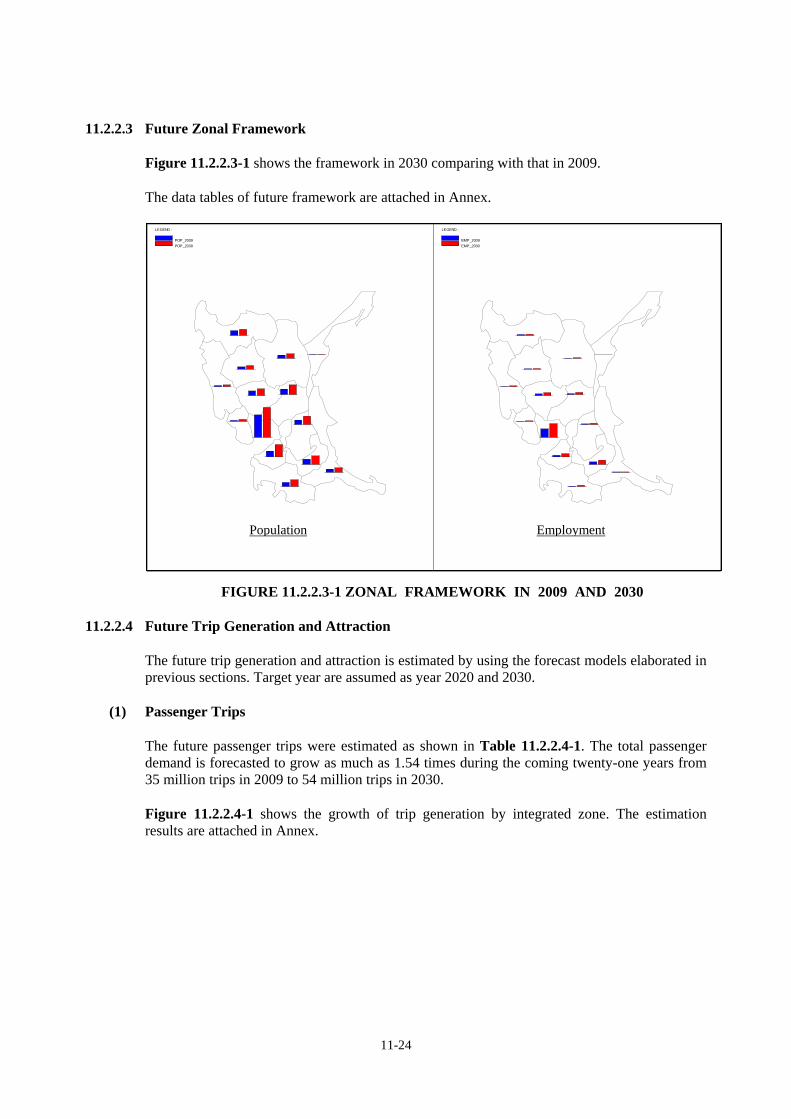
11-24
LEGEND :
POP_2009 POP_2030
LEGEND :
EMP_2009 EMP_2030
Population Employment
11.2.2.3 Future Zonal Framework
Figure 11.2.2.3-1 shows the framework in 2030 comparing with that in 2009.
The data tables of future framework are attached in Annex.
FIGURE 11.2.2.3-1 ZONAL FRAMEWORK IN 2009 AND 2030
11.2.2.4 Future Trip Generation and Attraction
The future trip generation and attraction is estimated by using the forecast models elaborated in previous sections. Target year are assumed as year 2020 and 2030.
(1) Passenger Trips
The future passenger trips were estimated as shown in Table 11.2.2.4-1. The total passenger demand is forecasted to grow as much as 1.54 times during the coming twenty-one years from 35 million trips in 2009 to 54 million trips in 2030. Figure 11.2.2.4-1 shows the growth of trip generation by integrated zone. The estimation results are attached in Annex.

11-25
FIGURE 11.2.2.4-1 PASSENGER TRIP GENERATION IN 2009 AND 2030
LEGEND :
PT2009 PT2030
TABLE 11.2.2.4-1 PASSENGER TRIPS Passenger Trips
(1,000 persons/day) Annual Growth Rate Increase Ratio Area 2009 2020 2030 ’09-‘20 ’21-‘30 ’09-‘20 ’09-‘30
Metro Manila (MM) 22,026 27,141 30,330 1.9% 1.0% 1.23 1.38 Neighboring Province of
MM 12,323 17,777 22,781 3.4% 2.3% 1.44 1.85
Other Study Areas 929 1,134 1,341 1.8% 1.5% 1.22 1.44 Total 35,278 46,052 54,452 2.5% 1.5% 1.31 1.54
(2) Cargo Flow
Table 11.2.2.4-2 shows the total generation of cargo demand in the Study Area is expected to increase from 2,565,622 tons per day in 2009 to 3,478,682 tons per day in 2020 and 4,292,515 tons per day in 2030. Approximately, two thirds of the total cargo movements will be continuously generated and/or attracted within Metro Manila.
TABLE 11.2.2.4-2 CARGO DEMAND GENERATION
Cargo Demands (tons/day) Annual Growth Rate Increase RatioArea
2009 2020 2030 ’09-‘20 ’09-‘30 ’09-‘20 ’21-‘30Metro Manila (MM) 1,602,847 2,138,180 2,584,875 1.7% 1.7% 1.33 1.61
Neighboring provinces of MM 878,332 1,227,513 1,548,574 3.1% 2.1% 1.40 1.76
Other Study Areas 84,443 112,989 139,065 2.7% 1.9% 1.39 1.65 Total 2,565,622 3,478,682 4,292,515 2.8% 1.9% 1.36 1.67
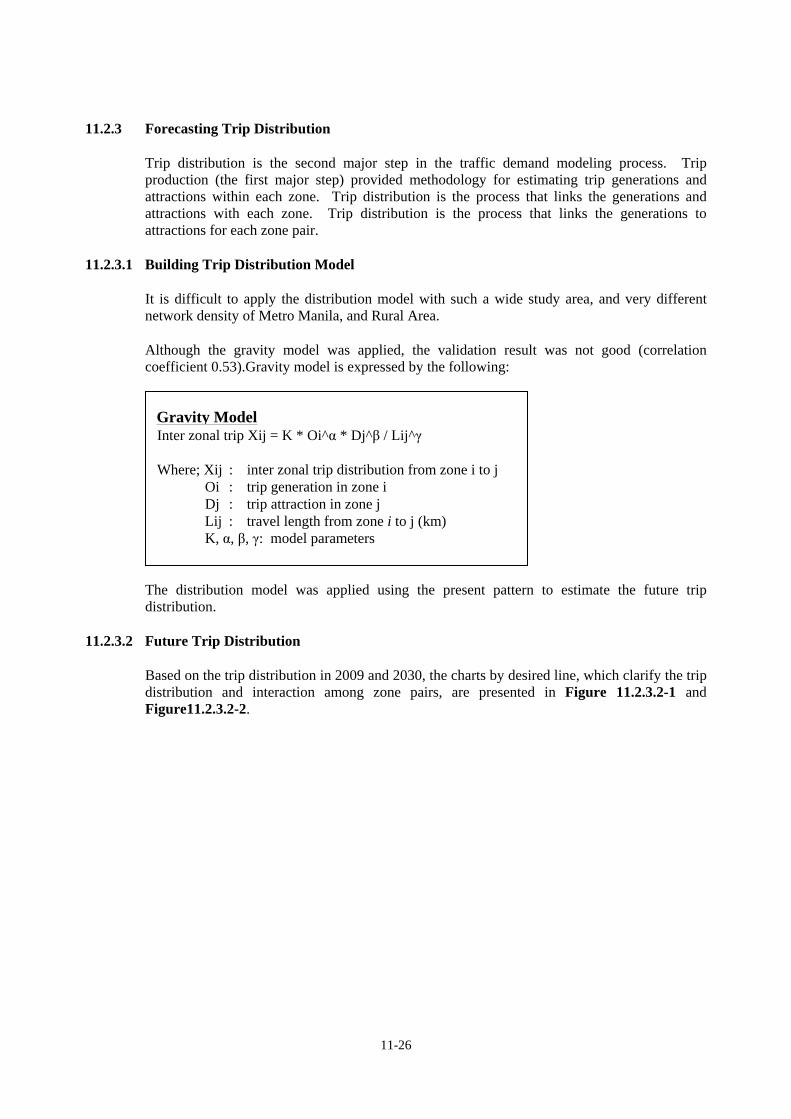
11-26
11.2.3 Forecasting Trip Distribution
Trip distribution is the second major step in the traffic demand modeling process. Trip production (the first major step) provided methodology for estimating trip generations and attractions within each zone. Trip distribution is the process that links the generations and attractions with each zone. Trip distribution is the process that links the generations to attractions for each zone pair.
11.2.3.1 Building Trip Distribution Model
It is difficult to apply the distribution model with such a wide study area, and very different network density of Metro Manila, and Rural Area.
Although the gravity model was applied, the validation result was not good (correlation coefficient 0.53).Gravity model is expressed by the following:
Inter zonal trip Xij = K * Oi^α * Dj^β / Lij^γ Where; Xij : inter zonal trip distribution from zone i to j Oi : trip generation in zone i Dj : trip attraction in zone j Lij : travel length from zone i to j (km) K, α, β, γ: model parameters
The distribution model was applied using the present pattern to estimate the future trip distribution.
11.2.3.2 Future Trip Distribution
Based on the trip distribution in 2009 and 2030, the charts by desired line, which clarify the trip distribution and interaction among zone pairs, are presented in Figure 11.2.3.2-1 and Figure11.2.3.2-2.
Gravity Model

11-27
Y2009 Y2030
FIGURE 11.2.3.2-1 DESIRE LINE OF PASSENGER
Y2009
Y2030
FIGURE 11.2.3.2-2 DESIRE LINE OF CARGO

11-28
11.2.4 Forecasting Modal Split 11.2.4.1 Modal Split Model
Figure 11.2.4.1-1 shows the procedure of Modal Split Model.
FIGURE 11.2.4.1-1 STRUCTURE OF MODAL SPLIT MODEL
(1) Private Car Split Model
Based on the trend of vehicle registration, the number of private car passenger is estimated. Number of public transport passenger is estimated by subtracting number of private car passenger from all passengers.
(2) Public Transport Split Model
The modal split between bus and jeepney was estimated by using the relationship between zone i and zone j in distance calculated on the basis of Present OD matrix.
Figure 11.2.4.1-2 shows the modal share of jeepney to the public transport trips.
0%
10%
20%
30%
40%
50%
60%
70%
80%
90%
100%
0 50 100 150 200 250
Length(km) Note: Year 2009, Roadside OD Survey Result.
FIGURE 11.2.4.1-2 MODAL SHARE OF JEEPNEY TRIPS TO TOTAL PUBLIC TRANSPORT TRIPS
Truck Vehicle OD
Jeepney Passenger
OD
(1) Private Car Split Model
Jeepney OD
All Passenger OD Cargo Movement OD
Public Transport Passenger OD
Private Car Passenger OD
Bus Passenger
OD
(2) Public Transport Split Model
Bus OD
Private Car OD
(3) Convert from Volume
to Vehicle
(3) Convert from Passenger
to Vehicle
(3) Convert from Passenger
to Vehicle
(3) Convert from Passenger
to Vehicle
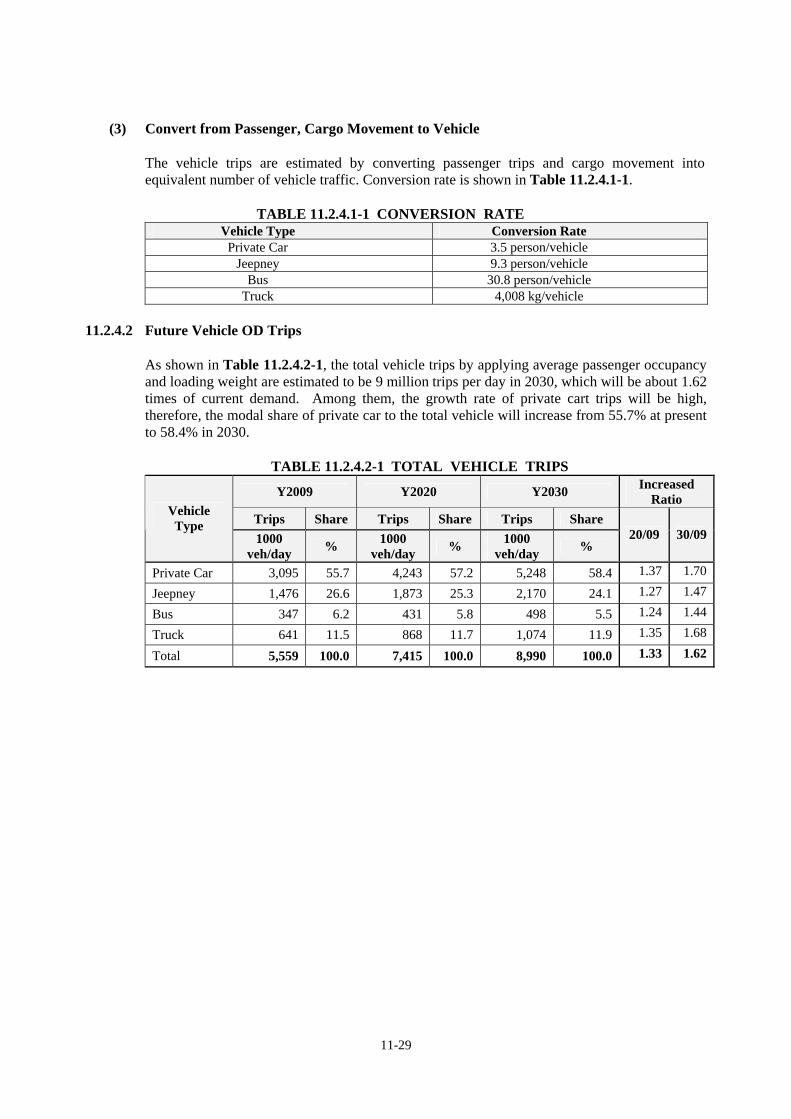
11-29
(3) Convert from Passenger, Cargo Movement to Vehicle
The vehicle trips are estimated by converting passenger trips and cargo movement into equivalent number of vehicle traffic. Conversion rate is shown in Table 11.2.4.1-1.
TABLE 11.2.4.1-1 CONVERSION RATE
Vehicle Type Conversion Rate Private Car 3.5 person/vehicle
Jeepney 9.3 person/vehicle Bus 30.8 person/vehicle
Truck 4,008 kg/vehicle
11.2.4.2 Future Vehicle OD Trips
As shown in Table 11.2.4.2-1, the total vehicle trips by applying average passenger occupancy and loading weight are estimated to be 9 million trips per day in 2030, which will be about 1.62 times of current demand. Among them, the growth rate of private cart trips will be high, therefore, the modal share of private car to the total vehicle will increase from 55.7% at present to 58.4% in 2030.
TABLE 11.2.4.2-1 TOTAL VEHICLE TRIPS
Y2009 Y2020 Y2030 Increased Ratio
Trips Share Trips Share Trips Share Vehicle Type
1000 veh/day % 1000
veh/day % 1000 veh/day %
20/09 30/09
Private Car 3,095 55.7 4,243 57.2 5,248 58.4 1.37 1.70
Jeepney 1,476 26.6 1,873 25.3 2,170 24.1 1.27 1.47
Bus 347 6.2 431 5.8 498 5.5 1.24 1.44
Truck 641 11.5 868 11.7 1,074 11.9 1.35 1.68
Total 5,559 100.0 7,415 100.0 8,990 100.0 1.33 1.62

11-30
55.7%
57.2%
58.4%
26.6%
25.3%
24.1%
6.2%
5.8%
5.5%
11.5%
11.7%
11.9%
0.0% 20.0% 40.0% 60.0% 80.0% 100.0%
Y2009
Y2020
Y2030
Private Car Jeepney Bus Truck
FIGURE 11.2.4.2-1 MODAL SHARE IN 2009, 2020 AND 2030 (VEHICLE BASE)
LEGEND :
Gen:PRIVATECARGen:JEEPNEY Gen:BUS Gen:TRUCK
(Year 2009)
LEGEND :
Gen:PRIVATECARGen:JEEPNEY Gen:BUS Gen:TRUCK
(Year 2030)
FIGURE 11.2.4.2-2 MODAL SHARE BY ZONE (GENERATION BASE) IN 2009 AND 2030

11-31
11.2.5 Traffic Assignment Model
The traffic assignment process allocates vehicle traffic to individual road links. This step takes as input a matrix of flows (vehicles) that indicate the volume of traffic between origin and destination pairs.
11.2.5.1 Modeling Traffic Assignment
(1) Assignment Method
Various assignment techniques are used ranging from manual methods to complex iterative procedures by computer programs. In this study, the used methods the capacity restraint assignment which is the most straightforward for use in network models, and the most efficient particularly where the number of zones in the trip matrix is large. This assignment technique is based on the speed – flow relationship, and the flow chart of the applied methodology is shown in Figure 11.2.5.1-1.
In this assignment technique, and by calculating the required travel time for each link according to its travel speed and road conditions, the program determines the fastest routes between each origin and destination by evaluating the consuming time on links, and assigns the trips between the given origin and destination. As congestion increases till a certain level, alternative routes are introduced to handle the unassigned traffic. Zone-to-zone routing is built, which is the fastest path from each zone to any other, and all trips are assigned to these optimum routes. Since the link-travel time varies with the traffic volume of vehicles using that link, which can be explained as a degree of link congestion, the OD tables are divided to apply an iteration procedure on ten stages. At each iteration, and depending upon the current link loadings, the flows are divided between all the shortest routes generated and a new travel time is computed for the average assigned link flow at each pass. The iteration continues to re-estimate the speed on that links considering the assigned traffic on links, and to produce alternative routes so that more accurate allocation can be achieved. The accumulated assigned traffic volume from each OD pair on the links composes the total assigned traffic volumes per direction for the network. JICA STRADA is used to estimate traffic volumes.

11-32
Vmax
0.1V
0.3Qmin Qmax
FIGURE 11.2.5.1-1 TRAFFIC ASSIGNMENT PROCEDURE
(2) Speed Flow Relationship
The speed-flow relationship used in the traffic assignment procedure is shown in Figure 11.2.5.1-2. When the traffic volumes are over the maximum capacity 0.3*Qmax, it is assumed that vehicle speed drastically reduces. The basic free flow and capacity is shown in Table 11.2.5.1-1.
FIGURE 11.2.5.1-2 SPEED – FLOW RELATIONSHIP
Road Network Speed-flow relationship
Initial speed on link
Search for shortest route
Expressway Toll
Iteration by divided OD Table
Iteration by divided OD
Table
Assignment on shortest route for each iteration on network
Last iteration
Assigned traffic volume on network
No
Yes

11-33
TABLE 11.2.5.1-1 FREE SPEED AND CAPACITY BY ROAD TYPE QV
Type Pavement Road Class Topography Lane Vmax Qmax
1 4 100 80,000 2 3 100 60,000 3 2 100 40,000 4
Plain
1 70 15,000 5 2 70 28,000 6
Expressway
Mountains 1 60 10,500
7 4 40 60,000 8
Plain 2 30 18,000
9 4 30 42,000 10
Interstate Highway Mountains
2 25 12,600 11 10 60 120,000 12 8 60 96,000 13 6 50 72,000 14 4 40 48,000 15
Urban Arterial Mountains
2 30 14,400 16 4 40 40,000 17
Plain 2 30 12,000
18
Paved
Local Mountains 2 30 8,400
19 Plain 2 20 6,000 20
Unpaved Mountains 2 10 4,200
(3) Passenger Car Unit
Table 11.2.5.1-2 shows the Passenger Car Unit (PCU). This value is the same as that of DPWH.
TABLE 11.2.5.1-2 PASSENGER CAR UNIT Vehicle Type Passenger Car Unit Passenger Car 1.0
Jeepney 1.5 Bus 2.2
Truck 2.5
(4) Time Evaluation Value
An important input for the demand forecast is the trip maker’s time value. This time value is the basis for a trip maker to decide whether he or she will use toll expressway or not. The time values were derived from MMUEN data. Supposing time value will be increased in accordance with inflation rate of 5% per year.

11-34
TABLE 11.2.5.1-3 TIME EVALUATION VALUE BY VEHICLE TYPE Unit: Peso/hour Y2009 Y2020 Y2030
Car 331.4 566.8 923.3 Jeepney 465.9 796.9 1,298.1
Bus 1,524.2 2,606.9 4,246.4 Truck 873.2 1,493.5 2,432.7
11.3 “DO NOTHING CASE” TRAFFIC ASSIGNMENT
For the objective of road network policy and counter measure studies, it was first assumed that no improvement would be applied to transport supply, what is called “Do Nothing” case analysis. The traffic assignment results of existing case (2009) and (Do-Nothing case in 2020 and 2030, were summarized as follows (See Table 11.3-1).
TABLE 11.3-1 TRAFFIC ASSIGNMENT RESULTS IN DO-NOTHING CASE
Ratio Year 2009 Year 2020 Year 2030 2020/2009 2030/2009 Total Vehicle Trips
1000 (PCU) 7,675 10,171 12,284 1.33 1.60
1000 PCU-km 67,505 94,149 114,042 1.39 1.69 1000 PCU-hr 3,053 5,256 7,309 1.72 2.39
Volume/Capacity 0.63 0.86 1.03 1.37 1.63 Average Speed
(km/hr) 22.1 17.9 15.6 0.81 0.71
Comparing the future road traffic with the existing one, it appears that radial arterial in the sub-urban area of Metro Manila will become heavily congested in the future (see Figure 11.3-1 (1) to (3)). Thus the following remarks are pointed out.
(a) Traffic Indicator
Annual traffic indicators of vehicle trips are evaluated from the viewpoints of changes in vehicle trips, pcu-hr, pcu-km and average speed. The vehicle trips are forecast to increase from 7,675 thousand trips in 2009 to 12,284 thousand trips in 2030 with a growth of about 1.60 times. In addition, the indicators of pcu-hr and pcu-km are also increasing, especially the pcu-hr that increases from 3,053 thousand pcu-hr in 2009 to 7,309 thousand pcu-hr in 2030 with a growth of about 2.39 times. As a result, the average travel speed is decreased from 22.1 km/hr in 2009 to 15.6 km/hr in 2030, which means that the level of service on the road network will face a severe situation from the economic and environmental points of view.
(b) Traffic Congestion Results of analyzing the volume to capacity ratio V/C to investigate the road congestion in 2009 show desirable ratio of 0.63. Results of the year 2030 show unacceptable level of traffic congestion with an average value of 1.03.

11-35
(c) Summary
If any counter measures against traffic congestion are not implemented in the transport sector, when road traffic volumes drastically increase, the level of service will become worse. Some new road constructions or widening to decrease traffic congestion is desired in the future.

11-36
FIGURE 11.3-1 (1) YEAR 2020 TRAFFIC CONDITION (DO NOTHING CASE):
NORTH OF METRO MANILA

11-37
FIGURE 11.3-1 (2) YEAR 2020 TRAFFIC CONDITION (DO NOTHING CASE):
METRO MANILA

11-38
FIGURE 11.3-1 (3) YEAR 2020 TRAFFIC CONDITION (DO NOTHING CASE):
SOUTH OF METRO MANILA

11-39
FIGURE 11.3-2 (1) YEAR 2030 TRAFFIC CONDITION (DO NOTHING CASE):
NORTH OF METRO MANILA

11-40
FIGURE 11.3-2 (2) YEAR 2030 TRAFFIC CONDITION (DO NOTHING CASE):
METRO MANILA

11-41
FIGURE 11.3-2 (3) YEAR 2030 TRAFFIC CONDITION (DO NOTHING CASE):
SOUTH OF METRO MANILA