Embed Size (px)
Citation preview

Chapter 9
Microbial Growth
Figure 9.1 Medical devices that are inserted into a patient’s body often become contaminated with a thin biofilm ofmicroorganisms enmeshed in the sticky material they secrete. The electron micrograph (left) shows the inside wallsof an in-dwelling catheter. Arrows point to the round cells of Staphylococcus aureus bacteria attached to the layers ofextracellular substrate. The garbage can (right) served as a rain collector. The arrow points to a green biofilm on thesides of the container. (credit left: modification of work by Centers for Disease Control and Prevention; credit right:modification of work by NASA)
Chapter Outline
9.1 How Microbes Grow
9.2 Oxygen Requirements for Microbial Growth
9.3 The Effects of pH on Microbial Growth
9.4 Temperature and Microbial Growth
9.5 Other Environmental Conditions that Affect Growth
9.6 Media Used for Bacterial Growth
IntroductionWe are all familiar with the slimy layer on a pond surface or that makes rocks slippery. These are examples ofbiofilms—microorganisms embedded in thin layers of matrix material (Figure 9.1). Biofilms were long consideredrandom assemblages of cells and had little attention from researchers. Recently, progress in visualization andbiochemical methods has revealed that biofilms are an organized ecosystem within which many cells, usually ofdifferent species of bacteria, fungi, and algae, interact through cell signaling and coordinated responses. The biofilmprovides a protected environment in harsh conditions and aids colonization by microorganisms. Biofilms also haveclinical importance. They form on medical devices, resist routine cleaning and sterilization, and cause health-acquiredinfections. Within the body, biofilms form on the teeth as plaque, in the lungs of patients with cystic fibrosis, and onthe cardiac tissue of patients with endocarditis. The slime layer helps protect the cells from host immune defenses andantibiotic treatments.
Studying biofilms requires new approaches. Because of the cells’ adhesion properties, many of the methods forculturing and counting cells that are explored in this chapter are not easily applied to biofilms. This is the beginningof a new era of challenges and rewarding insight into the ways that microorganisms grow and thrive in nature.
Chapter 9 | Microbial Growth 361

9.1 How Microbes Grow
Learning Objectives• Define the generation time for growth based on binary fission
• Identify and describe the activities of microorganisms undergoing typical phases of binary fission (simple celldivision) in a growth curve
• Explain several laboratory methods used to determine viable and total cell counts in populations undergoingexponential growth
• Describe examples of cell division not involving binary fission, such as budding or fragmentation
• Describe the formation and characteristics of biofilms
• Identify health risks associated with biofilms and how they are addressed
• Describe quorum sensing and its role in cell-to-cell communication and coordination of cellular activities
The bacterial cell cycle involves the formation of new cells through the replication of DNA and partitioning of cellularcomponents into two daughter cells. In prokaryotes, reproduction is always asexual, although extensive geneticrecombination in the form of horizontal gene transfer takes place, as will be explored in a different chapter. Mostbacteria have a single circular chromosome; however, some exceptions exist. For example, Borrelia burgdorferi, thecausative agent of Lyme disease, has a linear chromosome.
Binary Fission
The most common mechanism of cell replication in bacteria is a process called binary fission, which is depicted inFigure 9.2. Before dividing, the cell grows and increases its number of cellular components. Next, the replicationof DNA starts at a location on the circular chromosome called the origin of replication, where the chromosome isattached to the inner cell membrane. Replication continues in opposite directions along the chromosome until theterminus is reached.
The center of the enlarged cell constricts until two daughter cells are formed, each offspring receiving a complete copyof the parental genome and a division of the cytoplasm (cytokinesis). This process of cytokinesis and cell division isdirected by a protein called FtsZ. FtsZ assembles into a Z ring on the cytoplasmic membrane (Figure 9.3). The Zring is anchored by FtsZ-binding proteins and defines the division plane between the two daughter cells. Additionalproteins required for cell division are added to the Z ring to form a structure called the divisome. The divisomeactivates to produce a peptidoglycan cell wall and build a septum that divides the two daughter cells. The daughtercells are separated by the division septum, where all of the cells’ outer layers (the cell wall and outer membranes, if
Part 1
Jeni, a 24-year-old pregnant woman in her second trimester, visits a clinic with complaints of high fever, 38.9 °C(102 °F), fatigue, and muscle aches—typical flu-like signs and symptoms. Jeni exercises regularly and followsa nutritious diet with emphasis on organic foods, including raw milk that she purchases from a local farmer’smarket. All of her immunizations are up to date. However, the health-care provider who sees Jeni is concernedand orders a blood sample to be sent for testing by the microbiology laboratory.
• Why is the health-care provider concerned about Jeni’s signs and symptoms?
Jump to the next Clinical Focus box
Clinical Focus
362 Chapter 9 | Microbial Growth
This OpenStax book is available for free at http://cnx.org/content/col12087/1.5

present) must be remodeled to complete division. For example, we know that specific enzymes break bonds betweenthe monomers in peptidoglycans and allow addition of new subunits along the division septum.
Figure 9.2 (a) The electron micrograph depicts two cells of Salmonella typhimurium after a binary fission event. (b)Binary fission in bacteria starts with the replication of DNA as the cell elongates. A division septum forms in the centerof the cell. Two daughter cells of similar size form and separate, each receiving a copy of the original chromosome.(credit a: modification of work by Centers for Disease Control and Prevention)
Figure 9.3 FtsZ proteins assemble to form a Z ring that is anchored to the plasma membrane. The Z ring pinchesthe cell envelope to separate the cytoplasm of the new cells.
Chapter 9 | Microbial Growth 363

• What is the name of the protein that assembles into a Z ring to initiate cytokinesis and cell division?
Generation Time
In eukaryotic organisms, the generation time is the time between the same points of the life cycle in two successivegenerations. For example, the typical generation time for the human population is 25 years. This definition isnot practical for bacteria, which may reproduce rapidly or remain dormant for thousands of years. In prokaryotes(Bacteria and Archaea), the generation time is also called the doubling time and is defined as the time it takes forthe population to double through one round of binary fission. Bacterial doubling times vary enormously. WhereasEscherichia coli can double in as little as 20 minutes under optimal growth conditions in the laboratory, bacteria of thesame species may need several days to double in especially harsh environments. Most pathogens grow rapidly, likeE. coli, but there are exceptions. For example, Mycobacterium tuberculosis, the causative agent of tuberculosis, has ageneration time of between 15 and 20 hours. On the other hand, M. leprae, which causes Hansen’s disease (leprosy),grows much more slowly, with a doubling time of 14 days.
Calculating Number of Cells
It is possible to predict the number of cells in a population when they divide by binary fission at a constant rate.As an example, consider what happens if a single cell divides every 30 minutes for 24 hours. The diagram inFigure 9.4 shows the increase in cell numbers for the first three generations.
The number of cells increases exponentially and can be expressed as 2n, where n is the number ofgenerations. If cells divide every 30 minutes, after 24 hours, 48 divisions would have taken place. If we applythe formula 2n, where n is equal to 48, the single cell would give rise to 248 or 281,474,976,710,656 cells at 48generations (24 hours). When dealing with such huge numbers, it is more practical to use scientific notation.Therefore, we express the number of cells as 2.8 × 10¹⁴ cells.
In our example, we used one cell as the initial number of cells. For any number of starting cells, the formula isadapted as follows:
Nn = N0 2n
Nn is the number of cells at any generation n, N0 is the initial number of cells, and n is the number ofgenerations.
Micro Connections
364 Chapter 9 | Microbial Growth
This OpenStax book is available for free at http://cnx.org/content/col12087/1.5

Figure 9.4 The parental cell divides and gives rise to two daughter cells. Each of the daughter cells, in turn,divides, giving a total of four cells in the second generation and eight cells in the third generation. Eachdivision doubles the number of cells.
• With a doubling time of 30 minutes and a starting population size of 1 × 10⁵ cells, how many cells will bepresent after 2 hours, assuming no cell death?
The Growth Curve
Microorganisms grown in closed culture (also known as a batch culture), in which no nutrients are added and mostwaste is not removed, follow a reproducible growth pattern referred to as the growth curve. An example of a batchculture in nature is a pond in which a small number of cells grow in a closed environment. The culture density isdefined as the number of cells per unit volume. In a closed environment, the culture density is also a measure of thenumber of cells in the population. Infections of the body do not always follow the growth curve, but correlations canexist depending upon the site and type of infection. When the number of live cells is plotted against time, distinctphases can be observed in the curve (Figure 9.5).
Chapter 9 | Microbial Growth 365

Figure 9.5 The growth curve of a bacterial culture is represented by the logarithm of the number of live cells plottedas a function of time. The graph can be divided into four phases according to the slope, each of which matchesevents in the cell. The four phases are lag, log, stationary, and death.
The Lag Phase
The beginning of the growth curve represents a small number of cells, referred to as an inoculum, that are added to afresh culture medium, a nutritional broth that supports growth. The initial phase of the growth curve is called the lagphase, during which cells are gearing up for the next phase of growth. The number of cells does not change duringthe lag phase; however, cells grow larger and are metabolically active, synthesizing proteins needed to grow withinthe medium. If any cells were damaged or shocked during the transfer to the new medium, repair takes place duringthe lag phase. The duration of the lag phase is determined by many factors, including the species and genetic make-upof the cells, the composition of the medium, and the size of the original inoculum.
The Log Phase
In the logarithmic (log) growth phase, sometimes called exponential growth phase, the cells are actively dividingby binary fission and their number increases exponentially. For any given bacterial species, the generation time underspecific growth conditions (nutrients, temperature, pH, and so forth) is genetically determined, and this generationtime is called the intrinsic growth rate. During the log phase, the relationship between time and number of cellsis not linear but exponential; however, the growth curve is often plotted on a semilogarithmic graph, as shown inFigure 9.6, which gives the appearance of a linear relationship.
366 Chapter 9 | Microbial Growth
This OpenStax book is available for free at http://cnx.org/content/col12087/1.5

Figure 9.6 Both graphs illustrate population growth during the log phase for a bacterial sample with an initialpopulation of one cell and a doubling time of 1 hour. (a) When plotted on an arithmetic scale, the growth rateresembles a curve. (b) When plotted on a semilogarithmic scale (meaning the values on the y-axis are logarithmic),the growth rate appears linear.
Cells in the log phase show constant growth rate and uniform metabolic activity. For this reason, cells in the log phaseare preferentially used for industrial applications and research work. The log phase is also the stage where bacteriaare the most susceptible to the action of disinfectants and common antibiotics that affect protein, DNA, and cell-wallsynthesis.
Stationary Phase
As the number of cells increases through the log phase, several factors contribute to a slowing of the growth rate.Waste products accumulate and nutrients are gradually used up. In addition, gradual depletion of oxygen begins tolimit aerobic cell growth. This combination of unfavorable conditions slows and finally stalls population growth. Thetotal number of live cells reaches a plateau referred to as the stationary phase (Figure 9.5). In this phase, the numberof new cells created by cell division is now equivalent to the number of cells dying; thus, the total population of livingcells is relatively stagnant. The culture density in a stationary culture is constant. The culture’s carrying capacity, ormaximum culture density, depends on the types of microorganisms in the culture and the specific conditions of theculture; however, carrying capacity is constant for a given organism grown under the same conditions.
During the stationary phase, cells switch to a survival mode of metabolism. As growth slows, so too does the synthesisof peptidoglycans, proteins, and nucleic-acids; thus, stationary cultures are less susceptible to antibiotics that disruptthese processes. In bacteria capable of producing endospores, many cells undergo sporulation during the stationaryphase. Secondary metabolites, including antibiotics, are synthesized in the stationary phase. In certain pathogenicbacteria, the stationary phase is also associated with the expression of virulence factors, products that contribute toa microbe’s ability to survive, reproduce, and cause disease in a host organism. For example, quorum sensing inStaphylococcus aureus initiates the production of enzymes that can break down human tissue and cellular debris,clearing the way for bacteria to spread to new tissue where nutrients are more plentiful.
The Death Phase
As a culture medium accumulates toxic waste and nutrients are exhausted, cells die in greater and greater numbers.Soon, the number of dying cells exceeds the number of dividing cells, leading to an exponential decrease in thenumber of cells (Figure 9.5). This is the aptly named death phase, sometimes called the decline phase. Many cellslyse and release nutrients into the medium, allowing surviving cells to maintain viability and form endospores. A
Chapter 9 | Microbial Growth 367

few cells, the so-called persisters, are characterized by a slow metabolic rate. Persister cells are medically importantbecause they are associated with certain chronic infections, such as tuberculosis, that do not respond to antibiotictreatment.
Sustaining Microbial Growth
The growth pattern shown in Figure 9.5 takes place in a closed environment; nutrients are not added and waste anddead cells are not removed. In many cases, though, it is advantageous to maintain cells in the logarithmic phase ofgrowth. One example is in industries that harvest microbial products. A chemostat (Figure 9.7) is used to maintaina continuous culture in which nutrients are supplied at a steady rate. A controlled amount of air is mixed in foraerobic processes. Bacterial suspension is removed at the same rate as nutrients flow in to maintain an optimal growthenvironment.
Figure 9.7 A chemostat is a culture vessel fitted with an opening to add nutrients (feed) and an outlet to removecontents (effluent), effectively diluting toxic wastes and dead cells. The addition and removal of fluids is adjusted tomaintain the culture in the logarithmic phase of growth. If aerobic bacteria are grown, suitable oxygen levels aremaintained.
• During which phase does growth occur at the fastest rate?
• Name two factors that limit microbial growth.
Measurement of Bacterial Growth
Estimating the number of bacterial cells in a sample, known as a bacterial count, is a common task performed bymicrobiologists. The number of bacteria in a clinical sample serves as an indication of the extent of an infection.Quality control of drinking water, food, medication, and even cosmetics relies on estimates of bacterial counts todetect contamination and prevent the spread of disease. Two major approaches are used to measure cell number.The direct methods involve counting cells, whereas the indirect methods depend on the measurement of cellpresence or activity without actually counting individual cells. Both direct and indirect methods have advantages anddisadvantages for specific applications.
Direct Cell Count
Direct cell count refers to counting the cells in a liquid culture or colonies on a plate. It is a direct way of estimating
368 Chapter 9 | Microbial Growth
This OpenStax book is available for free at http://cnx.org/content/col12087/1.5

how many organisms are present in a sample. Let’s look first at a simple and fast method that requires only aspecialized slide and a compound microscope.
The simplest way to count bacteria is called the direct microscopic cell count, which involves transferring a knownvolume of a culture to a calibrated slide and counting the cells under a light microscope. The calibrated slide is calleda Petroff-Hausser chamber (Figure 9.8) and is similar to a hemocytometer used to count red blood cells. Thecentral area of the counting chamber is etched into squares of various sizes. A sample of the culture suspension isadded to the chamber under a coverslip that is placed at a specific height from the surface of the grid. It is possibleto estimate the concentration of cells in the original sample by counting individual cells in a number of squares anddetermining the volume of the sample observed. The area of the squares and the height at which the coverslip ispositioned are specified for the chamber. The concentration must be corrected for dilution if the sample was dilutedbefore enumeration.
Figure 9.8 (a) A Petroff-Hausser chamber is a special slide designed for counting the bacterial cells in a measuredvolume of a sample. A grid is etched on the slide to facilitate precision in counting. (b) This diagram illustrates the gridof a Petroff-Hausser chamber, which is made up of squares of known areas. The enlarged view shows the squarewithin which bacteria (red cells) are counted. If the coverslip is 0.2 mm above the grid and the square has an area of0.04 mm2, then the volume is 0.008 mm3, or 0.000008 mL. Since there are 10 cells inside the square, the density ofbacteria is 10 cells/0.000008 mL, which equates to 1,250,000 cells/mL. (credit a: modification of work by Jeffrey M.Vinocur)
Cells in several small squares must be counted and the average taken to obtain a reliable measurement. Theadvantages of the chamber are that the method is easy to use, relatively fast, and inexpensive. On the downside, thecounting chamber does not work well with dilute cultures because there may not be enough cells to count.
Using a counting chamber does not necessarily yield an accurate count of the number of live cells because it isnot always possible to distinguish between live cells, dead cells, and debris of the same size under the microscope.However, newly developed fluorescence staining techniques make it possible to distinguish viable and dead bacteria.These viability stains (or live stains) bind to nucleic acids, but the primary and secondary stains differ in their abilityto cross the cytoplasmic membrane. The primary stain, which fluoresces green, can penetrate intact cytoplasmicmembranes, staining both live and dead cells. The secondary stain, which fluoresces red, can stain a cell only if thecytoplasmic membrane is considerably damaged. Thus, live cells fluoresce green because they only absorb the greenstain, whereas dead cells appear red because the red stain displaces the green stain on their nucleic acids (Figure9.9).
Chapter 9 | Microbial Growth 369

Figure 9.9 Fluorescence staining can be used to differentiate between viable and dead bacterial cells in a samplefor purposes of counting. Viable cells are stained green, whereas dead cells are stained red. (credit: modification ofwork by Panseri S, Cunha C, D’Alessandro T, Sandri M, Giavaresi G, Maracci M, Hung CT, Tampieri A)
Another technique uses an electronic cell counting device (Coulter counter) to detect and count the changes inelectrical resistance in a saline solution. A glass tube with a small opening is immersed in an electrolyte solution. Afirst electrode is suspended in the glass tube. A second electrode is located outside of the tube. As cells are drawnthrough the small aperture in the glass tube, they briefly change the resistance measured between the two electrodesand the change is recorded by an electronic sensor (Figure 9.10); each resistance change represents a cell. Themethod is rapid and accurate within a range of concentrations; however, if the culture is too concentrated, more thanone cell may pass through the aperture at any given time and skew the results. This method also does not differentiatebetween live and dead cells.
Direct counts provide an estimate of the total number of cells in a sample. However, in many situations, it is importantto know the number of live, or viable, cells. Counts of live cells are needed when assessing the extent of an infection,the effectiveness of antimicrobial compounds and medication, or contamination of food and water.
Figure 9.10 A Coulter counter is an electronic device that counts cells. It measures the change in resistance in anelectrolyte solution that takes place when a cell passes through a small opening in the inside container wall. Adetector automatically counts the number of cells passing through the opening. (credit b: modification of work byNational Institutes of Health)
370 Chapter 9 | Microbial Growth
This OpenStax book is available for free at http://cnx.org/content/col12087/1.5

• Why would you count the number of cells in more than one square in the Petroff-Hausser chamber toestimate cell numbers?
• In the viability staining method, why do dead cells appear red?
Plate Count
The viable plate count, or simply plate count, is a count of viable or live cells. It is based on the principle that viablecells replicate and give rise to visible colonies when incubated under suitable conditions for the specimen. The resultsare usually expressed as colony-forming units per milliliter (CFU/mL) rather than cells per milliliter because morethan one cell may have landed on the same spot to give rise to a single colony. Furthermore, samples of bacteriathat grow in clusters or chains are difficult to disperse and a single colony may represent several cells. Some cellsare described as viable but nonculturable and will not form colonies on solid media. For all these reasons, the viableplate count is considered a low estimate of the actual number of live cells. These limitations do not detract from theusefulness of the method, which provides estimates of live bacterial numbers.
Microbiologists typically count plates with 30–300 colonies. Samples with too few colonies (<30) do not givestatistically reliable numbers, and overcrowded plates (>300 colonies) make it difficult to accurately count individualcolonies. Also, counts in this range minimize occurrences of more than one bacterial cell forming a single colony.Thus, the calculated CFU is closer to the true number of live bacteria in the population.
There are two common approaches to inoculating plates for viable counts: the pour plate and the spread plate methods.Although the final inoculation procedure differs between these two methods, they both start with a serial dilution ofthe culture.
Serial Dilution
The serial dilution of a culture is an important first step before proceeding to either the pour plate or spread platemethod. The goal of the serial dilution process is to obtain plates with CFUs in the range of 30–300, and the processusually involves several dilutions in multiples of 10 to simplify calculation. The number of serial dilutions is chosenaccording to a preliminary estimate of the culture density. Figure 9.11 illustrates the serial dilution method.
A fixed volume of the original culture, 1.0 mL, is added to and thoroughly mixed with the first dilution tube solution,which contains 9.0 mL of sterile broth. This step represents a dilution factor of 10, or 1:10, compared with the originalculture. From this first dilution, the same volume, 1.0 mL, is withdrawn and mixed with a fresh tube of 9.0 mL ofdilution solution. The dilution factor is now 1:100 compared with the original culture. This process continues until aseries of dilutions is produced that will bracket the desired cell concentration for accurate counting. From each tube,a sample is plated on solid medium using either the pour plate method (Figure 9.12) or the spread plate method(Figure 9.13). The plates are incubated until colonies appear. Two to three plates are usually prepared from eachdilution and the numbers of colonies counted on each plate are averaged. In all cases, thorough mixing of sampleswith the dilution medium (to ensure the cell distribution in the tube is random) is paramount to obtaining reliableresults.
Chapter 9 | Microbial Growth 371

Figure 9.11 Serial dilution involves diluting a fixed volume of cells mixed with dilution solution using the previousdilution as an inoculum. The result is dilution of the original culture by an exponentially growing factor. (credit:modification of work by “Leberechtc”/Wikimedia Commons)
The dilution factor is used to calculate the number of cells in the original cell culture. In our example, an average of50 colonies was counted on the plates obtained from the 1:10,000 dilution. Because only 0.1 mL of suspension waspipetted on the plate, the multiplier required to reconstitute the original concentration is 10 × 10,000. The number ofCFU per mL is equal to 50 × 10 × 10,000 = 5,000,000. The number of bacteria in the culture is estimated as 5 millioncells/mL. The colony count obtained from the 1:1000 dilution was 389, well below the expected 500 for a 10-folddifference in dilutions. This highlights the issue of inaccuracy when colony counts are greater than 300 and more thanone bacterial cell grows into a single colony.
Figure 9.12 In the pour plate method of cell counting, the sample is mixed in liquid warm agar (45–50 °C) pouredinto a sterile Petri dish and further mixed by swirling. This process is repeated for each serial dilution prepared. Theresulting colonies are counted and provide an estimate of the number of cells in the original volume sampled.
372 Chapter 9 | Microbial Growth
This OpenStax book is available for free at http://cnx.org/content/col12087/1.5

Figure 9.13 In the spread plate method of cell counting, the sample is poured onto solid agar and then spread usinga sterile spreader. This process is repeated for each serial dilution prepared. The resulting colonies are counted andprovide an estimate of the number of cells in the original volume samples.
A very dilute sample—drinking water, for example—may not contain enough organisms to use either of the platecount methods described. In such cases, the original sample must be concentrated rather than diluted before plating.This can be accomplished using a modification of the plate count technique called the membrane filtrationtechnique. Known volumes are vacuum-filtered aseptically through a membrane with a pore size small enough to trapmicroorganisms. The membrane is transferred to a Petri plate containing an appropriate growth medium. Colonies arecounted after incubation. Calculation of the cell density is made by dividing the cell count by the volume of filteredliquid.
Watch this video (https://openstax.org/l/22serdilpltcvid) for demonstrations ofserial dilutions and spread plate techniques.
The Most Probable Number
The number of microorganisms in dilute samples is usually too low to be detected by the plate count methodsdescribed thus far. For these specimens, microbiologists routinely use the most probable number (MPN) method, astatistical procedure for estimating of the number of viable microorganisms in a sample. Often used for water and foodsamples, the MPN method evaluates detectable growth by observing changes in turbidity or color due to metabolicactivity.
A typical application of MPN method is the estimation of the number of coliforms in a sample of pond water.Coliforms are gram-negative rod bacteria that ferment lactose. The presence of coliforms in water is considered asign of contamination by fecal matter. For the method illustrated in Figure 9.14, a series of three dilutions of thewater sample is tested by inoculating five lactose broth tubes with 10 mL of sample, five lactose broth tubes with 1mL of sample, and five lactose broth tubes with 0.1 mL of sample. The lactose broth tubes contain a pH indicatorthat changes color from red to yellow when the lactose is fermented. After inoculation and incubation, the tubes areexamined for an indication of coliform growth by a color change in media from red to yellow. The first set of tubes(10-mL sample) showed growth in all the tubes; the second set of tubes (1 mL) showed growth in two tubes out offive; in the third set of tubes, no growth is observed in any of the tubes (0.1-mL dilution). The numbers 5, 2, and 0 arecompared with Figure B1 in Appendix B, which has been constructed using a probability model of the samplingprocedure. From our reading of the table, we conclude that 49 is the most probable number of bacteria per 100 mL of
Link to Learning
Chapter 9 | Microbial Growth 373

pond water.no lo
Figure 9.14 In the most probable number method, sets of five lactose broth tubes are inoculated with three differentvolumes of pond water: 10 mL, 1 mL, and 0.1mL. Bacterial growth is assessed through a change in the color of thebroth from red to yellow as lactose is fermented.
• What is a colony-forming unit?
• What two methods are frequently used to estimate bacterial numbers in water samples?
Indirect Cell Counts
Besides direct methods of counting cells, other methods, based on an indirect detection of cell density, are commonlyused to estimate and compare cell densities in a culture. The foremost approach is to measure the turbidity(cloudiness) of a sample of bacteria in a liquid suspension. The laboratory instrument used to measure turbidity iscalled a spectrophotometer (Figure 9.15). In a spectrophotometer, a light beam is transmitted through a bacterialsuspension, the light passing through the suspension is measured by a detector, and the amount of light passingthrough the sample and reaching the detector is converted to either percent transmission or a logarithmic value calledabsorbance (optical density). As the numbers of bacteria in a suspension increase, the turbidity also increases andcauses less light to reach the detector. The decrease in light passing through the sample and reaching the detector isassociated with a decrease in percent transmission and increase in absorbance measured by the spectrophotometer.
Measuring turbidity is a fast method to estimate cell density as long as there are enough cells in a sample to produceturbidity. It is possible to correlate turbidity readings to the actual number of cells by performing a viable platecount of samples taken from cultures having a range of absorbance values. Using these values, a calibration curve isgenerated by plotting turbidity as a function of cell density. Once the calibration curve has been produced, it can be
374 Chapter 9 | Microbial Growth
This OpenStax book is available for free at http://cnx.org/content/col12087/1.5
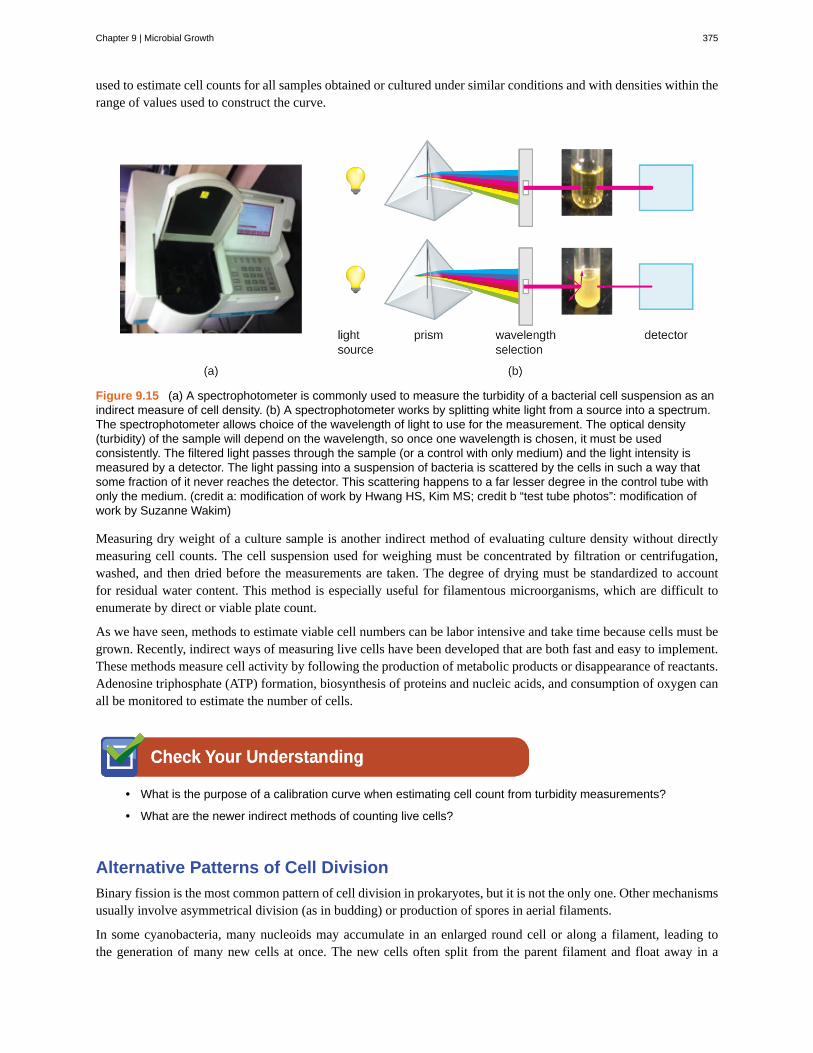
used to estimate cell counts for all samples obtained or cultured under similar conditions and with densities within therange of values used to construct the curve.
Figure 9.15 (a) A spectrophotometer is commonly used to measure the turbidity of a bacterial cell suspension as anindirect measure of cell density. (b) A spectrophotometer works by splitting white light from a source into a spectrum.The spectrophotometer allows choice of the wavelength of light to use for the measurement. The optical density(turbidity) of the sample will depend on the wavelength, so once one wavelength is chosen, it must be usedconsistently. The filtered light passes through the sample (or a control with only medium) and the light intensity ismeasured by a detector. The light passing into a suspension of bacteria is scattered by the cells in such a way thatsome fraction of it never reaches the detector. This scattering happens to a far lesser degree in the control tube withonly the medium. (credit a: modification of work by Hwang HS, Kim MS; credit b “test tube photos”: modification ofwork by Suzanne Wakim)
Measuring dry weight of a culture sample is another indirect method of evaluating culture density without directlymeasuring cell counts. The cell suspension used for weighing must be concentrated by filtration or centrifugation,washed, and then dried before the measurements are taken. The degree of drying must be standardized to accountfor residual water content. This method is especially useful for filamentous microorganisms, which are difficult toenumerate by direct or viable plate count.
As we have seen, methods to estimate viable cell numbers can be labor intensive and take time because cells must begrown. Recently, indirect ways of measuring live cells have been developed that are both fast and easy to implement.These methods measure cell activity by following the production of metabolic products or disappearance of reactants.Adenosine triphosphate (ATP) formation, biosynthesis of proteins and nucleic acids, and consumption of oxygen canall be monitored to estimate the number of cells.
• What is the purpose of a calibration curve when estimating cell count from turbidity measurements?
• What are the newer indirect methods of counting live cells?
Alternative Patterns of Cell Division
Binary fission is the most common pattern of cell division in prokaryotes, but it is not the only one. Other mechanismsusually involve asymmetrical division (as in budding) or production of spores in aerial filaments.
In some cyanobacteria, many nucleoids may accumulate in an enlarged round cell or along a filament, leading tothe generation of many new cells at once. The new cells often split from the parent filament and float away in a
Chapter 9 | Microbial Growth 375

process called fragmentation (Figure 9.16). Fragmentation is commonly observed in the Actinomycetes, a group ofgram-positive, anaerobic bacteria commonly found in soil. Another curious example of cell division in prokaryotes,reminiscent of live birth in animals, is exhibited by the giant bacterium Epulopiscium. Several daughter cells growfully in the parent cell, which eventually disintegrates, releasing the new cells to the environment. Other species mayform a long narrow extension at one pole in a process called budding. The tip of the extension swells and forms asmaller cell, the bud that eventually detaches from the parent cell. Budding is most common in yeast (Figure 9.16),but it is also observed in prosthecate bacteria and some cyanobacteria.
Figure 9.16 (a) Filamentous cyanobacteria, like those pictured here, replicate by fragmentation. (b) In this electronmicrograph, cells of the bacterium Gemmata obscuriglobus are budding. The larger cell is the mother cell. Labelsindicate the nucleoids (N) and the still-forming nuclear envelope (NE) of the daughter cell. (credit a: modification ofwork by CSIRO; credit b: modification of work by Kuo-Chang Lee, Rick I Webb and John A Fuerst)
The soil bacteria Actinomyces grow in long filaments divided by septa, similar to the mycelia seen in fungi, resultingin long cells with multiple nucleoids. Environmental signals, probably related to low nutrient availability, lead to theformation of aerial filaments. Within these aerial filaments, elongated cells divide simultaneously. The new cells,which contain a single nucleoid, develop into spores that give rise to new colonies.
• Identify at least one difference between fragmentation and budding.
Biofilms
In nature, microorganisms grow mainly in biofilms, complex and dynamic ecosystems that form on a variety ofenvironmental surfaces, from industrial conduits and water treatment pipelines to rocks in river beds. Biofilms arenot restricted to solid surface substrates, however. Almost any surface in a liquid environment containing someminimal nutrients will eventually develop a biofilm. Microbial mats that float on water, for example, are biofilmsthat contain large populations of photosynthetic microorganisms. Biofilms found in the human mouth may containhundreds of bacterial species. Regardless of the environment where they occur, biofilms are not random collections ofmicroorganisms; rather, they are highly structured communities that provide a selective advantage to their constituentmicroorganisms.
Biofilm Structure
Observations using confocal microscopy have shown that environmental conditions influence the overall structure ofbiofilms. Filamentous biofilms called streamers form in rapidly flowing water, such as freshwater streams, eddies,and specially designed laboratory flow cells that replicate growth conditions in fast-moving fluids. The streamers are
376 Chapter 9 | Microbial Growth
This OpenStax book is available for free at http://cnx.org/content/col12087/1.5

anchored to the substrate by a “head” and the “tail” floats downstream in the current. In still or slow-moving water,biofilms mainly assume a mushroom-like shape. The structure of biofilms may also change with other environmentalconditions such as nutrient availability.
Detailed observations of biofilms under confocal laser and scanning electron microscopes reveal clusters ofmicroorganisms embedded in a matrix interspersed with open water channels. The extracellular matrix consistsof extracellular polymeric substances (EPS) secreted by the organisms in the biofilm. The extracellular matrixrepresents a large fraction of the biofilm, accounting for 50%–90% of the total dry mass. The properties of the EPSvary according to the resident organisms and environmental conditions.
EPS is a hydrated gel composed primarily of polysaccharides and containing other macromolecules such as proteins,nucleic acids, and lipids. It plays a key role in maintaining the integrity and function of the biofilm. Channels in theEPS allow movement of nutrients, waste, and gases throughout the biofilm. This keeps the cells hydrated, preventingdesiccation. EPS also shelters organisms in the biofilm from predation by other microbes or cells (e.g., protozoans,white blood cells in the human body).
Biofilm Formation
Free-floating microbial cells that live in an aquatic environment are called planktonic cells. The formation of abiofilm essentially involves the attachment of planktonic cells to a substrate, where they become sessile (attached toa surface). This occurs in stages, as depicted in Figure 9.17. The first stage involves the attachment of planktoniccells to a surface coated with a conditioning film of organic material. At this point, attachment to the substrate isreversible, but as cells express new phenotypes that facilitate the formation of EPS, they transition from a planktonicto a sessile lifestyle. The biofilm develops characteristic structures, including an extensive matrix and water channels.Appendages such as fimbriae, pili, and flagella interact with the EPS, and microscopy and genetic analysis suggestthat such structures are required for the establishment of a mature biofilm. In the last stage of the biofilm life cycle,cells on the periphery of the biofilm revert to a planktonic lifestyle, sloughing off the mature biofilm to colonize newsites. This stage is referred to as dispersal.
Figure 9.17 Stages in the formation and life cycle of a biofilm. (credit: modification of work by Public Library ofScience and American Society for Microbiology)
Within a biofilm, different species of microorganisms establish metabolic collaborations in which the waste productof one organism becomes the nutrient for another. For example, aerobic microorganisms consume oxygen, creating
Chapter 9 | Microbial Growth 377

anaerobic regions that promote the growth of anaerobes. This occurs in many polymicrobial infections that involveboth aerobic and anaerobic pathogens.
The mechanism by which cells in a biofilm coordinate their activities in response to environmental stimuli is calledquorum sensing. Quorum sensing—which can occur between cells of different species within a biofilm—enablesmicroorganisms to detect their cell density through the release and binding of small, diffusible molecules calledautoinducers. When the cell population reaches a critical threshold (a quorum), these autoinducers initiate a cascadeof reactions that activate genes associated with cellular functions that are beneficial only when the population reachesa critical density. For example, in some pathogens, synthesis of virulence factors only begins when enough cells arepresent to overwhelm the immune defenses of the host. Although mostly studied in bacterial populations, quorumsensing takes place between bacteria and eukaryotes and between eukaryotic cells such as the fungus Candidaalbicans, a common member of the human microbiota that can cause infections in immunocompromised individuals.
The signaling molecules in quorum sensing belong to two major classes. Gram-negative bacteria communicate mainlyusing N-acylated homoserine lactones, whereas gram-positive bacteria mostly use small peptides (Figure 9.18). Inall cases, the first step in quorum sensing consists of the binding of the autoinducer to its specific receptor only whena threshold concentration of signaling molecules is reached. Once binding to the receptor takes place, a cascade ofsignaling events leads to changes in gene expression. The result is the activation of biological responses linked toquorum sensing, notably an increase in the production of signaling molecules themselves, hence the term autoinducer.
Figure 9.18 Short peptides in gram-positive bacteria and N-acetylated homoserine lactones in gram-negativebacteria act as autoinducers in quorum sensing and mediate the coordinated response of bacterial cells. The R sidechain of the N-acetylated homoserine lactone is specific for the species of gram-negative bacteria. Some secretedhomoserine lactones are recognized by more than one species.
Biofilms and Human Health
The human body harbors many types of biofilms, some beneficial and some harmful. For example, the layers ofnormal microbiota lining the intestinal and respiratory mucosa play a role in warding off infections by pathogens.However, other biofilms in the body can have a detrimental effect on health. For example, the plaque that forms onteeth is a biofilm that can contribute to dental and periodontal disease. Biofilms can also form in wounds, sometimescausing serious infections that can spread. The bacterium Pseudomonas aeruginosa often colonizes biofilms in theairways of patients with cystic fibrosis, causing chronic and sometimes fatal infections of the lungs. Biofilms can alsoform on medical devices used in or on the body, causing infections in patients with in-dwelling catheters, artificialjoints, or contact lenses.
Pathogens embedded within biofilms exhibit a higher resistance to antibiotics than their free-floating counterparts.Several hypotheses have been proposed to explain why. Cells in the deep layers of a biofilm are metabolically inactiveand may be less susceptible to the action of antibiotics that disrupt metabolic activities. The EPS may also slowthe diffusion of antibiotics and antiseptics, preventing them from reaching cells in the deeper layers of the biofilm.Phenotypic changes may also contribute to the increased resistance exhibited by bacterial cells in biofilms. Forexample, the increased production of efflux pumps, membrane-embedded proteins that actively extrude antibiotics outof bacterial cells, have been shown to be an important mechanism of antibiotic resistance among biofilm-associatedbacteria. Finally, biofilms provide an ideal environment for the exchange of extrachromosomal DNA, which often
378 Chapter 9 | Microbial Growth
This OpenStax book is available for free at http://cnx.org/content/col12087/1.5

includes genes that confer antibiotic resistance.
• What is the matrix of a biofilm composed of?
• What is the role of quorum sensing in a biofilm?
9.2 Oxygen Requirements for Microbial Growth
Learning Objectives• Interpret visual data demonstrating minimum, optimum, and maximum oxygen or carbon dioxide requirements
for growth
• Identify and describe different categories of microbes with requirements for growth with or without oxygen:obligate aerobe, obligate anaerobe, facultative anaerobe, aerotolerant anaerobe, microaerophile, and capnophile
• Give examples of microorganisms for each category of growth requirements
Ask most people “What are the major requirements for life?” and the answers are likely to include water and oxygen.Few would argue about the need for water, but what about oxygen? Can there be life without oxygen?
The answer is that molecular oxygen (O2) is not always needed. The earliest signs of life are dated to a period whenconditions on earth were highly reducing and free oxygen gas was essentially nonexistent. Only after cyanobacteriastarted releasing oxygen as a byproduct of photosynthesis and the capacity of iron in the oceans for taking up oxygenwas exhausted did oxygen levels increase in the atmosphere. This event, often referred to as the Great OxygenationEvent or the Oxygen Revolution, caused a massive extinction. Most organisms could not survive the powerfuloxidative properties of reactive oxygen species (ROS), highly unstable ions and molecules derived from partialreduction of oxygen that can damage virtually any macromolecule or structure with which they come in contact.Singlet oxygen (O2•), superoxide ⎛
⎝O2−⎞
⎠, peroxides (H2O2), hydroxyl radical (OH•), and hypochlorite ion (OCl−),
the active ingredient of household bleach, are all examples of ROS. The organisms that were able to detoxify reactiveoxygen species harnessed the high electronegativity of oxygen to produce free energy for their metabolism and thrivedin the new environment.
Oxygen Requirements of Microorganisms
Many ecosystems are still free of molecular oxygen. Some are found in extreme locations, such as deep in the oceanor in earth’s crust; others are part of our everyday landscape, such as marshes, bogs, and sewers. Within the bodiesof humans and other animals, regions with little or no oxygen provide an anaerobic environment for microorganisms.(Figure 9.19).
Chapter 9 | Microbial Growth 379

Figure 9.19 Anaerobic environments are still common on earth. They include environments like (a) a bog whereundisturbed dense sediments are virtually devoid of oxygen, and (b) the rumen (the first compartment of a cow’sstomach), which provides an oxygen-free incubator for methanogens and other obligate anaerobic bacteria. (credit a:modification of work by National Park Service; credit b: modification of work by US Department of Agriculture)
We can easily observe different requirements for molecular oxygen by growing bacteria in thioglycolate tubecultures. A test-tube culture starts with autoclaved thioglycolate medium containing a low percentage of agar toallow motile bacteria to move throughout the medium. Thioglycolate has strong reducing properties and autoclavingflushes out most of the oxygen. The tubes are inoculated with the bacterial cultures to be tested and incubated at anappropriate temperature. Over time, oxygen slowly diffuses throughout the thioglycolate tube culture from the top.Bacterial density increases in the area where oxygen concentration is best suited for the growth of that particularorganism.
The growth of bacteria with varying oxygen requirements in thioglycolate tubes is illustrated in Figure 9.20. In tubeA, all the growth is seen at the top of the tube. The bacteria are obligate (strict) aerobes that cannot grow withoutan abundant supply of oxygen. Tube B looks like the opposite of tube A. Bacteria grow at the bottom of tube B.Those are obligate anaerobes, which are killed by oxygen. Tube C shows heavy growth at the top of the tube andgrowth throughout the tube, a typical result with facultative anaerobes. Facultative anaerobes are organisms thatthrive in the presence of oxygen but also grow in its absence by relying on fermentation or anaerobic respiration, ifthere is a suitable electron acceptor other than oxygen and the organism is able to perform anaerobic respiration. Theaerotolerant anaerobes in tube D are indifferent to the presence of oxygen. They do not use oxygen because theyusually have a fermentative metabolism, but they are not harmed by the presence of oxygen as obligate anaerobes are.Tube E on the right shows a “Goldilocks” culture. The oxygen level has to be just right for growth, not too much andnot too little. These microaerophiles are bacteria that require a minimum level of oxygen for growth, about 1%–10%,well below the 21% found in the atmosphere.
Examples of obligate aerobes are Mycobacterium tuberculosis, the causative agent of tuberculosis and Micrococcusluteus, a gram-positive bacterium that colonizes the skin. Neisseria meningitidis, the causative agent of severebacterial meningitis, and N. gonorrhoeae, the causative agent of sexually transmitted gonorrhea, are also obligateaerobes.
380 Chapter 9 | Microbial Growth
This OpenStax book is available for free at http://cnx.org/content/col12087/1.5
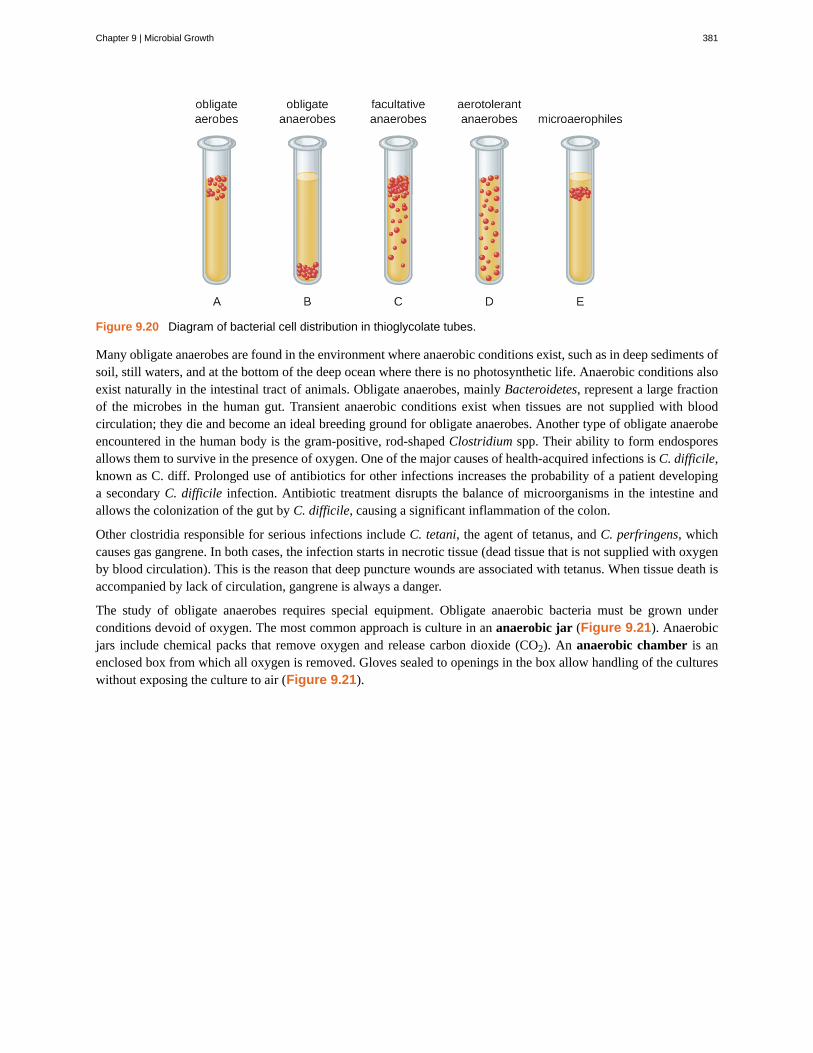
Figure 9.20 Diagram of bacterial cell distribution in thioglycolate tubes.
Many obligate anaerobes are found in the environment where anaerobic conditions exist, such as in deep sediments ofsoil, still waters, and at the bottom of the deep ocean where there is no photosynthetic life. Anaerobic conditions alsoexist naturally in the intestinal tract of animals. Obligate anaerobes, mainly Bacteroidetes, represent a large fractionof the microbes in the human gut. Transient anaerobic conditions exist when tissues are not supplied with bloodcirculation; they die and become an ideal breeding ground for obligate anaerobes. Another type of obligate anaerobeencountered in the human body is the gram-positive, rod-shaped Clostridium spp. Their ability to form endosporesallows them to survive in the presence of oxygen. One of the major causes of health-acquired infections is C. difficile,known as C. diff. Prolonged use of antibiotics for other infections increases the probability of a patient developinga secondary C. difficile infection. Antibiotic treatment disrupts the balance of microorganisms in the intestine andallows the colonization of the gut by C. difficile, causing a significant inflammation of the colon.
Other clostridia responsible for serious infections include C. tetani, the agent of tetanus, and C. perfringens, whichcauses gas gangrene. In both cases, the infection starts in necrotic tissue (dead tissue that is not supplied with oxygenby blood circulation). This is the reason that deep puncture wounds are associated with tetanus. When tissue death isaccompanied by lack of circulation, gangrene is always a danger.
The study of obligate anaerobes requires special equipment. Obligate anaerobic bacteria must be grown underconditions devoid of oxygen. The most common approach is culture in an anaerobic jar (Figure 9.21). Anaerobicjars include chemical packs that remove oxygen and release carbon dioxide (CO2). An anaerobic chamber is anenclosed box from which all oxygen is removed. Gloves sealed to openings in the box allow handling of the cultureswithout exposing the culture to air (Figure 9.21).
Chapter 9 | Microbial Growth 381

Figure 9.21 (a) An anaerobic jar is pictured that is holding nine Petri plates supporting cultures. (b) Openings in theside of an anaerobic box are sealed by glove-like sleeves that allow for the handling of cultures inside the box. (credita: modification of work by Centers for Disease Control and Prevention; credit b: modification of work by NIST)
Staphylococci and Enterobacteriaceae are examples of facultative anaerobes. Staphylococci are found on the skinand upper respiratory tract. Enterobacteriaceae are found primarily in the gut and upper respiratory tract but cansometimes spread to the urinary tract, where they are capable of causing infections. It is not unusual to see mixedbacterial infections in which the facultative anaerobes use up the oxygen, creating an environment for the obligateanaerobes to flourish.
Examples of aerotolerant anaerobes include lactobacilli and streptococci, both found in the oral microbiota.Campylobacter jejuni, which causes gastrointestinal infections, is an example of a microaerophile and is grown underlow-oxygen conditions.
The optimum oxygen concentration, as the name implies, is the ideal concentration of oxygen for a particularmicroorganism. The lowest concentration of oxygen that allows growth is called the minimum permissive oxygenconcentration. The highest tolerated concentration of oxygen is the maximum permissive oxygen concentration.The organism will not grow outside the range of oxygen levels found between the minimum and maximum permissiveoxygen concentrations.
• Would you expect the oldest bacterial lineages to be aerobic or anaerobic?
• Which bacteria grow at the top of a thioglycolate tube, and which grow at the bottom of the tube?
An Unwelcome Anaerobe
Charles is a retired bus driver who developed type 2 diabetes over 10 years ago. Since his retirement, hislifestyle has become very sedentary and he has put on a substantial amount of weight. Although he hasfelt tingling and numbness in his left foot for a while, he has not been worried because he thought his footwas simply “falling asleep.” Recently, a scratch on his foot does not seem to be healing and is becomingincreasingly ugly. Because the sore did not bother him much, Charles figured it could not be serious until hisdaughter noticed a purplish discoloration spreading on the skin and oozing (Figure 9.22). When he was finallyseen by his physician, Charles was rushed to the operating room. His open sore, or ulcer, is the result of adiabetic foot.
Case in Point
382 Chapter 9 | Microbial Growth
This OpenStax book is available for free at http://cnx.org/content/col12087/1.5

The concern here is that gas gangrene may have taken hold in the dead tissue. The most likely agent ofgas gangrene is Clostridium perfringens, an endospore-forming, gram-positive bacterium. It is an obligateanaerobe that grows in tissue devoid of oxygen. Since dead tissue is no longer supplied with oxygen by thecirculatory system, the dead tissue provides pockets of ideal environment for the growth of C. perfringens.
A surgeon examines the ulcer and radiographs of Charles’s foot and determines that the bone is not yetinfected. The wound will have to be surgically debrided (debridement refers to the removal of dead and infectedtissue) and a sample sent for microbiological lab analysis, but Charles will not have to have his foot amputated.Many diabetic patients are not so lucky. In 2008, nearly 70,000 diabetic patients in the United States lost a footor limb to amputation, according to statistics from the Centers for Disease Control and Prevention.[1]
• Which growth conditions would you recommend for the detection of C. perfringens?
Figure 9.22 This clinical photo depicts ulcers on the foot of a diabetic patient. Dead tissue accumulating inulcers can provide an ideal growth environment for the anaerobe C. perfringens, a causative agent of gasgangrene. (credit: Shigeo Kono, Reiko Nakagawachi, Jun Arata, Benjamin A Lipsky)
Detoxification of Reactive Oxygen Species
Aerobic respiration constantly generates reactive oxygen species (ROS), byproducts that must be detoxified. Evenorganisms that do not use aerobic respiration need some way to break down some of the ROS that may form fromatmospheric oxygen. Three main enzymes break down those toxic byproducts: superoxide dismutase, peroxidase, andcatalase. Each one catalyzes a different reaction. Reactions of type seen in Reaction 1 are catalyzed by peroxidases.
(1) X − (2H+) + H2 O2 → oxidized-X + 2H2 O
In these reactions, an electron donor (reduced compound; e.g., reduced nicotinamide adenine dinucleotide [NADH])oxidizes hydrogen peroxide, or other peroxides, to water. The enzymes play an important role by limiting the damagecaused by peroxidation of membrane lipids. Reaction 2 is mediated by the enzyme superoxide dismutase (SOD) andbreaks down the powerful superoxide anions generated by aerobic metabolism:
(2) 2O2− + 2H+ → H2 O2 + O2
The enzyme catalase converts hydrogen peroxide to water and oxygen as shown in Reaction 3.
(3) 2H2 O2 → 2H2 O + O2
Obligate anaerobes usually lack all three enzymes. Aerotolerant anaerobes do have SOD but no catalase. Reaction
1. Centers for Disease Control and Prevention. “Living With Diabetes: Keep Your Feet Healthy.” http://www.cdc.gov/Features/
DiabetesFootHealth/
Chapter 9 | Microbial Growth 383

3, shown occurring in Figure 9.23, is the basis of a useful and rapid test to distinguish streptococci, which areaerotolerant and do not possess catalase, from staphylococci, which are facultative anaerobes. A sample of culturerapidly mixed in a drop of 3% hydrogen peroxide will release bubbles if the culture is catalase positive.
Figure 9.23 The catalase test detects the presence of the enzyme catalase by noting whether bubbles are releasedwhen hydrogen peroxide is added to a culture sample. Compare the positive result (right) with the negative result(left). (credit: Centers for Disease Control and Prevention)
Bacteria that grow best in a higher concentration of CO2 and a lower concentration of oxygen than present in theatmosphere are called capnophiles. One common approach to grow capnophiles is to use a candle jar. A candle jarconsists of a jar with a tight-fitting lid that can accommodate the cultures and a candle. After the cultures are added tothe jar, the candle is lit and the lid closed. As the candle burns, it consumes most of the oxygen present and releasesCO2.
• What substance is added to a sample to detect catalase?
• What is the function of the candle in a candle jar?
Part 2
The health-care provider who saw Jeni was concerned primarily because of her pregnancy. Her conditionenhances the risk for infections and makes her more vulnerable to those infections. The immune systemis downregulated during pregnancy, and pathogens that cross the placenta can be very dangerous for thefetus. A note on the provider’s order to the microbiology lab mentions a suspicion of infection by Listeriamonocytogenes, based on the signs and symptoms exhibited by the patient.
Jeni’s blood samples are streaked directly on sheep blood agar, a medium containing tryptic soy agarenriched with 5% sheep blood. (Blood is considered sterile; therefore, competing microorganisms are notexpected in the medium.) The inoculated plates are incubated at 37 °C for 24 to 48 hours. Small grayishcolonies surrounded by a clear zone emerge. Such colonies are typical of Listeria and other pathogens suchas streptococci; the clear zone surrounding the colonies indicates complete lysis of blood in the medium,referred to as beta-hemolysis (Figure 9.24). When tested for the presence of catalase, the colonies give apositive response, eliminating Streptococcus as a possible cause. Furthermore, a Gram stain shows shortgram-positive bacilli. Cells from a broth culture grown at room temperature displayed the tumbling motility
Clinical Focus
384 Chapter 9 | Microbial Growth
This OpenStax book is available for free at http://cnx.org/content/col12087/1.5

characteristic of Listeria (Figure 9.24). All of these clues lead the lab to positively confirm the presence ofListeria in Jeni’s blood samples.
• How serious is Jeni’s condition and what is the appropriate treatment?
Figure 9.24 (a) A sample blood agar test showing beta-hemolysis. (b) A sample motility test showing bothpositive and negative results. (credit a: modification of work by Centers for Disease Control and Prevention;credit b: modification of work by “VeeDunn”/Flickr)
Jump to the next Clinical Focus box. Go back to the previous Clinical Focus box.
9.3 The Effects of pH on Microbial Growth
Learning Objectives• Illustrate and briefly describe minimum, optimum, and maximum pH requirements for growth
• Identify and describe the different categories of microbes with pH requirements for growth: acidophiles,neutrophiles, and alkaliphiles
• Give examples of microorganisms for each category of pH requirement
Yogurt, pickles, sauerkraut, and lime-seasoned dishes all owe their tangy taste to a high acid content (Figure 9.25).Recall that acidity is a function of the concentration of hydrogen ions [H+] and is measured as pH. Environments withpH values below 7.0 are considered acidic, whereas those with pH values above 7.0 are considered basic. ExtremepH affects the structure of all macromolecules. The hydrogen bonds holding together strands of DNA break up athigh pH. Lipids are hydrolyzed by an extremely basic pH. The proton motive force responsible for production ofATP in cellular respiration depends on the concentration gradient of H+ across the plasma membrane (see CellularRespiration). If H+ ions are neutralized by hydroxide ions, the concentration gradient collapses and impairs energyproduction. But the component most sensitive to pH in the cell is its workhorse, the protein. Moderate changes inpH modify the ionization of amino-acid functional groups and disrupt hydrogen bonding, which, in turn, promoteschanges in the folding of the molecule, promoting denaturation and destroying activity.
Chapter 9 | Microbial Growth 385

Figure 9.25 Lactic acid bacteria that ferment milk into yogurt or transform vegetables in pickles thrive at a pH closeto 4.0. Sauerkraut and dishes such as pico de gallo owe their tangy flavor to their acidity. Acidic foods have been amainstay of the human diet for centuries, partly because most microbes that cause food spoilage grow best at a nearneutral pH and do not tolerate acidity well. (credit “yogurt”: modification of work by “nina.jsc”/Flickr; credit “pickles”:modification of work by Noah Sussman; credit “sauerkraut”: modification of work by Jesse LaBuff; credit “pico degallo”: modification of work by “regan76”/Flickr)
The optimum growth pH is the most favorable pH for the growth of an organism. The lowest pH value that anorganism can tolerate is called the minimum growth pH and the highest pH is the maximum growth pH. Thesevalues can cover a wide range, which is important for the preservation of food and to microorganisms’ survival in thestomach. For example, the optimum growth pH of Salmonella spp. is 7.0–7.5, but the minimum growth pH is closerto 4.2.
Most bacteria are neutrophiles, meaning they grow optimally at a pH within one or two pH units of the neutralpH of 7 (see Figure 9.26). Most familiar bacteria, like Escherichia coli, staphylococci, and Salmonella spp. areneutrophiles and do not fare well in the acidic pH of the stomach. However, there are pathogenic strains of E. coli,S. typhi, and other species of intestinal pathogens that are much more resistant to stomach acid. In comparison, fungithrive at slightly acidic pH values of 5.0–6.0.
Microorganisms that grow optimally at pH less than 5.55 are called acidophiles. For example, the sulfur-oxidizingSulfolobus spp. isolated from sulfur mud fields and hot springs in Yellowstone National Park are extreme acidophiles.These archaea survive at pH values of 2.5–3.5. Species of the archaean genus Ferroplasma live in acid mine drainageat pH values of 0–2.9. Lactobacillus bacteria, which are an important part of the normal microbiota of the vagina, cantolerate acidic environments at pH values 3.5–6.8 and also contribute to the acidity of the vagina (pH of 4, except atthe onset of menstruation) through their metabolic production of lactic acid. The vagina’s acidity plays an importantrole in inhibiting other microbes that are less tolerant of acidity. Acidophilic microorganisms display a number ofadaptations to survive in strong acidic environments. For example, proteins show increased negative surface chargethat stabilizes them at low pH. Pumps actively eject H+ ions out of the cells. The changes in the composition ofmembrane phospholipids probably reflect the need to maintain membrane fluidity at low pH.
386 Chapter 9 | Microbial Growth
This OpenStax book is available for free at http://cnx.org/content/col12087/1.5

Figure 9.26 The curves show the approximate pH ranges for the growth of the different classes of pH-specificprokaryotes. Each curve has an optimal pH and extreme pH values at which growth is much reduced. Most bacteriaare neutrophiles and grow best at near-neutral pH (center curve). Acidophiles have optimal growth at pH values near3 and alkaliphiles have optimal growth at pH values above 9.
At the other end of the spectrum are alkaliphiles, microorganisms that grow best at pH between 8.0 and 10.5. Vibriocholerae, the pathogenic agent of cholera, grows best at the slightly basic pH of 8.0; it can survive pH values of11.0 but is inactivated by the acid of the stomach. When it comes to survival at high pH, the bright pink archaeanNatronobacterium, found in the soda lakes of the African Rift Valley, may hold the record at a pH of 10.5 (Figure9.27). Extreme alkaliphiles have adapted to their harsh environment through evolutionary modification of lipid andprotein structure and compensatory mechanisms to maintain the proton motive force in an alkaline environment. Forexample, the alkaliphile Bacillus firmus derives the energy for transport reactions and motility from a Na+ ion gradientrather than a proton motive force. Many enzymes from alkaliphiles have a higher isoelectric point, due to an increasein the number of basic amino acids, than homologous enzymes from neutrophiles.
Figure 9.27 View from space of Lake Natron in Tanzania. The pink color is due to the pigmentation of the extremealkaliphilic and halophilic microbes that colonize the lake. (credit: NASA)
Chapter 9 | Microbial Growth 387

Survival at the Low pH of the Stomach
Peptic ulcers (or stomach ulcers) are painful sores on the stomach lining. Until the 1980s, they were believed tobe caused by spicy foods, stress, or a combination of both. Patients were typically advised to eat bland foods,take anti-acid medications, and avoid stress. These remedies were not particularly effective, and the conditionoften recurred. This all changed dramatically when the real cause of most peptic ulcers was discovered to bea slim, corkscrew-shaped bacterium, Helicobacter pylori. This organism was identified and isolated by BarryMarshall and Robin Warren, whose discovery earned them the Nobel Prize in Medicine in 2005.
The ability of H. pylori to survive the low pH of the stomach would seem to suggest that it is an extremeacidophile. As it turns out, this is not the case. In fact, H. pylori is a neutrophile. So, how does it survive inthe stomach? Remarkably, H. pylori creates a microenvironment in which the pH is nearly neutral. It achievesthis by producing large amounts of the enzyme urease, which breaks down urea to form NH4
+ and CO2. Theammonium ion raises the pH of the immediate environment.
This metabolic capability of H. pylori is the basis of an accurate, noninvasive test for infection. The patient isgiven a solution of urea containing radioactively labeled carbon atoms. If H. pylori is present in the stomach,it will rapidly break down the urea, producing radioactive CO2 that can be detected in the patient’s breath.Because peptic ulcers may lead to gastric cancer, patients who are determined to have H. pylori infections aretreated with antibiotics.
• What effect do extremes of pH have on proteins?
• What pH-adaptive type of bacteria would most human pathogens be?
9.4 Temperature and Microbial Growth
Learning Objectives• Illustrate and briefly describe minimum, optimum, and maximum temperature requirements for growth
• Identify and describe different categories of microbes with temperature requirements for growth: psychrophile,psychrotrophs, mesophile, thermophile, hyperthermophile
• Give examples of microorganisms in each category of temperature tolerance
When the exploration of Lake Whillans started in Antarctica, researchers did not expect to find much life. Constantsubzero temperatures and lack of obvious sources of nutrients did not seem to be conditions that would supporta thriving ecosystem. To their surprise, the samples retrieved from the lake showed abundant microbial life. In adifferent but equally harsh setting, bacteria grow at the bottom of the ocean in sea vents (Figure 9.28), wheretemperatures can reach 340 °C (700 °F).
Microbes can be roughly classified according to the range of temperature at which they can grow. The growth ratesare the highest at the optimum growth temperature for the organism. The lowest temperature at which the organismcan survive and replicate is its minimum growth temperature. The highest temperature at which growth can occur isits maximum growth temperature. The following ranges of permissive growth temperatures are approximate onlyand can vary according to other environmental factors.
Organisms categorized as mesophiles (“middle loving”) are adapted to moderate temperatures, with optimal growth
Micro Connections
388 Chapter 9 | Microbial Growth
This OpenStax book is available for free at http://cnx.org/content/col12087/1.5

temperatures ranging from room temperature (about 20 °C) to about 45 °C. As would be expected from the coretemperature of the human body, 37 °C (98.6 °F), normal human microbiota and pathogens (e.g., E. coli, Salmonellaspp., and Lactobacillus spp.) are mesophiles.
Organisms called psychrotrophs, also known as psychrotolerant, prefer cooler environments, from a hightemperature of 25 °C to refrigeration temperature about 4 °C. They are found in many natural environments intemperate climates. They are also responsible for the spoilage of refrigerated food.
Resolution
The presence of Listeria in Jeni’s blood suggests that her symptoms are due to listeriosis, an infection causedby L. monocytogenes. Listeriosis is a serious infection with a 20% mortality rate and is a particular risk to Jeni’sfetus. A sample from the amniotic fluid cultured for the presence of Listeria gave negative results. Becausethe absence of organisms does not rule out the possibility of infection, a molecular test based on the nucleicacid amplification of the 16S ribosomal RNA of Listeria was performed to confirm that no bacteria crossed theplacenta. Fortunately, the results from the molecular test were also negative.
Jeni was admitted to the hospital for treatment and recovery. She received a high dose of two antibioticsintravenously for 2 weeks. The preferred drugs for the treatment of listeriosis are ampicillin or penicillin G withan aminoglycoside antibiotic. Resistance to common antibiotics is still rare in Listeria and antibiotic treatmentis usually successful. She was released to home care after a week and fully recovered from her infection.
L. monocytogenes is a gram-positive short rod found in soil, water, and food. It is classified as a psychrophileand is halotolerant. Its ability to multiply at refrigeration temperatures (4–10 °C) and its tolerance for highconcentrations of salt (up to 10% sodium chloride [NaCl]) make it a frequent source of food poisoning. BecauseListeria can infect animals, it often contaminates food such as meat, fish, or dairy products. Contamination ofcommercial foods can often be traced to persistent biofilms that form on manufacturing equipment that is notsufficiently cleaned.
Listeria infection is relatively common among pregnant women because the elevated levels of progesteronedownregulate the immune system, making them more vulnerable to infection. The pathogen can cross theplacenta and infect the fetus, often resulting in miscarriage, stillbirth, or fatal neonatal infection. Pregnantwomen are thus advised to avoid consumption of soft cheeses, refrigerated cold cuts, smoked seafood, andunpasteurized dairy products. Because Listeria bacteria can easily be confused with diphtheroids, anothercommon group of gram-positive rods, it is important to alert the laboratory when listeriosis is suspected.
Go back to the previous Clinical Focus box.
The organisms retrieved from arctic lakes such as Lake Whillans are considered extreme psychrophiles (cold loving).Psychrophiles are microorganisms that can grow at 0 °C and below, have an optimum growth temperature close to15 °C, and usually do not survive at temperatures above 20 °C. They are found in permanently cold environmentssuch as the deep waters of the oceans. Because they are active at low temperature, psychrophiles and psychrotrophsare important decomposers in cold climates.
Organisms that grow at optimum temperatures of 50 °C to a maximum of 80 °C are called thermophiles (“heatloving”). They do not multiply at room temperature. Thermophiles are widely distributed in hot springs, geothermalsoils, and manmade environments such as garden compost piles where the microbes break down kitchen scrapsand vegetal material. Examples of thermophiles include Thermus aquaticus and Geobacillus spp. Higher up on theextreme temperature scale we find the hyperthermophiles, which are characterized by growth ranges from 80 °C toa maximum of 110 °C, with some extreme examples that survive temperatures above 121 °C, the average temperatureof an autoclave. The hydrothermal vents at the bottom of the ocean are a prime example of extreme environments,with temperatures reaching an estimated 340 °C (Figure 9.28). Microbes isolated from the vents achieve optimalgrowth at temperatures higher than 100 °C. Noteworthy examples are Pyrobolus and Pyrodictium, archaea that grow
Clinical Focus
Chapter 9 | Microbial Growth 389

at 105 °C and survive autoclaving. Figure 9.29 shows the typical skewed curves of temperature-dependent growthfor the categories of microorganisms we have discussed.
Figure 9.28 A black smoker at the bottom of the ocean belches hot, chemical-rich water, and heats the surroundingwaters. Sea vents provide an extreme environment that is nonetheless teeming with macroscopic life (the redtubeworms) supported by an abundant microbial ecosystem. (credit: NOAA)
Figure 9.29 The graph shows growth rate of bacteria as a function of temperature. Notice that the curves areskewed toward the optimum temperature. The skewing of the growth curve is thought to reflect the rapid denaturationof proteins as the temperature rises past the optimum for growth of the microorganism.
Life in extreme environments raises fascinating questions about the adaptation of macromolecules and metabolicprocesses. Very low temperatures affect cells in many ways. Membranes lose their fluidity and are damaged byice crystal formation. Chemical reactions and diffusion slow considerably. Proteins become too rigid to catalyzereactions and may undergo denaturation. At the opposite end of the temperature spectrum, heat denatures proteinsand nucleic acids. Increased fluidity impairs metabolic processes in membranes. Some of the practical applications ofthe destructive effects of heat on microbes are sterilization by steam, pasteurization, and incineration of inoculatingloops. Proteins in psychrophiles are, in general, rich in hydrophobic residues, display an increase in flexibility, andhave a lower number of secondary stabilizing bonds when compared with homologous proteins from mesophiles.Antifreeze proteins and solutes that decrease the freezing temperature of the cytoplasm are common. The lipids inthe membranes tend to be unsaturated to increase fluidity. Growth rates are much slower than those encounteredat moderate temperatures. Under appropriate conditions, mesophiles and even thermophiles can survive freezing.
390 Chapter 9 | Microbial Growth
This OpenStax book is available for free at http://cnx.org/content/col12087/1.5

Liquid cultures of bacteria are mixed with sterile glycerol solutions and frozen to −80 °C for long-term storage asstocks. Cultures can withstand freeze drying (lyophilization) and then be stored as powders in sealed ampules to bereconstituted with broth when needed.
Macromolecules in thermophiles and hyperthermophiles show some notable structural differences from what isobserved in the mesophiles. The ratio of saturated to polyunsaturated lipids increases to limit the fluidity of thecell membranes. Their DNA sequences show a higher proportion of guanine–cytosine nitrogenous bases, whichare held together by three hydrogen bonds in contrast to adenine and thymine, which are connected in the doublehelix by two hydrogen bonds. Additional secondary ionic and covalent bonds, as well as the replacement of keyamino acids to stabilize folding, contribute to the resistance of proteins to denaturation. The so-called thermoenzymespurified from thermophiles have important practical applications. For example, amplification of nucleic acids in thepolymerase chain reaction (PCR) depends on the thermal stability of Taq polymerase, an enzyme isolated from T.aquaticus. Degradation enzymes from thermophiles are added as ingredients in hot-water detergents, increasing theireffectiveness.
• What temperature requirements do most bacterial human pathogens have?
• What DNA adaptation do thermophiles exhibit?
Feeding the World…and the World’s Algae
Artificial fertilizers have become an important tool in food production around the world. They are responsiblefor many of the gains of the so-called green revolution of the 20th century, which has allowed the planet tofeed many of its more than 7 billion people. Artificial fertilizers provide nitrogen and phosphorus, key limitingnutrients, to crop plants, removing the normal barriers that would otherwise limit the rate of growth. Thus,fertilized crops grow much faster, and farms that use fertilizer produce higher crop yields.
However, careless use and overuse of artificial fertilizers have been demonstrated to have significant negativeimpacts on aquatic ecosystems, both freshwater and marine. Fertilizers that are applied at inappropriate timesor in too-large quantities allow nitrogen and phosphorus compounds to escape use by crop plants and enterdrainage systems. Inappropriate use of fertilizers in residential settings can also contribute to nutrient loads,which find their way to lakes and coastal marine ecosystems. As water warms and nutrients are plentiful,microscopic algae bloom, often changing the color of the water because of the high cell density.
Most algal blooms are not directly harmful to humans or wildlife; however, they can cause harm indirectly. Asthe algal population expands and then dies, it provides a large increase in organic matter to the bacteria thatlive in deep water. With this large supply of nutrients, the population of nonphotosynthetic microorganismsexplodes, consuming available oxygen and creating “dead zones” where animal life has virtually disappeared.
Depletion of oxygen in the water is not the only damaging consequence of some algal blooms. The algaethat produce red tides in the Gulf of Mexico, Karenia brevis, secrete potent toxins that can kill fish andother organisms and also accumulate in shellfish. Consumption of contaminated shellfish can cause severeneurological and gastrointestinal symptoms in humans. Shellfish beds must be regularly monitored for thepresence of the toxins, and harvests are often shut down when it is present, incurring economic costs to thefishery. Cyanobacteria, which can form blooms in marine and freshwater ecosystems, produce toxins called
Eye on Ethics
Chapter 9 | Microbial Growth 391

microcystins, which can cause allergic reactions and liver damage when ingested in drinking water or duringswimming. Recurring cyanobacterial algal blooms in Lake Erie (Figure 9.30) have forced municipalities toissue drinking water bans for days at a time because of unacceptable toxin levels.
This is just a small sampling of the negative consequences of algal blooms, red tides, and dead zones. Yet thebenefits of crop fertilizer—the main cause of such blooms—are difficult to dispute. There is no easy solutionto this dilemma, as a ban on fertilizers is not politically or economically feasible. In lieu of this, we mustadvocate for responsible use and regulation in agricultural and residential contexts, as well as the restorationof wetlands, which can absorb excess fertilizers before they reach lakes and oceans.
Figure 9.30 Heavy rains cause runoff of fertilizers into Lake Erie, triggering extensive algal blooms, whichcan be observed along the shoreline. Notice the brown unplanted and green planted agricultural land on theshore. (credit: NASA)
This video (https://openstax.org/l/22algaebloomvid) discusses algal bloomsand dead zones in more depth.
9.5 Other Environmental Conditions that Affect Growth
Learning Objectives• Identify and describe different categories of microbes with specific growth requirements other than oxygen, pH,
and temperature, such as altered barometric pressure, osmotic pressure, humidity, and light
• Give at least one example microorganism for each category of growth requirement
Microorganisms interact with their environment along more dimensions than pH, temperature, and free oxygen levels,
Link to Learning
392 Chapter 9 | Microbial Growth
This OpenStax book is available for free at http://cnx.org/content/col12087/1.5

although these factors require significant adaptations. We also find microorganisms adapted to varying levels ofsalinity, barometric pressure, humidity, and light.
Osmotic and Barometric Pressure
Most natural environments tend to have lower solute concentrations than the cytoplasm of most microorganisms.Rigid cell walls protect the cells from bursting in a dilute environment. Not much protection is available againsthigh osmotic pressure. In this case, water, following its concentration gradient, flows out of the cell. This resultsin plasmolysis (the shrinking of the protoplasm away from the intact cell wall) and cell death. This fact explainswhy brines and layering meat and fish in salt are time-honored methods of preserving food. Microorganisms calledhalophiles (“salt loving”) actually require high salt concentrations for growth. These organisms are found in marineenvironments where salt concentrations hover at 3.5%. Extreme halophilic microorganisms, such as the red algaDunaliella salina and the archaeal species Halobacterium in Figure 9.31, grow in hypersaline lakes such as theGreat Salt Lake, which is 3.5–8 times saltier than the ocean, and the Dead Sea, which is 10 times saltier than theocean.
Figure 9.31 Photograph taken from space of the Great Salt Lake in Utah. The purple color is caused by high densityof the alga Dunaliella and the archaean Halobacterium spp. (credit: NASA)
Dunaliella spp. counters the tremendous osmotic pressure of the environment with a high cytoplasmic concentrationof glycerol and by actively pumping out salt ions. Halobacterium spp. accumulates large concentrations of K+ andother ions in its cytoplasm. Its proteins are designed for high salt concentrations and lose activity at salt concentrationsbelow 1–2 M. Although most halotolerant organisms, for example Halomonas spp. in salt marshes, do not needhigh concentrations of salt for growth, they will survive and divide in the presence of high salt. Not surprisingly, thestaphylococci, micrococci, and corynebacteria that colonize our skin tolerate salt in their environment. Halotolerantpathogens are an important cause of food-borne illnesses because they survive and multiply in salty food. Forexample, the halotolerant bacteria S. aureus, Bacillus cereus, and V. cholerae produce dangerous enterotoxins and aremajor causes of food poisoning.
Microorganisms depend on available water to grow. Available moisture is measured as water activity (aw), which isthe ratio of the vapor pressure of the medium of interest to the vapor pressure of pure distilled water; therefore, theaw of water is equal to 1.0. Bacteria require high aw (0.97–0.99), whereas fungi can tolerate drier environments; forexample, the range of aw for growth of Aspergillus spp. is 0.8–0.75. Decreasing the water content of foods by drying,as in jerky, or through freeze-drying or by increasing osmotic pressure, as in brine and jams, are common methods ofpreventing spoilage.
Chapter 9 | Microbial Growth 393

Microorganisms that require high atmospheric pressure for growth are called barophiles. The bacteria that live at thebottom of the ocean must be able to withstand great pressures. Because it is difficult to retrieve intact specimens andreproduce such growth conditions in the laboratory, the characteristics of these microorganisms are largely unknown.
Light
Photoautotrophs, such as cyanobacteria or green sulfur bacteria, and photoheterotrophs, such as purple nonsulfurbacteria, depend on sufficient light intensity at the wavelengths absorbed by their pigments to grow and multiply.Energy from light is captured by pigments and converted into chemical energy that drives carbon fixation and othermetabolic processes. The portion of the electromagnetic spectrum that is absorbed by these organisms is definedas photosynthetically active radiation (PAR). It lies within the visible light spectrum ranging from 400 to 700nanometers (nm) and extends in the near infrared for some photosynthetic bacteria. A number of accessory pigments,such as fucoxanthin in brown algae and phycobilins in cyanobacteria, widen the useful range of wavelengths forphotosynthesis and compensate for the low light levels available at greater depths of water. Other microorganisms,such as the archaea of the class Halobacteria, use light energy to drive their proton and sodium pumps. The lightis absorbed by a pigment protein complex called bacteriorhodopsin, which is similar to the eye pigment rhodopsin.Photosynthetic bacteria are present not only in aquatic environments but also in soil and in symbiosis with fungiin lichens. The peculiar watermelon snow is caused by a microalga Chlamydomonas nivalis, a green alga rich in asecondary red carotenoid pigment (astaxanthin) which gives the pink hue to the snow where the alga grows.
• Which photosynthetic pigments were described in this section?
• What is the fundamental stress of a hypersaline environment for a cell?
9.6 Media Used for Bacterial Growth
Learning Objectives• Identify and describe culture media for the growth of bacteria, including examples of all-purpose media,
enriched, selective, differential, defined, and enrichment media
The study of microorganisms is greatly facilitated if we are able to culture them, that is, to keep reproducingpopulations alive under laboratory conditions. Culturing many microorganisms is challenging because of highlyspecific nutritional and environmental requirements and the diversity of these requirements among different species.
Nutritional Requirements
The number of available media to grow bacteria is considerable. Some media are considered general all-purposemedia and support growth of a large variety of organisms. A prime example of an all-purpose medium is trypticsoy broth (TSB). Specialized media are used in the identification of bacteria and are supplemented with dyes, pHindicators, or antibiotics. One type, enriched media, contains growth factors, vitamins, and other essential nutrientsto promote the growth of fastidious organisms, organisms that cannot make certain nutrients and require them tobe added to the medium. When the complete chemical composition of a medium is known, it is called a chemicallydefined medium. For example, in EZ medium, all individual chemical components are identified and the exactamounts of each is known. In complex media, which contain extracts and digests of yeasts, meat, or plants, theprecise chemical composition of the medium is not known. Amounts of individual components are undetermined andvariable. Nutrient broth, tryptic soy broth, and brain heart infusion, are all examples of complex media.
Media that inhibit the growth of unwanted microorganisms and support the growth of the organism of interest by
394 Chapter 9 | Microbial Growth
This OpenStax book is available for free at http://cnx.org/content/col12087/1.5

supplying nutrients and reducing competition are called selective media. An example of a selective medium isMacConkey agar. It contains bile salts and crystal violet, which interfere with the growth of many gram-positivebacteria and favor the growth of gram-negative bacteria, particularly the Enterobacteriaceae. These species arecommonly named enterics, reside in the intestine, and are adapted to the presence of bile salts. The enrichmentcultures foster the preferential growth of a desired microorganism that represents a fraction of the organisms presentin an inoculum. For example, if we want to isolate bacteria that break down crude oil, hydrocarbonoclastic bacteria,sequential subculturing in a medium that supplies carbon only in the form of crude oil will enrich the cultures withoil-eating bacteria. The differential media make it easy to distinguish colonies of different bacteria by a changein the color of the colonies or the color of the medium. Color changes are the result of end products created byinteraction of bacterial enzymes with differential substrates in the medium or, in the case of hemolytic reactions, thelysis of red blood cells in the medium. In Figure 9.32, the differential fermentation of lactose can be observed onMacConkey agar. The lactose fermenters produce acid, which turns the medium and the colonies of strong fermentershot pink. The medium is supplemented with the pH indicator neutral red, which turns to hot pink at low pH. Selectiveand differential media can be combined and play an important role in the identification of bacteria by biochemicalmethods.
Figure 9.32 On this MacConkey agar plate, the lactose-fermenter E. coli colonies are bright pink. Serratiamarcescens, which does not ferment lactose, forms a cream-colored streak on the tan medium. (credit: AmericanSociety for Microbiology)
• Distinguish complex and chemically defined media.
• Distinguish selective and enrichment media.
Compare the compositions of EZ medium (https://openstax.org/l/22EZMedium) and sheep blood (https://openstax.org/l/22bloodagar) agar.
Link to Learning
Chapter 9 | Microbial Growth 395

The End-of-Year Picnic
The microbiology department is celebrating the end of the school year in May by holding its traditional picnicon the green. The speeches drag on for a couple of hours, but finally all the faculty and students can dig intothe food: chicken salad, tomatoes, onions, salad, and custard pie. By evening, the whole department, exceptfor two vegetarian students who did not eat the chicken salad, is stricken with nausea, vomiting, retching, andabdominal cramping. Several individuals complain of diarrhea. One patient shows signs of shock (low bloodpressure). Blood and stool samples are collected from patients, and an analysis of all foods served at the mealis conducted.
Bacteria can cause gastroenteritis (inflammation of the stomach and intestinal tract) either by colonizing andreplicating in the host, which is considered an infection, or by secreting toxins, which is considered intoxication.Signs and symptoms of infections are typically delayed, whereas intoxication manifests within hours, ashappened after the picnic.
Blood samples from the patients showed no signs of bacterial infection, which further suggests that this wasa case of intoxication. Since intoxication is due to secreted toxins, bacteria are not usually detected in bloodor stool samples. MacConkey agar and sorbitol-MacConkey agar plates and xylose-lysine-deoxycholate (XLD)plates were inoculated with stool samples and did not reveal any unusually colored colonies, and no blackcolonies or white colonies were observed on XLD. All lactose fermenters on MacConkey agar also fermentsorbitol. These results ruled out common agents of food-borne illnesses: E. coli, Salmonella spp., and Shigellaspp.
Analysis of the chicken salad revealed an abnormal number of gram-positive cocci arranged in clusters (Figure9.33). A culture of the gram-positive cocci releases bubbles when mixed with hydrogen peroxide. The cultureturned mannitol salt agar yellow after a 24-hour incubation.
All the tests point to Staphylococcus aureus as the organism that secreted the toxin. Samples from the saladshowed the presence of gram-positive cocci bacteria in clusters. The colonies were positive for catalase. Thebacteria grew on mannitol salt agar fermenting mannitol, as shown by the change to yellow of the medium.The pH indicator in mannitol salt agar is phenol red, which turns to yellow when the medium is acidified by theproducts of fermentation.
The toxin secreted by S. aureus is known to cause severe gastroenteritis. The organism was probablyintroduced into the salad during preparation by the food handler and multiplied while the salad was kept in thewarm ambient temperature during the speeches.
• What are some other factors that might have contributed to rapid growth of S. aureus in the chickensalad?
• Why would S. aureus not be inhibited by the presence of salt in the chicken salad?
Case in Point
396 Chapter 9 | Microbial Growth
This OpenStax book is available for free at http://cnx.org/content/col12087/1.5

Figure 9.33 Gram-positive cocci in clusters. (credit: Centers for Disease Control and Prevention)
Summary
9.1 How Microbes Grow• Most bacterial cells divide by binary fission. Generation time in bacterial growth is defined as the doubling
time of the population.
• Cells in a closed system follow a pattern of growth with four phases: lag, logarithmic (exponential),stationary, and death.
• Cells can be counted by direct viable cell count. The pour plate and spread plate methods are used toplate serial dilutions into or onto, respectively, agar to allow counting of viable cells that give rise to colony-forming units. Membrane filtration is used to count live cells in dilute solutions. The most probable cellnumber (MPN) method allows estimation of cell numbers in cultures without using solid media.
• Indirect methods can be used to estimate culture density by measuring turbidity of a culture or live celldensity by measuring metabolic activity.
• Other patterns of cell division include multiple nucleoid formation in cells; asymmetric division, as inbudding; and the formation of hyphae and terminal spores.
• Biofilms are communities of microorganisms enmeshed in a matrix of extracellular polymeric substance.The formation of a biofilm occurs when planktonic cells attach to a substrate and become sessile. Cells inbiofilms coordinate their activity by communicating through quorum sensing.
• Biofilms are commonly found on surfaces in nature and in the human body, where they may be beneficialor cause severe infections. Pathogens associated with biofilms are often more resistant to antibiotics anddisinfectants.
9.2 Oxygen Requirements for Microbial Growth• Aerobic and anaerobic environments can be found in diverse niches throughout nature, including different
sites within and on the human body.
• Microorganisms vary in their requirements for molecular oxygen. Obligate aerobes depend on aerobicrespiration and use oxygen as a terminal electron acceptor. They cannot grow without oxygen.
• Obligate anaerobes cannot grow in the presence of oxygen. They depend on fermentation and anaerobicrespiration using a final electron acceptor other than oxygen.
• Facultative anaerobes show better growth in the presence of oxygen but will also grow without it.
Chapter 9 | Microbial Growth 397

• Although aerotolerant anaerobes do not perform aerobic respiration, they can grow in the presence ofoxygen. Most aerotolerant anaerobes test negative for the enzyme catalase.
• Microaerophiles need oxygen to grow, albeit at a lower concentration than 21% oxygen in air.
• Optimum oxygen concentration for an organism is the oxygen level that promotes the fastest growth rate.The minimum permissive oxygen concentration and the maximum permissive oxygen concentration are,respectively, the lowest and the highest oxygen levels that the organism will tolerate.
• Peroxidase, superoxide dismutase, and catalase are the main enzymes involved in the detoxification of thereactive oxygen species. Superoxide dismutase is usually present in a cell that can tolerate oxygen. All threeenzymes are usually detectable in cells that perform aerobic respiration and produce more ROS.
• A capnophile is an organism that requires a higher than atmospheric concentration of CO2 to grow.
9.3 The Effects of pH on Microbial Growth• Bacteria are generally neutrophiles. They grow best at neutral pH close to 7.0.
• Acidophiles grow optimally at a pH near 3.0. Alkaliphiles are organisms that grow optimally between a pHof 8 and 10.5. Extreme acidophiles and alkaliphiles grow slowly or not at all near neutral pH.
• Microorganisms grow best at their optimum growth pH. Growth occurs slowly or not at all below theminimum growth pH and above the maximum growth pH.
9.4 Temperature and Microbial Growth• Microorganisms thrive at a wide range of temperatures; they have colonized different natural environments
and have adapted to extreme temperatures. Both extreme cold and hot temperatures require evolutionaryadjustments to macromolecules and biological processes.
• Psychrophiles grow best in the temperature range of 0–15 °C whereas psychrotrophs thrive between 4°Cand 25 °C.
• Mesophiles grow best at moderate temperatures in the range of 20 °C to about 45 °C. Pathogens are usuallymesophiles.
• Thermophiles and hyperthemophiles are adapted to life at temperatures above 50 °C.
• Adaptations to cold and hot temperatures require changes in the composition of membrane lipids and proteins.
9.5 Other Environmental Conditions that Affect Growth• Halophiles require high salt concentration in the medium, whereas halotolerant organisms can grow and
multiply in the presence of high salt but do not require it for growth.
• Halotolerant pathogens are an important source of foodborne illnesses because they contaminate foodspreserved in salt.
• Photosynthetic bacteria depend on visible light for energy.
• Most bacteria, with few exceptions, require high moisture to grow.
9.6 Media Used for Bacterial Growth• Chemically defined media contain only chemically known components.
• Selective media favor the growth of some microorganisms while inhibiting others.
• Enriched media contain added essential nutrients a specific organism needs to grow
• Differential media help distinguish bacteria by the color of the colonies or the change in the medium.
398 Chapter 9 | Microbial Growth
This OpenStax book is available for free at http://cnx.org/content/col12087/1.5

Multiple Choice
1. Which of the following methods would be used tomeasure the concentration of bacterial contamination inprocessed peanut butter?
a. turbidity measurementb. total plate countc. dry weight measurementd. direct counting of bacteria on a calibrated slide
under the microscope
2. In which phase would you expect to observe themost endospores in a Bacillus cell culture?
a. death phaseb. lag phasec. log phased. log, lag, and death phases would all have roughly
the same number of endospores.
3. During which phase would penicillin, an antibioticthat inhibits cell-wall synthesis, be most effective?
a. death phaseb. lag phasec. log phased. stationary phase
4. Which of the following is the best definition ofgeneration time in a bacterium?
a. the length of time it takes to reach the log phaseb. the length of time it takes for a population of
cells to doublec. the time it takes to reach stationary phased. the length of time of the exponential phase
5. What is the function of the Z ring in binary fission?a. It controls the replication of DNA.b. It forms a contractile ring at the septum.c. It separates the newly synthesized DNA
molecules.d. It mediates the addition of new peptidoglycan
subunits.
6. If a culture starts with 50 cells, how many cells willbe present after five generations with no cell death?
a. 200b. 400c. 1600d. 3200
7. Filamentous cyanobacteria often divide by which ofthe following?
a. buddingb. mitosisc. fragmentationd. formation of endospores
8. Which is a reason for antimicrobial resistance beinghigher in a biofilm than in free-floating bacterial cells?
a. The EPS allows faster diffusion of chemicals inthe biofilm.
b. Cells are more metabolically active at the base ofa biofilm.
c. Cells are metabolically inactive at the base of abiofilm.
d. The structure of a biofilm favors the survival ofantibiotic resistant cells.
9. Quorum sensing is used by bacterial cells todetermine which of the following?
a. the size of the populationb. the availability of nutrientsc. the speed of water flowd. the density of the population
10. Which of the following statements aboutautoinducers is incorrect?
a. They bind directly to DNA to activatetranscription.
b. They can activate the cell that secreted them.c. N-acylated homoserine lactones are autoinducers
in gram-negative cells.d. Autoinducers may stimulate the production of
virulence factors.
11. An inoculated thioglycolate medium culture tubeshows dense growth at the surface and turbiditythroughout the rest of the tube. What is your conclusion?
a. The organisms die in the presence of oxygenb. The organisms are facultative anaerobes.c. The organisms should be grown in an anaerobic
chamber.d. The organisms are obligate aerobes.
Review Questions
Chapter 9 | Microbial Growth 399

12. An inoculated thioglycolate medium culture tube isclear throughout the tube except for dense growth at thebottom of the tube. What is your conclusion?
a. The organisms are obligate anaerobes.b. The organisms are facultative anaerobes.c. The organisms are aerotolerant.d. The organisms are obligate aerobes.
13. Pseudomonas aeruginosa is a common pathogenthat infects the airways of patients with cystic fibrosis. Itdoes not grow in the absence of oxygen. The bacteriumis probably which of the following?
a. an aerotolerant anaerobeb. an obligate aerobec. an obligate anaerobed. a facultative anaerobe
14. Streptococcus mutans is a major cause of cavities.It resides in the gum pockets, does not have catalaseactivity, and can be grown outside of an anaerobicchamber. The bacterium is probably which of thefollowing?
a. a facultative anaerobeb. an obligate aerobec. an obligate anaerobed. an aerotolerant anaerobe
15. Why do the instructions for the growth of Neisseriagonorrhoeae recommend a CO2-enriched atmosphere?
a. It uses CO2 as a final electron acceptor inrespiration.
b. It is an obligate anaerobe.c. It is a capnophile.d. It fixes CO2 through photosynthesis.
16. Bacteria that grow in mine drainage at pH 1–2 areprobably which of the following?
a. alkaliphilesb. acidophilesc. neutrophilesd. obligate anaerobes
17. Bacteria isolated from Lake Natron, where thewater pH is close to 10, are which of the following?
a. alkaliphilesb. facultative anaerobesc. neutrophilesd. obligate anaerobes
18. In which environment are you most likely toencounter an acidophile?
a. human blood at pH 7.2b. a hot vent at pH 1.5c. human intestine at pH 8.5d. milk at pH 6.5
19. A soup container was forgotten in the refrigeratorand shows contamination. The contaminants areprobably which of the following?
a. thermophilesb. acidophilesc. mesophilesd. psychrotrophs
20. Bacteria isolated from a hot tub at 39 °C areprobably which of the following?
a. thermophilesb. psychrotrophsc. mesophilesd. hyperthermophiles
21. In which environment are you most likely toencounter a hyperthermophile?
a. hot tubb. warm ocean water in Floridac. hydrothermal vent at the bottom of the oceand. human body
22. Which of the following environments would harborpsychrophiles?
a. mountain lake with a water temperature of 12 °Cb. contaminated plates left in a 35 °C incubatorc. yogurt cultured at room temperatured. salt pond in the desert with a daytime
temperature of 34 °C
23. Which of the following is the reason jams anddried meats often do not require refrigeration to preventspoilage?
a. low pHb. toxic alkaline chemicalsc. naturally occurring antibioticsd. low water activity
24. Bacteria living in salt marshes are most likelywhich of the following?
a. acidophilesb. barophilesc. halotolerantd. thermophiles
400 Chapter 9 | Microbial Growth
This OpenStax book is available for free at http://cnx.org/content/col12087/1.5

25. EMB agar is a medium used in the identificationand isolation of pathogenic bacteria. It contains digestedmeat proteins as a source of organic nutrients. Twoindicator dyes, eosin and methylene blue, inhibit thegrowth of gram-positive bacteria and distinguishbetween lactose fermenting and nonlactose fermentingorganisms. Lactose fermenters form metallic green ordeep purple colonies, whereas the nonlactose fermentersform completely colorless colonies. EMB agar is anexample of which of the following?
a. a selective medium onlyb. a differential medium onlyc. a selective medium and a chemically defined
mediumd. a selective medium, a differential medium, and a
complex medium
26. Haemophilus influenzae must be grown onchocolate agar, which is blood agar treated with heat torelease growth factors in the medium. H. influenzae isdescribed as ________.
a. an acidophileb. a thermophilec. an obligate anaerobed. fastidious
Matching
27. Match the definition with the name of the growth phase in the growth curve.
___Number of dying cells is higher than the number of cells dividing A. Lag phase
___Number of new cells equal to number of dying cells B. Log phase
___New enzymes to use available nutrients are induced C. Stationary phase
___Binary fission is occurring at maximum rate D. Death phase
Chapter 9 | Microbial Growth 401

28. Four tubes are illustrated with cultures grown in a medium that slows oxygen diffusion. Match the culture tubewith the correct type of bacteria from the following list: facultative anaerobe, obligate anaerobe, microaerophile,aerotolerant anaerobe, obligate aerobe.
29. Match the type of bacterium with its environment. Each choice may be used once, more than once, or not at all.Put the appropriate letter beside the environment.
___psychotroph A. food spoiling in refrigerator
___mesophile B. hydrothermal vent
___thermophile C. deep ocean waters
___hyperthermophile D. human pathogen
___psychrophile E. garden compost
Fill in the Blank
30. Direct count of total cells can be performed using a ________ or a ________.
31. The ________ method allows direct count of total cells growing on solid medium.
32. A statistical estimate of the number of live cells in a liquid is usually done by ________.
33. For this indirect method of estimating the growth of a culture, you measure ________ using aspectrophotometer.
34. Active growth of a culture may be estimated indirectly by measuring the following products of cell metabolism:________ or ________.
35. A bacterium that thrives in a soda lake where the average pH is 10.5 can be classified as a(n) ________.
36. Lactobacillus acidophilus grows best at pH 4.5. It is considered a(n) ________.
37. A bacterium that thrives in the Great Salt Lake but not in fresh water is probably a ________.
38. Bacteria isolated from the bottom of the ocean need high atmospheric pressures to survive. They are ________.
39. Staphylococcus aureus can be grown on multipurpose growth medium or on mannitol salt agar that contains7.5% NaCl. The bacterium is ________.
40. Blood agar contains many unspecified nutrients, supports the growth of a large number of bacteria, and allowsdifferentiation of bacteria according to hemolysis (breakdown of blood). The medium is ________ and ________.
41. Rogosa agar contains yeast extract. The pH is adjusted to 5.2 and discourages the growth of manymicroorganisms; however, all the colonies look similar. The medium is ________ and ________.
402 Chapter 9 | Microbial Growth
This OpenStax book is available for free at http://cnx.org/content/col12087/1.5

Short Answer
42. Why is it important to measure the transmission of light through a control tube with only broth in it when makingturbidity measures of bacterial cultures?
43. In terms of counting cells, what does a plating method accomplish that an electronic cell counting method doesnot?
44. Order the following stages of the development of a biofilm from the earliest to the last step.a. secretion of EPSb. reversible attachmentc. dispersald. formation of water channelse. irreversible attachment
45. Infections among hospitalized patients are often related to the presence of a medical device in the patient. Whichconditions favor the formation of biofilms on in-dwelling catheters and prostheses?
46. Why are some obligate anaerobes able to grow in tissues (e.g., gum pockets) that are not completely free ofoxygen?
47. Why should Haemophilus influenzae be grown in a candle jar?
48. In terms of oxygen requirements, what type of organism would most likely be responsible for a foodborne illnessassociated with canned foods?
49. Which macromolecule in the cell is most sensitive to changes in pH?
50. Which metabolic process in the bacterial cell is particularly challenging at high pH?
51. How are hyperthermophile’s proteins adapted to the high temperatures of their environment?
52. Why would NASA be funding microbiology research in Antarctica?
53. Fish sauce is a salty condiment produced using fermentation. What type of organism is likely responsible for thefermentation of the fish sauce?
54. What is the major difference between an enrichment culture and a selective culture?
Critical Thinking
55. A patient in the hospital has an intravenous catheter inserted to allow for the delivery of medications, fluids,and electrolytes. Four days after the catheter is inserted, the patient develops a fever and an infection in the skinaround the catheter. Blood cultures reveal that the patient has a blood-borne infection. Tests in the clinical laboratoryidentify the blood-borne pathogen as Staphylococcus epidermidis, and antibiotic susceptibility tests are performedto provide doctors with essential information for selecting the best drug for treatment of the infection. Antibacterialchemotherapy is initiated and delivered through the intravenous catheter that was originally inserted into the patient.Within 7 days, the skin infection is gone, blood cultures are negative for S. epidermidis, and the antibacterialchemotherapy is discontinued. However, 2 days after discontinuing the antibacterial chemotherapy, the patientdevelops another fever and skin infection and the blood cultures are positive for the same strain of S. epidermidisthat had been isolated the previous week. This time, doctors remove the intravenous catheter and administer oralantibiotics, which successfully treat both the skin and blood-borne infection caused by S. epidermidis. Furthermore,the infection does not return after discontinuing the oral antibacterial chemotherapy. What are some possible reasonswhy intravenous chemotherapy failed to completely cure the patient despite laboratory tests showing the bacterialstrain was susceptible to the prescribed antibiotic? Why might the second round of antibiotic therapy have been moresuccessful? Justify your answers.
56. Why are autoinducers small molecules?
Chapter 9 | Microbial Growth 403

57. Refer to Figure B1 in Appendix B. If the results from a pond water sample were recorded as 3, 2, 1, whatwould be the MPN of bacteria in 100 mL of pond water?
58. Refer to Figure 9.15. Why does turbidity lose reliability at high cell concentrations when the culture reachesthe stationary phase?
59. A microbiology instructor prepares cultures for a gram-staining practical laboratory by inoculating growthmedium with a gram-positive coccus (nonmotile) and a gram-negative rod (motile). The goal is to demonstratestaining of a mixed culture. The flask is incubated at 35 °C for 24 hours without aeration. A sample is stained andreveals only gram-negative rods. Both cultures are known facultative anaerobes. Give a likely reason for success ofthe gram-negative rod. Assume that the cultures have comparable intrinsic growth rates.
60. People who use proton pumps inhibitors or antacids are more prone to infections of the gastrointestinal tract.Can you explain the observation in light of what you have learned?
61. The bacterium that causes Hansen’s disease (leprosy), Mycobacterium leprae, infects mostly the extremities ofthe body: hands, feet, and nose. Can you make an educated guess as to its optimum temperature of growth?
62. Refer to Figure 9.29. Some hyperthermophiles can survive autoclaving temperatures. Are they a concern inhealth care?
63. Haemophilus, influenzae grows best at 35–37 °C with ~5% CO2 (or in a candle-jar) and requires hemin (X factor)and nicotinamide-adenine-dinucleotide (NAD, also known as V factor) for growth.[2] Using the vocabulary learned inthis chapter, describe H. influenzae.
2. Centers for Disease Control and Prevention, World Health Organization. “CDC Laboratory Methods for the Diagnosis of Meningitis
Caused by Neisseria meningitidis, Streptococcus pneumoniae, and Haemophilus influenza. WHO Manual, 2nd edition.” 2011.
http://www.cdc.gov/meningitis/lab-manual/full-manual.pdf
404 Chapter 9 | Microbial Growth
This OpenStax book is available for free at http://cnx.org/content/col12087/1.5