Embed Size (px)
Citation preview
134 Cost Management
Chapter 9Joint Product and By-Product Costing
LEARNING OBJECTIVES
Chapter 9 addresses the following questions:
LO1 Describe a joint process, and explain the difference between a by-product and a main product.
LO2 Allocate joint costs.LO3 Explain the factors that are considered in choosing a joint cost allocation method.LO4 Identify the relevant information for deciding whether to process a joint product beyond
the split-off point.LO5 Apply the methods that are used to account for the sale of by-products.LO6 Explain how a sales mix affects joint cost allocations.LO7 Evaluate the uses and limitations of joint cost information.
These learning questions (LO1 through LO7) are cross-referenced in the textbook to individual exercises and problems.
© 2012 John Wiley and Sons Canada, Ltd.
135 Cost Management
QUESTIONS
9.1 Some goods are produced jointly; many products result from a common process. These are called joint products. Main products have high sales value relative to other products when split-off occurs. By-products have low sales value relative to the main products’ values.
9.2 Because all of the other products are sold at $200 or more, the product that sells for only $10 would probably be considered a by-product. Main products have relatively high sales values compared to by-products.
9.3 There are two methods of recognizing revenue from by-products. The revenue can be recognized at the split-off point, or recognized at the time of sale. The treatment depends on whether the NRV is positive or negative, and also on whether it is recognized at the time of production or sale. Negative NRV is always added to joint costs. When positive NRV is recognized at time of production, it is subtracted from joint costs. When positive NRV is recognized at time of sale, it may be treated as revenue, treated as non-revenue income, or subtracted from COGS.
9.4 Products from any of the following industries would be appropriate: oil and gas, chemical, lumber products, tour companies, meat production, wheat production, milling companies.
9.5 Joint costs are product costs that cannot be separately traced to individual products, so they are indirect with respect to individual products. Separable costs are the direct costs of producing separate products (but these costs may or may not be direct with respect to individual units).
9.6 The split-off point in a joint process occurs at the point when the individual joint products become separately identifiable. All costs incurred up to the split-off point are joint costs and (assuming no further split-off points) the costs that follow are separable costs identifiable with a specific joint product.
9.7 Here are a few examples; students may think of others that are also appropriate. A professor may do some consulting work that simultaneously generates ideas for a journal article (main product), a case for a book (main product), and a problem for an exam (by-product). A CA firm may work on client development that simultaneously produces prospective engagements for the auditing and tax services (all probably main products). A research scientist may have an individual project that results in twenty-two patentable items (some may be main products, some may be by-products, and some may be scrapped).
9.8 Once the joint product emerges, the joint cost should be viewed as a "sunk" cost; it is a past cost that should not influence subsequent product decisions. Further processing decisions should be made based on the additional revenues obtained in relation to the additional separable costs needed to obtain those revenues.
© 2012 John Wiley and Sons Canada, Ltd.
Chapter 9: Joint Product and By-Product Costing 136
9.9 If all joint products were sold in the period produced, costs might not need to be allocated. But for financial reporting, all production costs must be assigned to cost of goods sold and ending inventories of the joint products to match revenues and expenses.
9.10 The contribution of each product is the selling price less separable costs. Revenues and separable costs are relatively easy to identify and measure. Therefore accountants know each product’s contribution. However, if profit is defined to mean accounting income, all costs including fixed and joint costs are allocated. To allocate costs, an allocation base must be chosen. Different allocation bases result in different profit figures. Hence, the profitability of one joint product cannot be uniquely determined, but will vary with different allocation bases.
9.11 Because the products have relatively equal value, they should all be treated as main products.
9.12 To perform market based joint cost allocations (net realizable value and constant gross margin NRV), an estimate is made of the sales value of each product. Common and separable costs are known with reasonable certainty, but price may be estimated. If the market for goods is not volatile, the price can be determined from past experience. If prices change frequently, information sources such as competitor’s prices or a list of commodity prices could be used for estimates.
9.13 Following are qualitative factors that might influence managers to process a joint product beyond the split-off point. The organization may offer a product mix, and dropping one of the products could affect sales of other products, so a group of products are always processed further. An example of this would be meat related products. Even though round steak does not need to be processed further, some people want very lean hamburger and customers may shop elsewhere if lean hamburger is not sold. Manager preferences might affect the decision to process further. For example, managers of a dairy might have a preference for a particular type of cheese that other dairies do not produce, and so they continue producing it even though sales are low and the milk could be used for other products. Resource scarcity encourages managers to consider new processes for raw materials such as sawdust and wood chips. Environmental issues also influence joint product decisions. Sometimes companies choose to convert waste into a by-product that can be sold to avoid contributing to waste disposal. Another factor is the effect on employees and local communities. Managers may choose to continue additional processing even when the financial results are relatively weak to avoid closing production facilities and laying off employees.
9.14 Some by-products are valuable and could be stolen, and so internal controls and records are kept. For by-products that are unlikely to be stolen, no controls or records need to be kept. An example of a by-product that could be stolen is raw malachite, a by-product of copper production that can be further processed into cabochons for jewellery. An example of a by-product that would not need controls is whey from dairy product processing.
© 2012 John Wiley and Sons Canada, Ltd.

137 Cost Management
9.15 Some managers may be responsible for the success of certain main products. If the profit varies widely depending on the joint cost method used, managers of products with relatively large allocations of cost will feel that the system is unfair. It is possible that some products would even appear to be unprofitable under a particular joint cost allocation method, and managers would then be penalized unfairly. When allocated joint costs affect managers’ performance evaluations, then the “fairness” of the allocation becomes their concern.
© 2012 John Wiley and Sons Canada, Ltd.
Chapter 9: Joint Product and By-Product Costing 138
MULTIPLE-CHOICE QUESTIONS
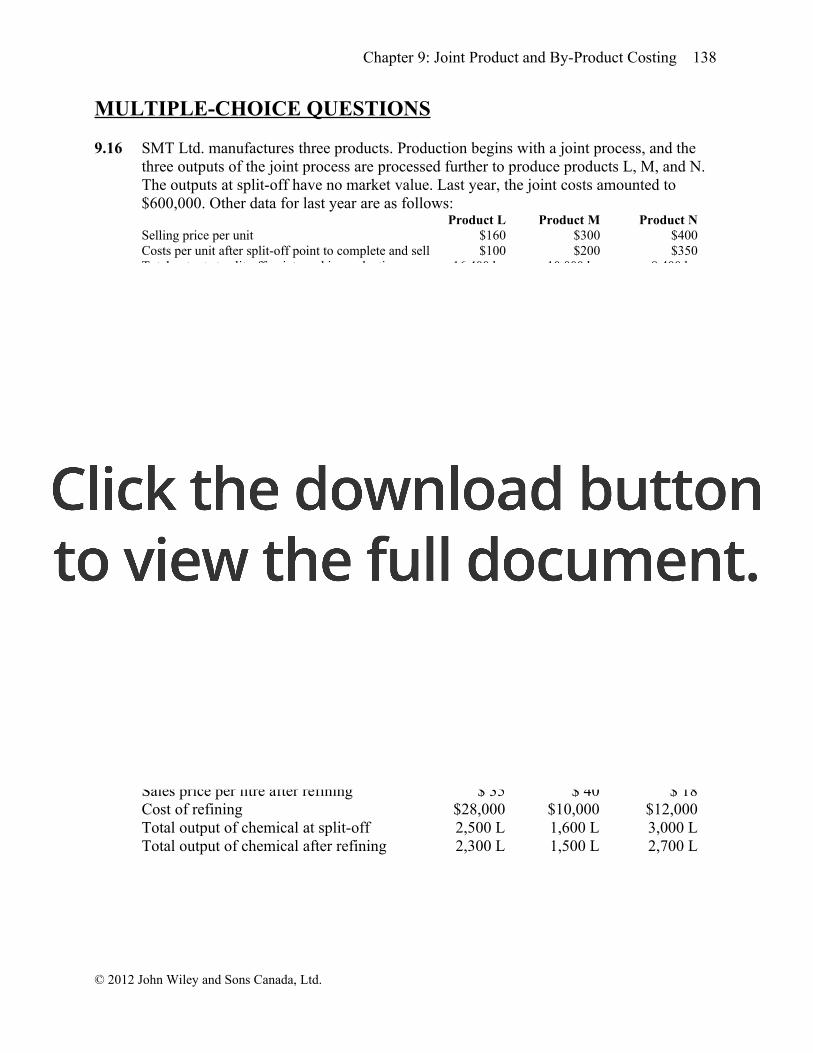
9.16 SMT Ltd. manufactures three products. Production begins with a joint process, and the three outputs of the joint process are processed further to produce products L, M, and N. The outputs at split-off have no market value. Last year, the joint costs amounted to $600,000. Other data for last year are as follows:
Product L Product M Product NSelling price per unit $160 $300 $400Costs per unit after split-off point to complete and sell $100 $200 $350Total output at split-off point used in production 16,400 kg 10,000 kg 8,400 kgProduction in units 20,000 10,000 7,000Sales in units 18,000 8,000 7,000
Using the estimated (approximate) net realizable value method of joint costing, the inventory cost per unit of product M is:a) $226.91b) $223.53c) $221.52d) $220.00e) $217.24
Ans: B [L: ($160-$100) * 20,000 = $1,200,000 NRV; M: ($300-$200)*10,000 = $1,000,000 NRV; N: ($400-$350) * 7,000 = $350,000 NRV; Total NRV = $1,200,000+$1,000,000+$350,000 = $2,550,000; M: $1,000,000/$2,550,000 * $6,000,000 = $235,294 allocated joint costsM: ($235,294/10,000 ) + $200 = $223.57 total unit costs.
The following information pertains to Questions 9.17 and 9.18:
Omega Company manufactures three chemicals in a joint process. The manufacturing costsof the joint process include $25,000 of direct materials and $35,000 of conversion costs. All threechemicals can be sold in their unrefined form immediately after the split-off point, or they canbe further refined before they are sold. During May, all three chemicals were further refined. Thefollowing table shows data regarding production for the month of May:
ChemicalA B C
Sales price per litre before refining $ 20 $ 25 $ 10Sales price per litre after refining $ 35 $ 40 $ 18Cost of refining $28,000 $10,000 $12,000Total output of chemical at split-off 2,500 L 1,600 L 3,000 LTotal output of chemical after refining 2,300 L 1,500 L 2,700 L
© 2012 John Wiley and Sons Canada, Ltd.

139 Cost Management
9.17 Using the sales value at split-off method, the total joint cost allocated to Chemical A in May(rounded to the nearest hundred dollars) is:a) $21,100b) $25,000c) $22,600d) $25,500e) $33,600
Ans: B ($20*2,500)/[($20*2,500)+($25*1,600)+($10*3,000)] * ($25,000+$35,000) = $25,000
9.18 Now assume that Omega Company uses the physical measures method, that the refining processfor Chemical C also produces a hazardous by-product that must be disposed of at a cost of $5 perlitre, and that refining 1,000 L of Chemical C results in 100 L of this by-product. For the monthof May, what effect would refining Chemical C have on Omega Company's profits as comparedwith its profits if Chemical C was sold at split-off without being further refined (rounded to thenearest $100)?a) $17,100 more profits by refiningb) $20,300 less profits by refiningc) $8,100 more profits by refiningd) $5,100 more profits by refininge) $8,400 less profits by refining
Ans: D ($18*2,700)-12,000-(300*$5) = $35,100; $35,100-($10*3,000) =$5,100
The following information pertains to Questions 9.19 and 9.20:
Omega Company manufactures three chemicals in a joint process. The manufacturing costsof the joint process include $25,000 of direct materials and $35,000 of conversion costs. Allthree chemicals are then processed further before they are sold. Other pertinent data are asfollows:
Chemicals Sales Value at Split-off Separable Costs Final Sales ValueA $50,000 $28,000 $100,000B 40,000 10,000 60,000C 30,000 12,000 40,000
9.19 Using the estimated net realizable value method, the joint costs allocated to ChemicalA would be:a) $16,800b) $25,000c) $28,800d) $30,000e) $33,600
Ans: C in thousands ($100-$28)/[($100-$28)+($60-$10) + ($40-$12)]*($25+$35)=$28.8
© 2012 John Wiley and Sons Canada, Ltd.

Chapter 9: Joint Product and By-Product Costing 140
9.20 The decision to process all three chemicals beyond the split-off point is suboptimal. If the optimaldecision had been made, the income of Omega Company would have improved by:a) $2,000b) $10,000c) $30,000d) $60,000
e) $12,000
Ans: A (Only C should not be processed passed split-off. Selling C at split-off will increase revenue by $2,000).
© 2012 John Wiley and Sons Canada, Ltd.
141 Cost Management
EXERCISES
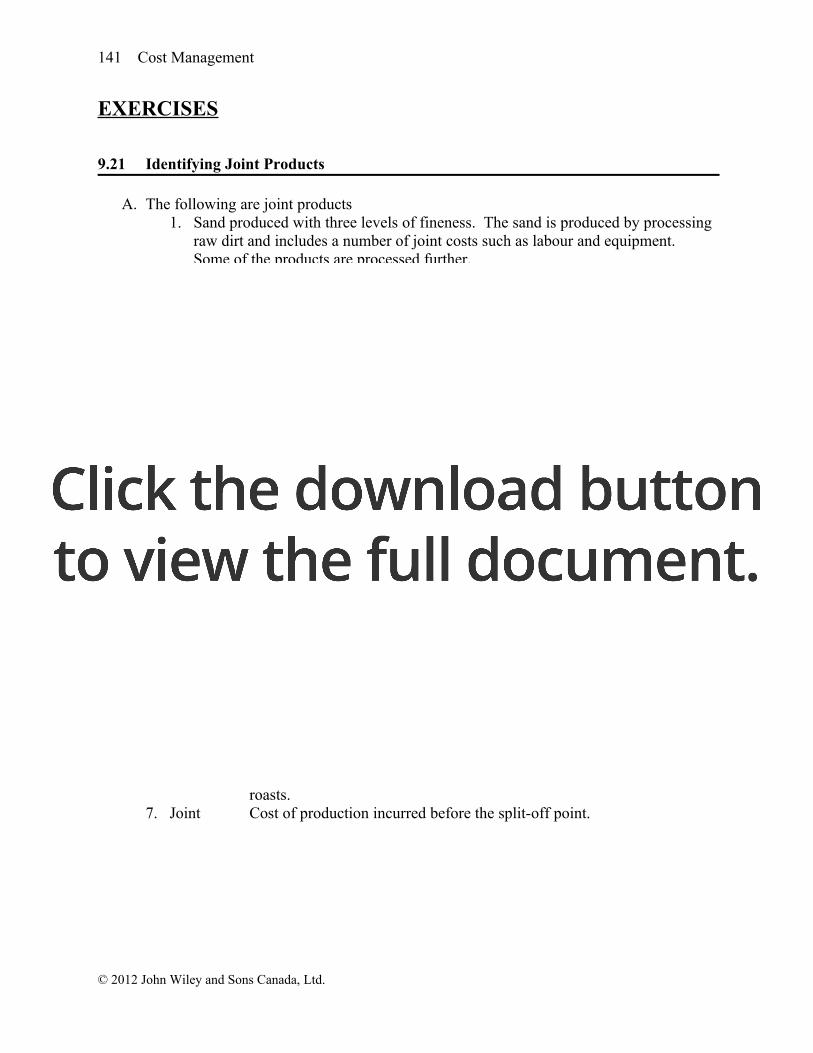
9.21 Identifying Joint Products
A. The following are joint products1. Sand produced with three levels of fineness. The sand is produced by processing
raw dirt and includes a number of joint costs such as labour and equipment. Some of the products are processed further.
3. Milk products are joint products because they all come from one liquid that is processed further, depending on the product.
6. Airlines could be considered as incurring joint costs because a large proportion of cost is common to all of the products.
The following are not joint products2. Automobiles and trucks because either one can be manufactured without
producing the other.4. Motorcycles and mopeds because either one can be manufactured without
producing the other.5. Clothing can be manufactured in any style without producing other styles and is
therefore not a joint product.
B. Two other product groups would include tour services or cruise lines, products manufactured from crude oil such as gasoline, diesel, and heating oil, and many types of food products such as beverage manufacture, cereals, milling operations, and so on.
9.22 Identifying Joint and Separable Costs - Cowboy Cattle Company
1. Joint All cattle require veterinary work, and the cost per specific cow is incurred before the split-off point.
2. Separable The cost occurs after the split-off point and can be traced directly to hamburger.
3. Joint The cost is incurred before the split-off point.4. Joint The cost is incurred before the split-off point.5. Separable The cost is incurred after the split-off point, specifically for leather.6. Separable The cost is incurred after the split-off point, specifically for steaks and
roasts.7. Joint Cost of production incurred before the split-off point.
© 2012 John Wiley and Sons Canada, Ltd.
Chapter 9: Joint Product and By-Product Costing 142
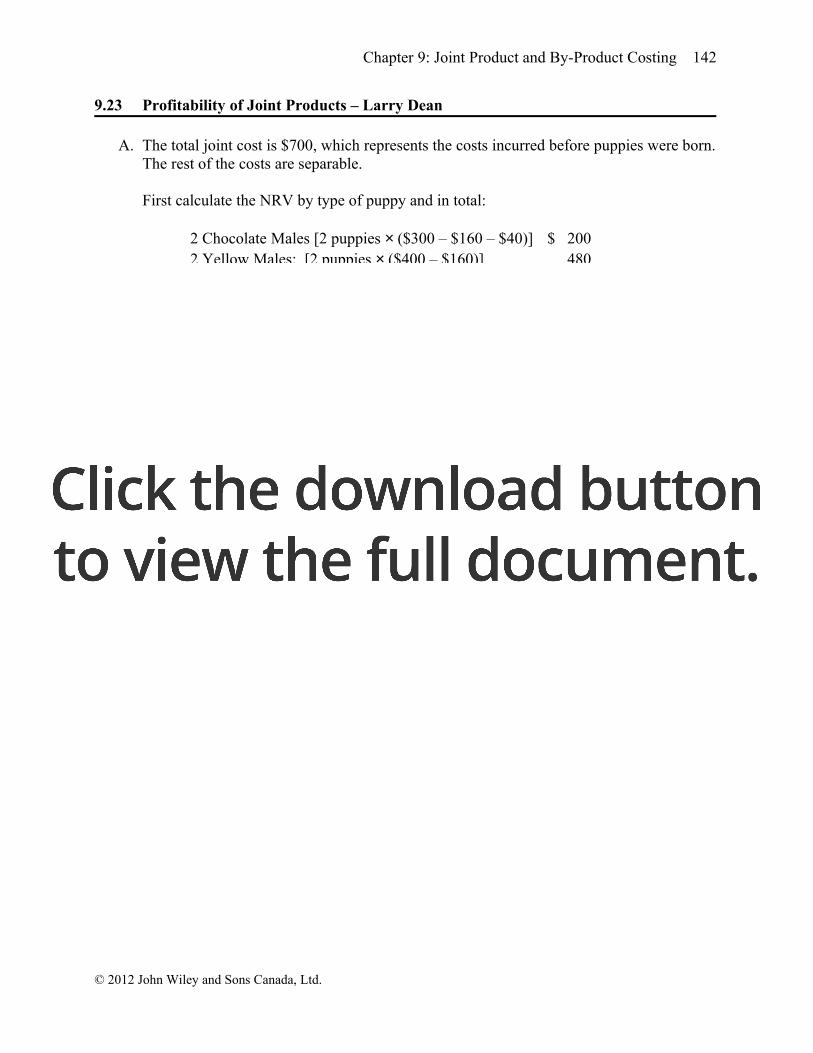
9.23 Profitability of Joint Products – Larry Dean
A. The total joint cost is $700, which represents the costs incurred before puppies were born. The rest of the costs are separable.
First calculate the NRV by type of puppy and in total:
2 Chocolate Males [2 puppies × ($300 – $160 – $40)] $ 2002 Yellow Males: [2 puppies × ($400 – $160)] 4802 Yellow Females: [2 puppies × ($450 – $160)] 580
Total NRV $1,260
Then use each product’s relative proportion of NRV to allocate the joint cost:
2 Chocolate Males [($200/$1,260) × $700] $111.112 Yellow Males [($480/$1,260) × $700] 266.672 Yellow Females [$580/$1,260 × $700] 322 .22
Total allocated $700 .00
B. Gross profit on sale of each puppy:
Chocolate Male [$300 – $160 – $40 – ($111.11)/2)] $ 44.44 per puppyYellow Male [$400 – $160 – ($266.67/2)] 106.67 per puppyYellow Female [$450 – $160 – ($322.22/2)] 128.89 per puppy
9.24 By-Product Further Processing Decision
According to the following calculations, the contribution margin is higher if the by-product is sold at the split-off point rather than processed further. Therefore, the by-product should not be processed further.
Sold at split-off: 100 x $8 = $800
Processed further: 100 x ($19 - $12) = $700
© 2012 John Wiley and Sons Canada, Ltd.
143 Cost Management
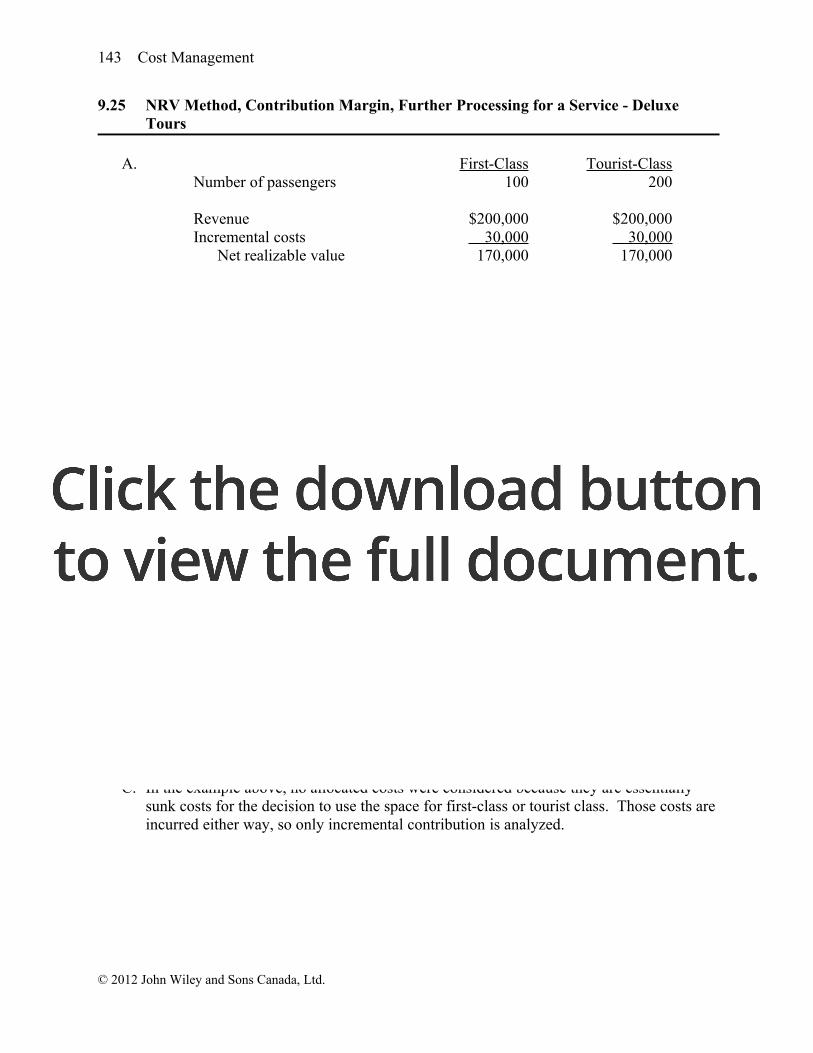
9.25 NRV Method, Contribution Margin, Further Processing for a Service - Deluxe Tours
A. First-Class Tourist-ClassNumber of passengers 100 200
Revenue $200,000 $200,000Incremental costs 30,000 30,000
Net realizable value 170,000 170,000Allocated lease cost 100,000 a 100,000 b
Margin $ 70,000 $ 70,000
a $200,000 lease cost * [$170,000/($170,000+$170,000] = $100,000b $200,000 lease cost * [$170,000/($170,000+$170,000] = $100,000
B. The answer to this question depends upon what is meant by “the contribution margin generated by first-class passengers.” An accountant could determine it is $70,000, the margin after deducting a share of the lease cost. However, a more accurate reflection would be $170 per passenger, the revenue generated by first-class passengers, less the incremental costs of serving those passengers.
An alternative answer is to consider the amount of margin generated by having a separate class of passengers rather than filling the entire cruise ship with tourist-class passengers. Assume that 25 tourist-class berths replaced 20 first-class berths. (Students could make any reasonable assumption concerning how many tourist-class berths would replace first-class berths.) So, the trade-off is 25 tourist-class versus 20 first-class berths.
Incremental contribution margin if first-class cabins are sold to tourist-class passengers:
Contribution per passenger for first-class: $200 - $30 = $170
Contribution per passenger for tourist-class: $100 - $15 = $85
Contribution for 20 first class passengers (20 x $170) $3,400Contribution for 25 tourist class passengers (25 x $85) 2,125
Additional contribution for first class $1,275
C. In the example above, no allocated costs were considered because they are essentially sunk costs for the decision to use the space for first-class or tourist class. Those costs are incurred either way, so only incremental contribution is analyzed.
© 2012 John Wiley and Sons Canada, Ltd.
Chapter 9: Joint Product and By-Product Costing 144
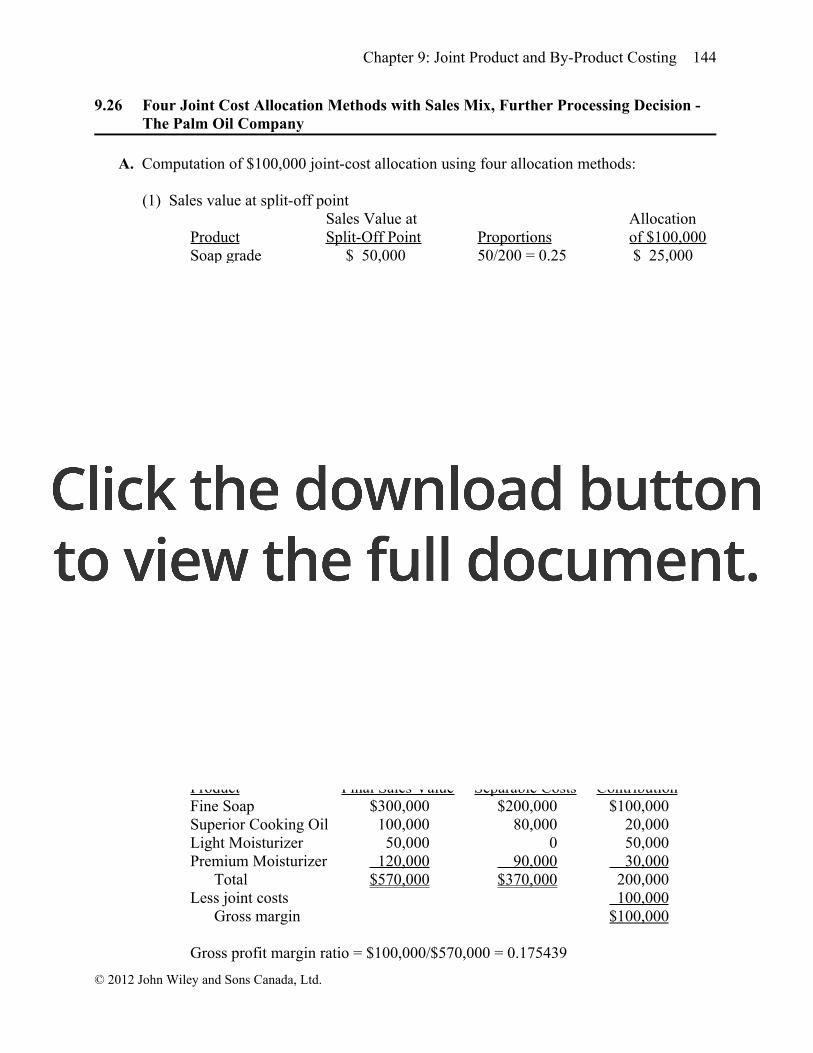
9.26 Four Joint Cost Allocation Methods with Sales Mix, Further Processing Decision - The Palm Oil Company
A. Computation of $100,000 joint-cost allocation using four allocation methods:
(1) Sales value at split-off pointSales Value at Allocation
Product Split-Off Point Proportions of $100,000Soap grade $ 50,000 50/200 = 0.25 $ 25,000Cooking grade 30,000 30/200 = 0.15 15,000Light moisturizer 50,000 50/200 = 0.25 25,000Heavy moisturizer 70,000 70/200 = 0.35 35,000
$200,000 $100,000
(2) Physical volumeAllocation
Physical volume Proportion of $100,000Soap grade 100,000 litres 100/500 = 0.20 $ 20,000Cooking grade 300,000 litres 300/500 = 0.60 60,000Light moisturizer 50,000 litres 50/500 = 0.10 10,000Heavy moisturizer 50,000litres 50/500 = 0.10 10,000
500,000litres $100,000
(3) Estimated Net Realizable ValueEstimated Net
Final Sales Separable Realizable AllocationProduct Value Costs Value Proportion of $100,000Fine Soap $300,000 $200,000 $100,000 100/200=0.50 $ 50,000Superior Cooking Oil 100,000 80,000 20,000 20/200=0.10 10,000Light moisturizer 50,000 0 50,000 50/200=0.25 25,000Premium Moisturizer 120,000 90,000 30,000 30/200=0.15 15,000
$200,000 $100,000
(4) Constant Gross Margin Method
First calculate the gross profit margin ratio for all products:
Product Final Sales Value Separable Costs ContributionFine Soap $300,000 $200,000 $100,000Superior Cooking Oil 100,000 80,000 20,000Light Moisturizer 50,000 0 50,000Premium Moisturizer 120,000 90,000 30,000
Total $570,000 $370,000 200,000Less joint costs 100,000
Gross margin $100,000
Gross profit margin ratio = $100,000/$570,000 = 0.175439
© 2012 John Wiley and Sons Canada, Ltd.
145 Cost Management
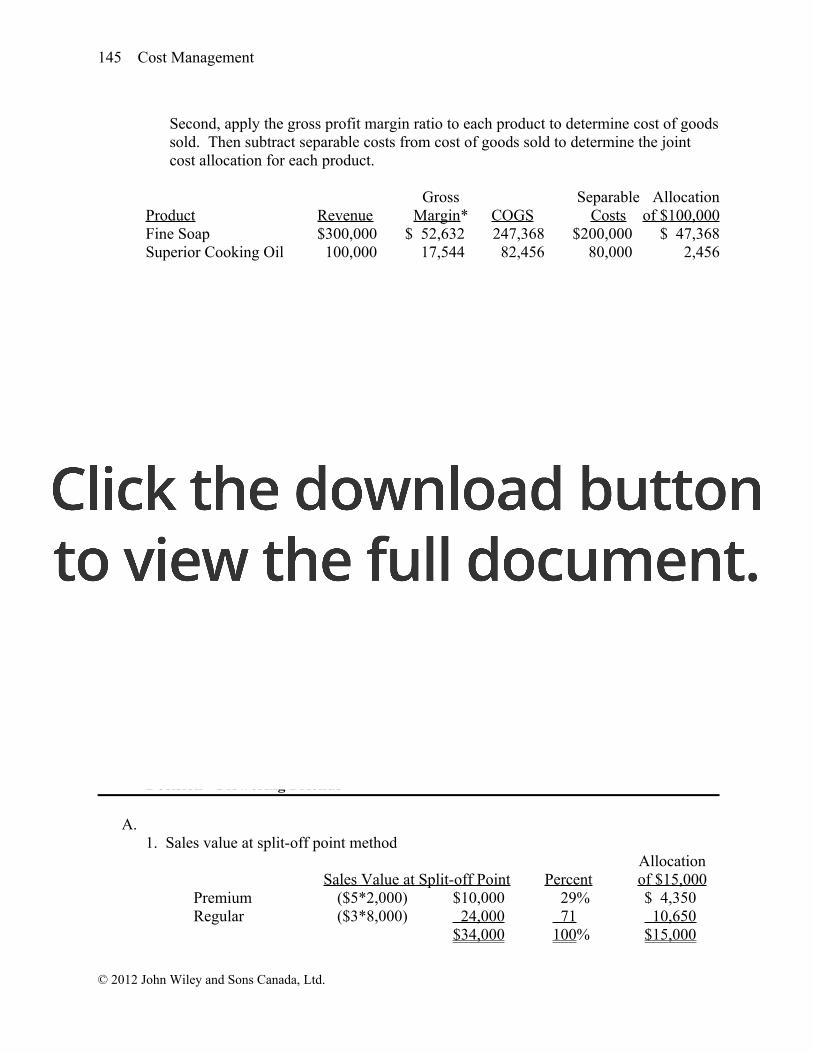
Second, apply the gross profit margin ratio to each product to determine cost of goods sold. Then subtract separable costs from cost of goods sold to determine the joint cost allocation for each product.
Gross Separable AllocationProduct Revenue Margin* COGS Costs of $100,000Fine Soap $300,000 $ 52,632 247,368 $200,000 $ 47,368Superior Cooking Oil 100,000 17,544 82,456 80,000 2,456Light Moisturizer 50,000 8,772 41,228 0 41,228Premium Moisturizer 120,000 21,052 98,948 90,000 8,948
$570,000 $100,000 $100,000
* Gross margin = Revenue x Gross profit margin ratio = Revenue x 0.175439
B.Contribution from Processing Soap Grade into Fine Soap:
Incremental revenue = $300,000 - 50,000 $250,000Incremental costs 200,000
Incremental operating income $ 50,000
Contribution from Processing Cooking grade oil into Superior Cooking Oil:Incremental revenue = $100,000 - 30,000 $ 70,000Incremental costs 80,000
Incremental operating income $(10,000)
Contribution from Processing Heavy Moisturizer into Premium Moisturizer:Incremental revenue = $120,000 - 70,000 $ 50,000Incremental costs 90,000
Incremental operating income $(40,000)
Operating income can be increased by $50,000 if both Cooking Grade Oil and Heavy Moisturizers are sold at the split-off point. Soap Grade should continue to be processed further.
9.27 Sales Value at Split-Off, Physical Output, NRV Methods,Further Processing Decision - Flowering Friends
A.1. Sales value at split-off point method
AllocationSales Value at Split-off Point Percent of $15,000
Premium ($5*2,000) $10,000 29% $ 4,350Regular ($3*8,000) 24,000 71 10,650
$34,000 100% $15,000
© 2012 John Wiley and Sons Canada, Ltd.
Chapter 9: Joint Product and By-Product Costing 146
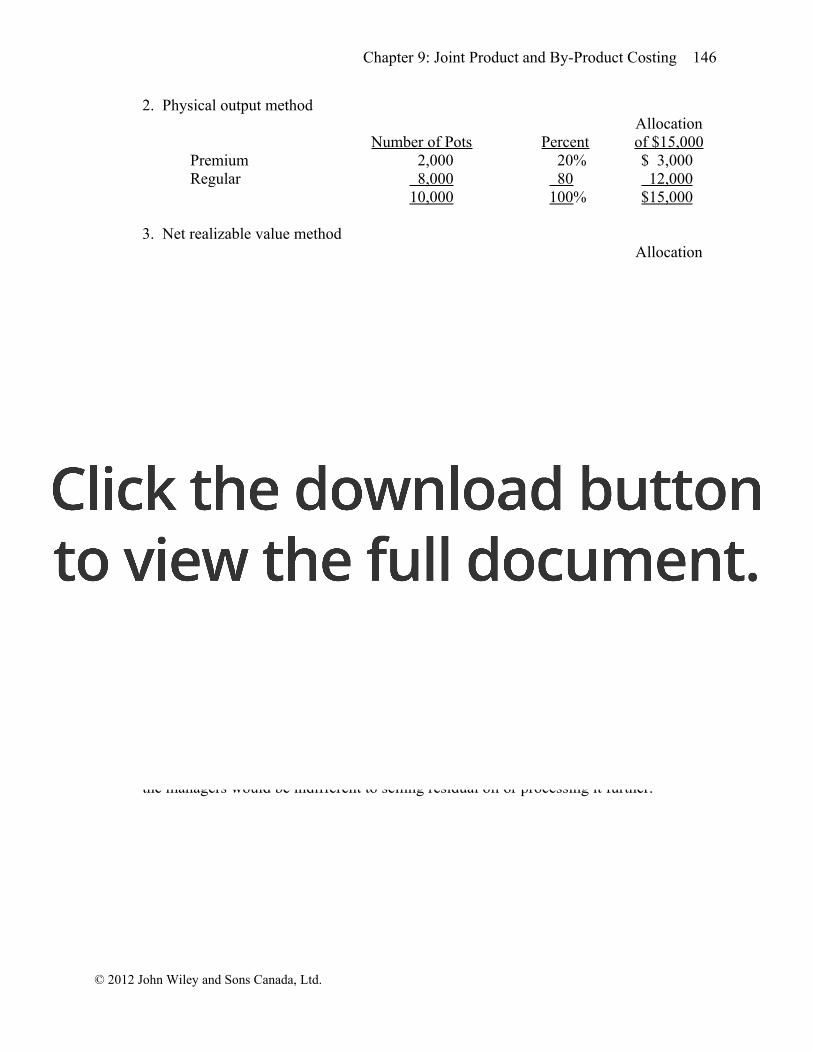
2. Physical output methodAllocation
Number of Pots Percent of $15,000Premium 2,000 20% $ 3,000Regular 8,000 80 12,000
10,000 100% $15,000
3. Net realizable value methodAllocation
Net Realizable Value Percent of $15,000Premium ($25*2,000) $ 50,000 38% $ 5,700Regular ($10*8,000) 80,000 62 9,300
$130,000 100% $15,000
B. Based on a comparison of the contributions for each alternative, the company should process further:
Sell as premium $25Process further ($35 – $20/4 - $3) 27
Extra contribution from processing further $ 2
9.28 NRV and Physical Output Methods, Further Processing Decision - Click and Clack Recyclers
A. There are no separable costs for these products, so each product’s net realizable value is the revenue per litre. However, one litre of oil yields 0.7 motor oil and 0.3 fuel oil, so for each litre of oil produced, the total NRV is 0.7*$3 + 0.3*$1.50 = $2.55. The total costs per litre are $0.75 + $1.25 = $2.00. The inventory cost per litre of residual fuel oil is ($1.50*0.3)/$2.55*$2.00 = $0.3529
B. If allocated cost were based on physical output, the cost per litre for residual fuel oil is 0.3*$2.00 = $0.60.
C. Special fuel would need to match the contribution for residual fuel oil. The contribution for residual fuel oil is $1.50 per litre. The minimum acceptable price for Special Fuel Oil is $1.50 plus the $0.40 per litre for additional processes or $1.90 per litre. At this price the managers would be indifferent to selling residual oil or processing it further.
© 2012 John Wiley and Sons Canada, Ltd.
147 Cost Management
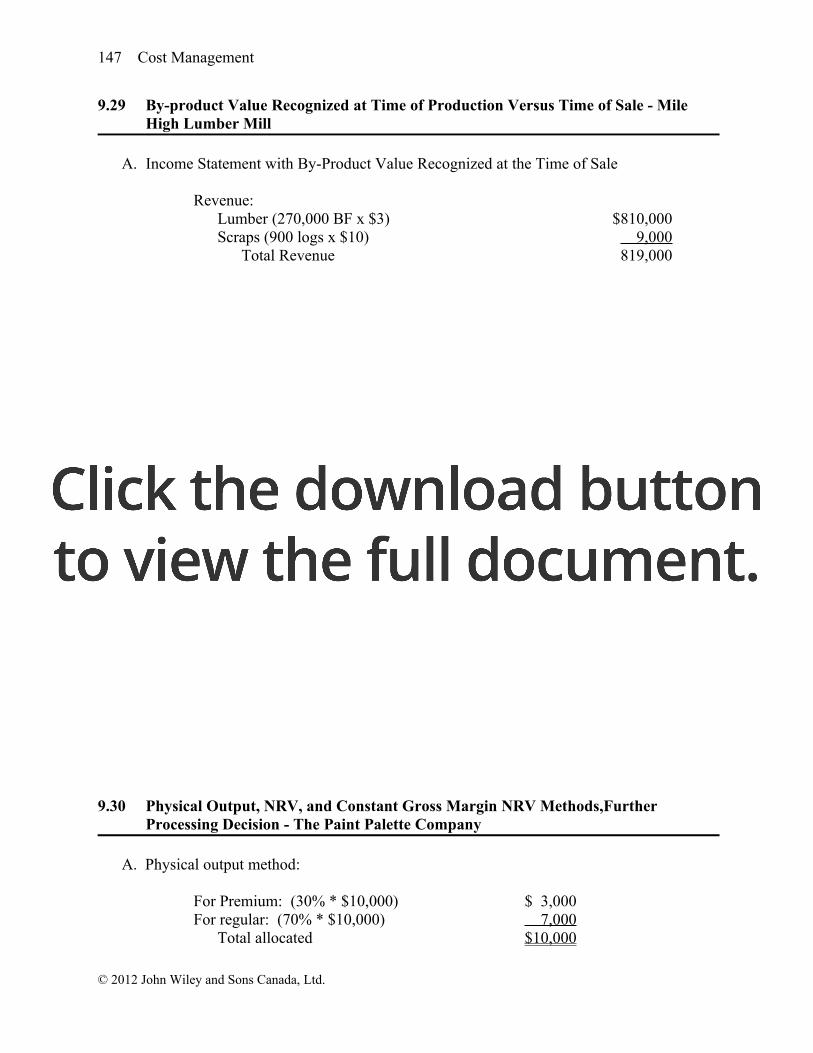
9.29 By-product Value Recognized at Time of Production Versus Time of Sale - Mile High Lumber Mill
A. Income Statement with By-Product Value Recognized at the Time of Sale
Revenue:Lumber (270,000 BF x $3) $810,000Scraps (900 logs x $10) 9,000
Total Revenue 819,000Cost of Goods Sold (270,000BF x $2a) 540,000
Gross Margin $279,000
a Cost is calculated as follows: $600,000/300,000 bd ft = $2 per BF
B. Income Statement with By-Product Value Recognized at the Time of Production
Value of inventory for the main product:
Joint product costs incurred $600,000Less NRV of by-product (1,000 logs x $10) 10,000
Net joint product cost $590,000
Product cost per board foot ($590,000/300,000 bd ft) $1.966667
Income statement:
Revenue (270,000 BF x $3.00) $810,000Cost of Goods Sold (270,000 BF x $1.966667) 531,000
Gross Margin $279,000
Notice that there is no difference between gross margins under the two methods. This will be true only under rigid conditions: (1) the proportion of main products sold is equal to the proportion of by-products sold during the period, and (2) there is either no beginning inventory or by-products in beginning inventory are sold for the exact amount estimated during the prior period. However, as long as by-product values are immaterial, the methods have little effect on the income statement and balance sheet.
9.30 Physical Output, NRV, and Constant Gross Margin NRV Methods,Further Processing Decision - The Paint Palette Company
A. Physical output method:
For Premium: (30% * $10,000) $ 3,000For regular: (70% * $10,000) 7,000
Total allocated $10,000
© 2012 John Wiley and Sons Canada, Ltd.

Chapter 9: Joint Product and By-Product Costing 148
B. NRV method
For premium [30%*4,000 litres * ($5 - $1)] $ 4,800For regular [70%*4,000 litres * ($2.5 – $.25)] 6,300
Total NRV $11,100
Allocation:
Allocated to premium ($4,800/$11,100)*$10,000 $ 4,324Allocated to regular ($6,300/$11,100)*$10,000 5,676
Total allocated costs $10,000
C. Constant Gross Margin NRV Method
First, determine gross margin percentage:
Total revenue (30%*4,000*$5)+ (70%*4,000*$2.5) $13,000Less:
Separable costs ($1*4,000*30%) + ($.25*4,000*70%) $ 1,900Common costs 10,000 11,900
Gross margin $ 1,100
Gross margin percentage ($1,100/$13,000) 8.46153%
Next, allocate common cost:Premium Regular Total
Revenue $6,000 $7,000 $13,000Gross Margin (508) (592) (1,100)Separable costs (1,200) (700) (1,900)
Allocated Common Cost $4,292 $5,708 $10,000
D. Compare the contribution per litre of the two alternatives:
Contribution per litre if processed further ($22 - $11 - $1) $10Continue with current process: ($10 - $.25x4) 9
Increase in contribution per litre if process further $ 1
© 2012 John Wiley and Sons Canada, Ltd.
149 Cost Management
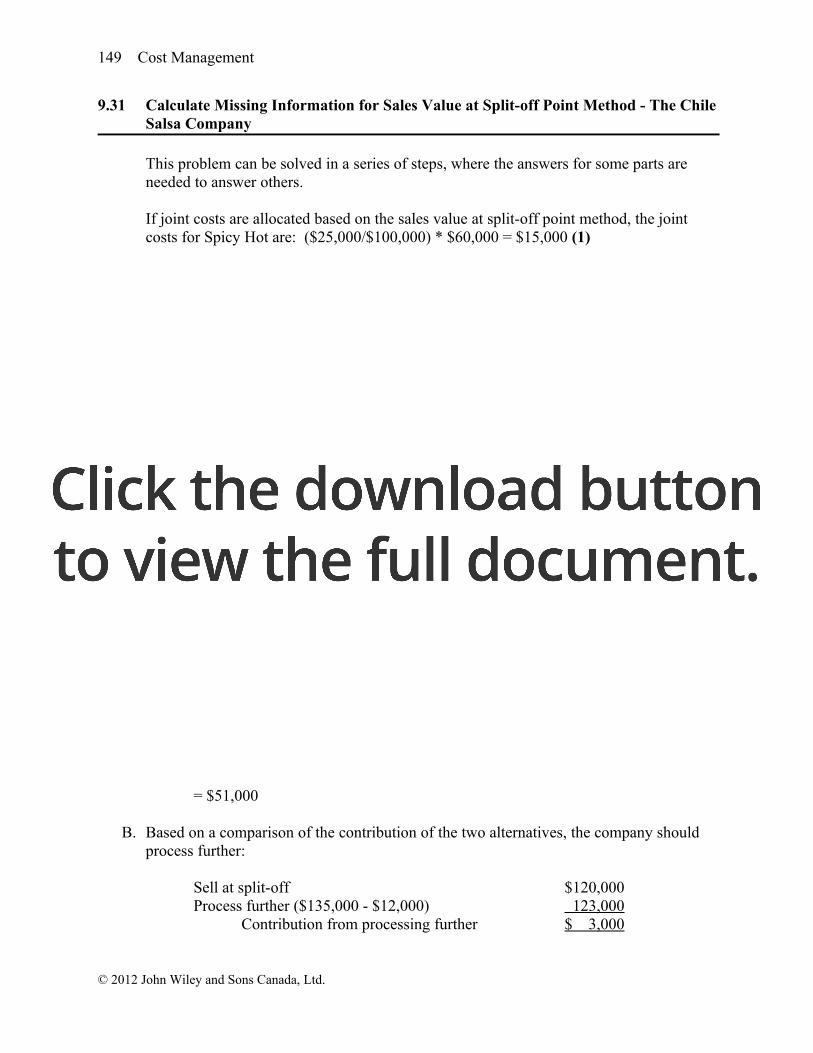
9.31 Calculate Missing Information for Sales Value at Split-off Point Method - The Chile Salsa Company
This problem can be solved in a series of steps, where the answers for some parts are needed to answer others.
If joint costs are allocated based on the sales value at split-off point method, the joint costs for Spicy Hot are: ($25,000/$100,000) * $60,000 = $15,000 (1)
Therefore, the joint cost for Medium is ($60,000 - $24,000 - $15,000) = $21,000 (2)
Now the values for sales at split-off for medium and mild can be calculated:
Medium: [($21,000/$60,000)*$100,000] = $35,000 (3)
Mild: ($100,000 - $35,000 - $25,000) = $40,000 (4)
Mild Medium Spicy Hot TotalUnits produced 24,000 ? ? 48,000Joint costs $24,000 (2)$21,000 (1)$15,000 $60,000Sales value at split-off point (4) $40,000 (3) $35,000 $25,000 $100,000Additional cost if process further $9,000 $7,000 $5,000 $21,000Sales value if processed further $55,000 $45,000 $30,000 $130,000
Notice that the information about units produced was irrelevant in this problem.
9.32 Further Processing Profit and Decision - Conrad Miller
A. Allocation for Very Flexible under the sales value at split-off point method:
$120,000/($1,500,000) * $900,000 = $72,000
Gross profit:
Revenue – Separable costs – Allocated joint costs= $135,000 - $12,000 - $72,000 = $51,000
B. Based on a comparison of the contribution of the two alternatives, the company should process further:
Sell at split-off $120,000Process further ($135,000 - $12,000) 123,000
Contribution from processing further $ 3,000
© 2012 John Wiley and Sons Canada, Ltd.
Chapter 9: Joint Product and By-Product Costing 150
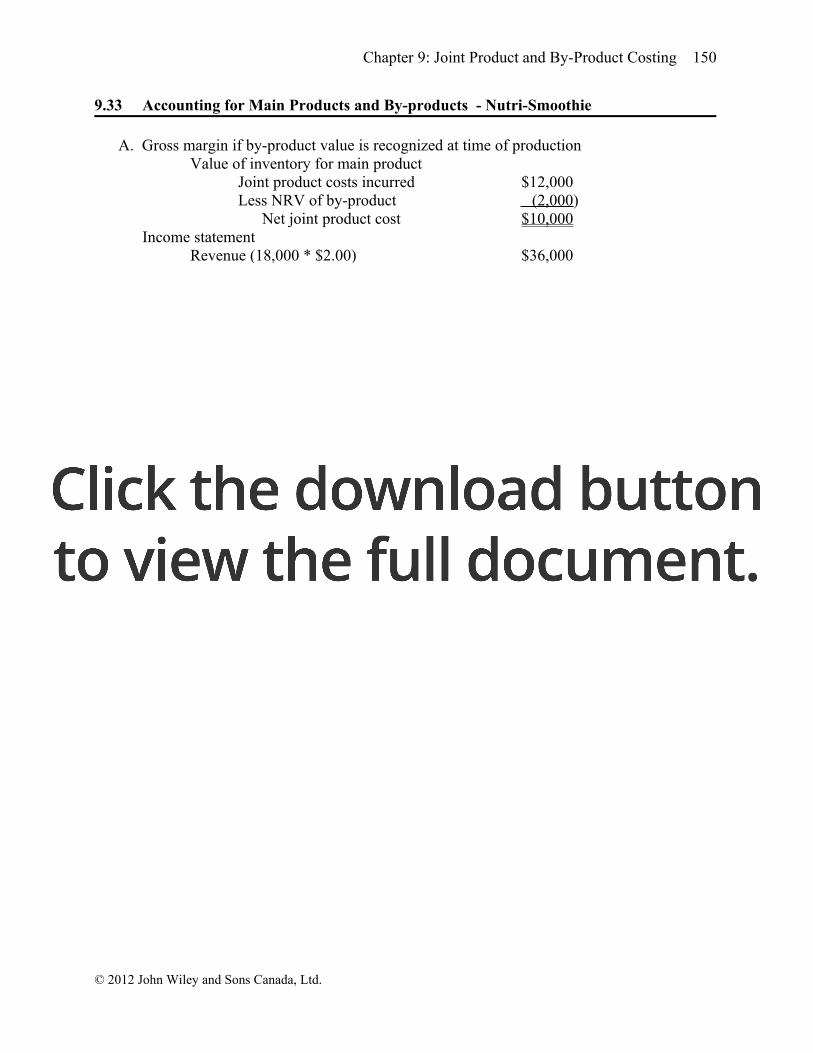
9.33 Accounting for Main Products and By-products - Nutri-Smoothie
A. Gross margin if by-product value is recognized at time of productionValue of inventory for main product
Joint product costs incurred $12,000Less NRV of by-product (2,000)
Net joint product cost $10,000Income statement
Revenue (18,000 * $2.00) $36,000Joint costs ($10,000/20,000 *18,000) (9,000)
Gross margin $27,000
B. Gross margin if by-product value is recognized at the time of saleRevenues: Smoothies (18,000 * $2.00) $36,000Revenues: Compost 2,000
Total revenue 38,000Joint Costs ($12,000/20,000)*18,000 (10,800)
Gross Margin $27,200
C. Inventories if by-product value is recognized at the time of production:Smoothies ($10,000/20,000 *2,000) $1,000Compost ($2,000/8,000 * 2,000) 500
Ending Inventories if by-product value is recognized at the time of sale:Smoothies ($12,000/20,000 *2,000) $1,200Compost 0
© 2012 John Wiley and Sons Canada, Ltd.

151 Cost Management
PROBLEMS
9.34 Identifying Joint Costs, Choice of Allocation Method - Roses to Go
A. Roses to Go must pay someone to water and tend to the roses. The company must pay for labour to cut the roses. It pays for fertilizer and water and depreciation on any buildings used in the production and cutting process. If the roses are cooled after cutting, the cost of cooling must be paid. All of these are joint costs.
B. Use the physical volume method because it is the most simple and will not distort costs if there is little difference in the packaging and pricing of the products.
C. If there are different prices, the sales value at split-off point method would work best here because the separable costs would be very similar. This method is most simple and would be the best choice because it does not distort the costs.
9.35 NRV, Processing Further Decision – Deepa Company
A. First calculate the NRV for Products 1 and 2:
Product 1 ($4 × 10,000 kg) $40,000Product 2 [($3 – $2) × 30,000 kg] 30,000
Total NRV $70,000
Notice that the joint costs ($55,000 + $65,000 = $120,000) are greater than the total NRV, and so the products are unprofitable.
Next, allocate joint costs based on NRV:
Product 1 [($40,000/$70,000) × $120,000)] $ 68,571Product 2 [($30,000/$70,000) × $120,000)] 51,429
Total Allocated $120,000
© 2012 John Wiley and Sons Canada, Ltd.
Chapter 9: Joint Product and By-Product Costing 152
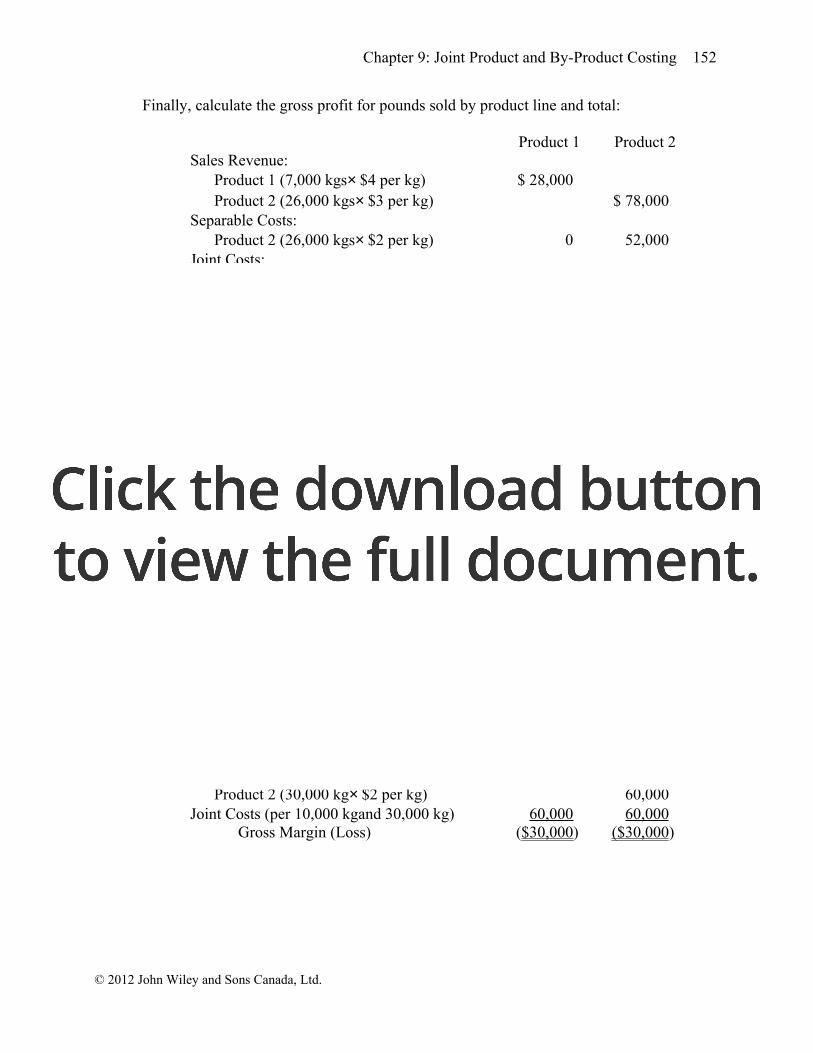
Finally, calculate the gross profit for pounds sold by product line and total:
Product 1 Product 2Sales Revenue:
Product 1 (7,000 kgs× $4 per kg) $ 28,000Product 2 (26,000 kgs× $3 per kg) $ 78,000
Separable Costs:Product 2 (26,000 kgs× $2 per kg) 0 52,000
Joint Costs:Product 1 [(7,000/10,000) × $68,571] 48,000Product 2 [(26,000/30,000) × $51,429] _______ 44,572
Gross Margin (Loss) ($20,000) ($18,572)
B. Under the new assumptions the calculation of gross profit is as follows:
First calculate the NRV for Products 1 and 2:
Product 1 ($5× 10,000 kg)-$20,000 $30,000Product 2 [($3 – $2) × 30,000 kgs] 30,000
Total NRV $60,000
Notice that the joint costs ($55,000 + $65,000 = $120,000) are greater than the total NRV, and so the products are unprofitable.
Next, allocate joint costs based on NRV:
Product 1 [($30,000/$60,000) × $120,000)] $ 60,000Product 2 [($30,000/$60,000) × $120,000)] 60,000
Total Allocated $120,000
Product 1 Product 2Sales Revenue:
Product 1 (10,000 kg× $5 per kg) $ 50,000Product 2 (30,000 kg× $3 per kg) $ 90,000
Separable Costs:Product 1 ($20,000 per 10,000 kg) 20,000Product 2 (30,000 kg× $2 per kg) 60,000
Joint Costs (per 10,000 kgand 30,000 kg) 60,000 60,000Gross Margin (Loss) ($30,000) ($30,000)
© 2012 John Wiley and Sons Canada, Ltd.

153 Cost Management
C. Compare the contribution when Product1 is sold “as is” and when it is processed further:
When sold “as is” ($4 per kg × 10,000 kg) $40,000When processed further [($5 per kg× 10,000 kg) – $20,000] $30,000
Based solely on quantitative factors, Product 1 should be sold “as is” after its joint production with Product 2.
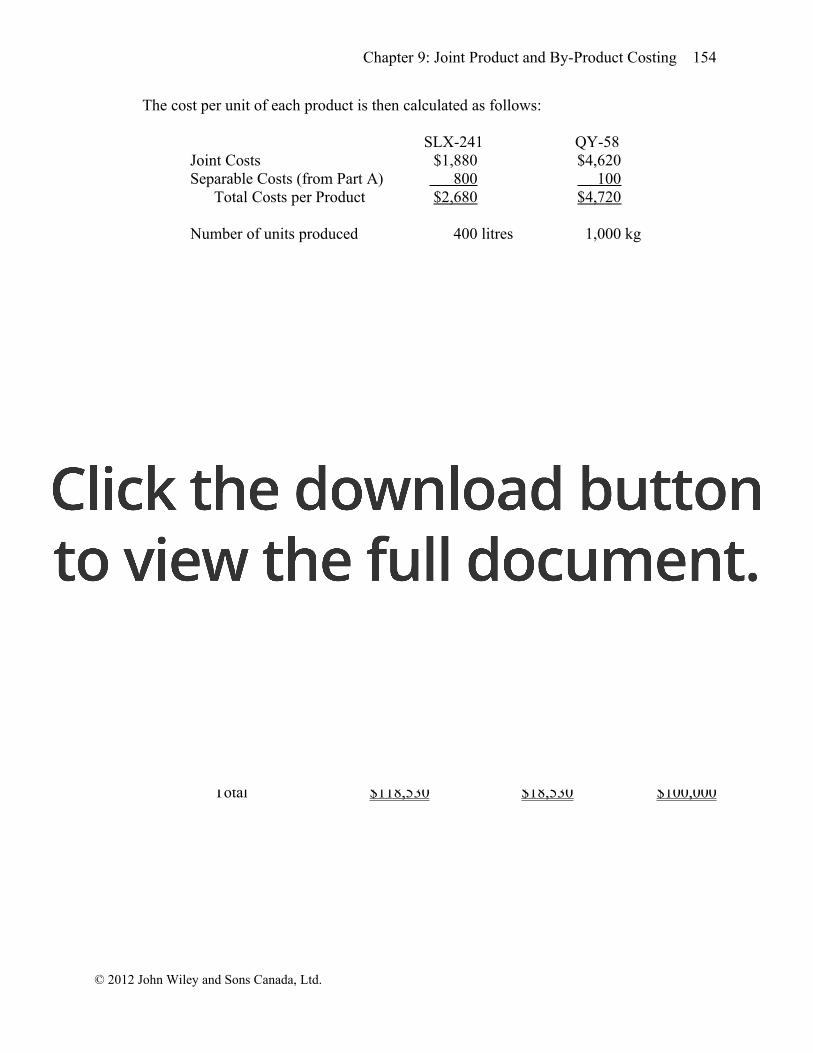
9.36 NRV – Ali Chemical Company
A. The joint costs are incurred prior to either product’s individual processing:
The cost to purchase the mixture $5,000The cost to process the mixture into the products 1,500
Total Joint Costs $6,500
B. The separable costs for each product are calculated as follows:
SLX-241 ($2 per litre× 400 litres) $800
QY-58 ($0.50 per kg × 200 kg of inert substance) $100
C. Determine the NRV of each product:
SLX-241 [($8 per litre× 400 litres) – $800] $2,400QY-58 [($6 per kg × 1,000 kg) – $100] 5,900
Total NRV $8,300
Note: The total volume of QY-58 is equal to the original volume at the split-off point of 800 kg plus the additional inert substance of 200 kg, or a total of 1,000 kg.
Based on the relative NRV values, the joint costs are allocated as follows:
SLX-241 [($2,400/$8,300) × $6,500] $1,880QY-58 [($5,900/$8,300) × $6,500] 4,620
Total Allocation $6,500
© 2012 John Wiley and Sons Canada, Ltd.
Chapter 9: Joint Product and By-Product Costing 154
The cost per unit of each product is then calculated as follows:
SLX-241 QY-58Joint Costs $1,880 $4,620Separable Costs (from Part A) 800 100
Total Costs per Product $2,680 $4,720
Number of units produced 400 litres 1,000 kg
Cost per Unit $6.70 per litre $4.72 per kg
9.37 Separable and Joint Costs, NRV, Operating Income, By-product - Doe Corporation
The following chart traces the physical flow of the products and summarizes cost and sales information.
Total WeightWeight After
Evaporation Loss Costs Total RevenueSlicing 94,500 kg
(35%*270,000)$ 4,700 $ 56,700
($0.60*94,500)Crushing 75,600 kg
(28%*270,000)10,580 41,580
($0.55*75,600)Juicing 72,900 kg
(27%*270,000)67,500 kg
(72,900/1.08)3,250 20,250
($0.30*67,500)Animal Feed 27,000 kg
(10%*270,000)700 2,700
($0.10*27,000)Total 270,000 kg $19,230 $121,230
A. The total weights are obtained by multiplying the initial 270,000 kilograms by the proportion of product by weight transferred to departments given. See table above.
B.Product Selling price Separable cost NRVSlices $ 56,700 $ 4,700 $ 52,000Crushed 41,580 10,580 31,000Juice 20,250 3,250 17,000
Total $118,530 $18,530 $100,000
© 2012 John Wiley and Sons Canada, Ltd.
155 Cost Management
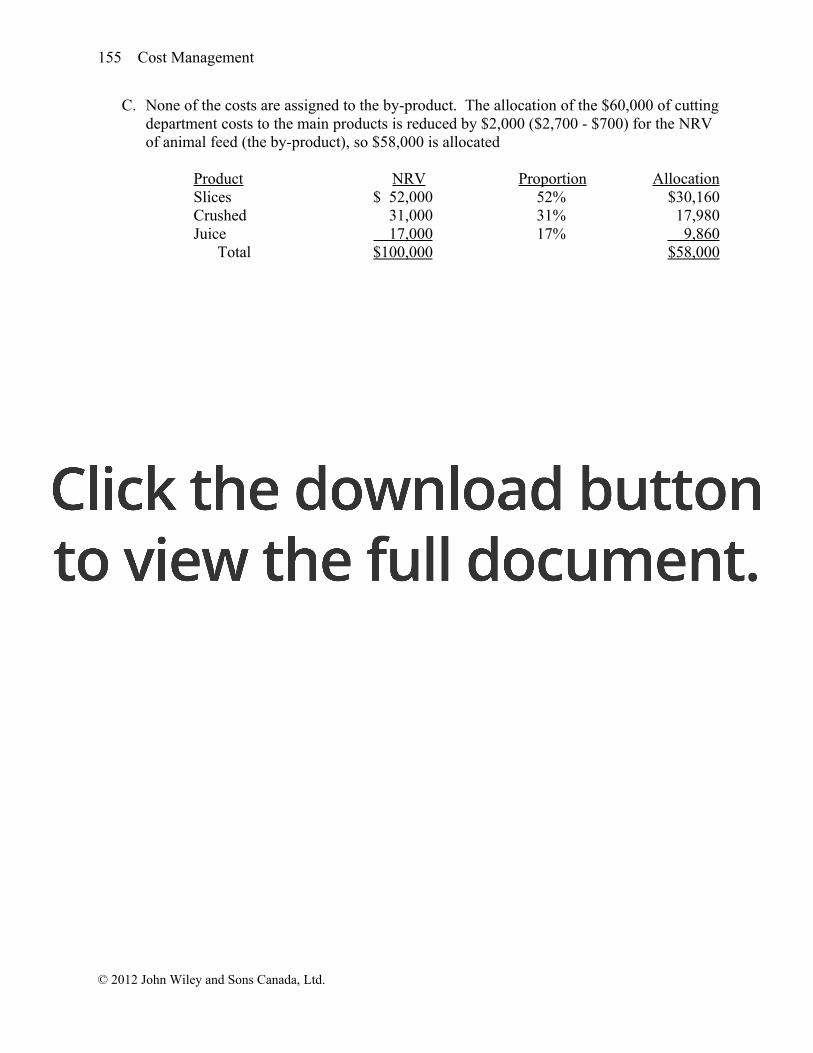
C. None of the costs are assigned to the by-product. The allocation of the $60,000 of cutting department costs to the main products is reduced by $2,000 ($2,700 - $700) for the NRV of animal feed (the by-product), so $58,000 is allocated
Product NRV Proportion AllocationSlices $ 52,000 52% $30,160Crushed 31,000 31% 17,980Juice 17,000 17% 9,860
Total $100,000 $58,000
D.Slices Crushed Juice Total
Sales $56,700 $41,580 $20,250 $118,530Joint cost 30,160 17,980 9,860 58,000Separable cost 4,700 10,580 3,250 18,530
Gross margin $21,840 $13,020 $ 7,140 $ 42,000
E. The gross margin information is of little value to management. As long as the overall processing is profitable, the net realizable value approach will show each of the products as valuable. For product mix decisions (such as whether to produce more juice and less crushed pineapple), information is needed about incremental revenues and costs rather than gross margin data.
F. If there is no disposal revenue, the additional costs are $800 to dispose of the outside skin plus $2,700 in lost revenue (assuming that $700 of chopping costs would not be increased). The $3,500 would be added to each product in the same proportions as in part C. Thus the correct additional costs would be:
Additional CostSlices $1,820Crushed 1,085Juice 595Total $3,500
© 2012 John Wiley and Sons Canada, Ltd.
Chapter 9: Joint Product and By-Product Costing 156
9.38 Cumulative Problem (Chapter 4): Optimal Product Mix, Joint Cost Allocation Using Three Methods – Aromasoaps
[Note: This problem requires application of knowledge from Chapter 4.]
A sample spreadsheet using Excel Solver for this problem is available on the Instructor’s web site for the textbook (available at www.wiley.com/canada/eldenburg). Below are manual calculations.
A. Incremental profit from further processing:
Incremental Revenue* Incremental Cost Net Relaxation [$15,000 – (3,000 × $2)] = $9,000 $ 8,000 $ 1,000Energizer [$72,000 – (12,000 × $4)] = $24,000 20,000 4,000Harmony [$73,000 – (33,000 × $2)] = $7,000 10,000 (3,000)
* Incremental revenue is calculated as the difference between total revenue after processing and total revenue at the split-off point for each product.
Relaxation and Energizer should be processed beyond the split-off point. Further processing of Harmony yields an incremental loss of $3,000, so it should not be processed further.
B. Profit from the optimal sales mix:
Relaxation Energizer Harmony TotalSales $15,000 $72,000 $66,000 $153,000Processing 8,000 20,000 0 28,000Joint Cost 90,000
Income $ 35,000
C. Joint cost allocation under the physical volume method:
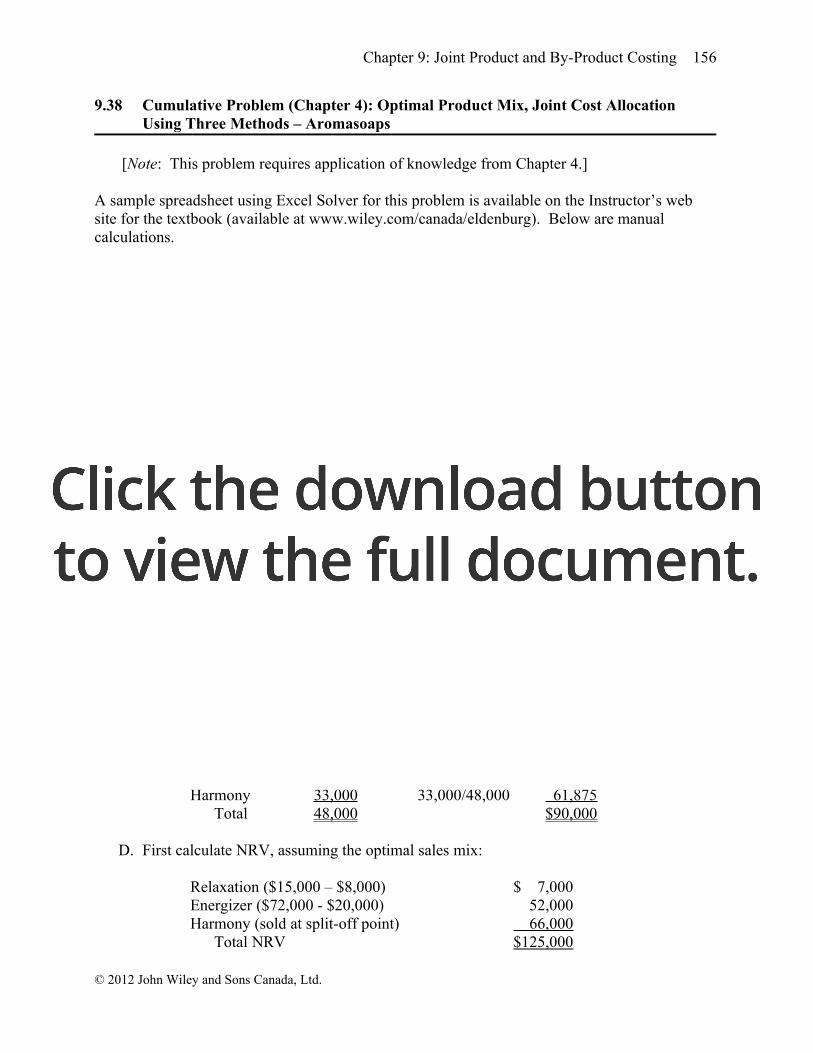
Number of Units Proportion AllocationRelaxation 3,000 3,000/48,000 $ 5,625Energizer 12,000 12,000/48,000 22,500Harmony 33,000 33,000/48,000 61,875
Total 48,000 $90,000
D. First calculate NRV, assuming the optimal sales mix:
Relaxation ($15,000 – $8,000) $ 7,000Energizer ($72,000 - $20,000) 52,000Harmony (sold at split-off point) 66,000
Total NRV $125,000
© 2012 John Wiley and Sons Canada, Ltd.

157 Cost Management
Then use the NRV calculations to allocate joint costs:
Relaxation [($7,000/$125,000) × $90,000] $ 5,040Energizer [($52,000/$125,000) × $90,000] 37,440Harmony [($66,000/$125,000) × $90,000] 47,520
Total Allocation $90,000
E. Joint cost allocation using final sales value of $153,000 (from part B):
Relaxation [($15,000/$153,000) × $90,000] $ 8,823Energizer [($72,000/$153,000) × $90,000] 42,353Harmony [($66,000/$153,000) × $90,000] 38,824
Total Allocation $90,000
It is inappropriate to use final sales value to allocate joint costs because it ignores the additional costs incurred to earn the additional revenues.
F. This part requires recalculation of the apparent optimal sales mix according to gross margins calculated using the joint cost allocations from Parts C, D, and E.
PHYSICAL OUTPUT METHOD
Gross Margins if Sold at the Split-Off Point:Joint Cost Gross
Revenue Allocation Margin Relaxation $ 6,000 (3,000 × $2) $ 5,625 $ 375Energizer 48,000 (12,000 × $4) 22,500 25,500Harmony 66,000 (33,000 × $2) 61,875 4,125
Gross Margins if Processed Further:Separable Joint Cost Gross
Revenue Cost Allocation MarginRelaxation $15,000 $ 8,000 $ 5,625 $ 1,375Energizer 72,000 20,000 22,500 29,500Harmony 73,000 10,000 61,875 1,125
Under the physical output method, Relaxation and Energizer would be processed further, but not Harmony. This is same as the optimal sales mix (Part B). However, this result will not always hold. With a different set of values, the apparent optimal sales mix using gross margins could be different than the actual optimal sales mix.
© 2012 John Wiley and Sons Canada, Ltd.
Chapter 9: Joint Product and By-Product Costing 158
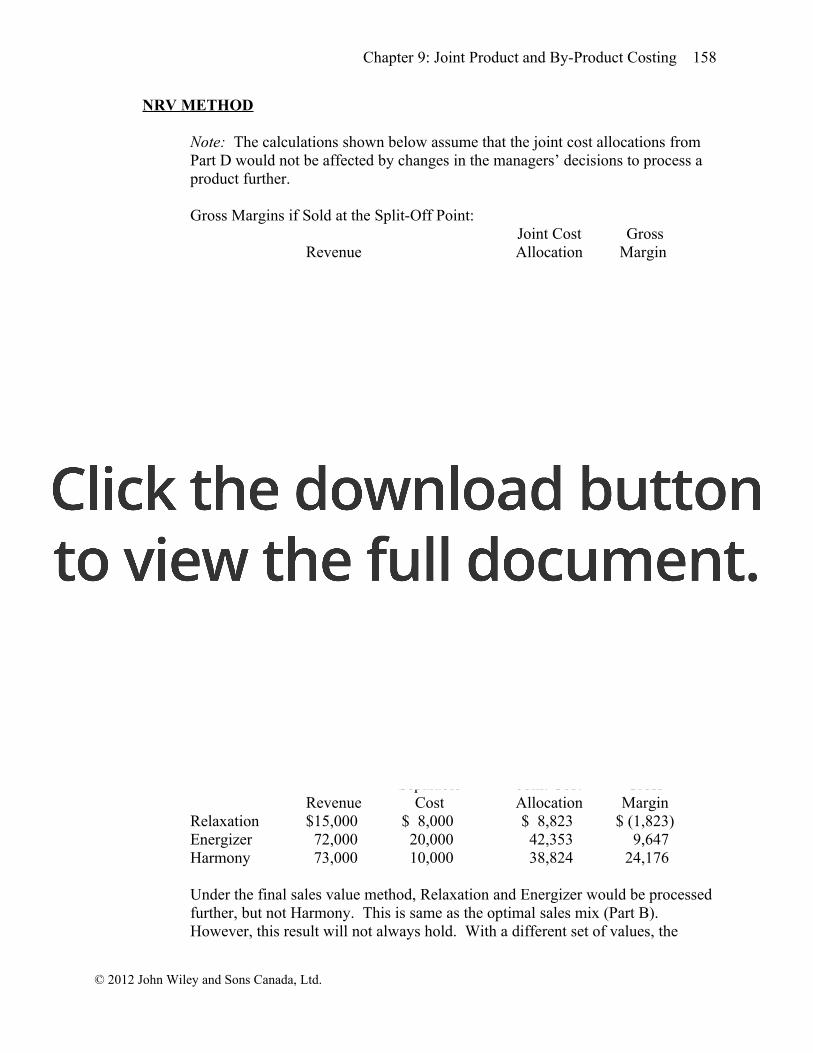
NRV METHOD
Note: The calculations shown below assume that the joint cost allocations from Part D would not be affected by changes in the managers’ decisions to process a product further.
Gross Margins if Sold at the Split-Off Point:Joint Cost Gross
Revenue Allocation Margin Relaxation $ 6,000 $ 5,040 $ 960Energizer 48,000 37,440 10,560Harmony 66,000 47,520 18,480
Gross Margins if Processed Further:Separable Joint Cost Gross
Revenue Cost Allocation MarginRelaxation $15,000 $ 8,000 $ 5,040 $ 1,960Energizer 72,000 20,000 37,440 14,560Harmony 73,000 10,000 47,520 15,480
Under the NRV method, Relaxation and Energizer would be processed further, but not Harmony. This is same as the optimal sales mix (Part B).
FINAL SALES VALUE METHOD
Note: The calculations shown below assume that the joint cost allocations from Part E would not be affected by changes in the managers’ decisions to process a product further.
Gross Margins if Sold at the Split-Off Point:Joint Cost Gross
Revenue Allocation Margin Relaxation $ 6,000 $ 8,823 $ (2,823)Energizer 48,000 42,353 5,647Harmony 66,000 38,824 27,176
Gross Margins if Processed Further:Separable Joint Cost Gross
Revenue Cost Allocation MarginRelaxation $15,000 $ 8,000 $ 8,823 $ (1,823)Energizer 72,000 20,000 42,353 9,647Harmony 73,000 10,000 38,824 24,176
Under the final sales value method, Relaxation and Energizer would be processed further, but not Harmony. This is same as the optimal sales mix (Part B). However, this result will not always hold. With a different set of values, the
© 2012 John Wiley and Sons Canada, Ltd.
159 Cost Management
apparent optimal sales mix using gross final sales values could be different than the actual optimal sales mix.
9.39 Physical Output Method, Drop a Product, Special Order - Jumping Juice Ltd.
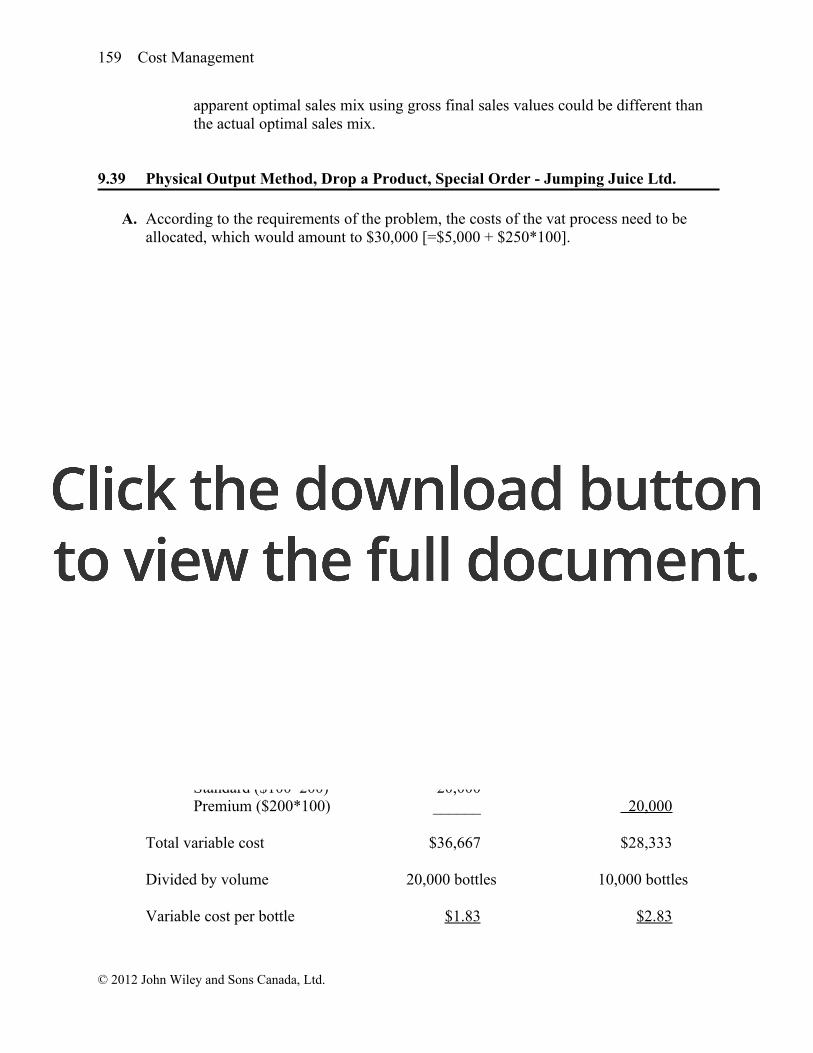
A. According to the requirements of the problem, the costs of the vat process need to be allocated, which would amount to $30,000 [=$5,000 + $250*100].
Allocation base: Standard Grade Premium GradeVolume 20,000 bottles 10,000 bottlesRelative volume 2/3 1/3
Allocated cost of vat process:Standard (2/3*$30,000) $20,000Premium (1/3*$30,000) $10,000
Cost of handling and bottling:Standard ($1,000+$100*200 barrels) 21,000Premium ($2,000+$200*100 barrels) ______ 22,000
Total cost $41,000 $32,000
Divided by volume 20,000 bottles 10,000 bottles
Cost per bottle $2.05 $3.20
B.Allocation base: Standard Grade Premium Grade
Volume 20,000 bottles 10,000 bottlesRelative volume 2/3 1/3
Allocated variable joint cost:Standard (2/3*$250*100) $16,667Premium (1/3*$250*100) $8,333
Variable cost of handling and bottling:Standard ($100*200) 20,000Premium ($200*100) ______ 20,000
Total variable cost $36,667 $28,333
Divided by volume 20,000 bottles 10,000 bottles
Variable cost per bottle $1.83 $2.83
© 2012 John Wiley and Sons Canada, Ltd.
Chapter 9: Joint Product and By-Product Costing 160
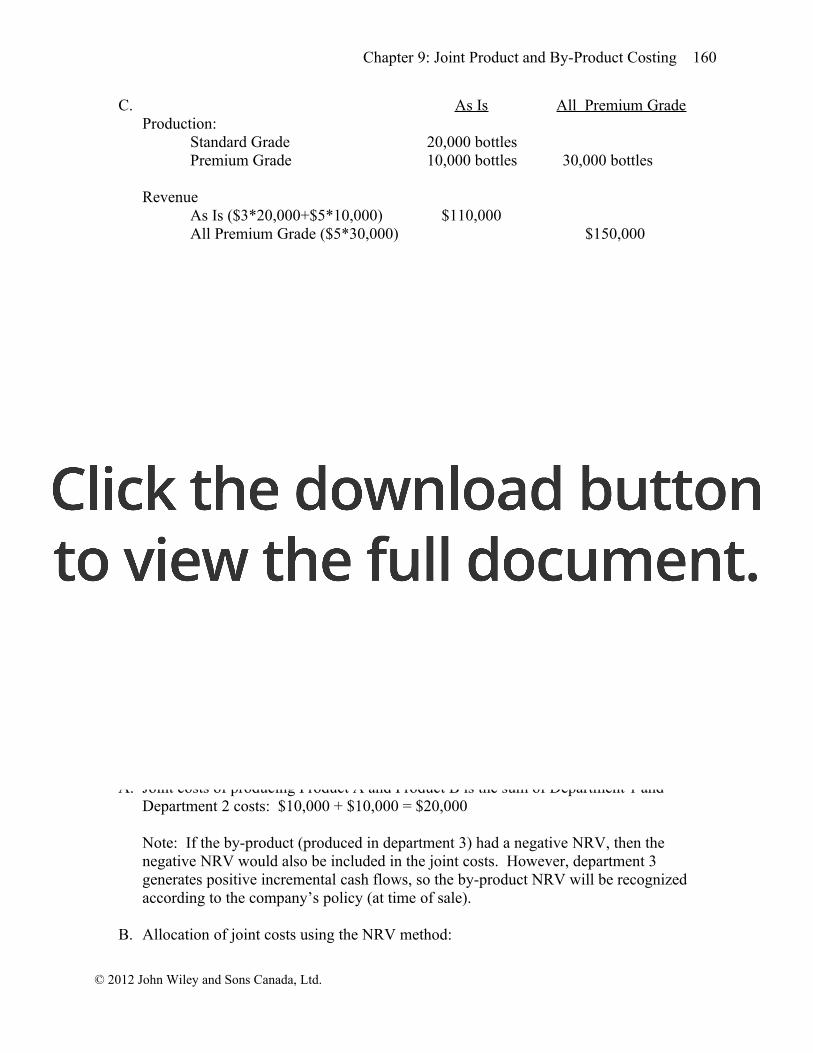
C. As Is All Premium GradeProduction:
Standard Grade 20,000 bottlesPremium Grade 10,000 bottles 30,000 bottles
RevenueAs Is ($3*20,000+$5*10,000) $110,000All Premium Grade ($5*30,000) $150,000
Joint CostsAs Is ($5,000+$250*100) (30,000)All Premium Grade (same) (30,000)
Handling and bottling:Standard grade:
As Is ($1,000+$100*200) (21,000)Discontinue Standard (0)
Premium grade:As Is ($2,000+$200*100) (22,000 ) All Premium Grade ($2,000 + $200 * 300) (62,000)
Profit (Loss) $ 37,000 $ 58,000
Profit would increase from $37,000 to $58,000 if all raw cider was treated as premium grade. .
D. If a special order of premium cider were produced without producing any standard cider, the decision to produce premium would require incurring the fixed and variable vat costs, as well as the fixed and variable costs for premium bottling. The special order would need to pay for all of these costs.
9.40 Identify Joint Costs in Complex Process, Income Statement, By-Product, Opportunity Cost – Goodman and Sons
A. Joint costs of producing Product A and Product B is the sum of Department 1 and Department 2 costs: $10,000 + $10,000 = $20,000
Note: If the by-product (produced in department 3) had a negative NRV, then the negative NRV would also be included in the joint costs. However, department 3 generates positive incremental cash flows, so the by-product NRV will be recognized according to the company’s policy (at time of sale).
B. Allocation of joint costs using the NRV method:
© 2012 John Wiley and Sons Canada, Ltd.

161 Cost Management
Separable Joint CostRevenue Costs NRV Proportion Allocation
Product A $40,000 $25,000 $15,000 $15,000/$16,000 $18,750Product B 6,000 5,000 1,000 $1,000/$16,000 1,250
Total $16,000 $20,000
C. Income Statement using the NRV method and assuming that all products are sold (i.e., no beginning or ending inventories):
Revenue ($40,000 + $6,000) $46,000Cost of goods sold:
Joint costs $20,000Separable costs ($25,000 + $5,000) 30,000By-product NRV ($10,000 – $2,000) (8,000) 42,000
Gross Margin $ 4,000
Note: The by-product NRV of $8,000 could be subtracted from cost of goods sold (as shown above). Alternatively, it could have been included in revenues or listed below gross margin as other income.
D. Because no market exists for intermediate products, the opportunity cost of Product B for purposes of determining whether it should be processed further is its net realizable value of $1,000.
9.41 Joint Product, By Products, Weighted-Average Process Costing - S-T Inc.
Physical FlowWIP beginning 2 batches (30% and 80% converted)Started 21 batchesCompleted and transferred out 20 batchesEnding WIP 1 batch (50% converted)
Equivalent units and costs under weighted average. Remember that under weighted average, beginning inventory is counted as part of units completed. Also remember that direct material and conversion costs from work completed on beginning inventory and costs incurred this period are summed. Following are the equivalent units and costs under weighted average.
© 2012 John Wiley and Sons Canada, Ltd.
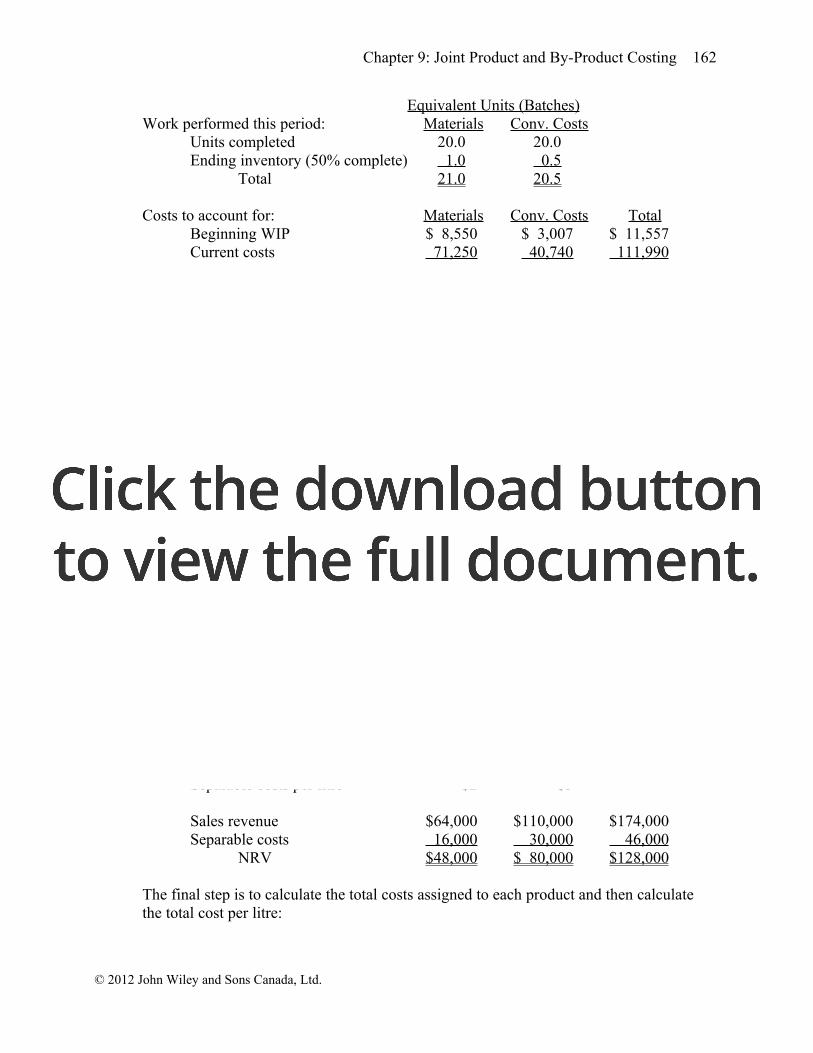
Chapter 9: Joint Product and By-Product Costing 162
Equivalent Units (Batches)Work performed this period: Materials Conv. Costs
Units completed 20.0 20.0Ending inventory (50% complete) 1 .0 0 .5
Total 21 .0 20 .5
Costs to account for: Materials Conv. Costs TotalBeginning WIP $ 8,550 $ 3,007 $ 11,557Current costs 71,250 40,740 111,990
Total $79,800 $43,747 $123,547
Cost per equivalent unit $3,800 $2,134 $5,934
Process Cost Report – Weighted Average Method
Units completed ($5,934 x 20) $118,680Ending inventory
Materials ($3,800 x 1.0) $3,800Conversion ($2,134 x 0.5) 1,067
Total ending WIP 4,867Total costs accounted for $123,547
By-product Z is valued at its estimated selling price of $1 per litre. This amount is subtracted from the cost of batches completed to arrive at the net amount of joint costs to be allocated:
Cost of goods completed (calculated above) $118,680Less by-product sales (20 batches x 100 L x $1) (2,000 )
Net joint cost $116,680
Note that the firm produced 400 L x 20 batches = 8,000 litres of X and 500 L x 20 batches = 10,000 litres of Y. Given these volumes, the joint costs are allocated to each product as follows under the net realizable value method
Product X Product Y TotalLitres 8,000 10,000Price per litre $8 $11Separable costs per litre $2 $3
Sales revenue $64,000 $110,000 $174,000Separable costs 16,000 30,000 46,000
NRV $48,000 $ 80,000 $128,000
The final step is to calculate the total costs assigned to each product and then calculate the total cost per litre:
© 2012 John Wiley and Sons Canada, Ltd.

163 Cost Management
Product X Product YAllocation of joint costs:
X: $116,680 x ($48/$128) $43,755Y: $116,680 x ($80/$128) $ 72,925
Separable costs 16,000 30,000Total Cost $59,755 $102,925
Divided by litres 8,000 10,000
Total Cost per litre $7.47 $10.29
© 2012 John Wiley and Sons Canada, Ltd.

Chapter 9: Joint Product and By-Product Costing 164
MINI-CASES
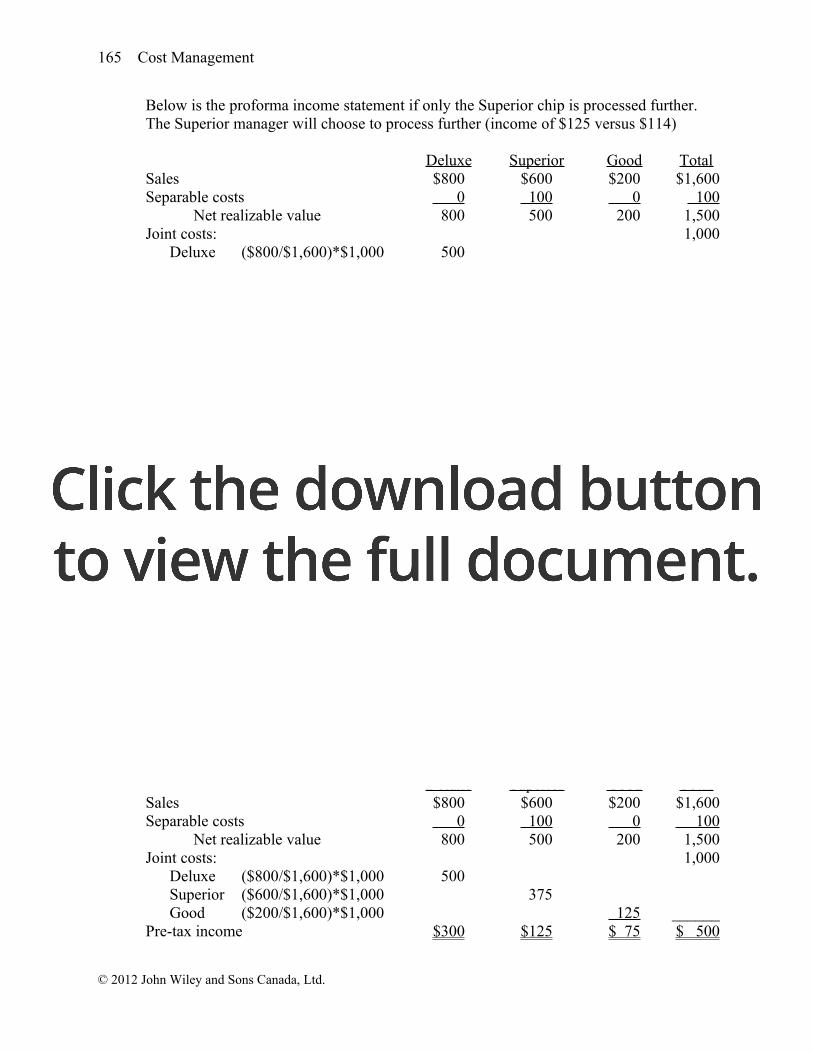
9.42 Profit at Split-off Point and After Further Processing, Manager Incentives and Decisions - Champion Chip Company
First translate amounts to Canadian dollars and total.Deluxe Superior Good Total
Sales value at split-off point 400£*2 = $800 3,200 HK$*0.125 = $400 Cdn$200 CAD$1,400If process further:
Sales value 550£*2=$1,100 4,800 HK$*0.125=$600 Cdn$800 CAD$2,500Separable costs 200£*2 = $400 800 HK$*0.125=$100 Cdn$500 CAD$1,000
A.Deluxe Superior Good Total
Sales $800 $400 $200 $1,400Joint costs: 1,000
Deluxe ($800/$1,400)*$1,000 571Superior ($400/$1,400)*$1,000 286Good ($200/$1,400)*$1,000 143 ______
Pre-tax income $229 $114 $ 57 $ 400
B. Below is the proforma income statement if only the Deluxe chip is processed further. The Deluxe manager will choose to sell at split-off point (income of $229 versus $53)
Deluxe Superior Good TotalSales $1,100 $400 $200 $1,700Separable costs 400 0 0 400
Net realizable value 700 400 200 1,300Joint costs: 1,000
Deluxe ($1,100/$1,700)*$1,000 647Superior ($400/$1,700)*$1,000 235Good ($200/$1,700)*$1,000 118 ______
Pre-tax income $ 53 $165 $ 82 $ 300
© 2012 John Wiley and Sons Canada, Ltd.
165 Cost Management
Below is the proforma income statement if only the Superior chip is processed further. The Superior manager will choose to process further (income of $125 versus $114)
Deluxe Superior Good TotalSales $800 $600 $200 $1,600Separable costs 0 100 0 100
Net realizable value 800 500 200 1,500Joint costs: 1,000
Deluxe ($800/$1,600)*$1,000 500Superior ($600/$1,600)*$1,000 375Good ($200/$1,600)*$1,000 125 ______
Pre-tax income $300 $125 $ 75 $ 500
Below is the proforma income statement if only the Good chip is processed further. The Good manager will choose to sell at the split-off point (income of $57 versus a loss of $100).
Deluxe Superior Good TotalSales $800 $400 $800 $2,000Separable costs 0 0 500 500
Net realizable value 800 400 300 1,500Joint costs: 1,000
Deluxe ($800/$2,000)*$1,000 400Superior ($400/$2,000)*$1,000 200Good ($800/$2,000)*$1,000 400 ______
Pre-tax income $400 $200 $(100) $ 500
C. The best decisions for the firm are for each division to bring in the highest contribution. For Deluxe, selling at the split-off point is best ($800 at split-off point versus $700 if processed further). For Superior, process further ($500 for processing further versus $400 for selling at split-off). For Good, process further ($300 for further processing versus $200 at split-off point).
D. Below is the proforma income statement if all managers make best decision for their division:
Deluxe Superior Good TotalSales $800 $600 $200 $1,600Separable costs 0 100 0 100
Net realizable value 800 500 200 1,500Joint costs: 1,000
Deluxe ($800/$1,600)*$1,000 500Superior ($600/$1,600)*$1,000 375Good ($200/$1,600)*$1,000 125 ______
Pre-tax income $300 $125 $ 75 $ 500
© 2012 John Wiley and Sons Canada, Ltd.
Chapter 9: Joint Product and By-Product Costing 166
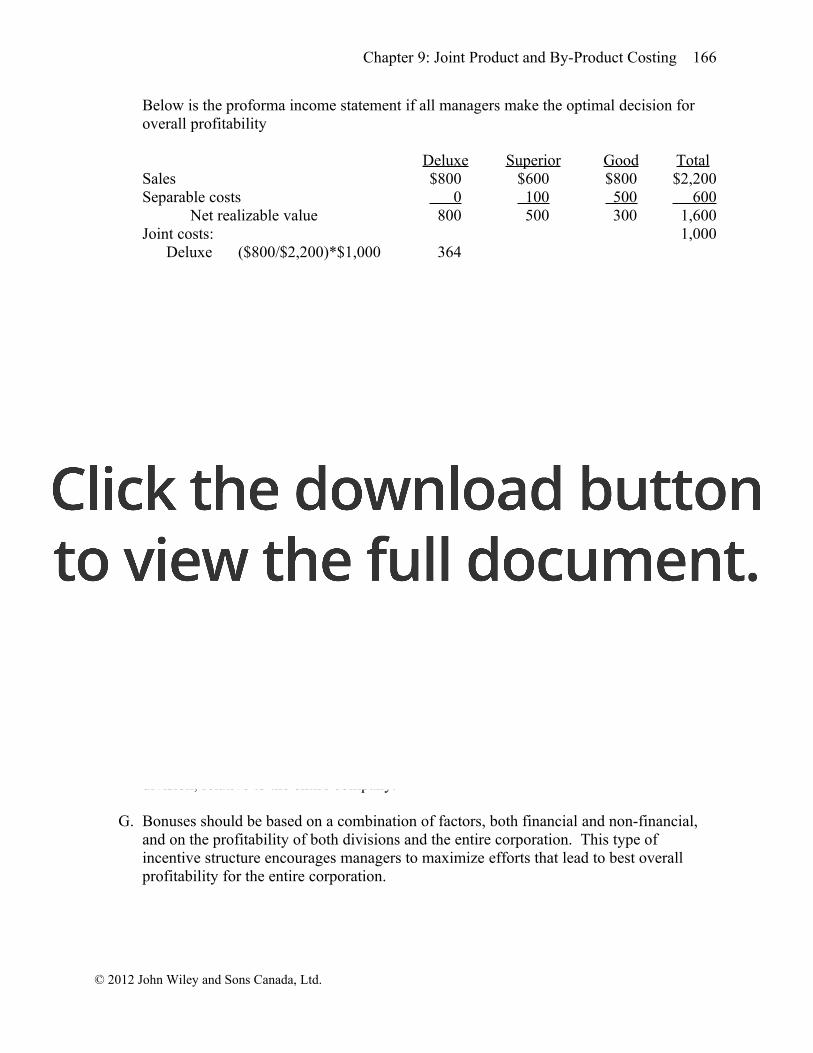
Below is the proforma income statement if all managers make the optimal decision for overall profitability
Deluxe Superior Good TotalSales $800 $600 $800 $2,200Separable costs 0 100 500 600
Net realizable value 800 500 300 1,600Joint costs: 1,000
Deluxe ($800/$2,200)*$1,000 364Superior ($600/$2,200)*$1,000 273Good ($800/$2,200)*$1,000 363 ______
Pre-tax income $436 $227 $ (63) $ 600
Notice that the choice of an accounting procedure encourages the managers to act in their own interest instead of the interest of the firm as a whole.
E. Note that if the net realizable value method is used to allocate the joint cost, the managers will reach the following stable solution. The allocation of joint costs would be
Eventual NetSelling Separable RealizablePrice Costs Value Allocation
Deluxe $800 $ 0 $ 800 8/16(1000) $ 500.00Superior 600 100 500 5/16(1000) 312.50Good 800 500 300 3/16(1000) 187 .50
$1,600 $1,000 .00
Given this allocation, the income statement would be:
Deluxe Superior Good TotalSales $800 $600 $800 $2,200Joint 500 312 188 1,000Further processing 100 500 600
Pre-tax Income $300 $188 $112 $ 600
F. Managers often act in the best interest of their divisions. If allocations are used to determine the income of divisions, the allocations may distort the profitability of each division, relative to the entire company.
G. Bonuses should be based on a combination of factors, both financial and non-financial, and on the profitability of both divisions and the entire corporation. This type of incentive structure encourages managers to maximize efforts that lead to best overall profitability for the entire corporation.
© 2012 John Wiley and Sons Canada, Ltd.
167 Cost Management
9.43 NRV Method, Division Manager Incentives, Qualitative Factors - Hudziak Industries
A.Allocation of joint costs:
NetSales Separable Realizable
Ingredient Value Cost Value Proportion AllocationJ-52A $1,500 $150 $1,350 $1,350/$2,500 $1,080Quitoban 1,400 250 1,150 $1,150/$2,500 920
Total $2,500 $2,000
Sales: J-52A $5/L * 300L = $1,500; Quitoban $7/kg * 200kg = $1,400
Income per lot:Chemicals Cosmetics Total
Sales $1,500 $1,400 $2,900Joint cost 1,080 920 2,000Separable cost 150 250 400
Income Per Lot $ 270 $ 230 $ 500
B.The allocation of the cost of the new material would be:
NetSales Separable Realizable
Ingredient Value Cost Value Proportion AllocationJ-52A $1,500 $400 $1,100 $1,100/$3,850 $ 857Quitoban 3,000 250 2,750 $2,750/$3,850 2,143
Total $3,850 $3,000
Sales: J-52A $5/L * 300L = $1,500; Quitoban $15/kg * 200kg = $3,000
The income per lot with the new material is expected to be:Chemicals Cosmetics Total
Sales $1,500 $3,000 $4,500Joint cost 857 2,143 3,000Separable cost 400 250 650
Income Per Lot $ 243 $ 607 $ 850
1. Based on the calculations shown above, the gross margin of the Chemicals division is expected to decline by $27 per lot ($270-$243) if the new material is purchased. This decline is a combination of an increase in separable costs from the additional processing required by the new material, offset by a reduction in allocated joint costs under the NRV method. In addition, there may be uncertainties about the specific processing changes needed and costs involved, increasing the manager’s uncertainty about the operating results. Assuming that this manager is rewarded based on
© 2012 John Wiley and Sons Canada, Ltd.
Chapter 9: Joint Product and By-Product Costing 168
reported division profit, she or he would not be in favour of purchasing the new material.
2. Based on the calculations shown above, the gross margin of the Cosmetics division is expected to increase by $377 per lot ($607-$230) if the new material is purchased. This increase is a combination of an increase in expected revenue caused by a selling price increase, offset by an increase in allocated joint costs under the NRV method. The manager may face significant uncertainty about whether the price increase can be achieved and how it will affect the volume of sales. As long as these risks are not too high and the Cosmetics manager is rewarded based on reported division and/or overall company profit, he/she would be in favour of purchasing the new material.
3. Many potential pros and cons could be discussed, including:Pros:
Higher expected profit of $350 per lot ($850-$500)Decreased risk from lawsuits related to ingredients in the old raw materialImproved product quality, which could improve brand image (as an innovative company, an ethical company, etc.)
Cons:Potential conflict of interest between the Chemicals and Cosmetics managersIncreased raw material and production costsPossibility that revenue and cost projections may not be met
C. Many potential uncertainties could be discussed, including:
Whether the revenue projections are reasonable:• Will the price increase reduce the quantity demanded?• Will the price increase attract new competition?• Will the new chemical formula lead to additional product opportunities?• Will the ingredient change have any effect on the quality and product
demand of J-52A?
Whether the cost projections are reasonable:• Will unforeseen production problems occur with the new ingredient?• Will the price and supply of the new ingredient be as stable as that of the
old ingredient?• Will changes occur in the quantities of spoilage with the new ingredient?
Health effects of the old and new raw material:• Will the new ingredient have fewer or more health risks than the old
ingredient?• Will the old ingredient be found to be safe after all?
How might the change in production processes and profits affect the morale and performance of managers and other employees?
© 2012 John Wiley and Sons Canada, Ltd.

169 Cost Management
D. Students may propose a variety of incentive solutions, including one or more of the following:
Reward managers based on company-wide incomeExclude joint cost allocations from individual manager performance evaluationAllocate joint costs using the constant gross margin NRV methodAllocate the Chemicals division loss in NRV ($27 per lot) to the Cosmetics divisionAllocate the increase in the Chemical division’s separable costs ($400-$150 = $250 per lot) to the Cosmetics divisionReduce the Chemical division’s target income under the compensation plan to accommodate the change in costsOpen communication among division managers and top management to ensure that all parties are adequately informed about the reasons for decisions and the effects on the company as a wholeEstablish rules for managers to follow (e.g., require managers to purchase the new raw material)
E. The advantages and disadvantages that students discuss will depend on the option(s) they identify. Some of these advantages and disadvantages include the following:
Methods that focus on company-wide income encourage managers to consider the overall benefit to the company, but might invite a “free rider” problem.Methods that focus on division performance encourage managers to make decisions to maximize division efficiency and income, but might conflict with company-wide interests (see Chapter 15 for more information about incentive problems between managers).Methods that include an allocation of joint costs necessarily involve arbitrary allocations of costs between divisions; in general, it is desirable to eliminate uncontrollable costs from evaluations of individual division performance.Methods that focus on communication can improve morale and provide better information for decision making, but may be misunderstood and do not necessarily motivate desired actions.Methods that focus on rules or instructions work for situations such as the raw material decision, where the best decision for the company can be identified and managers can be told what to do. However, it is difficult to identify all possible rules that might be needed for other decisions.
F. and G. There is no one answer to these parts. Sample solutions and a discussion of typical student responses will be included in assessment guidance on the Instructor’s web site for the textbook (available at www.wiley.com/college/eldenburg).
© 2012 John Wiley and Sons Canada, Ltd.
Chapter 9: Joint Product and By-Product Costing 170
9.44 Use of Joint Cost Information; Strategic
This is an open ended question. Student answers will differ based on their choice of products or business. The answer must be in memo format addressed to the professor. Students must include the following information:
A. An example of how joint cost information could inappropriately affect decision making and the example must be supported by references to actual products or business.
B. An example of how joint cost information could improve decision making and the example must be supported by references to actual products or business.
C. A strategy, and a description of how it could be implemented, to prevent the misuse of cost accounting information and explain how cost accounting information should be used to support strategic objectives.
9.45 Integrating Across the Curriculum–Economics and Governmental Regulation – Canadian Beef Industry
A. Canadian beef by-products might end up in landfills unless some alternative use can be identified.
B.1. The cost of main products would probably increase because of the loss in revenue
from by-product sales and also because of increased waste disposal costs.
2. The ban would probably increase the cost of main products in other livestock industries. Currently, beef by-products are used as feed in these industries. Other sources of feed must currently cost more than beef by-products (otherwise, they would currently be used), and an increase in demand would cause the cost to be even higher.
C. The ban could have both positive and negative effects. In the short term, the increase in cost would encourage meat producers to increase prices. Consumers might shift their consumption habits to purchase other, less costly sources of meat and protein. Some producers might fail financially. The ban could also have positive effects. In the short term, consumers might shift their consumption away from Canadian beef because of higher cost, negative publicity, and concerns about the long time frame for mad cow disease. But in the long term, the ban might encourage domestic and international consumers to have greater confidence in the quality of Canadian beef, leading to higher prices.
D. Below is a brief description of Canadian regulators responsibilities to key stakeholder groups.
• Canadian cattle industry: The regulators are responsible for developing standards and ensuring industry compliance. When developing standards, the regulators must consider their potential effect on the Canadian cattle industry.
© 2012 John Wiley and Sons Canada, Ltd.
171 Cost Management
This means that regulators must sometimes weigh the social costs and benefits of its regulations against the impact on the industry.
• Other Canadian livestock industries, such as pigs and chicken: Regulators have the same responsibility for other livestock industries that they have for the cattle industry. Their decisions about beef and other mammal by-products will directly affect the well-being of other livestock industries, in addition to that of the cattle industry. Therefore, the regulators have a responsibility to weigh not only the effects of their decisions on the cattle industry but also on the competitor livestock industries.
• Other Canadian food manufacturers: Regulator responsibilities extend to other food manufacturers. Any shift in the type of food permitted for livestock will affect other types of food manufacturers. Thus, the regulators’ responsibilities for other food manufacturers are similar to that for the other livestock industries.
• Consumers of Canadian beef: Because of uncertainties about the source of mad cow disease in this case, the degree of risk to consumers was not clear. In addition, there were uncertainties about whether there were adverse effects from the use of beef by-products for feed to other livestock or from the use of other mammal by-products in cattle feed. These uncertainties made it difficult for regulators to adopt an appropriate policy on behalf of beef consumers. A central part of the regulators’ dilemma was a lack of consensus about the nature of their responsibility to consumers. Some people argued that the regulators were responsible for ensuring absolute consumer safety, which meant that regulators should err on the side of safety in cases of uncertainty. Others argued that the regulators were responsible only for known safety problems and that it was appropriate to weigh cattle industry and other economic factors against the interests of consumers. A further complication was the demand of consumers for low beef prices. Questions were raised about whether consumers would be willing to pay for increased safety.
E. The validity of this argument depends on one’s values and on the uncertainties described in the answer to Part D. The source of the mad cow infection was unknown, and the extent of potential infections throughout the industry was also unknown. Some experts argued that the combined probabilities of mad cow disease and human infection were very low. And, there had been no cases of brain-wasting disease related to the consumption of Canadian beef. Thus, some people argued that no serious risk existed. However, both the cattle and human forms of the disease took many years to develop, and at least some risk existed that problems would become evident in the future. It was also difficult to define an acceptable level of risk. Was it acceptable if only a small number of people were to develop a fatal brain-wasting disease? Or should the target number have been zero?
F. There is no single answer to this question. The goal is for students to synthesize the issues addressed in Parts A through E into a cohesive conclusion. Students must also
© 2012 John Wiley and Sons Canada, Ltd.

Chapter 9: Joint Product and By-Product Costing 172
make difficult decisions about how factors should be weighed in light of conflicting interests.
© 2012 John Wiley and Sons Canada, Ltd.