Embed Size (px)
Citation preview
ECONOMIC REPORT ON INDONESIA 2018
CHAPTER 9
The Government’s fiscal policy in 2018 was aimed at maintaining fiscal sustainability, while continuing to create room to support economic growth. Fiscal sustainability was achieved through reductions in both the primary balance deficit and the 2018 state budget deficit, while efforts were also made to strengthen the structure of government debt. Other key fiscal policy issues related to the increased role of regional fiscal policy, infrastructure project development and the strengthening of structural policies.
Fiscal Policy and Structural Reform

CHAPTER 9 | ECONOMIC REPORT ON INDONESIA 2018132 |
Fiscal policy direction in 2018 was focused on efforts to maintain fiscal sustainability, while continuing to create room for economic growth. This policy took
into consideration the importance of fiscal resilience in maintaining economic stability amid heightened global uncertainty. The Government continued to view the state and regional budgets (APBN, APBD) as a countercyclical macroeconomic policy tool to maintain the momentum of economic recovery. In line with this, structural policies were strengthened further to increase economic capacity, which itself sustains stability and economic growth over the medium term.
Policy direction was pursued through strategies in each component of the 2018 State Budget. In terms of state revenue, Indonesia aimed to increase state revenues from taxes by using an updated tax database and improving tax compliance. In terms of state expenditure, Indonesia sharpened the focus of spending by supporting economic growth through social protection programs, better-targeted subsidies, and the strengthening of fiscal decentralization to hasten the reduction of poverty and social inequality. In terms of financing, efforts were made to ensure that financing strategies were put into practice in a prudent, efficient, balanced and productive manner so as to support fiscal sustainability. National policy strategy was supported by regional fiscal policy and the development of infrastructure projects through varied financing schemes. Structural reforms also continued through an array of structural policies aimed at improving the business climate.
In 2018, Indonesia successfully maintained fiscal sustainability while continuing to support economic growth. The prospects for fiscal sustainability improved as reflected in the 2018 primary balance deficit, which declined to IDR1.86 billion or 0.01% of gross domestic product (GDP). Consequently, the realized 2018 budget deficit declined to 1.76% of GDP. The ratio of government debt to GDP remained at a safe level of around 30% in 2018. Meanwhile, spending on social protection programs and a higher regional fiscal stimulus, in addition to infrastructure spending, all helped to propel economic growth.
9.1. Increase in Tax Revenues
The Government adopted various strategies to optimize state revenue, both through tax revenues and non-tax state revenues (NTR). To optimize tax revenues, the Government persisted with tax reform policies. This included strengthening the capacity of the tax office, utilizing the momentum of the implementation of automatic exchange of financial information between countries, and improving national tax administration. In relation to NTR, the Government continued to strengthen the management of this revenue stream and improve the performance of state-owned enterprises. Better NTR management was achieved by improving regulations, including on NTR tariffs, better cost recovery efficiencies, and the application of a gross split system for oil and gas.
The Government pursued six main tax policies in 2018. First, it simplified and accelerated the provision of tax refunds.1 This is designed to encourage investment and assist companies, including small and medium enterprises (SME), with business financing by hastening the return of value-added tax (VAT). It is also intended to encourage growth in business activities and drive sustainability, improve the ease of doing business for individual and corporate taxpayers and raise Indonesia’s ranking in the World Bank Ease of Doing Business survey. Second, Indonesia introduced joint inspection by three agencies in assessing the efficiency and accuracy of the value of the profit-sharing obligation and income tax of oil and gas contractor partnership contracts. The three agencies are the Directorate General of Taxation, the Financial and Development Supervisory Agency (BPKP), and the Special Task Force for Upstream Oil and Gas Business Activities (SKK Migas). The joint inspections began in 2018.
Third, Indonesia simplified the VAT exemption policy and/or sales tax on imported luxury goods (PPnBM) or the transfer of taxable goods and taxable services, which applied to representatives of foreign countries and international bodies. Fourth, Indonesia adjusted the tariffs on Article 22 income tax on the import of 1,147
1 Minister of Finance Regulation No. 39/PMK.03/2018 concerning the Procedure for Returning the Preliminary Excess on Tax Payments.
Chapter 9Fiscal Policy and Structural Reform
ECONOMIC REPORT ON INDONESIA 2018 | CHAPTER 9 | 133
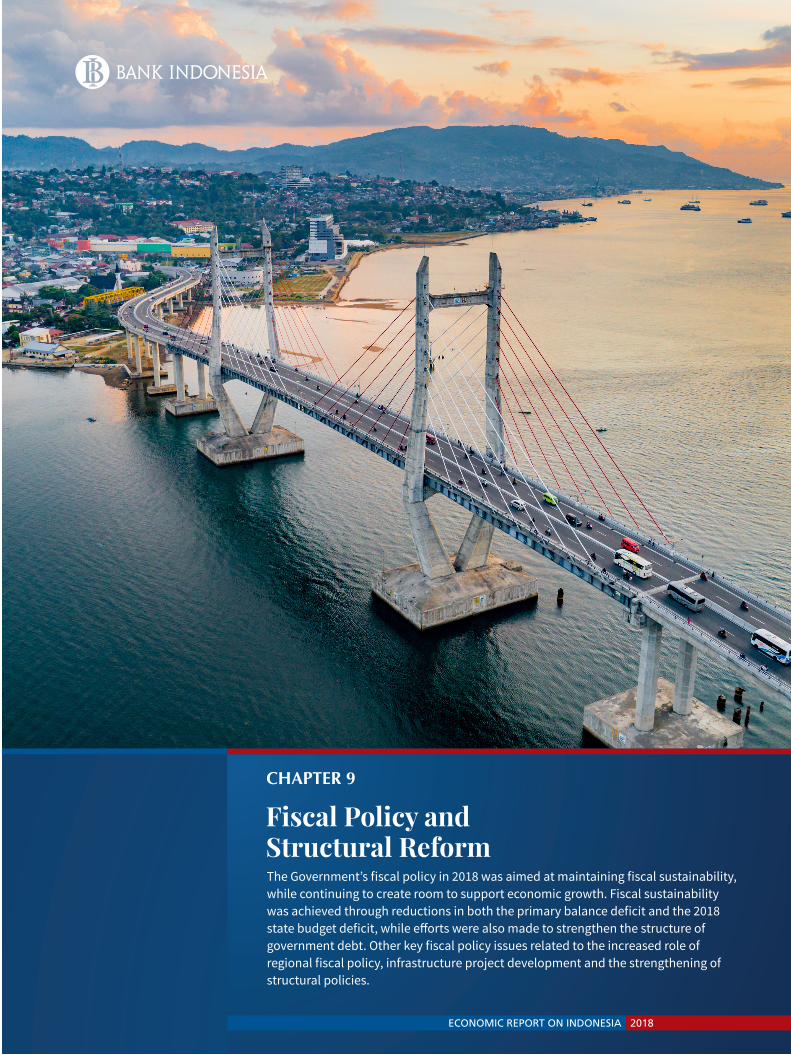
performance pushed up the ratio of tax revenues to GDP to 10.3% in 2018 from 9.9% in 2017 (Chart 9.2).
The increase in tax revenues came from higher oil and gas tax revenues, non-oil and gas tax revenues, land and property tax revenues, and international trade tax revenues (Chart 9.3). The non-oil and gas tax revenues in 2018 were boosted by the improved tax database and increased tax compliance. The increase in property tax revenues, meanwhile, came mainly from tax on ownership or control of land in the mining and quarrying sector, in line with higher average coal prices compared to 2017. The growth in international trade tax revenues was supported by higher revenues from import and export duties.
types of goods, with effect from September 2018.2 Fifth, tax holidays were provided for 18 types of ‘pioneer’ industry. These tax holidays ranged from five to 20 years, depending on the value of the investment (Box 9.2 Fiscal Incentives to Encourage Economic Growth). The sixth and final tax policy was the provision of tax incentives for export proceeds from industries based on natural resources, regulated in a sixteenth economic policy package.3
Policy strategy in the field of taxation was supported by tax intensification efforts – the expansion of the tax base and increased tax compliance. Data shows that the number of registered taxpayers increased compared to 2017, testament to the positive impact of the tax amnesty program. The program led to an increase in the number of registered taxpayers who must submit an annual tax return. Along with the increasing tax base, the compliance rate also improved: the submission of tax returns increased to 73% in 2018 from 70% in 2017.
The Government also reformed NTR by updating the relevant legal provisions.4 These revisions were designed to gather and optimize NTR, encourage good governance, and simplify or reduce the types and rates of NTR, particularly related to basic services, without reducing the responsibility to continue providing these basic services. The legal provisions cover: (i) grouping NTR objects into six groups or clusters; (ii) regulating tariffs and the impact on the community; (iii) improving governance through self-assessment verification; (iv) strengthening of supervision of tax office employees by government internal supervisors; (v) more extensive checks on NTR management agencies, partners of NTR management agencies, and NTR compulsory payments; and (vi) the right to waivers on compulsory payments under certain circumstances.
These policies helped actual state revenues exceed the 2018 State Budget target (102.5%), with growth of 16.6% from 2017. Both tax revenues and NTR grew at higher rates than in 2017 (Table 9.1). The 2018 tax revenues rose sharply by 13.2%, also exceeding the combined average for the last seven years (Chart 9.1). This positive
2 Minister of Finance Regulation No. 110/2018 on Amendments to Minister of Finance Regulation No. 34/PMK.010/2017.
3 Government Regulation No. 1 of 2019 concerning Export Proceeds from the Exploitation, Management and/or Processing Activities of Natural Resources.
4 Law No. 9 Year 2018 concerning Non-tax Revenues (NTR).
2008 2009 2010 2011 2012 2013 2014 2015 2016 2017 2018
IDR trillion Percent
Grafik 5.1. Rasio dan Pertumbuhan Pajak
Source: Ministry of Finance
Tax Revenue
200
400
600
800
1,000
1,200
1,400
1,600
1,800
-10
-5
0
5
10
15
20
25
30
35
40
Tax Growth (rhs)
Chart 9.1. Tax Revenue and Growth
Source : Ministry of Finance
Grafik 5.6. Penerimaan Pajak, Rasio Pajak dan PertumbuhanPajak di luar Migas
1,600
0
2
4
6
8
10
12
14
16
1,200
1,000
800
600
400
200
0
1,400
IDR trillion Percent
Tax Ratio to GDP (rhs)
Tax Revenue
2008 2009 2010 2011 2012 2013 2014 2015 2016 2017 2018
Tax Ratio exclude Oiland Gas IncomeTax to GDP (rhs)
Chart 9.2. Tax Revenue, Tax Ratio, and Tax Ratio Exclude Oil and Gas
CHAPTER 9 | ECONOMIC REPORT ON INDONESIA 2018134 |
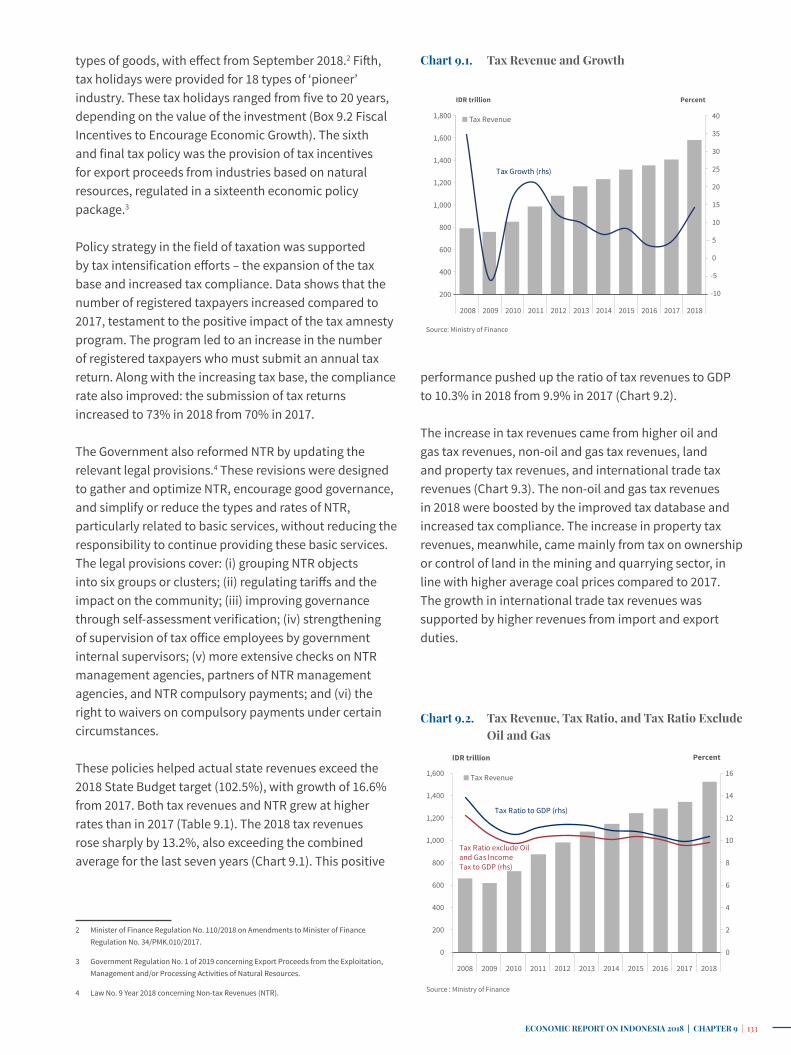
Tax revenues from import activities also increased as a result of both higher imports and new government policy on import tariffs (Chart 9.4). The increase in tax revenues
related to imports mainly arose from the enactment of Article 22 income tax and the sales tax on imported luxury goods. The higher revenues arising from the enactment of Article 22 regarding income tax on imports was supported by better compliance with tax payments, and by tariff increases. These took effect in the fourth quarter of 2018. Similarly, the increase in revenues from the sales tax on imported luxury goods was due to higher tariffs. Nonetheless, revenues from VAT on imports declined as a result of the fourth quarter slowdown in imports of consumer goods, which were hit by the weaker exchange rate.
In contrast to the higher non-oil and gas tax revenues, the growth in overall VAT revenues in 2018 was not as high as in 2017. This reflects the weaker performance of VAT imposed on imports compared to 2017. Other VAT components performed better. By sector, domestic VAT revenues were mainly driven by strengthening of the mining sector, which itself was driven by an increase in
-50
-40
-30
-20
-10
0
10
20
30
40
50
60 2016 2017 20182014 2015
Grafik 5.2. Pertumbuhan PPh Non Migas
Source: Ministry of Finance
Oil and GasIncome Tax
Non-oil andGas Income
Tax
ValueAdded Tax
Land andBuilding Tax Duty International
Trade Tax
Percent
Chart 9.3. Non-oil and Gas Income Tax Growth
Table 9.1. State Revenue and Expenditure
Items
Revised Budget
2017Realization 2017
State Budget
2018Realization 2018
IDR Trillion
IDR Trillion
Percent GDP
Growth(percent,
yoy)
PercentRevisedBudget
IDR Trillion
IDR Trillion
Percent GDP
Growth(percent,
yoy)
PercentState
Budget
A. State Revenue 1736.1 1666.4 12.3 7.1 96.0 1894.7 1942.3 13.1 16.6 102.5
I. Domestic Revenue 1733.0 1654.7 12.2 6.9 95.5 1893.5 1928.4 13.0 16.5 101.8
1. Tax Revenue 1472.7 1343.5 9.9 4.5 91.2 1618.1 1521.4 10.3 13.2 94.0
2. Non-tax Revenue 260.2 311.2 2.3 18.8 119.6 275.4 407.1 2.7 30.8 147.8
II. Grants 3.1 11.6 0.1 29.4 370.4 1.2 13.9 0.1 19.5 1161.3
B. State Expenditure 2133.3 2007.3 14.8 7.7 94.1 2220.7 2202.2 14.8 9.7 99.2
I. Central Government Expenditure 1367.0 1265.4 9.3 9.6 92.6 1454.5 1444.4 9.7 14.1 99.3
1. Employee Expenditure 340.4 312.7 2.3 2.5 91.9 365.7 346.7 2.3 10.9 94.8
2. Goods Expenditure 318.8 291.5 2.1 12.3 91.4 340.1 337.0 2.3 15.6 99.1
3. Capital Expenditure 206.2 208.7 1.5 23.1 101.2 203.9 184.9 1.2 (11.4) 90.7
4. Debt Interest Payments 219.2 216.6 1.6 18.5 98.8 238.6 258.1 1.7 19.2 108.2
5. Subsidies 168.9 166.4 1.2 (4.5) 98.5 156.2 216.8 1.5 30.3 138.8
6. Grant Expenditure 5.5 5.4 0.0 (23.6) 99.0 1.5 1.5 0.0 (72.5) 102.7
7. Social Assistance 58.1 55.3 0.4 11.5 95.2 81.3 83.9 0.6 51.7 103.2
8. Other Expenditures 49.9 8.8 0.1 46.1 17.6 67.2 15.6 0.1 77.2 23.2
II. Transfer to Regions and Village Fund 766.3 742.0 5.5 4.5 96.8 766.2 757.8 5.1 2.1 98.9
1. Transfer to Regions 706.3 682.2 5.0 2.8 96.6 706.2 697.9 4.7 2.3 98.8
2. Village Fund 60.0 59.8 0.4 28.0 99.6 60.0 59.9 0.4 0.2 99.8
C. Primary Balance (178.0) (124.4) (0.9) (0.7) 69.9 (87.3) (1.8) (0.0) (98.6) 2.0
D. Surplus/Deficit (397.2) (341.0) (2.5) 10.7 85.8 (325.9) (259.9) (1.8) (23.8) 79.7
E. Financing 397.2 366.6 2.7 9.6 92.3 325.9 300.4 2.0 (18.1) 92.2
Source : Ministry of Finance

ECONOMIC REPORT ON INDONESIA 2018 | CHAPTER 9 | 135
average coal prices, and by the construction sector as infrastructure projects were completed. Meanwhile, excise tax revenues grew by 4.1%, higher than the 2018 budget target.
In line with the higher tax revenues, NTR also increased, mainly underpinned by non-oil and gas natural resources (Chart 9.5). An improvement in the efficiency and services provided by public service agencies also contributed to the increase in NTR in 2018. NTR in 2018 came to IDR407.1 trillion, up 30.8% from 2017, and also outpacing 2017 growth of 18.8%. NTR was, however, also lifted by other revenue streams – notably higher revenues from the installation of base transceiver stations. This forms part of Indonesia’s long-term development of its communications network.
9.2. Sharpening State Expenditure
The Government adopted several strategies to sharpen the role of state expenditure in stimulating the economy. In general, this strategy was undertaken through more effective social protection programs and better-targeted subsidies (Box 9.1 Social Protection and Transfers to the Regions for Equitable Economic Growth). More specifically, Indonesia achieved this through social assistance (transfer of funds to the poor), strategic subsidies, expenditure on education and healthcare, and on transfers of funds from central to local or provincial governments, and Village Funds.
2014 2015 2016 2017 2018*
Grafik 5.4. Pertumbuhan Impor dan Pajak atas Impor
Source: Ministry of Finance
Percent
-15
-10
-5
0
5
10
15
20
25
Tax on Import
Import
Chart 9.4. Import Growth and Tax on Import
2016 2017 20182014 2015
Grafik 5.5. Pertumbuhan PNBP
Source: Ministry of Finance
Non-tax Revenuefor NaturalResources
Part of Profit fromState OwnedEnterprises
Other Non-taxRevenue
Public ServiceAgency Income
Percent
-80
-60
-40
-20
0
20
40
60
80
Chart 9.5. Non-tax Revenue Growth
The Government’s policy to stimulate the economy is illustrated by the acceleration of social assistance distribution from the beginning of 2018. This also demonstrates the Government’s focus on reducing poverty and social inequality. To achieve this goal, the Government increased the number of families entitled to benefits under the Family Hope Program to 10 million from 6 million. As a result, the program budget rose to IDR18 trillion in 2018 from IDR11 trillion in 2017. The Government also expanded the number of families entitled to non-cash food assistance to 10 million in 2018 from 1.2 million in 2017. This social protection strategy was accompanied by better data on the beneficiaries of the Family Hope Program and the recipients of non-cash food assistance subsidies. With this policy, social protection spending in 2018 reached IDR291.7 trillion, an increase of IDR17 trillion compared to 2017. The social protection budget accounts for 6.2% of state spending (Chart 9.6). As a consequence, the value of distributed
social assistance grew by 51.7% in 2018, more briskly than the 11.5% of 2017.
The Government also adopted strategies to maintain purchasing power. One such strategy related to subsidies. Fixed subsidies on diesel were increased to IDR2,000 per liter from IDR1,500 per liter. This was done to offset the impact of rising global crude oil prices and the weak rupiah exchange rate, which significantly overreached the budget assumption. The increase in energy subsidies was countered, however, by improvements in the distribution of subsidies and by more accurately targeting the recipients of the subsidies. The adjustment to the diesel subsidies contributed to realized subsidies in 2018

CHAPTER 9 | ECONOMIC REPORT ON INDONESIA 2018136 |
reaching 138.7% of the ceiling set in the state budget. This high level of subsidies was also due to payments made in 2018 to Pertamina, PLN and Pupuk Indonesia to cover underpayment of subsidies in 2017.
The Government also showed consistency in continuing to implement education and healthcare national development priority programs. In an effort to improve the quality of education, the state education budget remained at 20% of both central and regional government spending. With the high education budget, the number of students receiving Indonesia Smart Cards (KIP) increased to 19.7 million students in 2018 from 18.2 million students in 2017. The number of recipients of Bidik Misi scholarships rose to 401,500 in 2018 from 290,000 in 2017.5 The Government also maintained the health budget at 5% of state expenditure. Some of the central health budget was allocated to the Ministry of Health to implement the national health insurance program through the distribution of the Indonesia Health Card to 92.4 million people. For the transfers to the regions, the health budget allocation was channeled through health and family planning special allocation funds (DAK), health operational assistance and family planning operational assistance.
Sharpening of the role of state expenditure was also achieved through transfers to the regions and via Village Funds (TKDD). This policy was focused on improving the quality of public services in the regions, poverty reduction and reduction in regional inequality and improving the
5 Bidik Misi scholarships have been awarded since 2010. Bidik Misi is a government scheme to fund the education of gifted students from low-income families.
effectiveness of budget spending. Specifically, TKDD policy covered: (i) strengthening the synchronization of TKDD planning and budgeting with the spending allocation of ministries and institutions; (ii) better management of general and special transfer funds; (iii) reformulation of regional incentive funds allocation; and (iv) reformulation of the Village Funds allocation.
In line with this strategy, TKDD channelled to the regions in 2018 reached IDR757.8 trillion or 98.9% of the 2018 target, versus 96.8% in 2017. The growth in TKDD was supported by high growth in the distribution of revenue-sharing funds, particularly in the fourth quarter of 2018, but also by a shortfall in revenue-sharing payments in previous years. Growth in physical DAK contracted, although to a lesser degree than in 2017. The disbursement of non-physical DAK and Village Fund money was sluggish, given changes in the distribution pattern and additional requirements for disbursement. In general, the role of the regions in supporting national development priority programs increased. This can be seen in the higher portion of the health budget channeled through TKDD in 2018 (Chart 9.7).
State expenditure in 2018 reached IDR2,202.2 trillion, up 9.7% from 2017 (Chart 9.8). This was accompanied by higher absorption of spending in 2018 than in 2017. The growth in state expenditure was mainly driven by central government spending, which reached IDR1,444.4 trillion, up 14.1% compared to an increase of 9.6% in 2017 (Chart 9.9). The higher budget absorption at the beginning of the year came on the back of central government spending, particularly government consumption,
Grafik 5.9. Komposisi Belanja Negara
2014 2015 2016 2017 2018
IDR trillion
0
200
400
600
800
1,000
1,200
1,400
1,600
Total Thematic Budget
HealthSocial Protection Energy SubsidyEducation Infrastructure
Source : Ministry of Finance
Chart 9.6. Thematic Budget Expenditure
Grafik 5.10. Anggaran Kesehatan dan Pendidikan MelaluiTKDD
Health Budget through TKDD Education Budget through TKDD
IDR trillion
0
10
20
30
40
50
60
70
2014 2015 2016 2017 2018
Source : Ministry of Finance
Chart 9.7. Health and Education Budget through TKDD

ECONOMIC REPORT ON INDONESIA 2018 | CHAPTER 9 | 137
distribution of social assistance and subsidies since the beginning of 2018. By comparison, for other expenditure – such as goods and capital – higher absorption was only seen in the second half of 2018, having been reined in during the first half.
9.3. Strengthening the Financing Strategy
The Government’s policy strategy supported fiscal sustainability and the ongoing health of the 2018 State Budget. The primary balance deficit in the 2018 State Budget declined to IDR1.8 trillion, or 0.01% of GDP, from 0.91% of GDP in 2017 (Chart 9.10). On the back of this development, the state budget deficit declined to 1.76%
Grafik 5.7. Belanja Negara
State ExpenditureRatio to GDP(rhs)
State ExpenditureGrowth(rhs)
State Expenditure
-5
5
10
15
20
25
30
35
0 -10
500
1,000
1,500
2,000
2,500
IDR trillion Percent
0
2008 2009 2010 2011 2012 2013 2014 2015 2016 2017 2018
Source: Ministry of Finance
Chart 9.8. State Expenditure
Grafik 5.8. Komposisi Belanja Negara
Absorption of State Expenditure (rhs)
TKDD Central Government Expenditure
IDR trillion Percent of Revised Budget
75
80
85
90
95
100
105
0
500
1,000
1,500
2,000
2,500
2008 2009 2010 2011 2012 2013 2014 2015 2016 2017 2018
Source: Ministry of Finance
Chart 9.9. Composition of State Expenditure
Primary Balance
Fiscal Deficit
-3
-2
-1
0
1
2
3
Percent GDP
2008 2009 2010 2011 2012 2013 2014 2015 2016 2017 2018
Source: Ministry of Finance
Grafik 5.14. Defisit Fiskal dan Keseimbangan PrimerChart 9.10. Fiscal Deficit and Primary Balance
of GDP in 2018, versus the deficit target of 2.19% of GDP, and financing reached IDR300.4 trillion, 7.8% lower than the financing target of IDR325.9 trillion.
The healthy performance of the 2018 State Budget was underpinned by prudent financing strategies. The strategy to manage the issuance of government securities (SBN) was carried out by optimising issuances in the domestic market, optimising the role and capacity of main dealers, and making improvements to government Islamic securities (SBSN). In terms of composition, SBN – retail and non-retail – dominated government debt in 2018. In an effort to open access to the wider community to participate in infrastructure financing, the Government for the first time in 2018 issued retail SBN online in the form of retail savings bonds (SBR) and sukuk savings (ST). Issuances of SBR rose to IDR7.3 trillion and ST reached IDR4.3 trillion, with average investor orders reaching IDR337.9 million for SBR and IDR300.2 million for ST. The public interest in issuances of SBR and ST was high, as reflected in the number of new investors buying SBR (17,195 investors) and ST (11,591 investors). Overall, the total number of registered SBR investors reached 34,510 and ST investors reached 16,477.
In line with its prudent financing strategy, the Government adjusted the SBN issuance plan by taking on more foreign loans. This was designed to reduce SBN interest costs, which had risen on the back of pressure from increases in global interest rates. The average yield on rupiah SBN in 2018 was 5%, higher than the 2017 average of 3%. Meanwhile, the interest rate on SBN denominated in foreign currency was on average twice as high as the

CHAPTER 9 | ECONOMIC REPORT ON INDONESIA 2018138 |
interest rates on foreign loans. By adopting this strategy, the Government was able to take on IDR88.9 trillion of foreign loans (gross) in 2018, up from IDR51.7 trillion in 2017. This strategy underscores the Government’s goal of maintaining fiscal sustainability.
The non-retail SBN issuance strategy took into consideration the timing, denomination and tenor of the issuances. In terms of the timing, the issuance of SBN, particularly foreign currency SBN, had already started at the beginning of the year with USD3 billion of issuances, equivalent to IDR40 trillion. Given this strategy, spending at the beginning of the year can be optimized with minimal impact on domestic market stability. To increase market depth and distribute the risk of maturing SBN, issuances in foreign currencies were made in a range of tenors. Besides rupiah and US dollar issuances, SBN were also issued in euro and yen, and were made in a range of tenors from 3 years, to 5 years, and up to 15 years. Further, the Government’s prudent financing strategy was also reflected in the proportion of debt denominated in rupiah, which accounted for 58% of the total (Chart 9.11). In terms of the foreign currency portion, the amount of foreign currency denominated SBN has increased since 2015 (Chart 9.12). More than 70% of this is debt denominated in US dollars.
The financing component of government investment was intended to support the acceleration of infrastructure development, improve education, and strengthen micro, small and medium enterprises (MSME). Support was provided by increasing the role of state-owned enterprises and public service agencies. Further, the
Government invested in PT Kereta Api Indonesia as part of efforts to enhance Indonesia’s transport infrastructure. And, in order to support land acquisition for national development, the Government injected capital into the State Asset Management Agency, a public service agency. To improve the quality of national education, investment financing was given to the National Education Development Fund, another public service agency. In addition, the Government also strengthened the activities of MSME that seek to improve welfare by funding public service agencies working in forestry, fisheries and housing.
Given the direction of fiscal policy in 2018 and, in turn, the financing strategies, the Government’s debt position was maintained at a low and healthy level. The ratio of government debt to GDP was kept in a safe corridor in 2018 at 29.8% of GDP, slightly higher than the 29.1% of GDP in 2017 (Chart 9.13). Most of the debt was comprised of SBN (81.8% of total debt), and the remainder was foreign loans. The debt ratio remains at a lower level than that of other countries in the Asia region, including India, China and Malaysia (Chart 9.14).
9.4. Encouraging the Fiscal Role of the Regions
Regional governments (pemda) also played a role in catalyzing the economy. Regional governments, in their financial management, sought to increase regional fiscal effectiveness and efficiency to support growth. Efforts to strengthen regional fiscal management
Grafik 5.16. Realisiasi Anggaran Infrastruktur
Percent, share
IDR USD JPY EUR SDR Others
2008 2009 2010 2011 2012 2013 2014 2015 2016 2017 2018
10
20
30
40
50
60
70
80
90
100
0
Source: Ministry of Finance
Chart 9.11. Composition of Government Debt Based on Currency
Grafik 5.15. Porsi Anggaran Tematik Terhadap Belanja Negara
0
10
20
30
40
50
60
70
80
90
100
Percent of Total SBN SBN in Rupiah SBN in Foreign Currency
2008 2009 2010 2011 2012 2013 2014 2015 2016 2017 2018
Source: Ministry of Finance
Chart 9.12. Composition of Government Securities

ECONOMIC REPORT ON INDONESIA 2018 | CHAPTER 9 | 139
through increasing regional revenue was carried out by prioritizing the optimization of locally generated revenues (LGR) and central government transfers. Meanwhile, strategies to strengthen and improve the quality of regional expenditure were prioritized because of the need to encourage more productive regional spending. Meanwhile, strategies to strengthen and improve the quality of regional expenditure were prioritized in an effort to encourage more productive regional expenditure. The central government was also consistent in its efforts to drive capacity building and better management of regional finances. This latter point was achieved by increasing the allocation of regional transfer funds and balancing them with spending by ministries/institutions, as well as improving monitoring of the realized regional budget, whether performance of budget realization or physical realization.
Grafik 5.17. Komposisi Utang Pemerintah
External Debt SBN
Total Debt
0
10
15
20
5
25
30
35
40
Percent GDP
2008 2009 2010 2011 2012 2013 2014 2015 2016 2017 2018
Source: Ministry of Finance
Chart 9.13. Composition of Government Debt to GDP
Grafik 5.18. Perbandingan Rasio Utang Dengan Negara Peers
Source: International Monetary Fund, calculated
India
Malaysia
Vietnam
Thailand China
Philippines
Indonesia
10
20
30
40
50
60
70
Percent GDP
80
2014 2015 2016 2017 2018
Chart 9.14. Government Debt Ratio of Selected Countries
Against this backdrop, 2018 regional revenue and expenditure increased. In 2018, the consolidated regional budget revenues reached IDR1,094.9 trillion, up 4.2% compared to 2017. This increase reflects higher allocations for TKDD and an increase in LGR. Consolidated regional budget expenditure rose by approximately 5% from the 2017 figure of IDR1,153.8 trillion.
Generally, the contribution of LGR to total regional revenues increased, though the sources of regional revenue were still dominated by balancing funds.6 The proportion of balancing fund transfers in the 2018 state budget fell to 60.9% of the total regional revenue budget, down from the 2017 figure of 63.2%. Meanwhile, LGR represented 24.6% of regional revenue in 2018, up from 23.1% in 2017 (Chart 9.15). The higher proportion of LGR in regional revenue indicates better regional fiscal autonomy. The increase in balance fund transfers arose from the transfer of revenue-sharing funds, which were supported higher prices and stronger demand for mining commodities, and an increase in DAK to hasten the development of regional infrastructure. Meanwhile, the allocation of general allocation funds (DAU) in the state budget declined. This reflected efforts to anticipate the dynamics of state revenues, which is one of the variables used in the calculation of DAU for distribution to the regions.
The increase in LGR reflects an increase in regional tax revenues. On a consolidated basis, the LGR budget in 2018 rose by 11.1%, mainly coming from an increase
6 Balancing funds originate from APBN revenues allocated to regions to fund regional needs in the context of implementing decentralization. The amount of the balancing fund is set every budget year in the state budget.
Grafik 5.19. Kontribusi Komponen Pendapatan APBD
IDR trillion
Local Revenue Balancing FundsOther Legitimate Local Revenue
0
100
200
300
400
500
600
700
2014 2015 2016 2017 2018
Source: Ministry of Finance
Chart 9.15. Components of Revenue in Regional Budget (APBD)

CHAPTER 9 | ECONOMIC REPORT ON INDONESIA 2018140 |
in regional tax revenues. Regional governments put in place several strategies to drive LGR, including updating the local tax database and implementing an online tax payment service (non-cash). The highest growth in LGR was recorded in the consolidated regional expenditure of Maluku, West Sulawesi and Central Sulawesi. This was underpinned by the better performance of industry, particularly mineral processing (Chart 9.16). Furthermore, several international events held in the regions also helped to boost LGR, including the 2018 Asian Games (in Jakarta and South Sumatra), the IMF–World Bank Annual Meetings in Bali, and several other international sports events and festivals.
Regional governments also tried to sharpen regional expenditure. Regional expenditure budgets in 2018 were larger, with a higher allocation for goods and services, social assistance and grants. The allocation of regional expenditure budgets in a more productive direction was reflected in the proportion of expenditure on goods and services, and capital expenditure, to total expenditure, which remained high (Chart 9.17). In 2018, expenditure on goods and services was just over 20% of total regional expenditure, with capital expenditure also around 20%. Higher capital expenditure was mainly evident in Maluku and West Papua, due to efforts to accelerate development of regional infrastructure. The increase in more productive spending was also evident in the allocation of expenditure on civil servants, which was little changed (up only 1.4% and still below 35% of total spending in most regions). The size of the allocation of expenditure on civil servants was unchanged compared to the previous year (Chart 9.18).
Regional revenue and expenditure stimulus played a role in pushing up regional budget deficits in 2018. In 2018, the regional budget deficit reached IDR58.9 trillion, up nearly 25% compared to 2017. The largest increases in budget deficits were in Jakarta, West Papua and North Sulawesi. These higher deficits underscore the efforts being made by the regional governments to more aggressively accelerate regional economic growth. The financing of the deficits in 2018 mostly came from unspent budget funds from the previous fiscal year which, in aggregate terms, reached IDR58.2 trillion (Table 9.2). The remainder came from other financing, such as the disbursement of reserve funds and regional loans.
As a result of the generally more-accountable and performance-based management of regional budget
Grafik 5.20. Perkembangan PAD Menurut Wilayah
IDR trillion
2016 2017 2018
0
20
40
60
80
100
120
140
160
180
Sumatra Java Kalimantan Sulawesi Mapua Bali-Nusra
Source: Ministry of Finance
Chart 9.16. Local Revenue by Region
Grafik 5.21. Komposisi Belanja APBD
20162015 2017 2018
Employee Expenditure Capital ExpenditureTransfer Expenditure Other Expenditure
Goods and ServiceExpenditure
0
20
40
60
80
100
Percent
Source: Ministry of Finance
Chart 9.17. Composition of Expenditure in Regional Budget (APBD)
Grafik 5.22. Komposisi Belanja APBD Menurut Wilayah
0
20
40
60
80
100
Percent
Capital Expenditure Transfer Expenditure Other ExpenditureEmployee Expenditure Goods and Service Expenditure
Sumatra Java Kalimantan Sulawesi Mapua Bali-Nusra
Source: Ministry of Finance
Chart 9.18. Composition of Regional Budget Expenditure by Region

ECONOMIC REPORT ON INDONESIA 2018 | CHAPTER 9 | 141
expenditure in 2018, realized regional budget expenditure proceeded fairly smoothly. In aggregate terms, the realized regional budget expenditure was recorded at around 80%, although a number of regions experienced slow realization of the budget due to administrative constraints (Chart 9.19). The issues included delays in the approval of regional budgets, which meant the regional budgets could only be ratified in the first quarter of 2018. The application of a number of government regulations to ensure optimal absorption of regional budgets and to minimize the unused regional government funds in banks had a positive impact. This is indicated in the amount of
Grafik 5.23. Kom
Source: Ministry of Finance
IDR trillion Percent
2017 Realization (rhs)
2018 Realization (Rhs)
0
20
40
60
80
100
120
140
0
20
40
60
80
100
120
140Budget 2017 Budget 2018
East
Jav
a
Wes
t Jav
a
Cent
ral J
ava
DKI J
akar
ta
Nor
th S
umat
ra
Papu
a
Sout
h Su
law
esi
Aceh
Bant
en
Sout
h Su
mat
ra
Riau
Lam
pung
East
Kal
iman
tan
Bali
Wes
t Sum
atra
East
Nus
a Te
ngga
ra
Wes
t Kal
iman
tan
Sout
h Ka
liman
tan
Wes
t Pap
ua
Cent
ral K
alim
anta
n
Wes
t Nus
a Te
ngga
ra
Cent
ral S
ulaw
esi
Sout
heas
t Sul
awes
i
Jam
bi
Nor
th S
ulaw
esi
DI. Y
ogya
kart
a
Mal
uku
Beng
kulu
Riau
Isla
nds
Nor
th M
aluk
u
Babe
l Isl
ands
Nor
th K
alim
anta
n
Wes
t Sul
awes
i
Goro
ntal
o
Chart 9.19. Realization of Expenditure in Regional Budget (APBD)
Table 9.2. Surplus, Deficit, and SiLPA
Region
2017 2018
DeficitBudget Surplus (SiLPA)
DeficitBudget Surplus (SiLPA)
Sumatra -9,7 11,9 -12,0 12,0
Java -21,4 27,3 -28,4 29,7
Kalimantan -6,2 5,8 -6,4 6,1
Sulawesi -3,4 3,3 -3,5 2,8
Bali-Nusra -3,7 3,8 -3,9 3,8
Mapua -3,0 3,5 -4,8 3,8
Source : Ministry of Finance
local government funds held in banks, which has fallen since 2016. However, this policy has not yet been able to bring about significant change in the pattern of regional budget expenditure, which still accelerates in the final quarter of the fiscal year.
9.5. Expanding Infrastructure Development
Fiscal policy in 2018 continued to provide space for economic stimulus, and was also supported by work to optimize the development of infrastructure projects. In line with the theme of the 2018 government work plan – to spur investment and infrastructure for sustainable and equitable growth – the 2018 infrastructure focus was on accelerating connectivity between Indonesia’s regions. The Government, through the Committee for Acceleration of Priority Infrastructure Delivery, has already shortlisted a number of urgent projects that are considered to be of national strategic importance and, prioritizing them, has provided facilities to smooth the project implementation.7 The evaluation and selection process picked 223 as National Strategic Projects (PSN) for 2016 to 2018 in 15 sectors at the project level and three sectors at the program level.8
The Government increased the 2018 infrastructure budget, testament to its commitment to optimize
7 Presidential Decree No. 58 of 2017 concerning the Amendment to Presidential Decree No. 3 of 2016 concerning the Accelerated Development of PSN.
8 Presidential Decree No. 56 of 2018 concerning the Second Amendment to Presidential Decree No. 3 of 2016 concerning the Accelerated Development of National Strategic Projects.
CHAPTER 9 | ECONOMIC REPORT ON INDONESIA 2018142 |
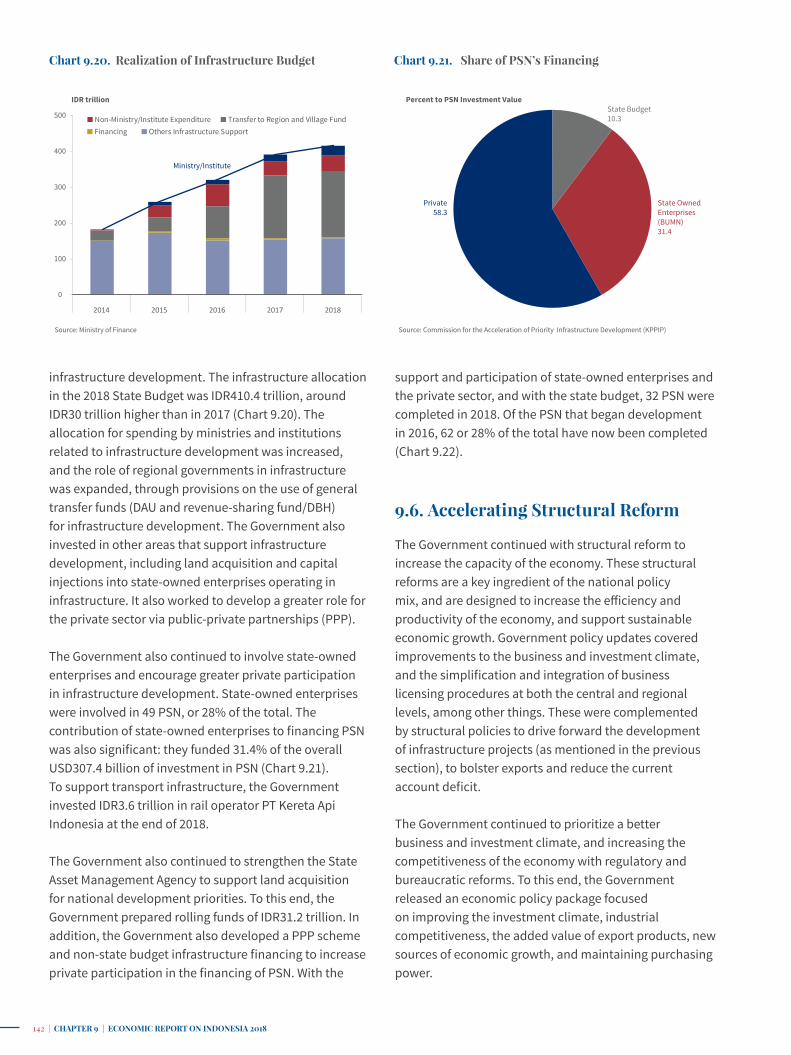
infrastructure development. The infrastructure allocation in the 2018 State Budget was IDR410.4 trillion, around IDR30 trillion higher than in 2017 (Chart 9.20). The allocation for spending by ministries and institutions related to infrastructure development was increased, and the role of regional governments in infrastructure was expanded, through provisions on the use of general transfer funds (DAU and revenue-sharing fund/DBH) for infrastructure development. The Government also invested in other areas that support infrastructure development, including land acquisition and capital injections into state-owned enterprises operating in infrastructure. It also worked to develop a greater role for the private sector via public-private partnerships (PPP).
The Government also continued to involve state-owned enterprises and encourage greater private participation in infrastructure development. State-owned enterprises were involved in 49 PSN, or 28% of the total. The contribution of state-owned enterprises to financing PSN was also significant: they funded 31.4% of the overall USD307.4 billion of investment in PSN (Chart 9.21). To support transport infrastructure, the Government invested IDR3.6 trillion in rail operator PT Kereta Api Indonesia at the end of 2018.
The Government also continued to strengthen the State Asset Management Agency to support land acquisition for national development priorities. To this end, the Government prepared rolling funds of IDR31.2 trillion. In addition, the Government also developed a PPP scheme and non-state budget infrastructure financing to increase private participation in the financing of PSN. With the
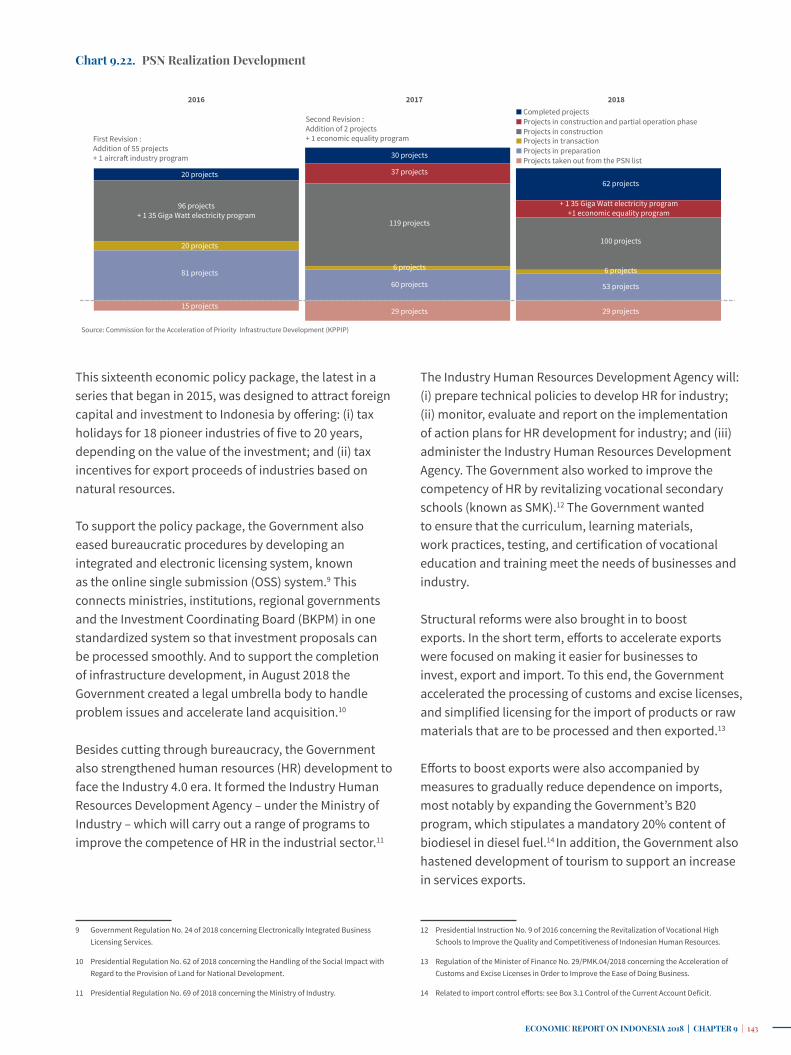
support and participation of state-owned enterprises and the private sector, and with the state budget, 32 PSN were completed in 2018. Of the PSN that began development in 2016, 62 or 28% of the total have now been completed (Chart 9.22).
9.6. Accelerating Structural Reform
The Government continued with structural reform to increase the capacity of the economy. These structural reforms are a key ingredient of the national policy mix, and are designed to increase the efficiency and productivity of the economy, and support sustainable economic growth. Government policy updates covered improvements to the business and investment climate, and the simplification and integration of business licensing procedures at both the central and regional levels, among other things. These were complemented by structural policies to drive forward the development of infrastructure projects (as mentioned in the previous section), to bolster exports and reduce the current account deficit.
The Government continued to prioritize a better business and investment climate, and increasing the competitiveness of the economy with regulatory and bureaucratic reforms. To this end, the Government released an economic policy package focused on improving the investment climate, industrial competitiveness, the added value of export products, new sources of economic growth, and maintaining purchasing power.
Grafik 5.11. Realisasi Anggaran Infrastuktur
Ministry/Institute
0
100
200
300
400
500
IDR trillion
Non-Ministry/Institute ExpenditureOthers Infrastructure Support
Transfer to Region and Village FundFinancing
2014 2015 2016 2017 2018
Source: Ministry of Finance
Chart 9.20. Realization of Infrastructure Budget Grafik 5.12. Pangsa Kebutuhan Pembiayaan PSN
Source: Commission for the Acceleration of Priority Infrastructure Development (KPPIP)
Percent to PSN Investment ValueState Budget10.3
State OwnedEnterprises(BUMN)31.4
Private58.3
Chart 9.21. Share of PSN’s Financing
ECONOMIC REPORT ON INDONESIA 2018 | CHAPTER 9 | 143
This sixteenth economic policy package, the latest in a series that began in 2015, was designed to attract foreign capital and investment to Indonesia by offering: (i) tax holidays for 18 pioneer industries of five to 20 years, depending on the value of the investment; and (ii) tax incentives for export proceeds of industries based on natural resources.
To support the policy package, the Government also eased bureaucratic procedures by developing an integrated and electronic licensing system, known as the online single submission (OSS) system.9 This connects ministries, institutions, regional governments and the Investment Coordinating Board (BKPM) in one standardized system so that investment proposals can be processed smoothly. And to support the completion of infrastructure development, in August 2018 the Government created a legal umbrella body to handle problem issues and accelerate land acquisition.10
Besides cutting through bureaucracy, the Government also strengthened human resources (HR) development to face the Industry 4.0 era. It formed the Industry Human Resources Development Agency – under the Ministry of Industry – which will carry out a range of programs to improve the competence of HR in the industrial sector.11
9 Government Regulation No. 24 of 2018 concerning Electronically Integrated Business Licensing Services.
10 Presidential Regulation No. 62 of 2018 concerning the Handling of the Social Impact with Regard to the Provision of Land for National Development.
11 Presidential Regulation No. 69 of 2018 concerning the Ministry of Industry.
Grafik 5.13. Perkembangan Realisasi PSN
Source: Commission for the Acceleration of Priority Infrastructure Development (KPPIP)
30 projects
37 projects
119 projects
6 projects
60 projects
29 projects
20 projects
96 projects+ 1 35 Giga Watt electricity program
20 projects
81 projects
15 projects
First Revision :Addition of 55 projects+ 1 aircraft industry program
Second Revision :Addition of 2 projects+ 1 economic equality program
2016 2017 2018
62 projects
100 projects
6 projects
53 projects
29 projects
+ 1 35 Giga Watt electricity program+1 economic equality program
Completed projectsProjects in construction and partial operation phaseProjects in constructionProjects in transactionProjects in preparationProjects taken out from the PSN list
Chart 9.22. PSN Realization Development
The Industry Human Resources Development Agency will: (i) prepare technical policies to develop HR for industry; (ii) monitor, evaluate and report on the implementation of action plans for HR development for industry; and (iii) administer the Industry Human Resources Development Agency. The Government also worked to improve the competency of HR by revitalizing vocational secondary schools (known as SMK).12 The Government wanted to ensure that the curriculum, learning materials, work practices, testing, and certification of vocational education and training meet the needs of businesses and industry.
Structural reforms were also brought in to boost exports. In the short term, efforts to accelerate exports were focused on making it easier for businesses to invest, export and import. To this end, the Government accelerated the processing of customs and excise licenses, and simplified licensing for the import of products or raw materials that are to be processed and then exported.13
Efforts to boost exports were also accompanied by measures to gradually reduce dependence on imports, most notably by expanding the Government’s B20 program, which stipulates a mandatory 20% content of biodiesel in diesel fuel.14 In addition, the Government also hastened development of tourism to support an increase in services exports.
12 Presidential Instruction No. 9 of 2016 concerning the Revitalization of Vocational High Schools to Improve the Quality and Competitiveness of Indonesian Human Resources.
13 Regulation of the Minister of Finance No. 29/PMK.04/2018 concerning the Acceleration of Customs and Excise Licenses in Order to Improve the Ease of Doing Business.
14 Related to import control efforts: see Box 3.1 Control of the Current Account Deficit.

CHAPTER 9 | ECONOMIC REPORT ON INDONESIA 2018144 |
Government implementation of structural reforms contributed positively to improving Indonesia’s competitiveness, as seen in a survey of the implementation of economic policy packages, which generally showed a positive impact on the business climate.15 The implementation of economic policy packages was deemed effective, particularly in increasing sales and production, and reducing production costs. Furthermore, Indonesia’s ranking in the World Bank’s Ease of Doing Business index has continued to improve, and in recent years has risen significantly, although it fell one place in 2018. By component, in this most recent Ease of Doing Business survey, Indonesia gained a higher ranking in infrastructure competitiveness.
Fiscal policy direction in 2018 was focused on maintaining economic stability while continuing to create more space for economic growth. To this end, fiscal policy was focused on efforts to safeguard fiscal sustainability by managing the primary balance and state budget deficit.
15 Survey on impact, evaluation and analysis of economic policy packages. Conducted by the Task Force for the Acceleration and Effectiveness of the Implementation of Economic Policy, Work Group III.
Furthermore, fiscal policy also aimed to optimize the more productive spending components and develop an investment climate conducive to economic growth. Indonesia pursued its financing strategy in a prudent, efficient, balanced and productive manner in order to support fiscal sustainability. Fiscal policy was also driven by the greater role of regional fiscal policy, infrastructure project development, and the strengthening of structural policies to maintain economic recovery momentum.
ECONOMIC REPORT ON INDONESIA 2018 | CHAPTER 9 | 145
Grafik 1. RealisasiAnggaran Perlindungan Sosial
Source : Ministry of Finance
IDR trillion Percent
0
1
2
3
4
5
6
7
220
230
240
250
260
270
280
290
300
2015 2016 2017 2018
Social Protection Budget
Social Protection Budget Growth (rhs)
Indonesia’s 2018 fiscal policy was again directed towards achieving sustainable economic growth. Improvements in welfare indicators in 2018 demonstrate the success of government efforts in achieving development goals, including reductions in poverty and inequality, and job creation. In terms of state expenditure, these efforts involved improve the quality and effectiveness of the social protection budget and transfers to the regions. The social protection program targeted more equitable income distribution and meeting the basic needs of the general public, particularly those with low incomes. Meanwhile, transfers to regions were intended to encourage more balanced development between regions.
Social programs directed at building self-reliance are a key factor in poverty alleviation, because the channeling of social assistance to low-income groups is insufficient. Social programs with empowerment approaches and that develop self-reliance and increased productivity are important. In 2018, these efforts were carried out through integrated and expanded programs in health services, education and capital assistance.
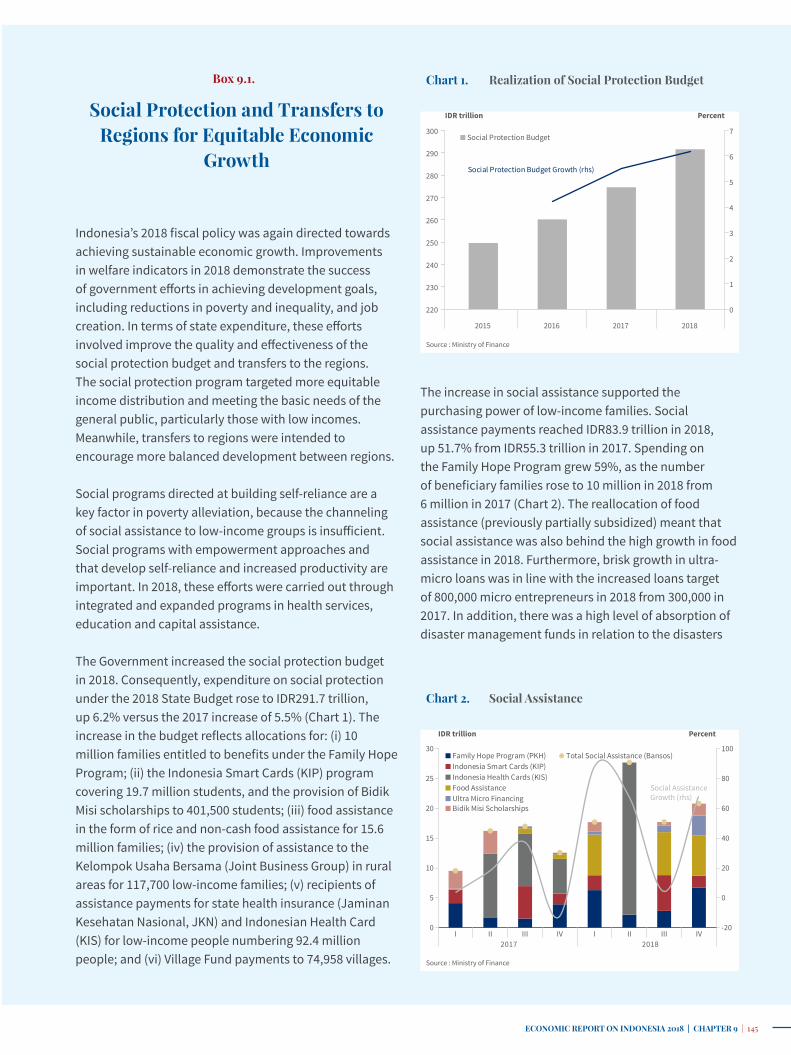
The Government increased the social protection budget in 2018. Consequently, expenditure on social protection under the 2018 State Budget rose to IDR291.7 trillion, up 6.2% versus the 2017 increase of 5.5% (Chart 1). The increase in the budget reflects allocations for: (i) 10 million families entitled to benefits under the Family Hope Program; (ii) the Indonesia Smart Cards (KIP) program covering 19.7 million students, and the provision of Bidik Misi scholarships to 401,500 students; (iii) food assistance in the form of rice and non-cash food assistance for 15.6 million families; (iv) the provision of assistance to the Kelompok Usaha Bersama (Joint Business Group) in rural areas for 117,700 low-income families; (v) recipients of assistance payments for state health insurance (Jaminan Kesehatan Nasional, JKN) and Indonesian Health Card (KIS) for low-income people numbering 92.4 million people; and (vi) Village Fund payments to 74,958 villages.
The increase in social assistance supported the purchasing power of low-income families. Social assistance payments reached IDR83.9 trillion in 2018, up 51.7% from IDR55.3 trillion in 2017. Spending on the Family Hope Program grew 59%, as the number of beneficiary families rose to 10 million in 2018 from 6 million in 2017 (Chart 2). The reallocation of food assistance (previously partially subsidized) meant that social assistance was also behind the high growth in food assistance in 2018. Furthermore, brisk growth in ultra-micro loans was in line with the increased loans target of 800,000 micro entrepreneurs in 2018 from 300,000 in 2017. In addition, there was a high level of absorption of disaster management funds in relation to the disasters
Social Protection and Transfers to Regions for Equitable Economic
Growth
Box 9.1. Chart 1. Realization of Social Protection Budget
Grafik 3. Perkembangan Bantuan Sosial
-20
0
20
40
60
80
100
0
5
10
15
20
25
30
2017 2018I II III IV I II III IV
Family Hope Program (PKH)Indonesia Smart Cards (KIP)Indonesia Health Cards (KIS)Food AssistanceUltra Micro FinancingBidik Misi Scholarships
Total Social Assistance (Bansos)
Social AssistanceGrowth (rhs)
IDR trillion Percent
Source : Ministry of Finance
Chart 2. Social Assistance

CHAPTER 9 | ECONOMIC REPORT ON INDONESIA 2018146 |
in Lombok, Palu and Donggala, Lampung and Banten. In turn, the growth in the distribution of social assistance helped to boost the consumption of low-income groups.
Village Funds are prioritized for developing villages and empowering villagers. In the 2018 State Budget, spending of funds earmarked for villages through district and city budget transfers rose to IDR59.9 trillion, up from IDR59.8 trillion in 2017. This was in line with an increase in the number of recipient villages to 74,958. Village Funds continued to prioritize the construction of infrastructure related to social, economic and environmental conservation activities in villages and also to improve the quality of life of the villagers. The budget absorption in 2018 was good, coming in at 99.8%, up from 99.6% in 2017. In part, at least, this reflects the Government’s efforts to reformulate the distribution of Village Fund disbursements by: (i) improving the portion and formula allocation; (ii) affirmative action for disadvantaged and very disadvantaged villages that have large numbers of
Grafik 4. Perkembangan Transfer ke Daerah dan Dana Desa
0
100
200
300
400
500
600
700
800
900
2013 2014 2015 2016 2017 2018
IDR trillion
Transfer to RegionVillage Fund
Source : Ministry of Finance
Chart 3. Transfer to Region and Village Fund low-income people; and (iii) giving a larger weighting to the number of low-income people.
The Government also strengthened policy on transfers to the regions, as an important instrument of fiscal decentralization. This reaffirms Indonesia’s focus on creating employment, alleviating poverty, reducing interregional inequality and improving public services in the regions. The allocated amount for transfers to the regions was IDR706.2 trillion in 2018, higher than the IDR697.7 trillion realized in 2017 of (Chart 3). The absorption rate for transfers to the regions in 2018 was quite high at 98.8%, up from 96.6% in 2017, supported by improvements to the distribution mechanism that were based on absorption performance and output.
Transfers to the regions also played a role in encouraging equitable development and sustaining purchasing power. Physical special allocation funds (DAK) are designed to help left-behind regions catch up on development. In 2018, the realization of physical DAK reached IDR58.1 trillion – this was intended for education, sanitation, health, drinking water, irrigation and agriculture, housing and roads. Non-physical DAK reached IDR115.3 trillion in 2018, and was intended to improve education, health and government services. Non-physical DAK that helped to support purchasing power were: (i) assistance for the operation of schools; (ii) operational assistance for the implementation of early childhood education programs; (iii) operational assistance for health and family planning; (iv) allowances for teachers to improve their professionalism; (v) additional teacher payments to improve teacher welfare; and (vi) special teacher allowances in 3T areas. Besides that, profit-sharing funds and general allocation funds (DAU) were also used to encourage regional infrastructure development; in fact, 25% of each fund is allocated for infrastructure spending.

ECONOMIC REPORT ON INDONESIA 2018 | CHAPTER 9 | 147
In 2018, the Government implemented various fiscal policies designed to boost the general welfare of the population, improve the ease of doing business and increase investment. This included the provision of tax incentives. The provision of tax incentives constitutes state expenditure that is not given in the form of money, but via a partial reduction in tax obligations, or an exemption from tax obligations. Tax incentives have already helped the economy to grow at a faster pace. Tax spending is estimated to have contributed 1% of GDP in recent years, primarily via tax holidays and tax allowances. Improvements made in 2018 to fiscal incentives have already had a positive impact on the economy.
Tax holidays and tax allowances have been in place in Indonesia for some time. Tax holidays were first awarded in 1967, although the regulations continued to change up until 2018. In 2018, the Government issued a regulation on tax holidays that expanded the definition of pioneer industries to encompass more industries, and provided more attractive incentives. For tax allowances, the Government has made regulatory changes on several occasions since the inception of its policy in 1983. Most recently, in 2016, Indonesia put in place four types of tax allowance related to income tax.
The Government’s tax spending is significant. In 2018, the Government issued tax spending reports for the first time. These reports contain a summary of the number of tax incentives given during 2016 and 2017. The value of tax spending rose to IDR154.7 trillion in 2017 from IDR143.6 trillion in 2016. Tax spending is responsible for 1.2% of GDP in 2017, up from 1.1% in 2016. The significance of this can be seen when compared to the contribution of government spending on goods, which came to 2.2% of GDP in 2017 and 2.1% in 2016. This significance is also clearly seen when compared to government capital expenditure – 1.5% of GDP in 2017 and 1.4% in 2016.
Tax spending mostly went towards tax allowances and incentives on VAT and sales tax on luxury goods, with the financial services sector receiving the largest amount of incentives. Government spending on VAT-related incentives include exemptions for small businesses below IDR4.8 billion and a reduction in the base for the luxury goods sales tax calculation for low cost green cars. The financial services sector obtained the most tax allowances, in relation to the types of services excluded from tax payments. Meanwhile, spending on tax holidays is categorized as multi-sector, because it benefits many sectors.
Households are the biggest recipients of tax incentives. Indeed, given the fact that the largest chunk of tax spending is VAT-related, then households as the last consumer paying VAT receive the greatest benefits from the Government’s tax incentives (Chart 1). The majority of tax allowances are given in the form of tax exemptions on goods and services and are intended to boost purchasing power. Such goods and services relate to basic needs, public transport, education and health. As such, the main purpose of providing tax incentives is to increase the general welfare of the population.
Tax incentives provided in the form of tax holidays and tax allowances are also intended to attract investment. To this end, the Government has continued to encourage foreign investment through the implementation of fiscal incentive schemes. In April 2018, the Government changed the procedures and criteria by which investors may obtain tax holidays. This was necessary because,
Fiscal Incentives to Promote Economic Growth
Box 9.2.
Grafik 3. Subyek Penerima Insentif Pajak
Source: Ministry of Finance
0
20
40
60
80
100
120
2016 2017
Business EntityBusiness Entity and Household
MSMEHousehold
Share
Chart 1. Recipient of Tax Incentives
CHAPTER 9 | ECONOMIC REPORT ON INDONESIA 2018148 |
in 2017, only five companies were receiving such fiscal incentives. As a result of the rule changes: (i) both new companies, and existing companies that wish to expand, may apply for tax holidays; (ii) tax holidays will be set at a single rate of 100%; previously a range of 10% to 100% was applied; and (iii) 18 industries are now covered by the rules, compared to eight previously. These changes elicited a positive response: the number of taxpayers receiving tax holidays reached eight companies within only a few months, with the value of the corporate investment amounting to IDR161.3 trillion.
The Government continued to improve the incentives scheme to attract more investors. In the sixteenth economic policy package implemented in November 2018, the Government also relaxed the terms and procedures for granting corporate income tax reduction to companies in pioneer industries. This mostly applied to the percentage of corporate income tax which, from a previous rate of 100%, was split into two rates based on the scale of investment: a 50% tax allowance for investments in the range of IDR100 billion to IDR500 billion, and a 100% tax reduction (tax holiday) for investments of at least IDR500 billion. The number of pioneer industries that can apply for incentive facilities has been increased to 18.
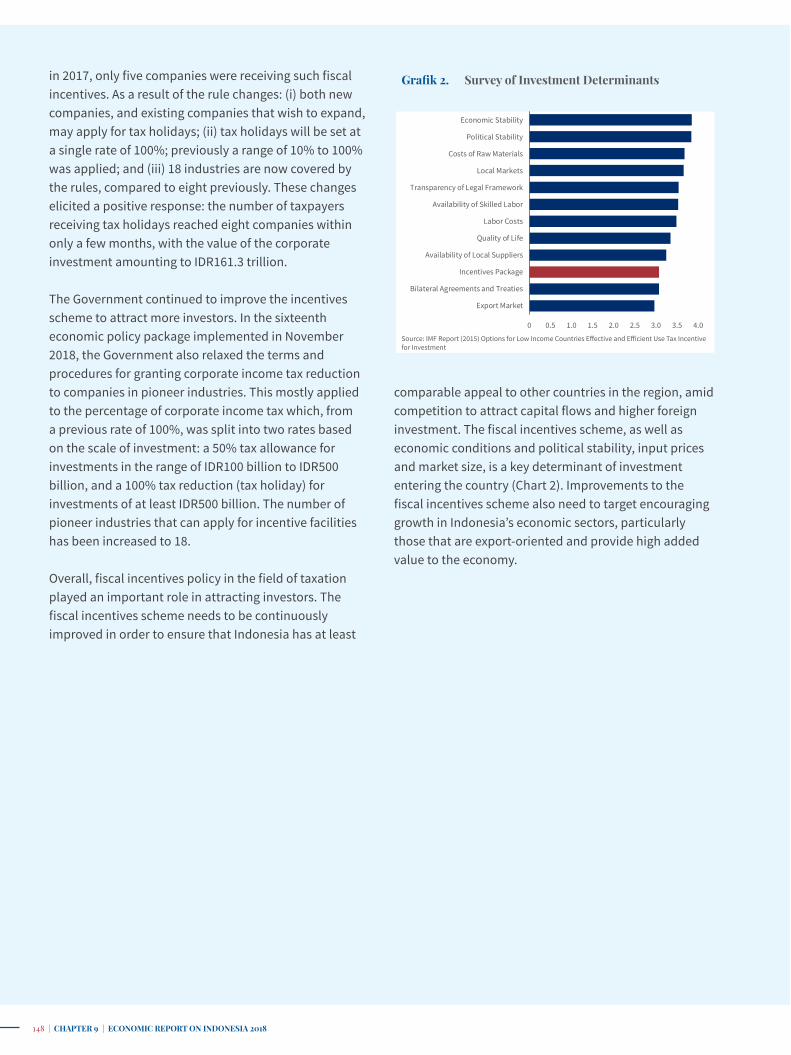
Overall, fiscal incentives policy in the field of taxation played an important role in attracting investors. The fiscal incentives scheme needs to be continuously improved in order to ensure that Indonesia has at least
comparable appeal to other countries in the region, amid competition to attract capital flows and higher foreign investment. The fiscal incentives scheme, as well as economic conditions and political stability, input prices and market size, is a key determinant of investment entering the country (Chart 2). Improvements to the fiscal incentives scheme also need to target encouraging growth in Indonesia’s economic sectors, particularly those that are export-oriented and provide high added value to the economy.
Grafik 4. Survei atas Faktor Penentu Investasi
Source: IMF Report (2015) Options for Low Income Countries Effective and Efficient Use Tax Incentive for Investment
0 0.5 1.0 1.5 2.0 2.5 3.0 3.5 4.0
Export Market
Bilateral Agreements and Treaties
Incentives Package
Availability of Local Suppliers
Quality of Life
Labor Costs
Availability of Skilled Labor
Transparency of Legal Framework
Local Markets
Costs of Raw Materials
Political Stability
Economic Stability
Grafik 2. Survey of Investment Determinants