Embed Size (px)
Citation preview

Chapter 9: Financial PlanChapter 9: Financial Plan 11Copyright 2002 Prentice Hall Publishing CompanyCopyright 2002 Prentice Hall Publishing Company
Creating a Successful
Financial Plan
Creating a Successful
Financial Plan

Chapter 9: Financial PlanChapter 9: Financial Plan 22Copyright 2002 Prentice Hall Publishing CompanyCopyright 2002 Prentice Hall Publishing Company
Basic Financial ReportsBasic Financial Reports
Balance SheetBalance Sheet - Estimates the firm’s worth on a - Estimates the firm’s worth on a given date; built on the accounting equation: given date; built on the accounting equation:
Assets = Liabilities + Owner’s EquityAssets = Liabilities + Owner’s Equity Income StatementIncome Statement - Compares the firm’s expenses - Compares the firm’s expenses
against its revenue over a period of time to show against its revenue over a period of time to show its net profit (or loss):its net profit (or loss):
Net Profit = Sales Revenue - ExpensesNet Profit = Sales Revenue - Expenses Statement of Cash FlowsStatement of Cash Flows - Shows the change in the - Shows the change in the
firm’s working capital over a period of time by firm’s working capital over a period of time by listing the listing the sourcessources of funds and the of funds and the usesuses of these of these funds.funds.
Chapter 9: Financial PlanChapter 9: Financial Plan 33Copyright 2002 Prentice Hall Publishing CompanyCopyright 2002 Prentice Hall Publishing Company
Twelve Key RatiosTwelve Key Ratios
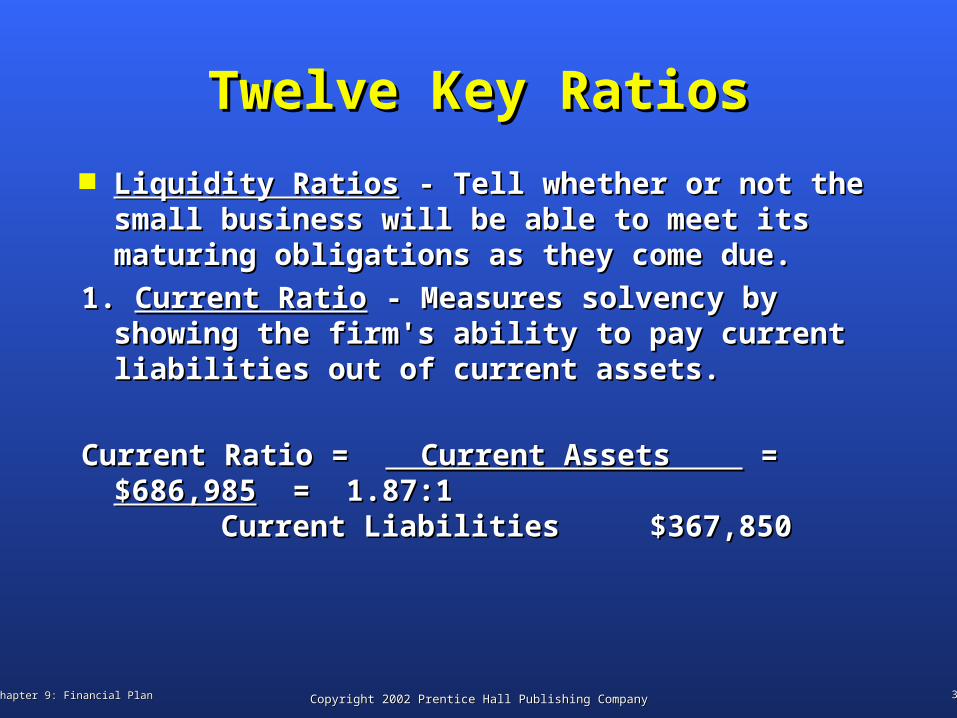
Liquidity RatiosLiquidity Ratios - Tell whether or not the - Tell whether or not the small business will be able to meet its small business will be able to meet its maturing obligations as they come due.maturing obligations as they come due.
1. 1. Current RatioCurrent Ratio - Measures solvency by - Measures solvency by showing the firm's ability to pay current showing the firm's ability to pay current liabilities out of current assets.liabilities out of current assets.
Current Ratio = Current Ratio = Current Assets Current Assets = = $686,985$686,985 = 1.87:1 = 1.87:1
Current Liabilities Current Liabilities $367,850$367,850
Chapter 9: Financial PlanChapter 9: Financial Plan 44Copyright 2002 Prentice Hall Publishing CompanyCopyright 2002 Prentice Hall Publishing Company
Twelve Key RatiosTwelve Key Ratios
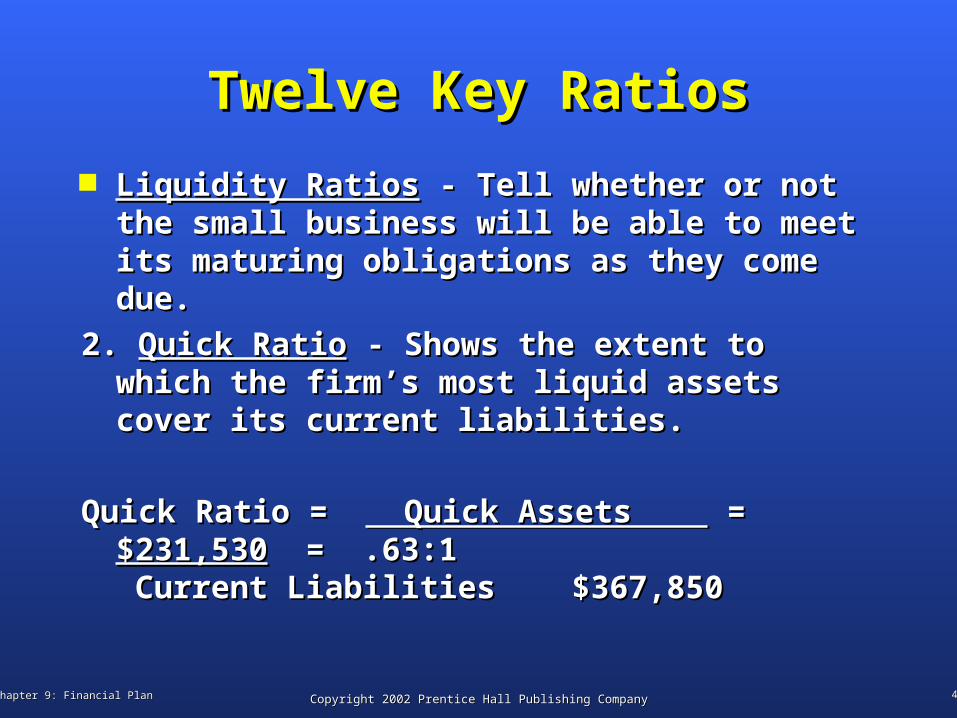
Liquidity RatiosLiquidity Ratios - Tell whether or not the - Tell whether or not the small business will be able to meet its small business will be able to meet its maturing obligations as they come due.maturing obligations as they come due.
2. 2. Quick RatioQuick Ratio - Shows the extent to which - Shows the extent to which the firm’s most liquid assets cover its the firm’s most liquid assets cover its current liabilities.current liabilities.
Quick Ratio = Quick Ratio = Quick Assets Quick Assets = = $231,530$231,530 = .63:1 = .63:1
Current Liabilities $367,850 Current Liabilities $367,850
Chapter 9: Financial PlanChapter 9: Financial Plan 55Copyright 2002 Prentice Hall Publishing CompanyCopyright 2002 Prentice Hall Publishing Company
Twelve Key RatiosTwelve Key Ratios
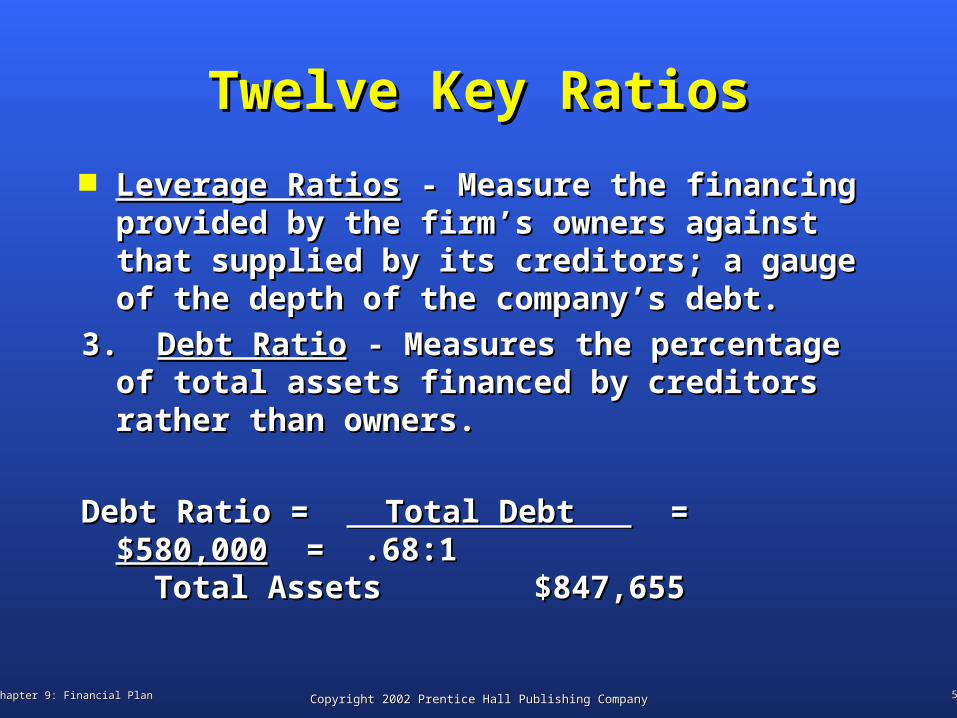
Leverage RatiosLeverage Ratios - Measure the financing - Measure the financing provided by the firm’s owners against provided by the firm’s owners against that supplied by its creditors; a gauge of that supplied by its creditors; a gauge of the depth of the company’s debt.the depth of the company’s debt.
3. 3. Debt RatioDebt Ratio - Measures the percentage of - Measures the percentage of total assets financed by creditors rather total assets financed by creditors rather than owners.than owners.
Debt Ratio = Debt Ratio = Total Debt Total Debt = = $580,000 $580,000 = .68:1= .68:1
Total Assets $847,655 Total Assets $847,655
Chapter 9: Financial PlanChapter 9: Financial Plan 66Copyright 2002 Prentice Hall Publishing CompanyCopyright 2002 Prentice Hall Publishing Company
Twelve Key RatiosTwelve Key Ratios
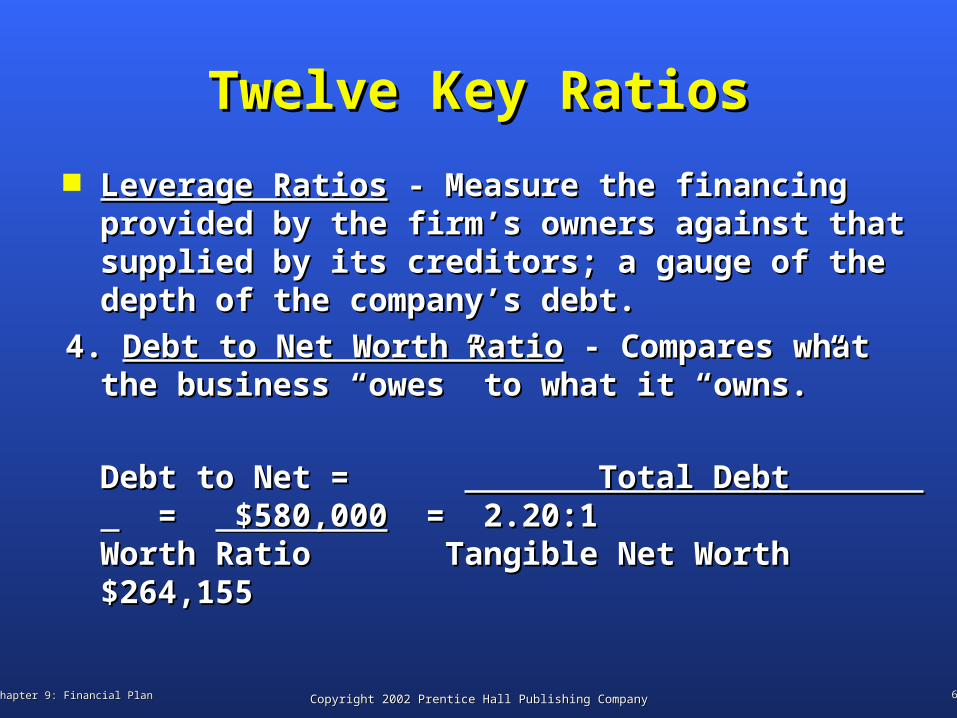
Leverage RatiosLeverage Ratios - Measure the financing - Measure the financing provided by the firm’s owners against that provided by the firm’s owners against that supplied by its creditors; a gauge of the supplied by its creditors; a gauge of the depth of the company’s debt.depth of the company’s debt.
4. 4. Debt to Net Worth RatioDebt to Net Worth Ratio - Compares what - Compares what the business “owes” to what it “owns.”the business “owes” to what it “owns.”
Debt to Net = Debt to Net = Total Debt Total Debt = = $580,000$580,000 = 2.20:1 = 2.20:1Worth Ratio Tangible Net Worth Worth Ratio Tangible Net Worth $264,155$264,155
Chapter 9: Financial PlanChapter 9: Financial Plan 77Copyright 2002 Prentice Hall Publishing CompanyCopyright 2002 Prentice Hall Publishing Company
Twelve Key RatiosTwelve Key Ratios
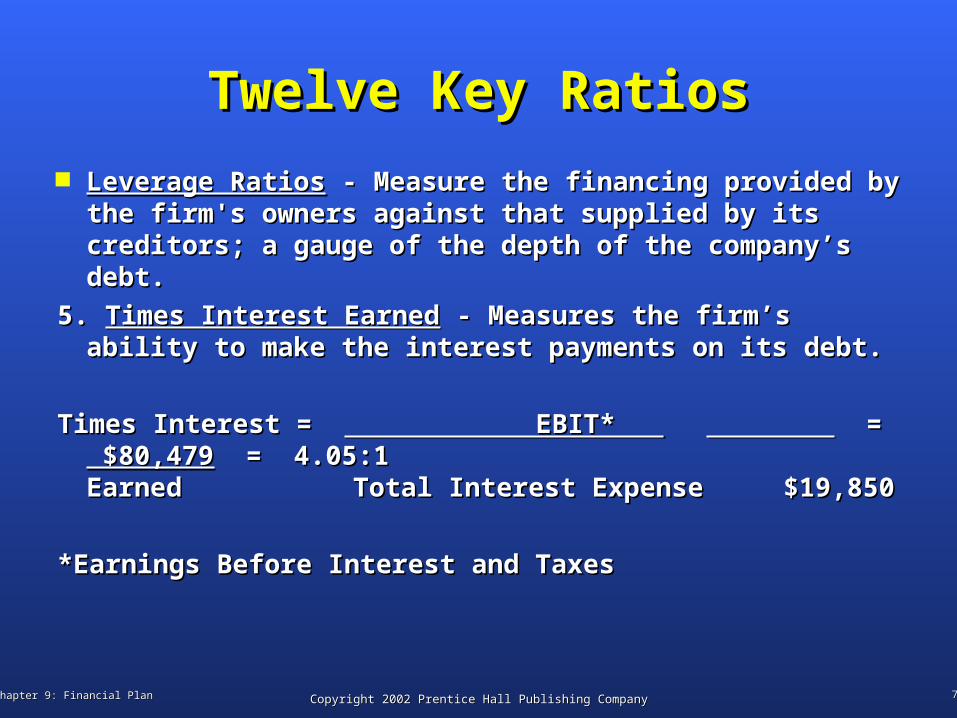
Leverage RatiosLeverage Ratios - Measure the financing provided - Measure the financing provided by the firm's owners against that supplied by its by the firm's owners against that supplied by its creditors; a gauge of the depth of the company’s creditors; a gauge of the depth of the company’s debt.debt.
5. 5. Times Interest EarnedTimes Interest Earned - Measures the firm’s - Measures the firm’s ability to make the interest payments on its debt.ability to make the interest payments on its debt.
Times Interest = Times Interest = EBIT* EBIT* = = $80,479 $80,479 = 4.05:1= 4.05:1EarnedEarned Total Interest Expense $19,850 Total Interest Expense $19,850
*Earnings Before Interest and Taxes*Earnings Before Interest and Taxes
Chapter 9: Financial PlanChapter 9: Financial Plan 88Copyright 2002 Prentice Hall Publishing CompanyCopyright 2002 Prentice Hall Publishing Company
Twelve Key RatiosTwelve Key Ratios
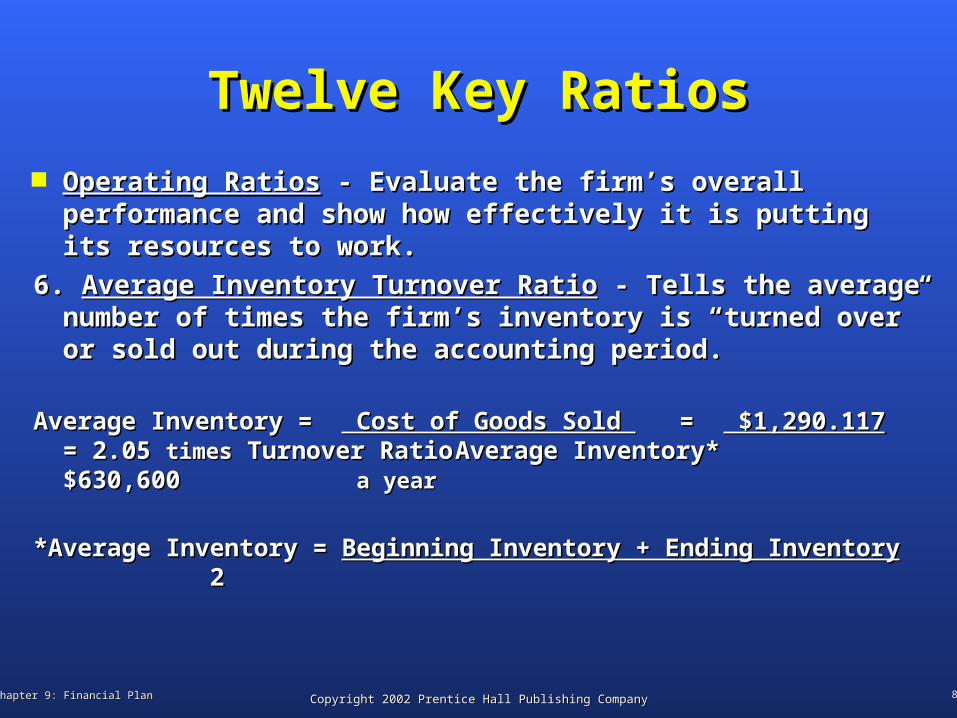
Operating RatiosOperating Ratios - Evaluate the firm’s overall - Evaluate the firm’s overall performance and show how effectively it is putting its performance and show how effectively it is putting its resources to work.resources to work.
6. 6. Average Inventory Turnover RatioAverage Inventory Turnover Ratio - Tells the average - Tells the average number of times the firm’s inventory is “turned over” number of times the firm’s inventory is “turned over” or sold out during the accounting period.or sold out during the accounting period.
Average Inventory = Average Inventory = Cost of Goods Sold Cost of Goods Sold = = $1,290.117 $1,290.117 = = 2.05 2.05 timestimes Turnover Ratio Turnover Ratio Average Inventory* Average Inventory* $630,600 $630,600 a yeara year
*Average Inventory = *Average Inventory = Beginning Inventory + Ending InventoryBeginning Inventory + Ending Inventory 2 2
Chapter 9: Financial PlanChapter 9: Financial Plan 99Copyright 2002 Prentice Hall Publishing CompanyCopyright 2002 Prentice Hall Publishing Company
Twelve Key RatiosTwelve Key Ratios
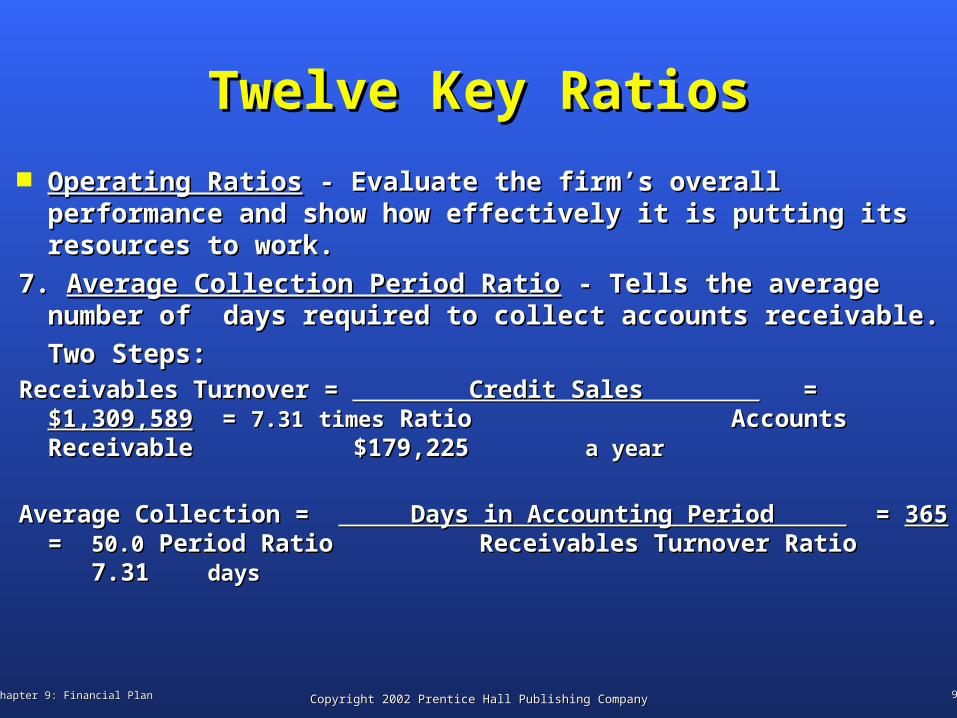
Operating RatiosOperating Ratios - Evaluate the firm’s overall - Evaluate the firm’s overall performance and show how effectively it is putting its performance and show how effectively it is putting its resources to work.resources to work.
7. 7. Average Collection Period RatioAverage Collection Period Ratio - Tells the average - Tells the average number of days required to collect accounts receivable.number of days required to collect accounts receivable.
Two Steps:Two Steps:Receivables Turnover = Receivables Turnover = Credit Sales Credit Sales = = $1,309,589 $1,309,589
= = 7.317.31 timestimes Ratio Ratio Accounts Receivable Accounts Receivable $179,225 $179,225 a yeara year
Average Collection = Average Collection = Days in Accounting Period Days in Accounting Period = = 365365 = = 50.050.0 Period Ratio Period Ratio Receivables Turnover Ratio Receivables Turnover Ratio 7.31 7.31 daysdays
Chapter 9: Financial PlanChapter 9: Financial Plan 1010Copyright 2002 Prentice Hall Publishing CompanyCopyright 2002 Prentice Hall Publishing Company
Twelve Key RatiosTwelve Key Ratios
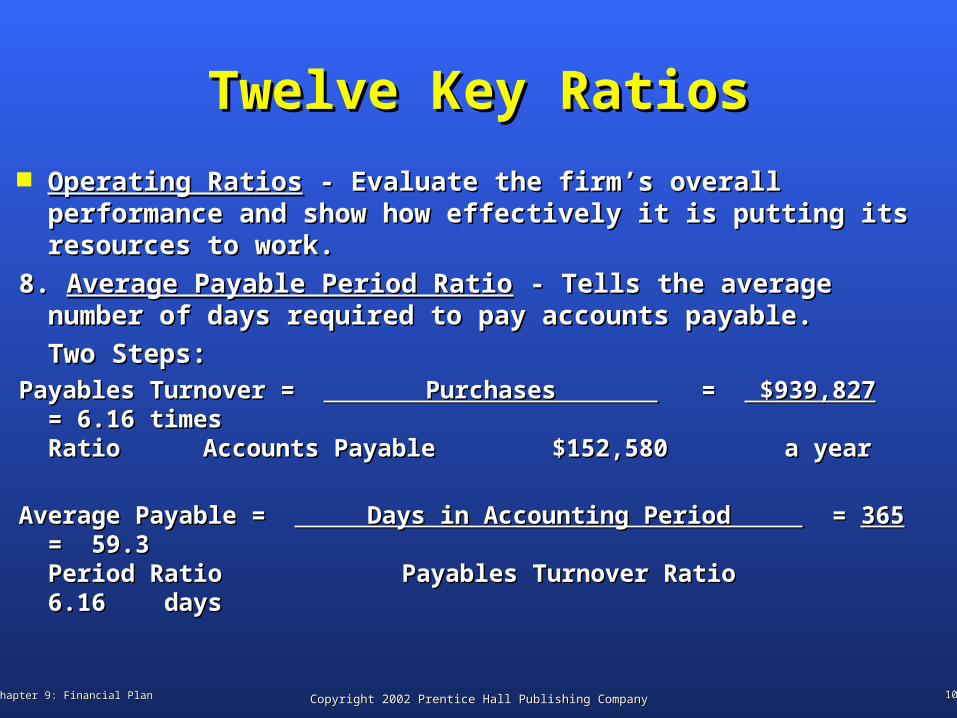
Operating RatiosOperating Ratios - Evaluate the firm’s overall - Evaluate the firm’s overall performance and show how effectively it is putting its performance and show how effectively it is putting its resources to work.resources to work.
8. 8. Average Payable Period RatioAverage Payable Period Ratio - Tells the average - Tells the average number of days required to pay accounts payable.number of days required to pay accounts payable.
Two Steps:Two Steps:Payables Turnover = Payables Turnover = Purchases Purchases = = $939,827 $939,827 = 6.16 = 6.16
times times RatioRatio Accounts Payable $152,580 a yearAccounts Payable $152,580 a year
Average Payable = Average Payable = Days in Accounting Period Days in Accounting Period = = 365365 = = 59.3 59.3 Period Ratio Period Ratio Payables Turnover Ratio 6.16 days Payables Turnover Ratio 6.16 days
Chapter 9: Financial PlanChapter 9: Financial Plan 1111Copyright 2002 Prentice Hall Publishing CompanyCopyright 2002 Prentice Hall Publishing Company
Twelve Key RatiosTwelve Key Ratios
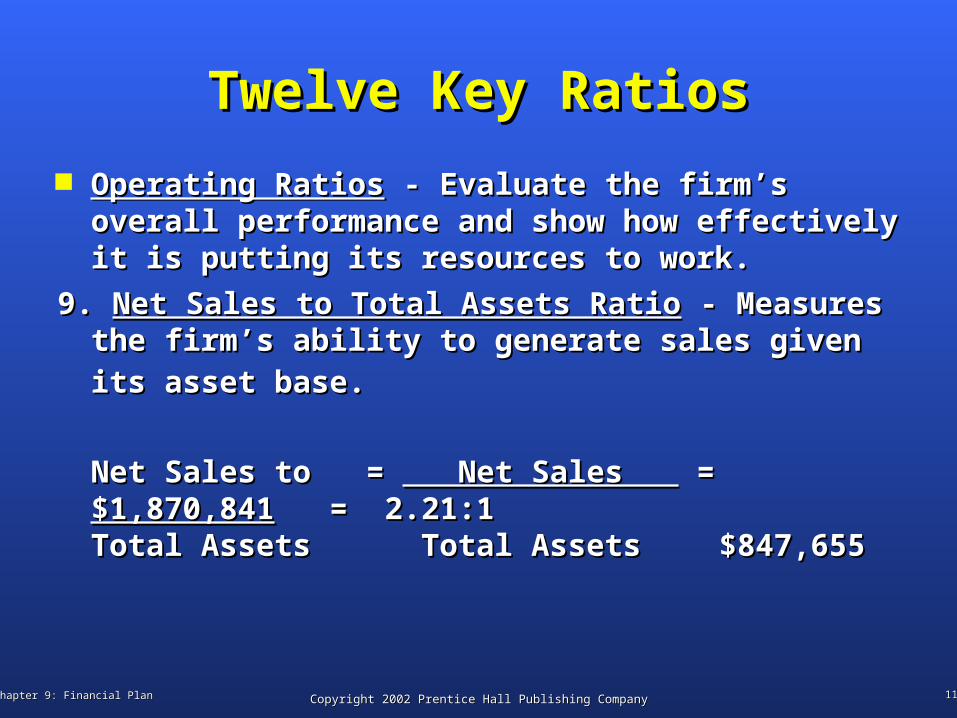
Operating RatiosOperating Ratios - Evaluate the firm’s - Evaluate the firm’s overall performance and show how overall performance and show how effectively it is putting its resources to work.effectively it is putting its resources to work.
9. 9. Net Sales to Total Assets RatioNet Sales to Total Assets Ratio - Measures - Measures the firm’s ability to generate sales given its the firm’s ability to generate sales given its asset base.asset base.
Net Sales to = Net Sales to = Net Sales Net Sales = = $1,870,841$1,870,841 = 2.21:1 = 2.21:1 Total Assets Total Assets Total Assets Total Assets $847,655$847,655
Chapter 9: Financial PlanChapter 9: Financial Plan 1212Copyright 2002 Prentice Hall Publishing CompanyCopyright 2002 Prentice Hall Publishing Company
Twelve Key RatiosTwelve Key Ratios
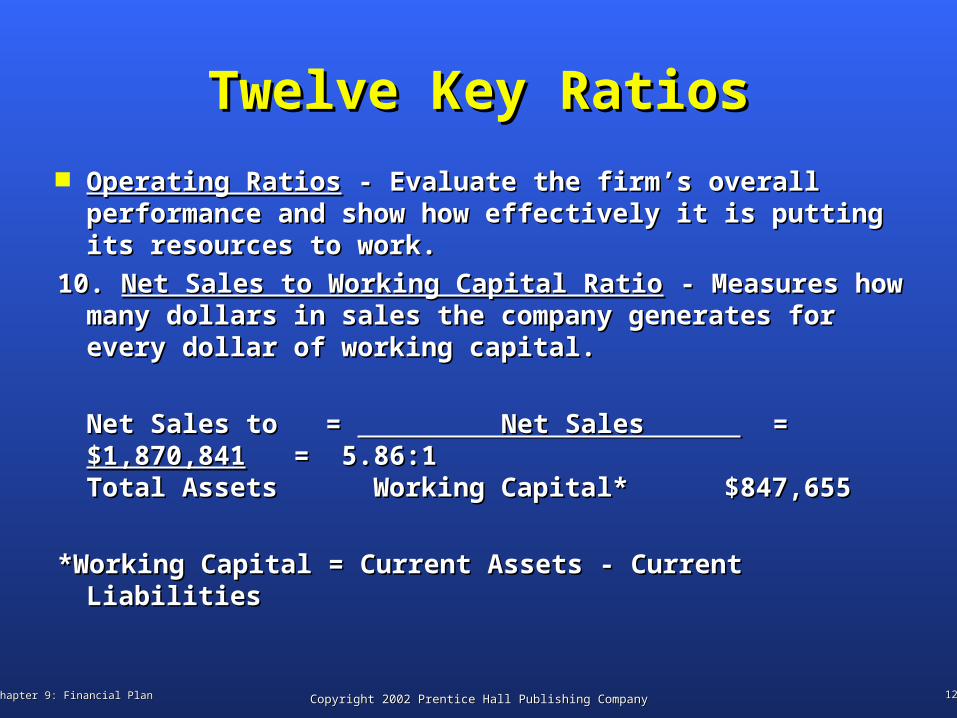
Operating RatiosOperating Ratios - Evaluate the firm’s overall - Evaluate the firm’s overall performance and show how effectively it is putting performance and show how effectively it is putting its resources to work.its resources to work.
10. 10. Net Sales to Working Capital RatioNet Sales to Working Capital Ratio - Measures - Measures how many dollars in sales the company generates how many dollars in sales the company generates for every dollar of working capital.for every dollar of working capital.
Net Sales to = Net Sales to = Net Sales Net Sales = = $1,870,841$1,870,841 = 5.86:1 = 5.86:1 Total Assets Working Capital* $847,655Total Assets Working Capital* $847,655
*Working Capital = Current Assets - Current Liabilities*Working Capital = Current Assets - Current Liabilities
Chapter 9: Financial PlanChapter 9: Financial Plan 1313Copyright 2002 Prentice Hall Publishing CompanyCopyright 2002 Prentice Hall Publishing Company
Twelve Key RatiosTwelve Key Ratios
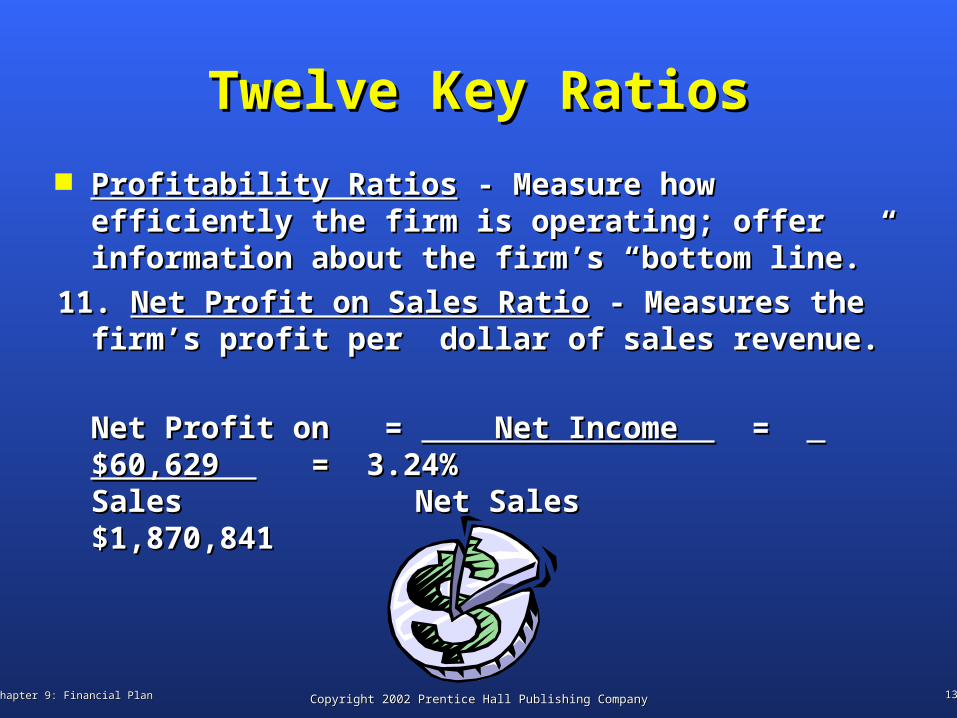
Profitability RatiosProfitability Ratios - Measure how efficiently - Measure how efficiently the firm is operating; offer information the firm is operating; offer information about the firm’s “bottom line.”about the firm’s “bottom line.”
11. 11. Net Profit on Sales RatioNet Profit on Sales Ratio - Measures the - Measures the firm’s profit per dollar of sales revenue.firm’s profit per dollar of sales revenue.
Net Profit on = Net Profit on = Net Income Net Income = = $60,629 $60,629 = 3.24% = 3.24% Sales Sales Net Sales $1,870,841 Net Sales $1,870,841
Chapter 9: Financial PlanChapter 9: Financial Plan 1414Copyright 2002 Prentice Hall Publishing CompanyCopyright 2002 Prentice Hall Publishing Company
Twelve Key RatiosTwelve Key Ratios
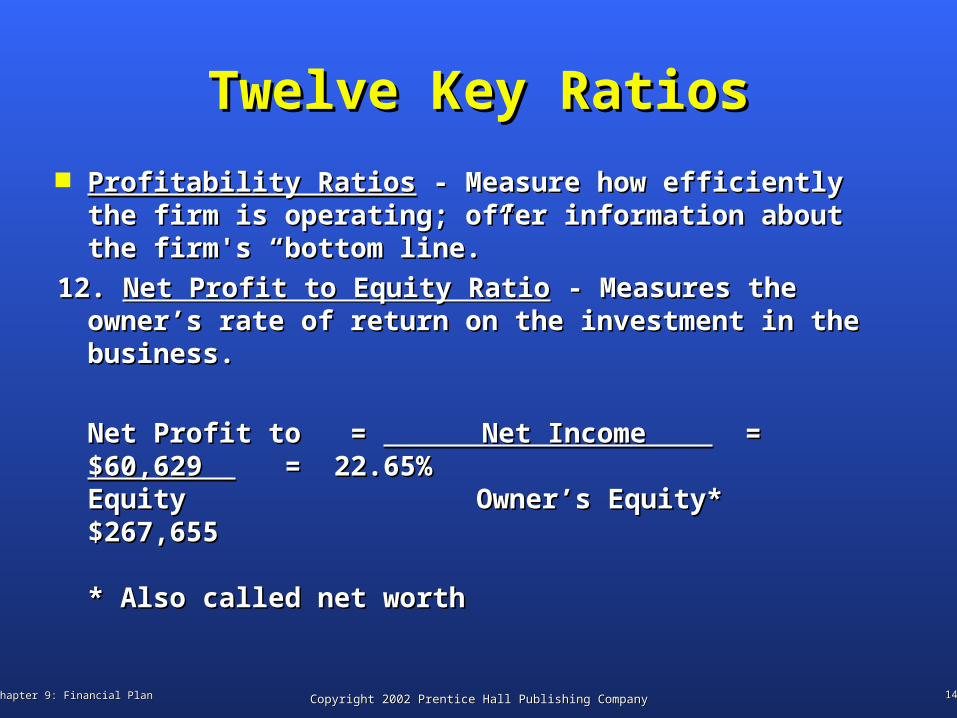
Profitability RatiosProfitability Ratios - Measure how efficiently - Measure how efficiently the firm is operating; offer information about the firm is operating; offer information about the firm's “bottom line.”the firm's “bottom line.”
12. 12. Net Profit to Equity RatioNet Profit to Equity Ratio - Measures the - Measures the owner’s rate of return on the investment in the owner’s rate of return on the investment in the business.business.
Net Profit to = Net Profit to = Net Income Net Income = = $60,629 $60,629 = 22.65% = 22.65% Equity Equity Owner’s Equity* $267,655 Owner’s Equity* $267,655
* Also called net worth* Also called net worth
Chapter 9: Financial PlanChapter 9: Financial Plan 1515Copyright 2002 Prentice Hall Publishing CompanyCopyright 2002 Prentice Hall Publishing Company
Interpreting RatiosInterpreting Ratios
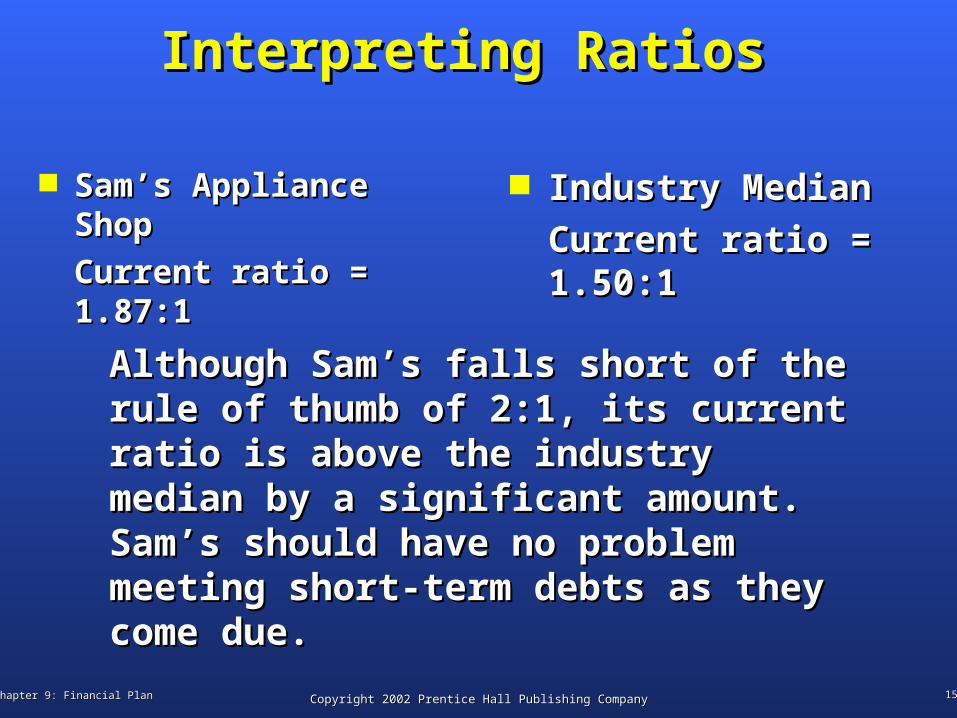
Sam’s Appliance ShopSam’s Appliance Shop
Current ratio = 1.87:1Current ratio = 1.87:1
Industry MedianIndustry Median
Current ratio = 1.50:1Current ratio = 1.50:1
Although Sam’s falls short of the rule of Although Sam’s falls short of the rule of thumb of 2:1, its current ratio is above the thumb of 2:1, its current ratio is above the industry median by a significant amount. industry median by a significant amount. Sam’s should have no problem meeting short-Sam’s should have no problem meeting short-term debts as they come due.term debts as they come due.
Chapter 9: Financial PlanChapter 9: Financial Plan 1616Copyright 2002 Prentice Hall Publishing CompanyCopyright 2002 Prentice Hall Publishing Company
Interpreting RatiosInterpreting Ratios
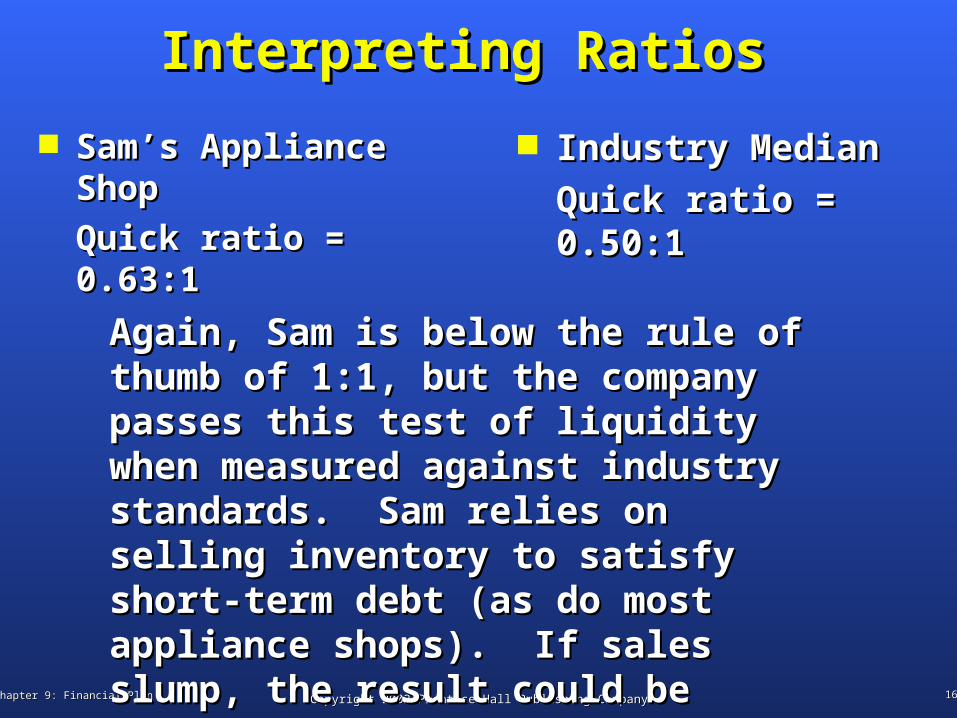
Sam’s Appliance ShopSam’s Appliance Shop
Quick ratio = 0.63:1Quick ratio = 0.63:1
Industry MedianIndustry Median
Quick ratio = 0.50:1Quick ratio = 0.50:1
Again, Sam is below the rule of thumb of Again, Sam is below the rule of thumb of 1:1, but the company passes this test of 1:1, but the company passes this test of liquidity when measured against industry liquidity when measured against industry standards. Sam relies on selling inventory standards. Sam relies on selling inventory to satisfy short-term debt (as do most to satisfy short-term debt (as do most appliance shops). If sales slump, the result appliance shops). If sales slump, the result could be liquidity problems for Sam’s.could be liquidity problems for Sam’s.
Chapter 9: Financial PlanChapter 9: Financial Plan 1717Copyright 2002 Prentice Hall Publishing CompanyCopyright 2002 Prentice Hall Publishing Company
Interpreting RatiosInterpreting Ratios
Sam’s Appliance ShopSam’s Appliance Shop
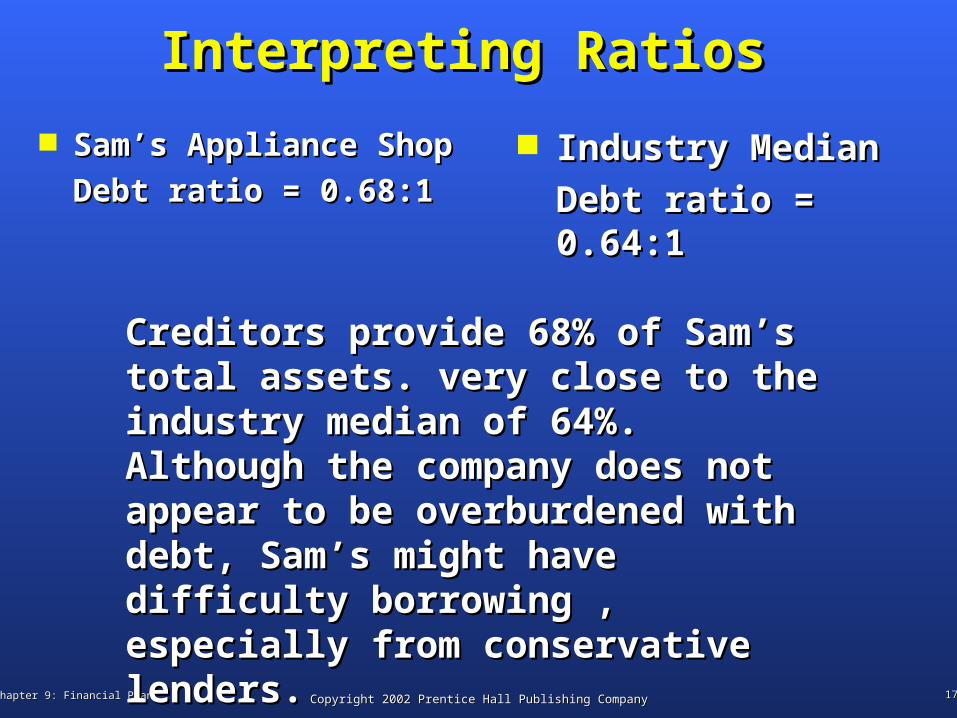
Debt ratio = 0.68:1Debt ratio = 0.68:1
Industry MedianIndustry Median
Debt ratio = 0.64:1Debt ratio = 0.64:1
Creditors provide 68% of Sam’s total assets. Creditors provide 68% of Sam’s total assets. very close to the industry median of 64%. very close to the industry median of 64%. Although the company does not appear to be Although the company does not appear to be overburdened with debt, Sam’s might have overburdened with debt, Sam’s might have difficulty borrowing , especially from difficulty borrowing , especially from conservative lenders.conservative lenders.
Chapter 9: Financial PlanChapter 9: Financial Plan 1818Copyright 2002 Prentice Hall Publishing CompanyCopyright 2002 Prentice Hall Publishing Company
Interpreting RatiosInterpreting Ratios
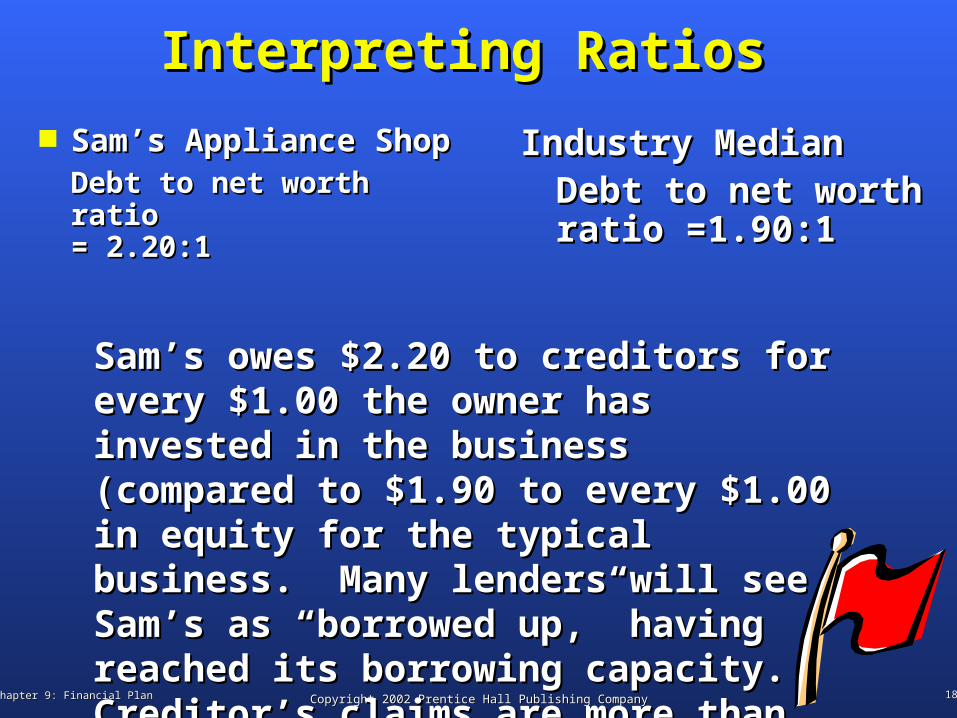
Sam’s Appliance ShopSam’s Appliance ShopDebt to net worth ratio Debt to net worth ratio = 2.20:1= 2.20:1
Industry MedianIndustry MedianDebt to net worth ratio Debt to net worth ratio =1.90:1=1.90:1
Sam’s owes $2.20 to creditors for every $1.00 Sam’s owes $2.20 to creditors for every $1.00 the owner has invested in the business the owner has invested in the business (compared to $1.90 to every $1.00 in equity for (compared to $1.90 to every $1.00 in equity for the typical business. Many lenders will see the typical business. Many lenders will see Sam’s as “borrowed up,” having reached its Sam’s as “borrowed up,” having reached its borrowing capacity. Creditor’s claims are borrowing capacity. Creditor’s claims are more than twice those of the owners.more than twice those of the owners.
Chapter 9: Financial PlanChapter 9: Financial Plan 1919Copyright 2002 Prentice Hall Publishing CompanyCopyright 2002 Prentice Hall Publishing Company
Interpreting RatiosInterpreting Ratios
Sam’s Appliance ShopSam’s Appliance Shop
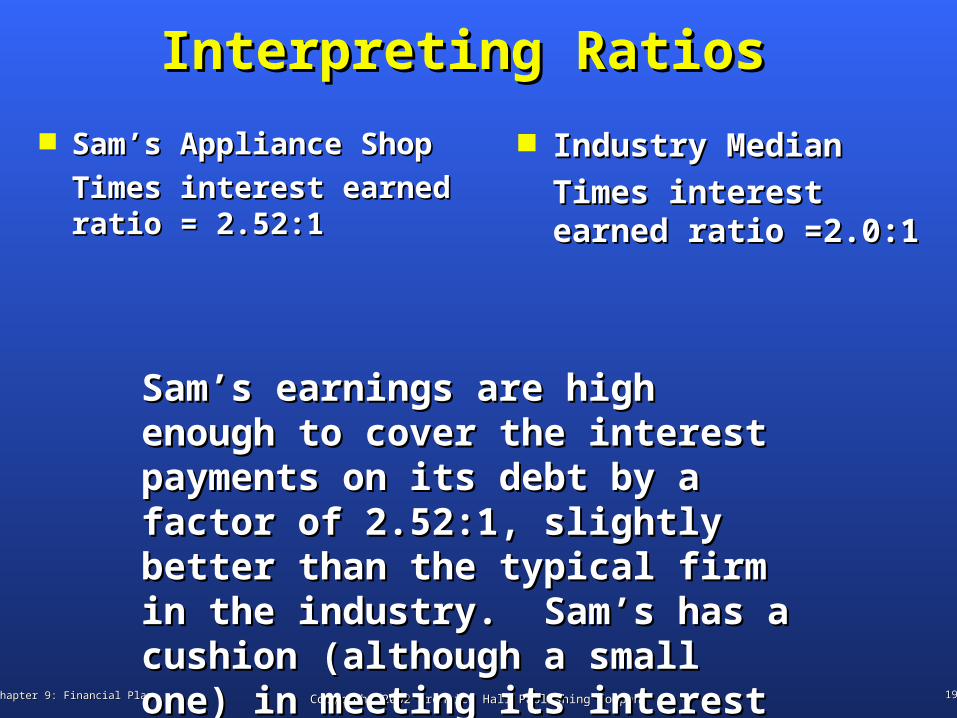
Times interest earned Times interest earned ratio = 2.52:1ratio = 2.52:1
Industry MedianIndustry Median
Times interest earned Times interest earned ratio =2.0:1ratio =2.0:1
Sam’s earnings are high enough to cover Sam’s earnings are high enough to cover the interest payments on its debt by a the interest payments on its debt by a factor of 2.52:1, slightly better than the factor of 2.52:1, slightly better than the typical firm in the industry. Sam’s has a typical firm in the industry. Sam’s has a cushion (although a small one) in meeting cushion (although a small one) in meeting its interest payments. its interest payments.
Chapter 9: Financial PlanChapter 9: Financial Plan 2020Copyright 2002 Prentice Hall Publishing CompanyCopyright 2002 Prentice Hall Publishing Company
Interpreting RatiosInterpreting Ratios
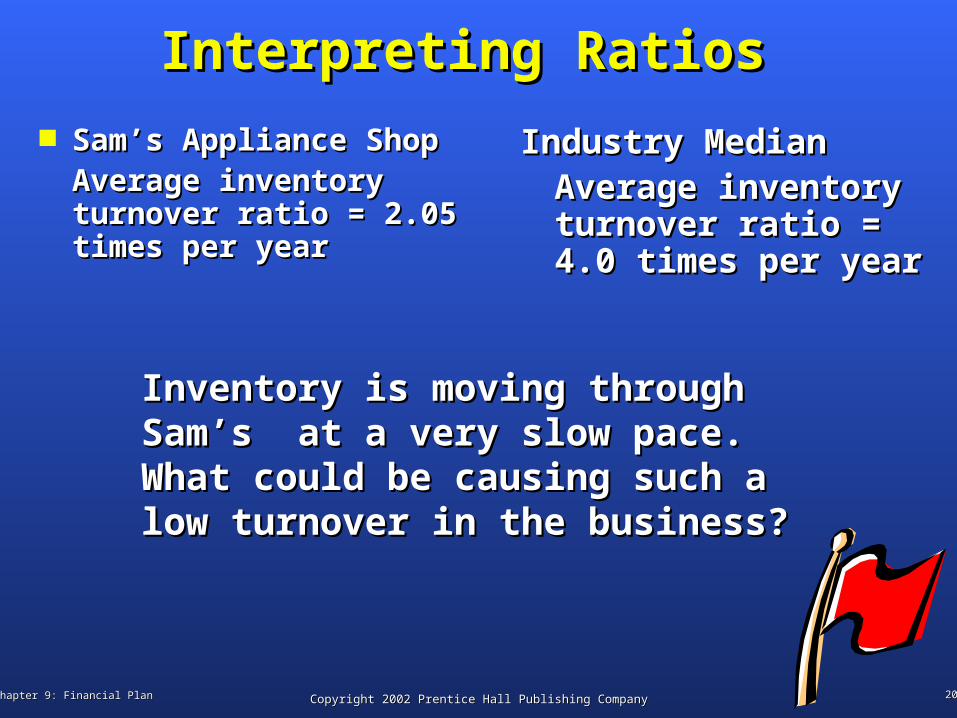
Sam’s Appliance ShopSam’s Appliance ShopAverage inventory turnover Average inventory turnover ratio = 2.05 times per yearratio = 2.05 times per year
Industry MedianIndustry MedianAverage inventory Average inventory turnover ratio = 4.0 turnover ratio = 4.0 times per yeartimes per year
Inventory is moving through Sam’s at a Inventory is moving through Sam’s at a very slow pace. What could be causing very slow pace. What could be causing such a low turnover in the business?such a low turnover in the business?
Chapter 9: Financial PlanChapter 9: Financial Plan 2121Copyright 2002 Prentice Hall Publishing CompanyCopyright 2002 Prentice Hall Publishing Company
Interpreting RatiosInterpreting Ratios
Sam’s Appliance ShopSam’s Appliance Shop
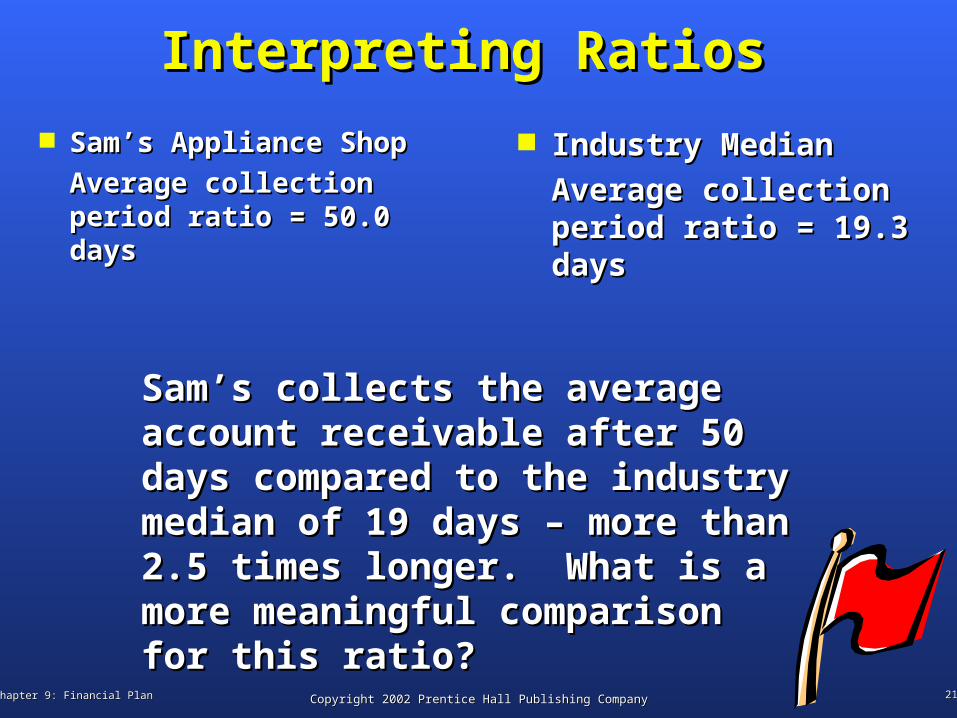
Average collection Average collection period ratio = 50.0 daysperiod ratio = 50.0 days
Industry MedianIndustry Median
Average collection Average collection period ratio = 19.3 daysperiod ratio = 19.3 days
Sam’s collects the average account Sam’s collects the average account receivable after 50 days compared to the receivable after 50 days compared to the industry median of 19 days industry median of 19 days –– more than more than 2.5 times longer. What is a more 2.5 times longer. What is a more meaningful comparison for this ratio?meaningful comparison for this ratio?
Chapter 9: Financial PlanChapter 9: Financial Plan 2222Copyright 2002 Prentice Hall Publishing CompanyCopyright 2002 Prentice Hall Publishing Company
Interpreting RatiosInterpreting Ratios
Sam’s Appliance ShopSam’s Appliance Shop
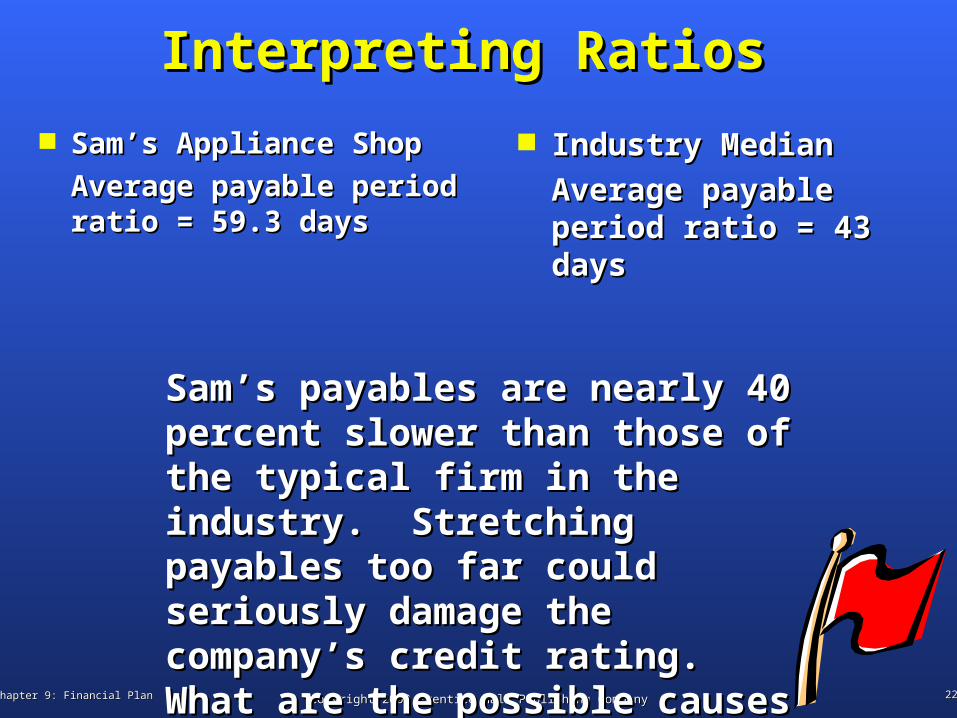
Average payable period Average payable period ratio = 59.3 daysratio = 59.3 days
Industry MedianIndustry Median
Average payable period Average payable period ratio = 43 daysratio = 43 days
Sam’s payables are nearly 40 percent Sam’s payables are nearly 40 percent slower than those of the typical firm in slower than those of the typical firm in the industry. Stretching payables too far the industry. Stretching payables too far could seriously damage the company’s could seriously damage the company’s credit rating. What are the possible credit rating. What are the possible causes of this discrepancy?causes of this discrepancy?
Chapter 9: Financial PlanChapter 9: Financial Plan 2323Copyright 2002 Prentice Hall Publishing CompanyCopyright 2002 Prentice Hall Publishing Company
Interpreting RatiosInterpreting Ratios
Sam’s Appliance ShopSam’s Appliance Shop
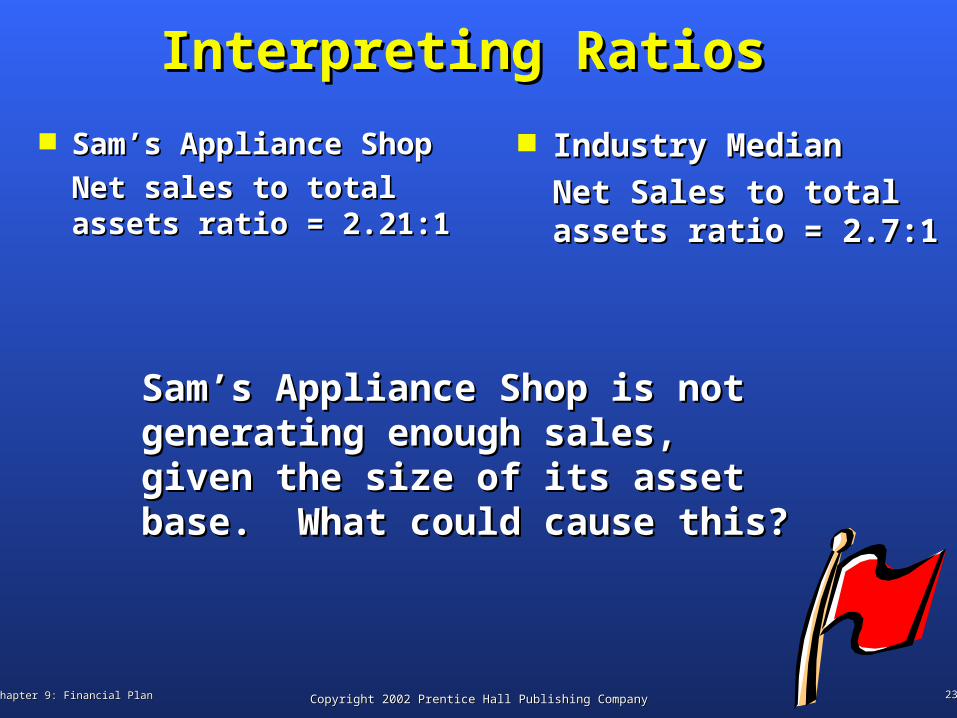
Net sales to total assets Net sales to total assets ratio = 2.21:1ratio = 2.21:1
Industry MedianIndustry Median
Net Sales to total assets Net Sales to total assets ratio = 2.7:1ratio = 2.7:1
Sam’s Appliance Shop is not generating Sam’s Appliance Shop is not generating enough sales, given the size of its asset enough sales, given the size of its asset base. What could cause this?base. What could cause this?
Chapter 9: Financial PlanChapter 9: Financial Plan 2424Copyright 2002 Prentice Hall Publishing CompanyCopyright 2002 Prentice Hall Publishing Company
Interpreting RatiosInterpreting Ratios
Sam’s Appliance ShopSam’s Appliance Shop
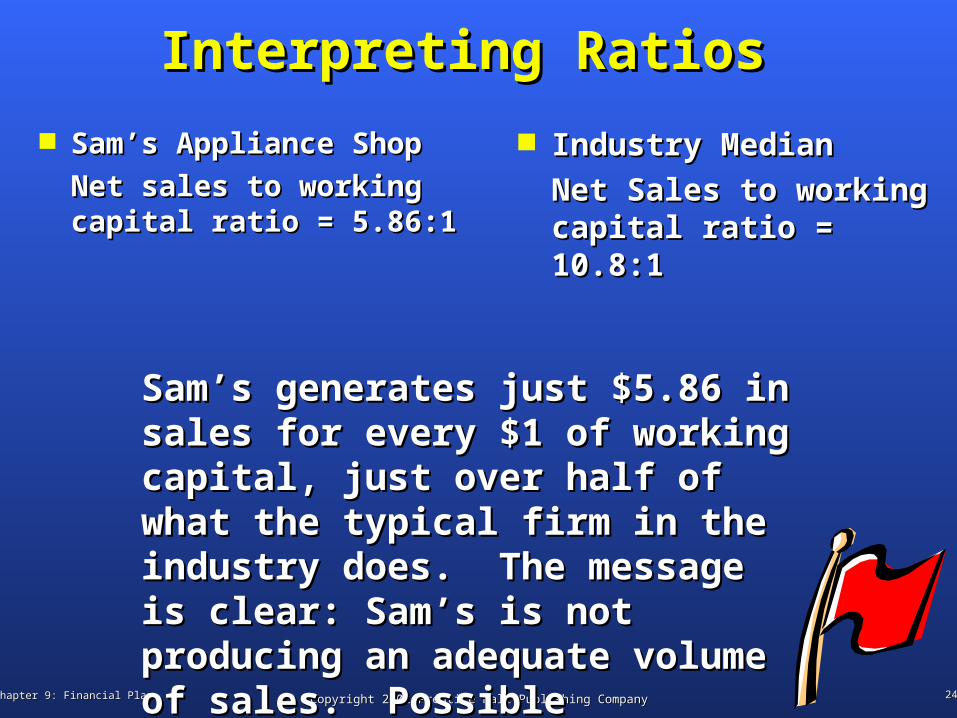
Net sales to working Net sales to working capital ratio = 5.86:1capital ratio = 5.86:1
Industry MedianIndustry Median
Net Sales to working Net Sales to working capital ratio = 10.8:1capital ratio = 10.8:1
Sam’s generates just $5.86 in sales for Sam’s generates just $5.86 in sales for every $1 of working capital, just over half every $1 of working capital, just over half of what the typical firm in the industry of what the typical firm in the industry does. The message is clear: Sam’s is not does. The message is clear: Sam’s is not producing an adequate volume of sales. producing an adequate volume of sales. Possible causes . . . ?Possible causes . . . ?
Chapter 9: Financial PlanChapter 9: Financial Plan 2525Copyright 2002 Prentice Hall Publishing CompanyCopyright 2002 Prentice Hall Publishing Company
Interpreting RatiosInterpreting Ratios
Sam’s Appliance ShopSam’s Appliance Shop
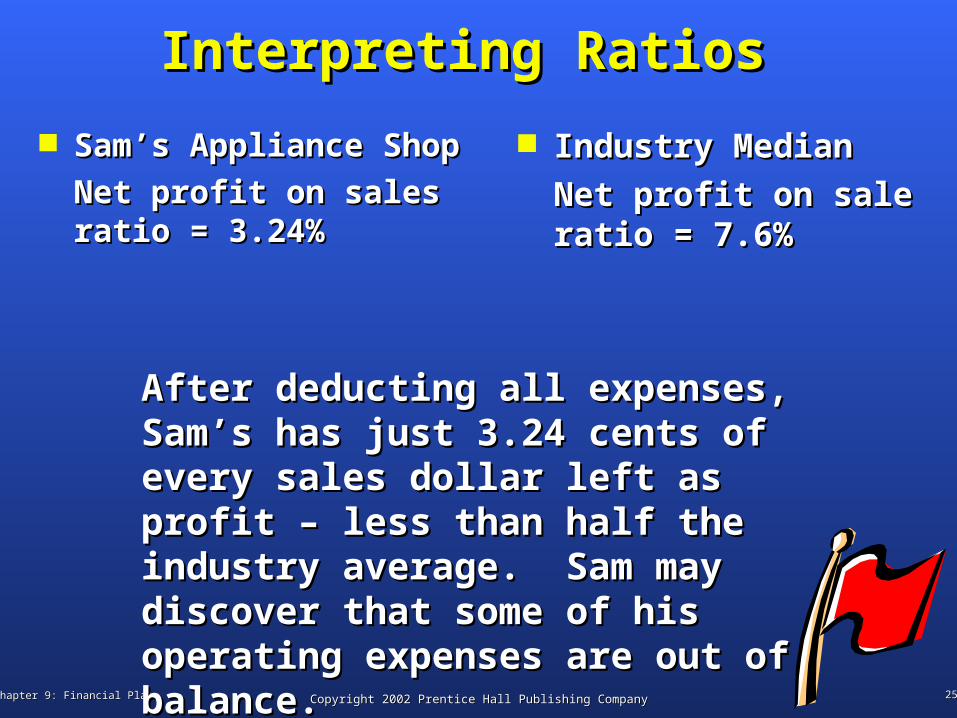
Net profit on sales Net profit on sales ratio = 3.24%ratio = 3.24%
Industry MedianIndustry Median
Net profit on sale Net profit on sale ratio = 7.6%ratio = 7.6%
After deducting all expenses, Sam’s has After deducting all expenses, Sam’s has just 3.24 cents of every sales dollar left as just 3.24 cents of every sales dollar left as profit profit –– less than half the industry less than half the industry average. Sam may discover that some of average. Sam may discover that some of his operating expenses are out of balance. his operating expenses are out of balance.
Chapter 9: Financial PlanChapter 9: Financial Plan 2626Copyright 2002 Prentice Hall Publishing CompanyCopyright 2002 Prentice Hall Publishing Company
Interpreting RatiosInterpreting Ratios
Sam’s Appliance ShopSam’s Appliance Shop
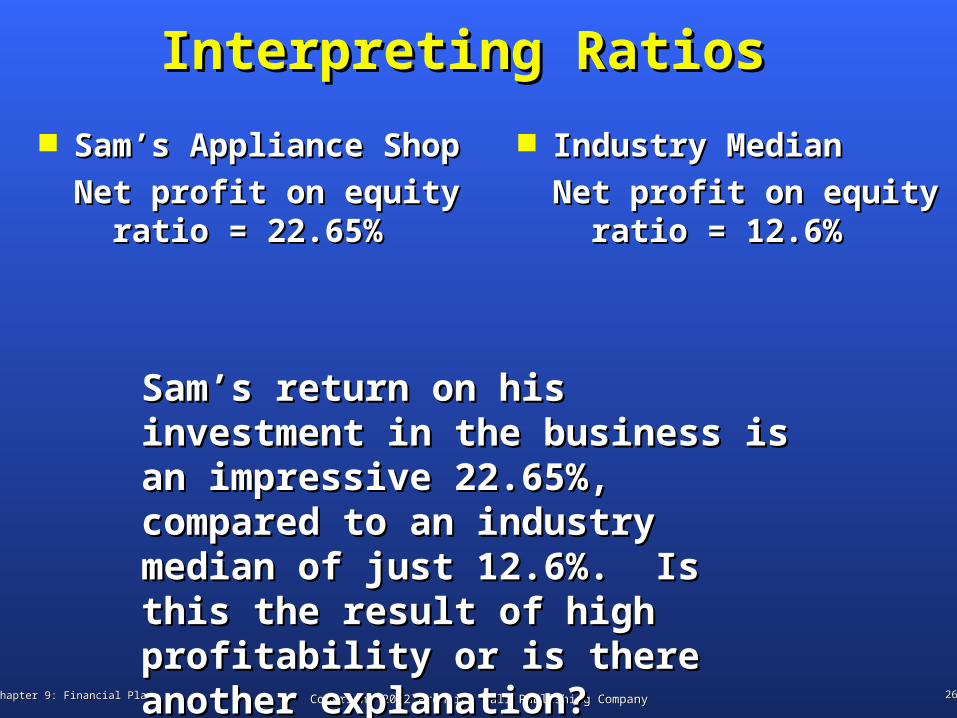
Net profit on equity Net profit on equity ratio = 22.65%ratio = 22.65%
Industry MedianIndustry Median
Net profit on equity Net profit on equity ratio = 12.6%ratio = 12.6%
Sam’s return on his investment in the Sam’s return on his investment in the business is an impressive 22.65%, business is an impressive 22.65%, compared to an industry median of just compared to an industry median of just 12.6%. Is this the result of high 12.6%. Is this the result of high profitability or is there another profitability or is there another explanation?explanation?
Chapter 9: Financial PlanChapter 9: Financial Plan 2727Copyright 2002 Prentice Hall Publishing CompanyCopyright 2002 Prentice Hall Publishing Company
Breakeven AnalysisBreakeven Analysis
The breakeven point is the level of operation at The breakeven point is the level of operation at which a business neither earns a profit nor which a business neither earns a profit nor incurs a loss. incurs a loss.
It is a useful planning tool because it shows It is a useful planning tool because it shows entrepreneurs the minimum level of activity entrepreneurs the minimum level of activity required to stay in business.required to stay in business.
With one change in the breakeven calculation, With one change in the breakeven calculation, an entrepreneur can also determine the sales an entrepreneur can also determine the sales volume required to reach a particular profit volume required to reach a particular profit target.target.
Chapter 9: Financial PlanChapter 9: Financial Plan 2828Copyright 2002 Prentice Hall Publishing CompanyCopyright 2002 Prentice Hall Publishing Company
Calculating the Breakeven PointCalculating the Breakeven Point
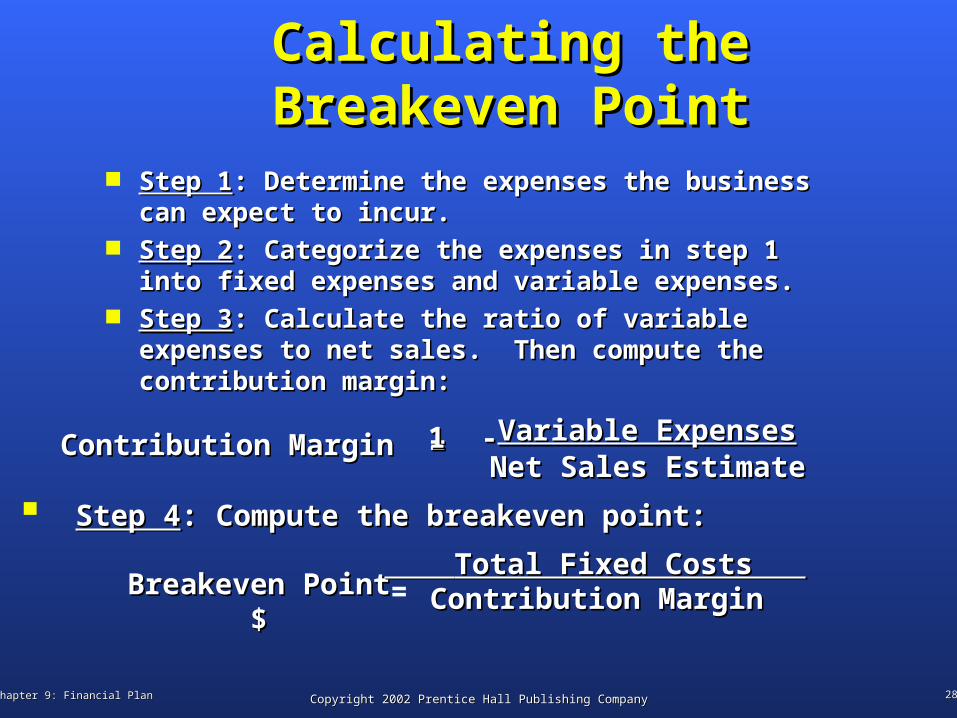
Step 1Step 1: Determine the expenses the business : Determine the expenses the business can expect to incur.can expect to incur.
Step 2Step 2: Categorize the expenses in step 1 into : Categorize the expenses in step 1 into fixed expenses and variable expenses.fixed expenses and variable expenses.
Step 3Step 3: Calculate the ratio of variable : Calculate the ratio of variable expenses to net sales. Then compute the expenses to net sales. Then compute the contribution margin:contribution margin:
Contribution Margin = Contribution Margin = 1 - 1 - Variable ExpensesVariable ExpensesNet Sales EstimateNet Sales Estimate
Step 4Step 4: Compute the breakeven point:: Compute the breakeven point:
Breakeven PointBreakeven Point$$
= Total Fixed Costs Total Fixed Costs Contribution MarginContribution Margin
Chapter 9: Financial PlanChapter 9: Financial Plan 2929Copyright 2002 Prentice Hall Publishing CompanyCopyright 2002 Prentice Hall Publishing Company
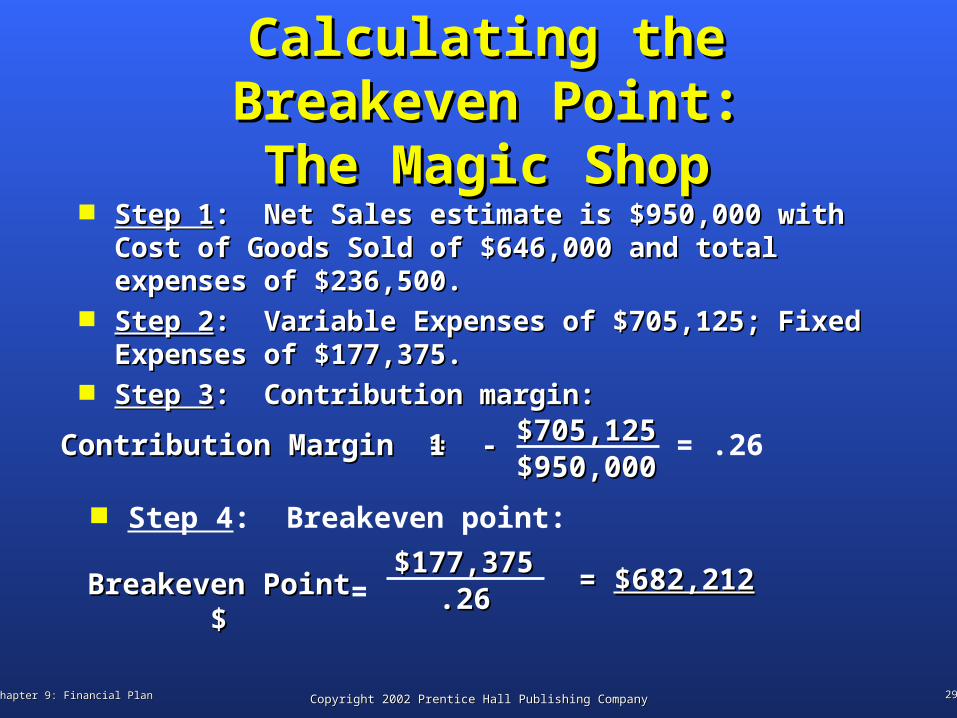
Calculating the Breakeven Point:Calculating the Breakeven Point:The Magic ShopThe Magic Shop
Step 1Step 1: Net Sales estimate is $950,000 with : Net Sales estimate is $950,000 with Cost of Goods Sold of $646,000 and total Cost of Goods Sold of $646,000 and total expenses of $236,500. expenses of $236,500.
Step 2Step 2: Variable Expenses of $705,125; Fixed : Variable Expenses of $705,125; Fixed Expenses of $177,375.Expenses of $177,375.
Step 3Step 3: Contribution margin:: Contribution margin:
Contribution Margin = Contribution Margin = 1 - 1 - $705,125$705,125$950,000$950,000
Step 4: Breakeven point:
Breakeven PointBreakeven Point$$
= $177,375$177,375
.26.26
= .26
= = $682,212$682,212