Embed Size (px)
Citation preview

CHAPTER 9: Discussion
Marker assisted selection for high oil yielding varieties in Jatropha curcas 145
DISCUSSION
Aims of the research was to search for association between linked markers and oil
content of Jatropha curcas seeds through the technique of association mapping for
marker assisted selection of high and low yielding genotypes.
The objective of precedence was an individual sample collection. 91 Samples were
collected from six different states (representing 10 geographical regions) of India, viz.
Gujarat, Rajasthan, Uttar Pradesh, Maharashtra, Tamil Nadu and North India.
9.1 Phenotypic analysis of oil content
Following sample collection was the phenotypic analysis of oil content. Three solvents
petroleum ether, hexane and isopropanol were used in four extraction techniques viz.
separating funnel, centrifugation, filtration and soxhlet extraction method. Soxhlet
extraction method ensued the highest amount of oil. Our findings are supported by
Castro-Vargasa et al., 2010, who reported that the highest oil content of Guava seed
extract was achieved using soxhlet extraction techniques. In another study, oil from seeds
of three wild grape vines were successfully extracted using the Soxhlet technique
(Weidner et al., 2012; Khoddami et al., 2013). Moreover, out of the three solvents hexane
yielded more oil in percent in comparison to isopropanol and petroleum ether. Similar
results were obtained in a study comparing the solvent hexane, ethanol, petroleum ether,
isopropanol and carbon tetrachloride for oil extraction from olive cake (Banat et al.,
2013). Thus, hexane-soxhlet combination for the extraction was found to yield the
highest amount (78.66 ± 0.9 %) of oil content; followed by 59.66 ± 2.5 % from
isopropanol and 53.66 ± 1.05 % from petroleum ether. Among the solvents, hexane is
considered as the best solvent because it yields maximum oil as compared to other
solvents (Sepidar et al., 2009). But, the oil recovered by hexane and isopropanol is
slightly yellow in colour. This might pose problems in using the oil for further biodiesel
production. Thus, it is better to use petroleum ether for efficient biodiesel production.
(Kandpal et al.,1995) also used petroleum ether as a solvent, to extract Jatropha curcas
oil from whole seed and the kernel. Hence, all the samples in our investigation were
CHAPTER 9: Discussion
Marker assisted selection for high oil yielding varieties in Jatropha curcas 146
isolated with petroleum ether, since it yields transparent oil as well as appropriate amount
for further studies. The oil content for the samples ranged from 18.33 % to 41.83 %. The
diversity in oil content of the collected accessions may be related to the fact that this
species grows over a wide range of climatic conditions and populations must have
experienced marked differences in selective pressure in their natural habitat.
9.2 DNA Isolation from collected Jatropha Samples
The subsequent goal was to isolate DNA from the collected samples. However, prior to
DNA isolation from the collected samples a comparative analysis was performed
between six already published methods viz., Doyle and Doyle, 1990; Jobes et al., 1995;
Dellaporta et al., 1983; Sudheer et al., 2008; Nalini et al.,2004 and Anna Maria et al.-1
and 2, 2001. Dellaporta et al. exhibited the best results in comparison to other six
methods with 0.157 O.D. at 260 nm, concentration of 7.85µg/ml and 83.00% purity.
However, the Dellaporta et al. method was modified to enhance the quality of the
extracted DNA. The buffer to tissue ratio was modified from 1:1 to 3:1 to increase the
quality of the DNA. Similarly, a study on the improved DNA extraction protocol from
leaf tissues of Phyllan thusemblica Gaertn indicated that DNA of amplifiable quality
could be obtained by increasing the ratio of tissue to buffer (Nagarajan et al., 2011). This
could provide more exposure of the buffer component to the crushed tissue,
consequently, increasing the quality of the DNA. The concentration of SDS was
decreased from 10% to 2 % to increase the DNA yield; also reinforced in a study that the
absorbance started to decrease when the SDS concentration was more than 2.0% (Guobin
et al., 2008).While concentrations of polyvinylpyrrolidone (PVP) in the extraction buffer
was increased from 0.1 g to 0.9 g in order to remove excess amounts of polyphenols as
oxidized form of polyphenols bind to proteins and DNA to impart brown colorto DNA
and render it unsuitable for the further applications (Katterman et al., 1983; Guillemaut
et al., 1992; Aljanabi et al., 1999). In addition, the incubation time at -20oC in
isopropanol was increased from 1.5 hours to overnight incubation which provides more
time to precipitate the DNA. Finally, the samples were ground in a mortar & pastel with
pre-warmed extraction buffer instead of grinding with liquid nitrogen; thereby preventing
further tissue damage. The protocol described by Dellaporta et al., 1983, with minor

CHAPTER 9: Discussion
Marker assisted selection for high oil yielding varieties in Jatropha curcas 147
modification, was found to be a simple, efficient, rapid and cost-effective method for
isolation of DNA from phenolics and polysaccharide rich leaves of J. curcas. Hence, the
DNA was isolated from the entire 91 samples of J curcas with the modified Dellaporta et
al., 1983 method.
Prior to genotyping, for association mapping studies, it is best to select lines to maximize
genetic diversity. As it will minimizes pair wise LD between loci and contributes to
greater power for association mapping (Yu et al., 2006).
9.3 Development of SSRs primers from EST database of Jatropha curcas
Out of many PCR based marker systems microsatellites were used to study the diversity
and population genetic studies as the markers were technically simple, high
polymorphism and the variations accumulate in accordance of the species evolution
(Zana et al., 2002). From identifying relatives to inferring demographic parameters,
microsatellites are rapidly replacing the multilocus markers in most applications in
population biology and molecular genetics studies (Bowcock et al., 1994, Goldstein et
al., 1995, Jarne et al.,1996).
In addition to being highly variable, microsatellites are also densely distributed
throughout eukaryotic genomes, making them preferred marker for very high resolution
genetic mapping, forensic DNA studies, population genetics and conservation
management of biological resources for genome mapping. Moreover, it is also used in
hybrid analysis, MAS (Marker Assisted Selection) and QTL (QuantitativeTrait Loci)
analysis for economically important trait in many crop species (Dib et al.,1996; Dietrich,
1996; Jarne et al.,1996; Schuler GD, 1996; Knapik, 1998).
The development of SSR (microsatellite) markers from genomic libraries is expensive
and inefficient. Computational approaches provide an attractive alternative to
conventional laboratory methods for rapid and economical development of SSR markers
by utilizing freely available sequences in public databases (Varshney et al., 2002).
Therefore, development of SSR markers through data mining has become fast, efficient,
and low-cost option for many plants (EujaylI et al., 2004). Though SSRs are markers of
CHAPTER 9: Discussion
Marker assisted selection for high oil yielding varieties in Jatropha curcas 148
choice in many plant species, only a very limited number of SSR markers are publicly
available for Jatropha curcas.
We characterized informative SSR markers from a large collection of EST (42,483 ESTs)
using EST database of Jatropha curcas. A total of 3682 ESTs contained SSRs (8.66% of
the total 42,483 ESTs). A relatively higher abundance of SSRs for Jatropha ESTs was
observed compared to the previous reports for maize (1.4%), barley (3.4%), wheat
(3.2%), sorghum (3.6%), rice (4.7%) (Kantety RV et al., 2002), Medicago truncatula
(3.0%) (Eujayl I et al., 2004) and Peanut (6.8%) species (Liang, 2009).
In this study, total 3682 SSRs were identified i.e, SSRs exist in 8.6 % of EST sequences,
in which the mononucleotide repeats formed the largest group (55.7%) consisting of
95.1% A/T and 4.9% G/C motifs. Dinucleotides was the second largest group (30.5%)
consisting of 42.5% AG/CT, 17.3% AT/TA, 4.3% AC/TG, 34.8% TC/GA and 1.1%
GT/CA motifs. This was followed by trinucleotides (13.2%), tetra-hexanucleotides
(0.21%) and pentanucleotides (2 SSRs).
Based on 3682 SSR-containing ESTs, a total of 2236 primers was successfully designed
and used for the validation of the amplification in in silico condition. All the 2236
primers were in silico validated with NetPrimer. From the validation studies, 93 primers
does not contain hairpin loops, self-primers and cross primers. Out of which 4 were
interrupted EST-SSR primers and the rest 89 were non-interrupted EST-SSR primers.
Designed and in silico validated EST-SSR markers from Jatropha will enrich the current
resource of molecular markers for Jatropha community and would be useful for
qualitative and quantitative trait mapping, Marker-Assisted Selection, and genetic
diversity study in Jatropha and other related plant species.
This designed EST SSR markers were used for genitic diversity and population studies of
collected J. curcas germplasm.

CHAPTER 9: Discussion
Marker assisted selection for high oil yielding varieties in Jatropha curcas 149
9.4 Diversity estimates using EST SSR markers
The molecular diversity and population analysis in ninety-one accessions of Jatropha
collected from six states of India was implemented by using forty-eight SSR primer
combinations. Among the SSRs studied 33 loci were Genic SSRs designed from EST
Database in the present study, 11 EST primers for Acetyl CoA-Transferase (ACCase)
unisequence in Jatropha were designed in present study and 4 loci were Genomic SSRs
taken from the study reported by Sudheer et al., 2009.
With the generated diploid genetic data, summary statistics including the total number of
bands, the number of bands per locus, and the polymorphism information content (PIC)
were determined based on the data matrix that documented the microsatellite genotyping
of each locus. Descriptors of observed genetic diversity, such as total number of alleles
observed per locus, the number of alleles per polymorphic locus (i.e. effectivealleles), the
number of rare alleles per locus (i.e. alleles with frequency lower than 5%), observed
heterozygosity (Ho) and gene diversity (expected heterozygosity, He) were calculated.
The data were also tested for fixation index and Analysis of Molecular Variance
(AMOVA) using GeneAlex software, ver. 6.4 (Peakall et al.,2006).
All (100%) SSR markers were polymorphic for all Jatropha accessions and total of 480
polymorphic alleles across the groups were observed. The number of alleles across loci
ranged between 5 to 22 with an average number of alleles of 15 and the overall size of
amplified products ranged from 940 to 104 bp. The average PIC value was 0.821 and it
ranged from 0.5215 (SSR 67) to 0.9941 (SSR 18). The high levels of PIC obtained in
these studies suggest that polymorphic EST SSR markers in Jatropha curcas are
generally very informative. Fst value ranged from 0.26 to 0.069 with the mean of 0.112
which shows high to low variation and the overall genetic diversity in terms of Shannon’s
information index was 1.964 + 0.031. The Observed heterozygosity (Ho) ranged from 0.0
to 1.0, with a mean of 0.21. High levels of heterozygosity were observed in the Jatropha
curcas genotypes, mean expected Heterozygosity/gene diversity (He) was observed to be
0.820 with values ranging from 0.906 (SSR18) and 0.602 (SSR62) respectively. High
heterozygosity refers to high genetic variability suggesting that the Jatropha germplasm

CHAPTER 9: Discussion
Marker assisted selection for high oil yielding varieties in Jatropha curcas 150
are more variable and share less alleles among themselves, proposing comparatively
broad genetic base.
Fixation statistics were produced for individual SSRs and groups of germplasm and FST
values ranged from 0.041 to 0.123 which indicates the majority of variation is found
within population rather than between populations. Average fixation indices over the
populations, FIT = 0.977, FST = 0.112 and FIS = 0.975 is indicative of high level of
outcrossing by high inbreeding coefficient and moderate differentiation among the
population.The mean Nm value for the accessions was found to be 2.25, suggesting gene
flow within studied populations, which is understandable due to the cross-pollinating
nature of Jatropha curcas.
Analysis of Molecular Variance (AMOVA) analysis accounted for 5% of the overall
genetic diversity present within these populations; the remaining 95% of the genetic
variability was explained by the differences among genotypes within populations,
although the variation observed among populations was statistically significant. The high
within-cultivar variability found in this study is consistent with other studies of cross
pollinating plants (Rajasekar S. et al., 2005).
Various population genetic parameters assessed for the sample population exploited on
this project shows that EST microsatellite markers designed and characterized can be
employed efficiently in breeding programs for genetic improvement of the species
through Marker Assisted Selection, for further genetic resource management and help in
making the J. curcas as potential crop with superior agronomical traits.
9.5 Genetic Diversity and Population Structure Analysis
Population structure contributes to LD between unlinked loci, producing false positive
results and must be accounted for to reduce type I error rate in association mapping. To
justify population structure there are two methods available: a model-based and distance
based. The distance based method encompasses a unweighted neighbor joining tree
constructed based on the genotypic data of SSR alleles, considering the 91 Jatropha
curcas accessions grouped in the final clusters by DARwin software version 5.0.158
CHAPTER 9: Discussion
Marker assisted selection for high oil yielding varieties in Jatropha curcas 151
(Perrier et al., 2006). The dendrogram delineated individual samples into 9 clusters (5
major Cluster I-V and 3 sub cluster each in Cluster II & V (Figure 6.7).
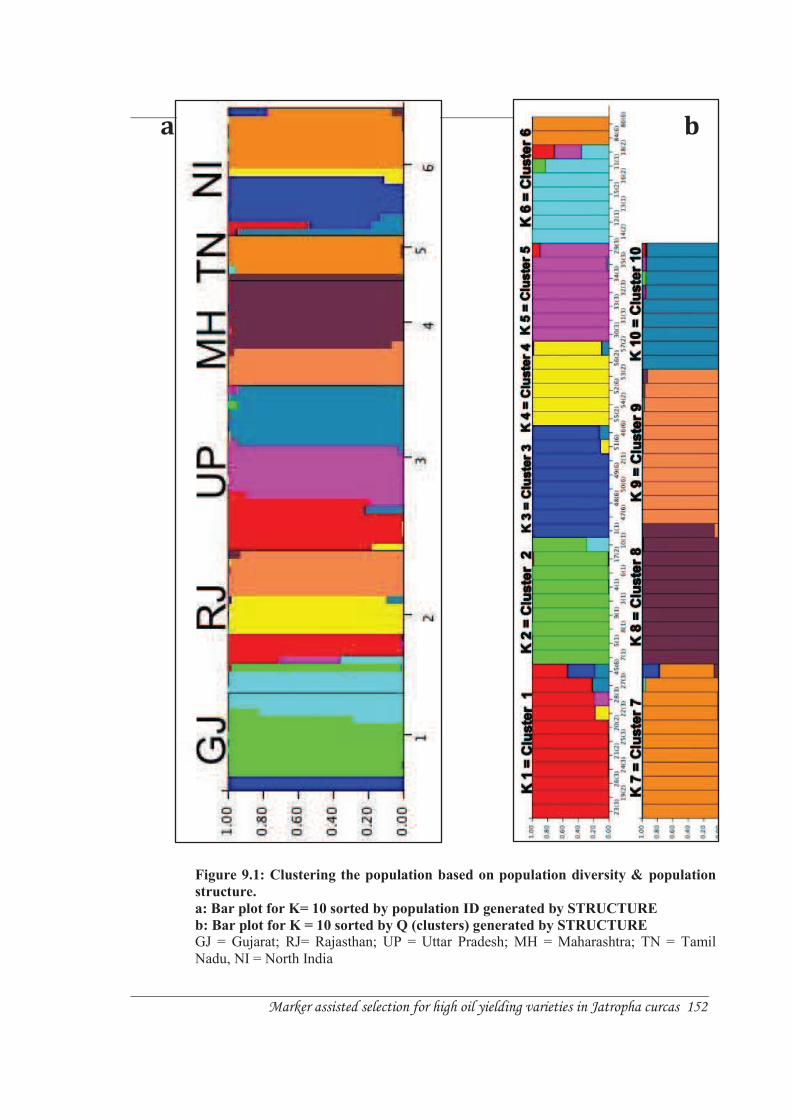
While, the model based approach estimates population structure employing Bayesian
model-based clustering algorithm implemented in STRUCTURE 2.3.1 (Pritchard et al.,
2000). STRUCTURE assigns individuals to K populations based on their multilocus
genotypes. The bar plot generated by STRUCTURE allocated individual samples into 10
clusters (Figure 9.1 a & b). Hence, there are ten real populations according to
STRUCTURE.
Comparing the two models, 5 clusters created by STRUCTURE resemble clusters
generated by DARwin. Cluster 2 (K=2) in STRUCTURE is similar to cluster I in
DARwin proportionated by individual samples from Gujarat and Rajasthan; cluster 4
(K=4) in STRUCTURE resemble cluster III in DARwin membered by samples from
Rajasthan and North India; cluster 5 (k=5) in STRUCTURE is analogous to cluster IIb in
DARwin; cluster populated by Samples from Uttar Pradesh and Rajasthan; cluster 8 in
STRUCTURE is comparable to cluster Va in DARwin occupied by samples from
Maharashtra, Tamil Nadu and Rajasthan and cluster 9 in STRUCTURE is identical to
cluster IV in DARwin assembled by samples from Maharashtra and Rajasthan (Figure
9.1 a, b & Figure 6.7).
The remainder of the clusters from the STRUCTURE and DARwin do not bear
resemblance. In fact several differences were noted between distance and model-based
estimates of population structure. For instance, grouping according to DARwin combine
all samples from Gujarat into Cluster I; however, STRUCTURE delineate the samples
into three clusters viz. cluster 2, 3 and 6 (Figure 9.1 a, b & Figure 6.7). In addition,
DARwin allocates the samples from Tamil Nadu and North India into two different
clusters viz. cluster Vb and Vc respectively, originating from a single branch.
CHAPTER 9: Discussion
Marker assisted selection for high oil yielding varieties in Jatropha curcas 152
a b
Figure 9.1: Clustering the population based on population diversity & population
structure.
a: Bar plot for K= 10 sorted by population ID generated by STRUCTURE
b: Bar plot for K = 10 sorted by Q (clusters) generated by STRUCTURE
GJ = Gujarat; RJ= Rajasthan; UP = Uttar Pradesh; MH = Maharashtra; TN = Tamil Nadu, NI = North India

CHAPTER 9: Discussion
Marker assisted selection for high oil yielding varieties in Jatropha curcas 153
However, STRUCTURE combines both clusters into cluster 7 (Figure 9.1 a, b & Figure
6.7). Moreover in DARwin, clusters IIa and IIc are populated by samples from Uttar
Pradesh and North India; however, STRUCTURE allocates samples from Rajasthan in
addition to Uttar Pradesh and North India into cluster 1 and cluster 10. Therefore, there is
limited scope to differentiate between the two clusters (Figure 9.1 a, b & Figure 6.7).
According to our results, the model-based approach using STRUCTURE is a better
estimate of population structure than the distance-based approach employing DARwin to
create a phylogenetic tree. With samples from Gujarat, unlike DARwin, STRUCTURE
assigns them into more than one cluster; also samples from other regions are allocated to
more than one cluster. Hence, it proves the existence of admixture in the given
populations. Similarly, Pritchard et al., 2000 indicated that Model-based estimates of
population structure are superior to distance- based estimates as individual membership
can be probabilistically assigned and allows modeling of admixture and assignment of
individuals to more than one subpopulation (Reimer, 2009). In further support,
Vigouroux et al., 2008 stated that phylogenetic analysis alone is ill suited to uncover the
reticulate pattern of evolution expected to result from this type of introgression pattern,
because in a bifurcating dendrogram, the admixed material will often appear to have been
derived from one or the other source population, but not both. In such cases, structure
analysis is complementary.
Furthermore to study the population structure, Principal Coordinate Analysis was
performed based on genetic distance matrix using DARwin software (Perrier et al.,
2006). The X-axis (Coordinate 1) explains 44.56 % variance and the Y-axis explains
(Coordinate 2) 21.29 % variance in the samples for SSR markers (Figure 6.8a). The
genetic divergence among the samples observed was identical to phylogenetic tree
assortment (Figure 6.7). Ouma et al., 2011 stated that the PCoA approach in contrast to
the Bayesian assignment algorithm (Figure 9.1a & b) does not make any assumptions
about Linkage Disequilibrium and allow for a visual assessment of the degree to which
populations differ from each other. Considering this assumption, we found that the
samples have been clustered according to their geographical regions rather than their oil
content. Samples with low oil content and high oil content were grouped into the same
CHAPTER 9: Discussion
Marker assisted selection for high oil yielding varieties in Jatropha curcas 154
clusters. Hence, if we summon both the model and PCoA analysis, it can be concluded
that sample are divided into five main clusters and subdivided into 10 different clusters
and they bear moderate population structure with admixture within the population.
9.6 Association Mapping for Marker- Trait association
Once population structure has been accounted for, the final step of the association
analysis can be conducted. The Association analysis was performed using TASSEL
version 2.1 (Bradbury et al., 2007). Two approaches were executed in search for
associations viz. General Linear Model (GLM) and Mixed Linear Model (MLM). The
GLM approach estimated three associated markers SSR 42, SSR-53 and SSR-23, While
MLM approach estimated four associated markersSSR 42, SSR-53, SSR-23 and SSR 56.
The p-values for all the markers in the MLM approach were lower than the GLM
approach. In most studies, for instance conducted on tomatoes (Ranc et al., 2012),
common bean (Galeano et al., 2012), spring wheat (Yu et al. 2011,), the p value were
lower in GLM approach. However, we encountered one study where the MLM approach
established lower p-values that GLM (Dhanapal et al., 2013). Furthermore, the number of
associations in our study in MLM approach exceeded the GLM approach. The rationality
of attaining higher number of associations in MLM in comparison to GLM has been
reinforcedin the user manual of the software TASSEL 2.1 (Bradbury et al., 2007); it
states that MLM has higher statistic power than GLM and should detect more assertions
in case they are valid. Thus, MLM approach is more preferred in association mapping
studies, since GLM does not consider co-ancestry (kinship or relatedness) as a co-factor,
and therefore the rate of false-positives is inflated byusing this method (Galeano et al.,
2012). MLM approach provided stronger association for the same markers in contrast to
GLM. This confirms that the involvement of population structuring and kinship
relationships among analyzed forms improves the resolution of association mapping
(Niedziela et al., 2012).
Two markers SSR-53 and SSR-56 out of the four significantly associated with oil content
were annotated by Costa et al., 2010. Contig 655 encompasses 5 unisequences; SSR-53
with Genebank accession number GJCCJC2047F01.b and SSR-56 with Genebank

CHAPTER 9: Discussion
Marker assisted selection for high oil yielding varieties in Jatropha curcas 155
accession number GJCCJC2045H12.b1 are two of the unisequences found to have acetyl
CoA- carboxylase activity (Costa et al., 2010). Acetyl CoA carboxylase is a rate
limiting step in fatty acid biosynthesis (Turnham et al., 1982); Acetyl-CoA carboxylase
catalyzes the carboxylation of acetyl-CoA to malonyl-CoA (Podkowiński et al., 2011).
Hence, it proves the importance of SSR-53 and SSR-56 markers in oil biosynthesis. SSR-
53, according to the sequence submitted by Da Silva MJ, one of the authors of Costaet
al., 2010, has a putative identity to the Phytoalexin Deficient 4 (PAD4) in Arabidopsis
thaliana. PAD4 encodea lipase-like gene that is important for salicylic acid signaling;
specifically share sequence similarity to triacyl glycerol lipases and other esterases for
fattyacid breakdown in oil biosynthesis pathway (Jirage et al., 1999). Thus, SSR-53
evidently exhibited association to the oil content trait. Subsequently, SSR- 56 in addition
to acetyl-CoA carboxylase activity demonstrates putative identity to the inducer of CBF
expression 1 (ICE1) protein. ICE 1 is an upstream transcription factor that regulates the
transcription of CBF genes in cold (Chinnusamy et al., 2003). The expression of CBF
family of transcription factors is triggered in cold temperatures, which in turn activate
many downstream genes that confer chilling and freezing tolerance to plants
(Chinnusamy et al., 2003). The ICE 1 mutation blocks the expression of CBF3 and
decreases the expression of many genes downstream of CBFs (Chinnusamy et al., 2003).
SSR-42 has been annotated to gene that PPPDE (Permuted Papain fold Peptidases of
DsRNA viruses and Eukaryotes) thiol peptidase protein family. In Eukaryotes, these
protein function in deubiquitination of conserved proteins involved in key cellular
functions. Hence, the deubiquitination and peptidase functions can suggest its role in
activation of important enzymes involved in oil biosynthesis. While, SSR-23 has not been
annotated to a particular family of proteins, however, it is conserved region of
hypothetical protein according to BLAST2Go.
Moreover, all the four associated markers sequence depicted the presence of SSR
markers. Consequently, the presence of SSRs in the transcripts of genes suggests that
they might have a role in gene expression or function (Varshney et al., 2005).
Furthermore, completely associated EST-SSR markers or even responsible for a
particular targeted phenotypic trait can contribute to ‘direct allele selection’ correlated to

CHAPTER 9: Discussion
Marker assisted selection for high oil yielding varieties in Jatropha curcas 156
a trait of interest (Varshney et al., 2005). Hence, our identification of four molecular
markers, SSR 23, SSR 42, SSR 53 and SSR 56, that are tightly linked to the trait of oil
content among the Jatropha curcas accessions will reduce the need for field-based
screening of high and low oil yielding Jatropha seeds and accelerate enduring plantations
of Jatropha curcas.
CHAPTER 9: Discussion
Marker assisted selection for high oil yielding varieties in Jatropha curcas 157
9.7 REFERENCES
Banat, F., Pal, P., Jwaied, N. and Rabadi, A. (2013) Extraction of Olive Oil from Olive
Cake using Soxhlet Apparatus. American Journal of Oil and Chemical Technologies1: 1–
8.
Bradbury, P. J., Zhang, Z., Kroon, D. E., Casstevens, T. M., Ramdoss, Y. and Buckler, E.
S. (2007) TASSEL: software for association mapping of complex traits in diverse
samples. Bioinformatics23: 2633–35
Bowcock, A.M., Linares, A.R., Tomfohrde, J., Minch, E. Kidd, J.R. and Cavalli-Sforza,
L. L. (1994) High resolution of human evolutionary trees with polymorphic
microsatellites. Nature 368:455–457
Chinnusamy, V., Ohta, M., Kanrar, S., Lee, B. H., Hong, X., Agarwal, M., and Zhu, J. K.
(2003) ICE1: a regulator of cold-induced transcriptome and freezing tolerance in
Arabidopsis. Genes & Development17: 1043–54
Costa, G. G. L., Cardoso, K. C., Del Bem, L. E. V, Lima, A. C., Cunha, M. A. S., de
Campos-Leite, L. and Da-Silva, M. J. (2010) Transcriptome analysis of the oil-rich seed
of the bioenergy crop Jatropha curcas L. BMC genomics11: 462
Dhanapal, A. P., and Crisosto, C. H. (2013) Association genetics of chilling injury
susceptibility in peach (Prunus persica (L.) Batsch) across multiple years. 3 Biotech
3:481-490
Dib, C. Faure, S. Fizames, C. Samson, D. Drouot, N. Vignal, A. Millasseau, P. Marc, S.
Hazan, J. Seboun, E. Lathrop, M. Gyapay, G. Morissette and J. Weissenbach, J. (1996)
A comprehensive geneticmap of the human genome based on 5,264 microsatellites.
Nature 380:152–154
Dietrich, W. F, Miller, J. Steen, R. Merchant, M. A. Damronboles, D. Husain, Z. Dredge,
R. Daly, M. J. Ingalls, K. A. O’Connor, T. J. Evans, C. A. DeAngelis, M. M. Levinson,
D. M. Kruglyak, L. Goodman, N. Copeland, N.G. Jenkins, N.A. Hawkins, T. L. Stein,
CHAPTER 9: Discussion
Marker assisted selection for high oil yielding varieties in Jatropha curcas 158
L. and Lander ES (1996) A comprehensive genetic map of the mouse genome. Nature
380:149–152
Eujayl, I. Sledge, M. Wang, L. May, G. Chekhovskiy, K. Zwonitzer and J. Mian, M.
(2004) Medicago truncatula EST-SSRs reveal cross species genetic markers for
Medicago spp. Theoratical and Applied Genetics 108:414–422
Galeano, C. H., Cortés, A. J., Fernández, A. C., Soler, Á., Franco-Herrera, N., Makunde,
G., and Blair, M. W. (2012) Gene-based single nucleotide polymorphism markers for
genetic and association mapping in common bean. BMC genetics13: 48
Guobin, S., Wenbiao, J. I. N., & Xinhui, X. (2008) Purification of total DNA extracted
from activated sludge. Journal of Environmental Sciences 20: 80–87
Goldstein, D. B. and Clark, A.G. (1995) Microsatellite variation in North American
populations of Drosophila melanogaster. ucleicAcids Res 23:3882–86
Jarne, P. and Lagoda, P.J.L. (1996) Microsatellites, from molecules topopulations and
back. Trends in Ecology and Evolution 11:424–429
Jirage, D., Tootle, T. L., Reuber, T. L., Frost, L. N., Feys, B. J., Parker, J. E.and
Glazebrook, J. (1999) Arabidopsis thaliana PAD4 encodes a lipase-like gene that is
important for salicylic acid signaling. Proceedings of the National Academy of Sciences
of the United States of America, 96:13583–88
Jumat, S., and Rozaini, A. (2008) Physicochemical Properties of Malaysian Jatropha
curcas Seed Oil. Sains Malaysiana37: 379–382
Kantety, R.V., La Rota, M., Matthews, D.E. and Sorrells, M.E. (2002) Data mining for
simple sequence repeats in expressed sequence tags from barley, maize, rice, sorghum
and wheat. Plant Molecular Biology 48:501-510
Khoddami, A., Wilkes, M. A. and Roberts, T. H. (2013) Techniques for analysis of plant
phenolic compounds. Molecules 18: 2328–75

CHAPTER 9: Discussion
Marker assisted selection for high oil yielding varieties in Jatropha curcas 159
Knapik, E. W. Goodman and A. Ekker, M. (1998) A microsatellite genetic linkage map
for zebrafish (Danio rerio). Nature Genetics 18:338–343
Nagarajan, S., Steephen, M., Murugan, K., Nair, R. R., Sethuraman, T., Alagar, P., &
Ganesh, D. (2011) Improved protocol for isolation of genomic DNA from leaf tissues of
Phyllanthus emblica Gaertn. Iranian Journal of Biotechnology 9:307–313
Niedziela, A., Bednarek, P. T., Cichy, H., Budzianowski, G., Kilian, A. and Anioł, A.
(2012) Aluminum tolerance association mapping in triticale. BMC Genomics 13: 67
Perrier, X., & Jacquemoud-Collet, J. P. (2006) DARwin software.
PODKOWIŃSKI, J., & TWORAK, A. (2011) Acetyl-coenzyme A carboxylase- an
attractive enzyme for biotechnology. Journal of Biotechnology,Computational Biology
and Bionanotechnology 92: 321–35
Pritchard, J. K., Stephens, M., and Donnelly, P. (2000) Inference of Population Structure
Using Multilocus Genotype Data: Linked Loci and Correlated Allele Frequencies.
Genetics 164: 1567–87
Ranc, N., Muños, S., Xu, J., Le Paslier, M-C., Chauveau, A., Bounon, R. and Causse, M.
(2012) Genome-wide association mapping in tomato (Solanum lycopersicum) is possible
using genome admixture of Solanum lycopersicum var. cerasiforme. G3 (Bethesda) 2:
853–64
Reimer, S. O. (2009) Association Mapping of Endosperm Colour in Durum Wheat
(Triticum turgidum L. var. durum). University of Saskatchewan.
Schuler, GD. Boguski, MS. Stewart, EA. (1996) A gene map of the human genome.
Science 274:540–546
Turnham, E. and Northcote, D. H. (1982) The use of acetyl-CoA carboxylase activity and
changes in wall composition as measures of embryogenesis in tissue cultures of oil palm
(Elaeis guineensis). The Biochemical Journal 208:323–32

CHAPTER 9: Discussion
Marker assisted selection for high oil yielding varieties in Jatropha curcas 160
Varshney, R. K., Graner, A. and Sorrells, M. E. (2005) Genic microsatellite markers in
plants: features and applications. Trends in Biotechnology 23:48–55
Weidner, S., Powałka, A., Karamać, M. and Amarowicz, R. (2012). Extracts of phenolic
compounds from seeds of three wild grapevines-comparison of their antioxidant activities
and the content of phenolic compounds. International Journal of Molecular Sciences 13:
3444–57
Xuanqiang Liang, Xiaoping Chen, Yanbin Hong, Haiyan Liu, Guiyuan Zhou, Shaoxiong
Li and Baozhu Guo (2009) Utility of EST-derived SSR in cultivated peanut (Arachis
hypogaea L.) and Arachis wild species. BMC Plant Biology 9:35
Zane, L. Bargelloni and L. Patarnello, T. (2002) Strategies for microsatellite isolation: a
review. Molecular Ecology 11:1–16