Embed Size (px)
DESCRIPTION
Chapter 9. Nuclear Magnetic Resonance and Mass Spectrometry. Introduction. Classic methods for organic structure determination: Boiling point Refractive index Solubility tests Functional group tests Derivative preparation Sodium fusion (to identify N, Cl, Br, I & S) - PowerPoint PPT Presentation
Citation preview
Created byProfessor William Tam & Dr. Phillis
Chang Ch. 9 - 1
Chapter 9Chapter 9
Nuclear MagneticNuclear MagneticResonance and MassResonance and Mass
SpectrometrySpectrometry
Ch. 9 - 2
1. Introduction Classic methods for organic
structure determination:● Boiling point● Refractive index● Solubility tests● Functional group tests● Derivative preparation● Sodium fusion (to identify N, Cl, Br, I
& S)● Mixture melting point● Combustion analysis● Degradation
Ch. 9 - 3
Classic methods for organic structure determination.
●These methods require large quantities of sample and are time consuming.
Ch. 9 - 4
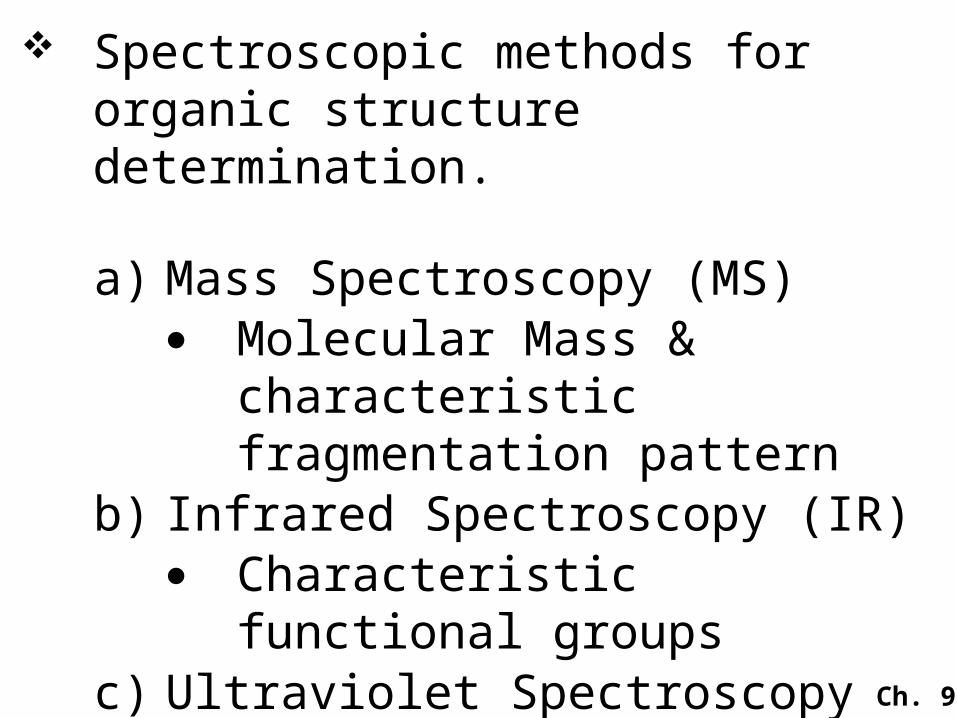
Spectroscopic methods for organic structure determination.
a) Mass Spectroscopy (MS)● Molecular Mass &
characteristic fragmentation pattern
b) Infrared Spectroscopy (IR)● Characteristic functional
groupsc) Ultraviolet Spectroscopy (UV)
● Characteristic chromophored) Nuclear Magnetic Resonance
(NMR)
Ch. 9 - 5
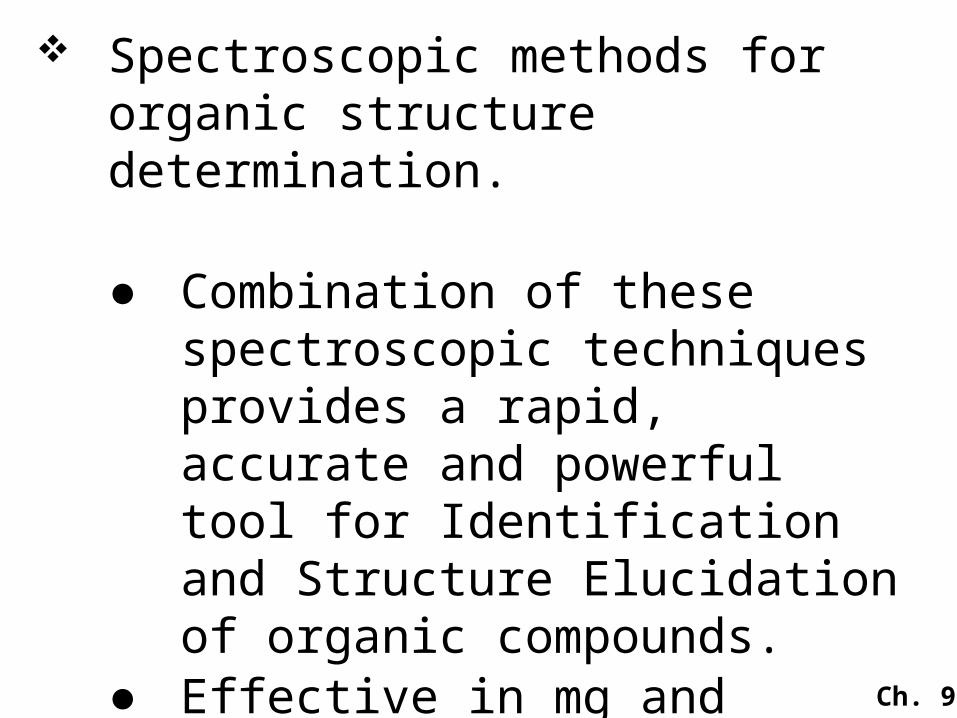
Spectroscopic methods for organic structure determination.
● Combination of these spectroscopic techniques provides a rapid, accurate and powerful tool for Identification and Structure Elucidation of organic compounds.
● Effective in mg and microgram quantities.
Ch. 9 - 6
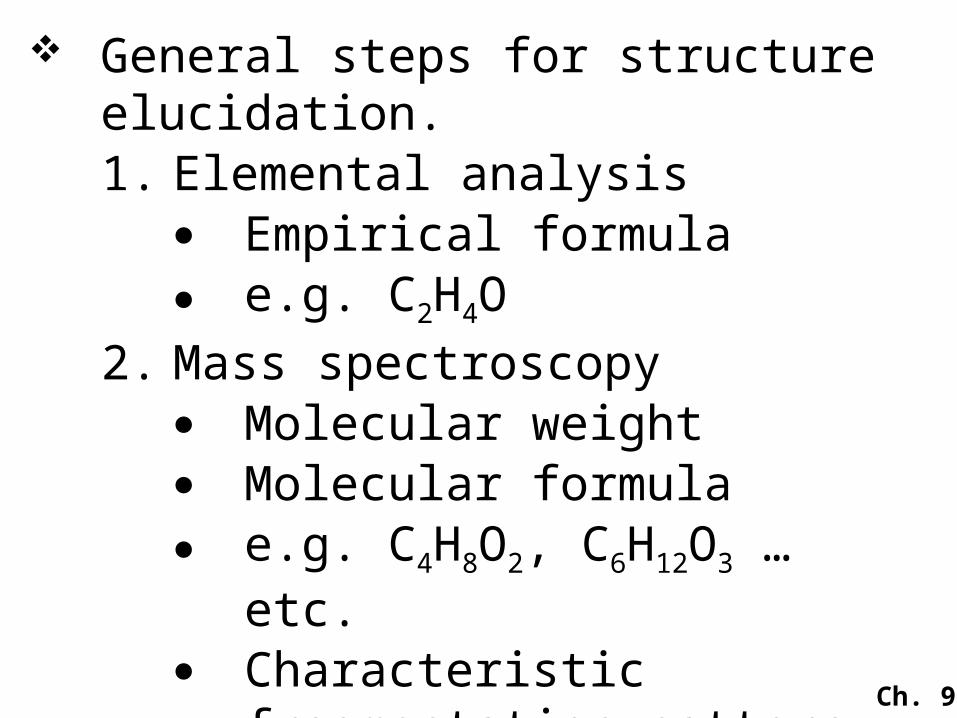
General steps for structure elucidation. 1. Elemental analysis
● Empirical formula● e.g. C2H4O
2. Mass spectroscopy● Molecular weight● Molecular formula● e.g. C4H8O2, C6H12O3 … etc.● Characteristic
fragmentation pattern for certain functional groups.

Ch. 9 - 7
General steps for structure elucidation.
3. From molecular formula
● Double bond equivalent (DBE)
4. Infrared spectroscopy (IR)● Identify some specific
functional groups● e.g. C=O, C–O, O–H, COOH,
NH2 … etc.
Ch. 9 - 8
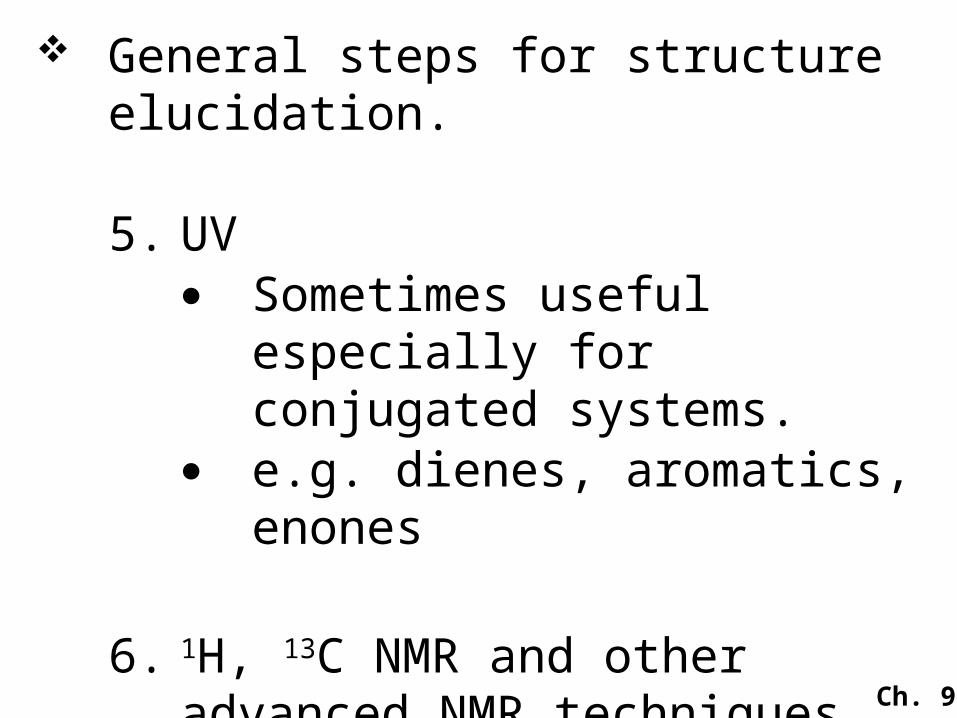
General steps for structure elucidation.
5. UV
● Sometimes useful especially for conjugated systems.
● e.g. dienes, aromatics, enones
6. 1H, 13C NMR and other advanced NMR techniques.● Full structure determination
Ch. 9 - 9
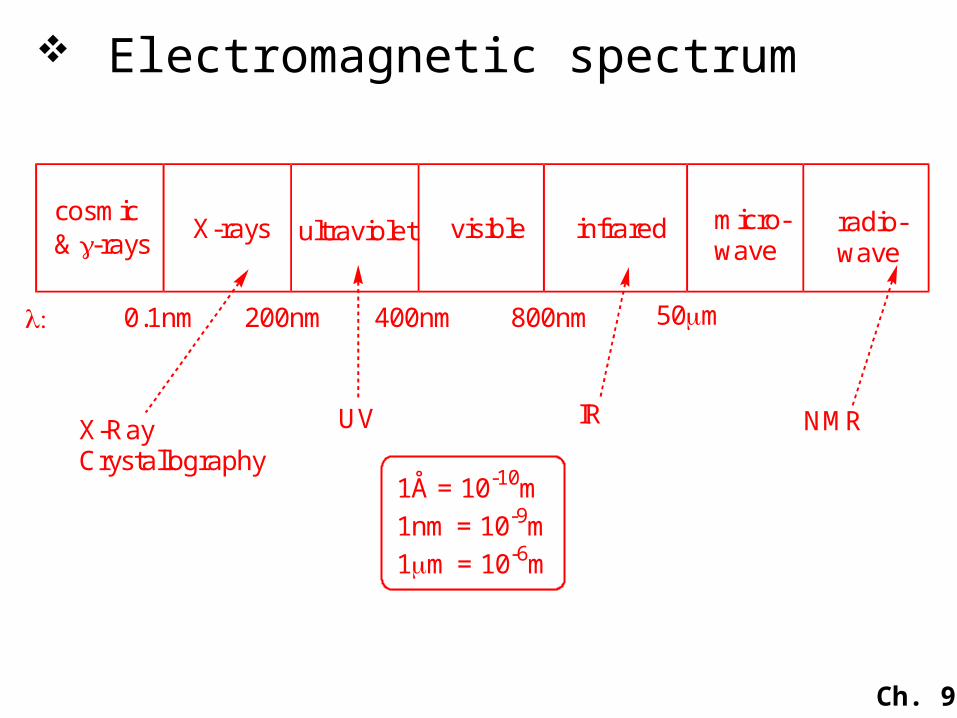
Electromagnetic spectrum
cosmic & -rays
X-rays ultraviolet visible infrared micro-wave
radio-wave
1Å = 10-10m
1nm = 10-9m
1m = 10-6m
0.1nm 200nm 400nm 800nm 50m
X-RayCrystallography
UV IR NMR
Ch. 9 - 10
2. Nuclear Magnetic Resonance(NMR) Spectroscopy
A graph that shows the characteristic energy absorption frequencies and intensities for a sample in a magnetic field is called a nuclear magnetic resonance (NMR) spectrum.
Ch. 9 - 11
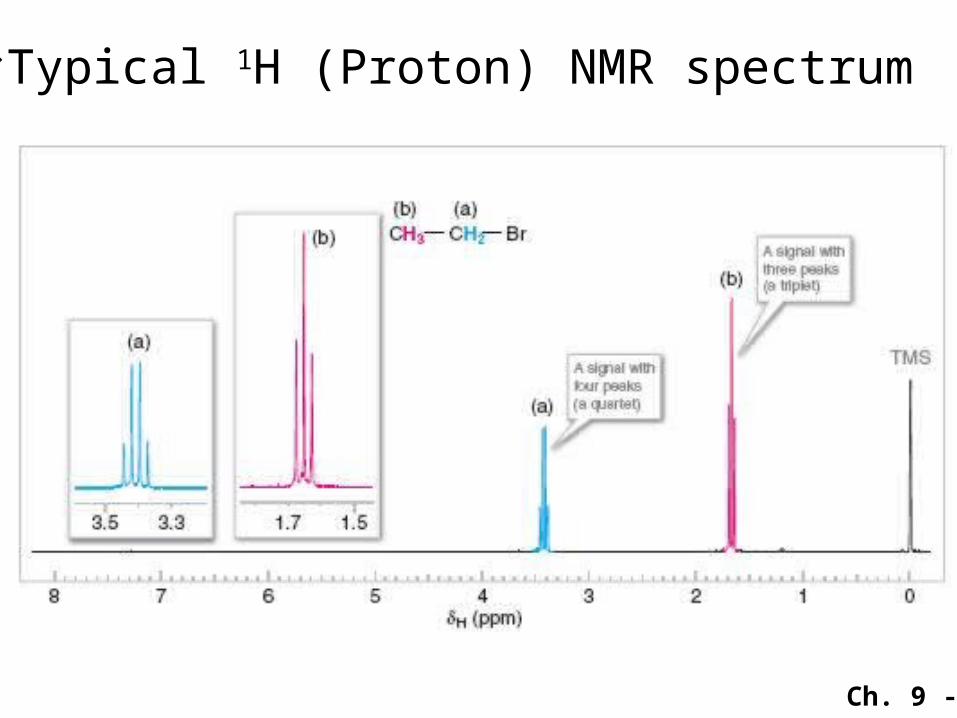
Typical 1H (Proton) NMR spectrum
Ch. 9 - 12
1. The number of signals in the spectrum tells us how many different sets of protons there are in the molecule.
2. The position of the signals in the spectrum along the x-axis tells us about the magnetic environment of each set of protons arising largely from the electron density in their environment.
Ch. 9 - 13
3. The area under the signal tells us about how many protons there are in the set being measured.
4. The multiplicity (or splitting pattern) of each signal tells us about the number of protons on atoms adjacent to the one whose signal is being measured.
Ch. 9 - 14
Typical 1H NMR spectrum
● Chemical Shift ().
● Integration (areas of peaks no. of H).
● Multiplicity (spin-spin splitting) and coupling constant.
Ch. 9 - 15
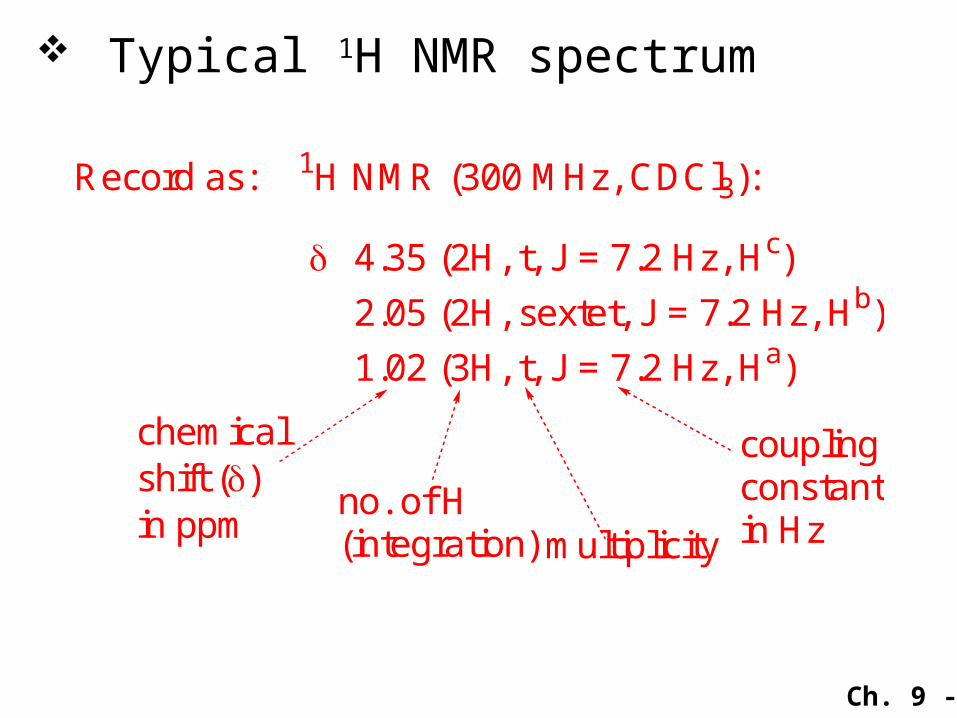
Typical 1H NMR spectrum
Record as: 1H NMR (300 MHz, CDCl3):
4.35 (2H, t, J = 7.2 Hz, Hc)
2.05 (2H, sextet, J = 7.2 Hz, Hb)
1.02 (3H, t, J = 7.2 Hz, Ha)
chemicalshift () in ppm
no. of H(integration) multiplicity
couplingconstantin Hz
Ch. 9 - 16
2A.2A. Chemical ShiftChemical Shift The position of a signal along the x-
axis of an NMR spectrum is called its chemical shift.
The chemical shift of each signal gives information about the structural environment of the nuclei producing that signal.
Counting the number of signals in a 1H NMR spectrum indicates, at a first approximation, the number of distinct proton environments in a molecule.
Ch. 9 - 17
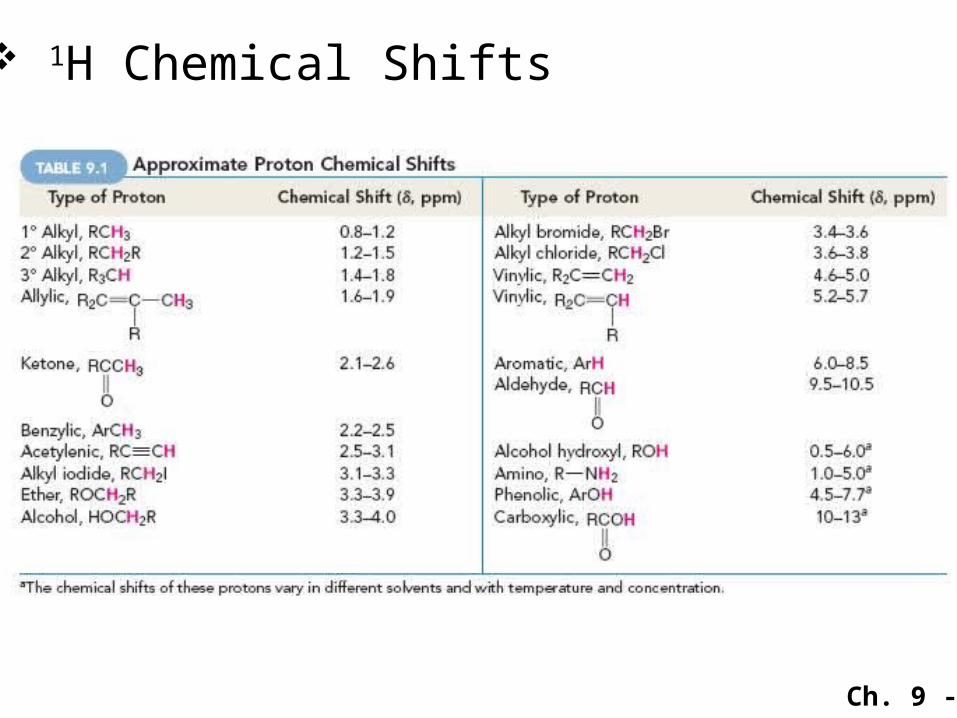
1H Chemical Shifts
Ch. 9 - 18
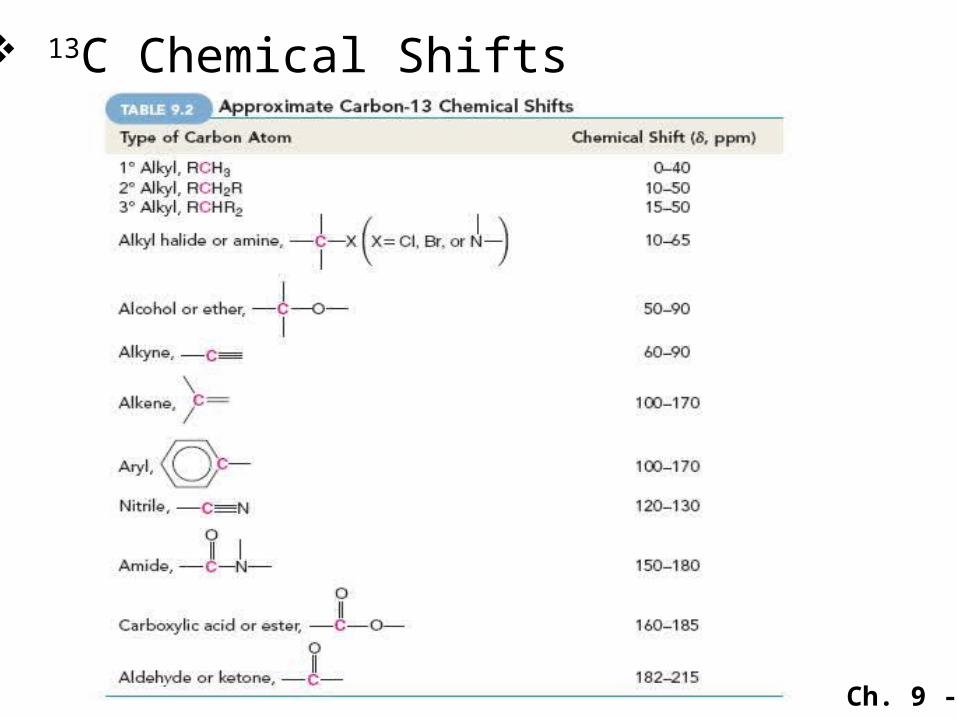
13C Chemical Shifts
Ch. 9 - 19
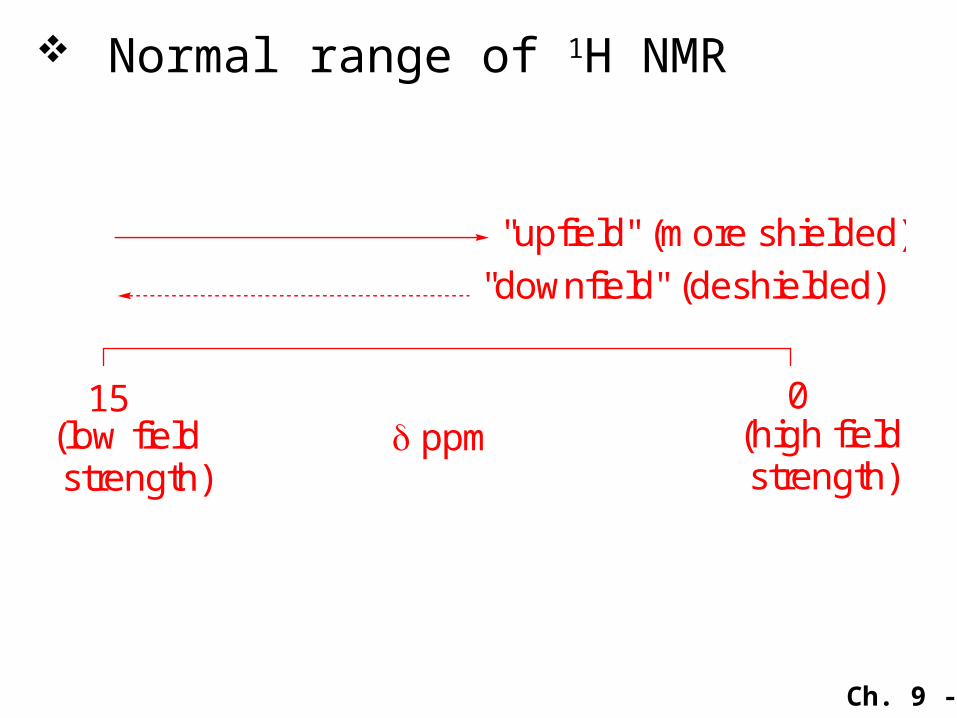
Normal range of 1H NMR
15 0 ppm
"upfield" (more shielded)
"downfield" (deshielded)
(high field strength)
(low field strength)
Ch. 9 - 20
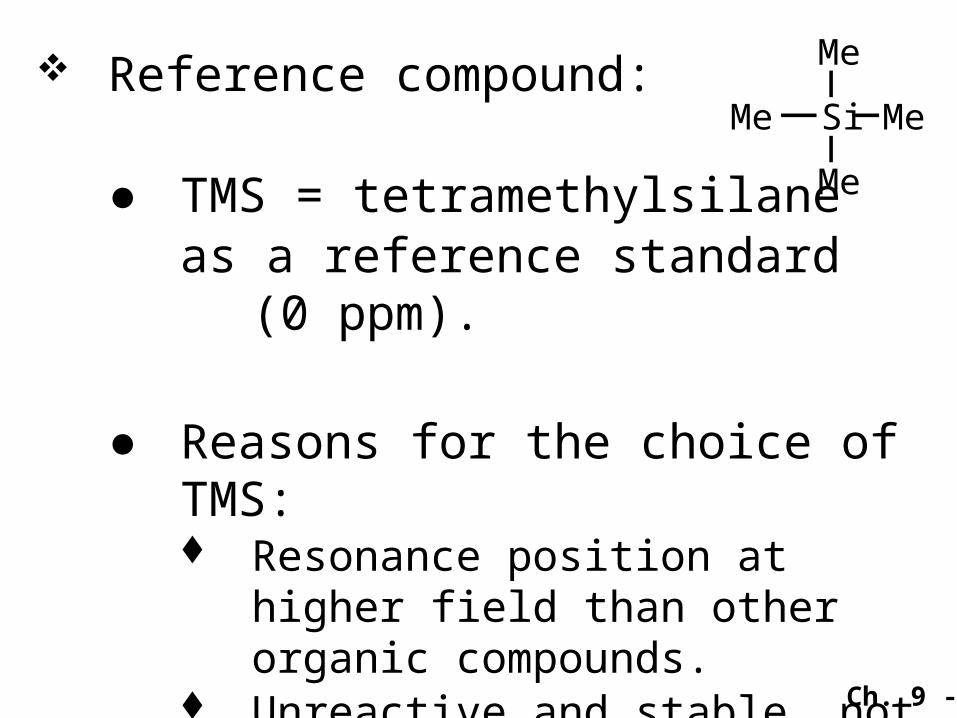
Reference compound:
● TMS = tetramethylsilaneas a reference standard (0
ppm).
● Reasons for the choice of TMS: Resonance position at higher
field than other organic compounds.
Unreactive and stable, not toxic
Volatile and easily removed(B.P. = 28oC)
Me
Si MeMe
Me
Ch. 9 - 21
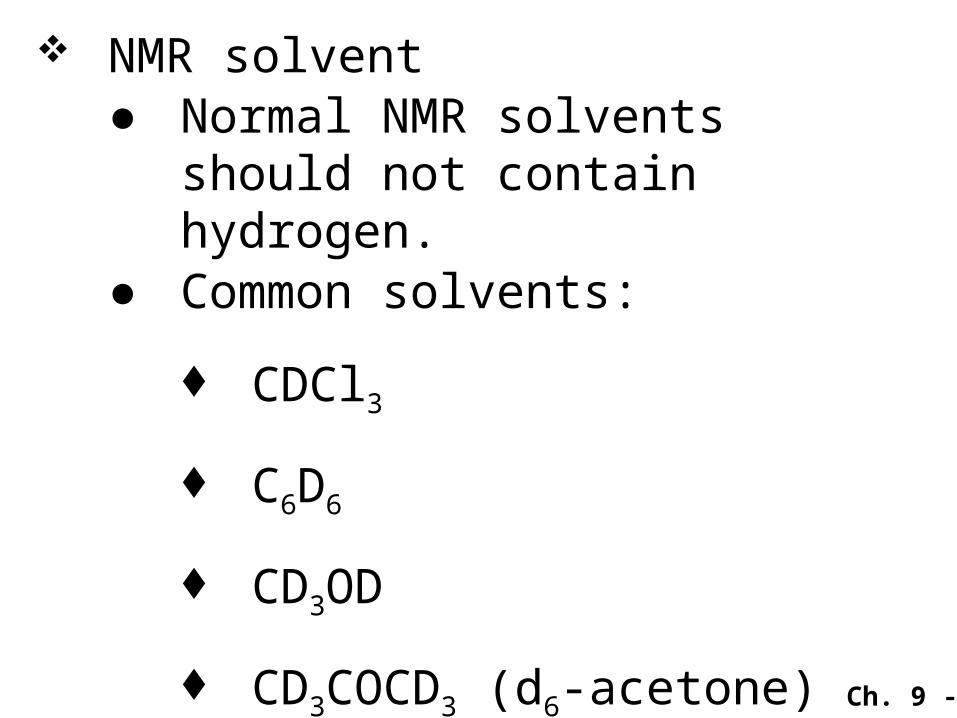
NMR solvent● Normal NMR solvents should
not contain hydrogen.● Common solvents:
CDCl3
C6D6
CD3OD
CD3COCD3 (d6-acetone)
Ch. 9 - 22
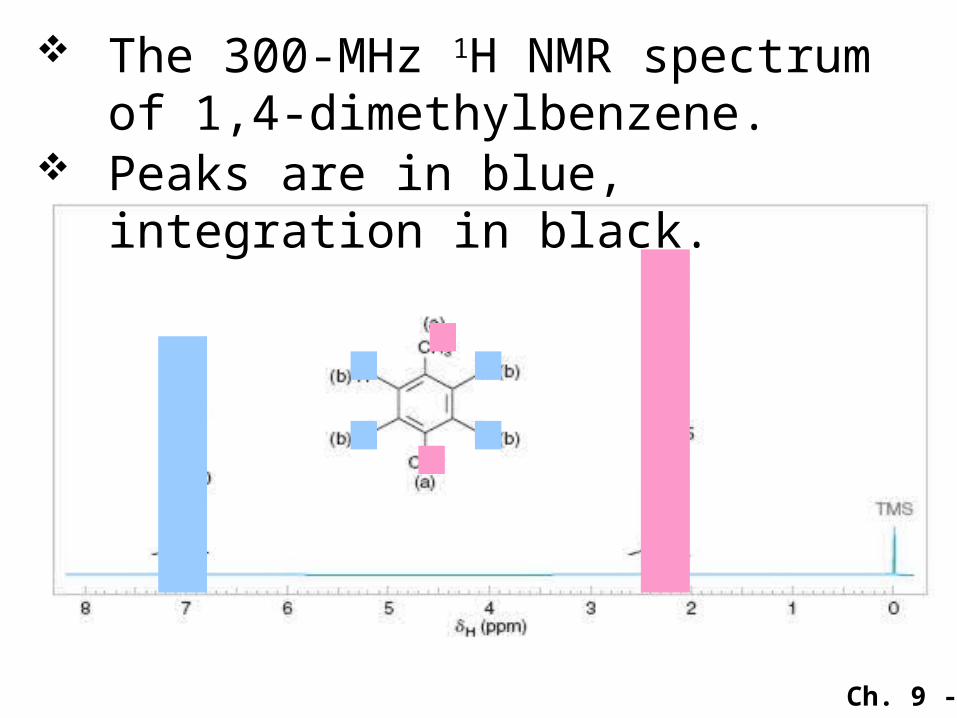
The 300-MHz 1H NMR spectrum of 1,4-dimethylbenzene.
Peaks are in blue, integration in black.
Ch. 9 - 23
2B.2B. Integration of Signal AreasIntegration of Signal Areas
Integral Step HeightsIntegral Step Heights
The area under each signal in a 1H NMR spectrum is proportional to the number of hydrogen atoms producing that signal.
It is signal area (integration), not signal height, that gives information about the number of hydrogen atoms.
Ch. 9 - 24
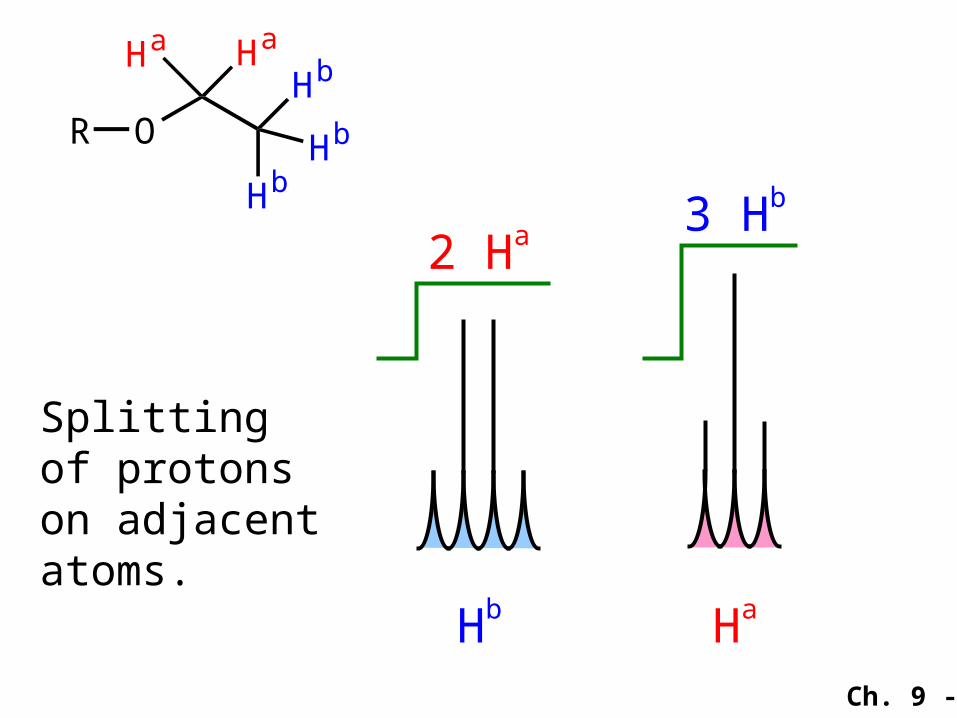
O
Ha Ha
Hb
HbHbR
HaHb
2 Ha 3 Hb
Splitting of protons on adjacent atoms.
Ch. 9 - 25
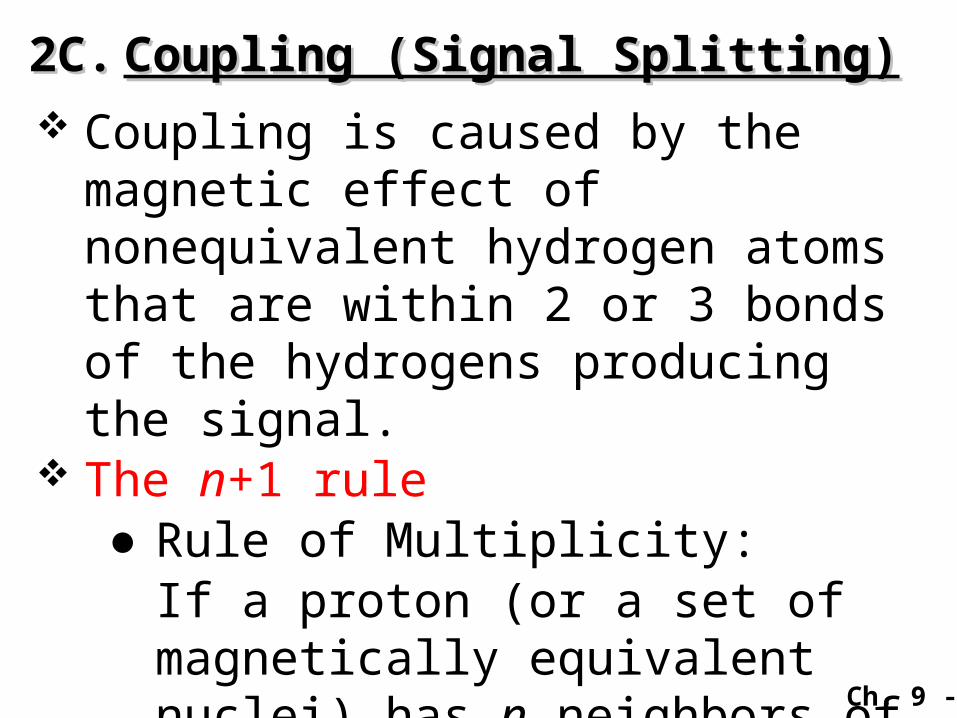
2C.2C. Coupling (Signal Splitting)Coupling (Signal Splitting) Coupling is caused by the
magnetic effect of nonequivalent hydrogen atoms that are within 2 or 3 bonds of the hydrogens producing the signal.
The n+1 rule●Rule of Multiplicity:
If a proton (or a set of magnetically equivalent nuclei) has n neighbors of magnetically equivalent protons. It’s multiplicity is n + 1.
Ch. 9 - 26
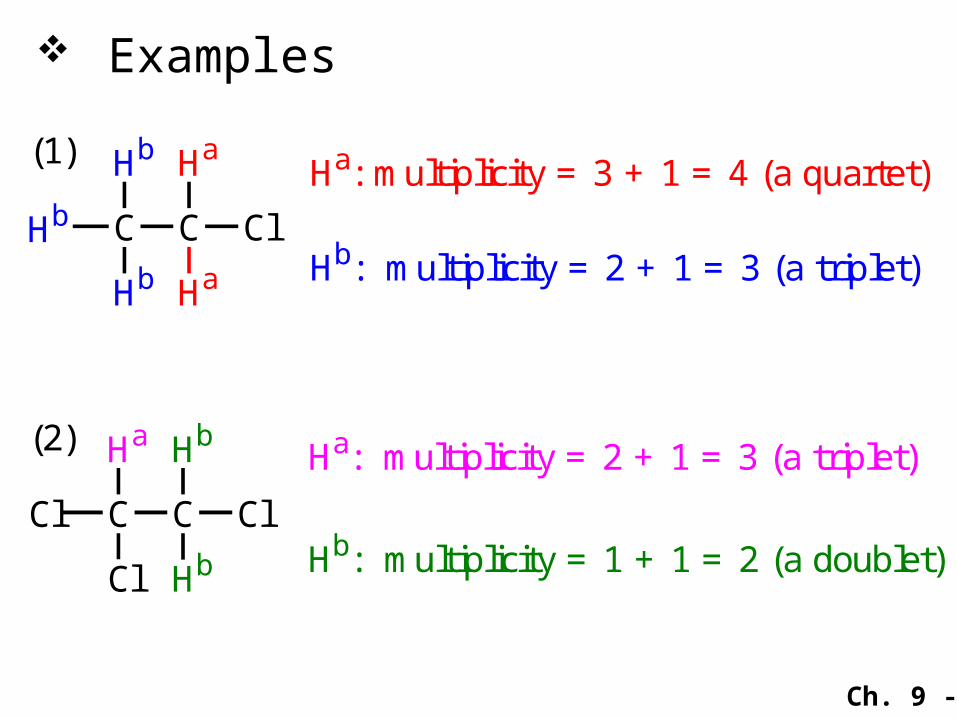
Examples
Hb C C Cl
HaHb
Hb Ha
Ha: multiplicity = 3 + 1 = 4 (a quartet)
Hb: multiplicity = 2 + 1 = 3 (a triplet)
(1)
Cl C C Cl
HbHa
Cl Hb
Ha: multiplicity = 2 + 1 = 3 (a triplet)
Hb: multiplicity = 1 + 1 = 2 (a doublet)
(2)
Ch. 9 - 27
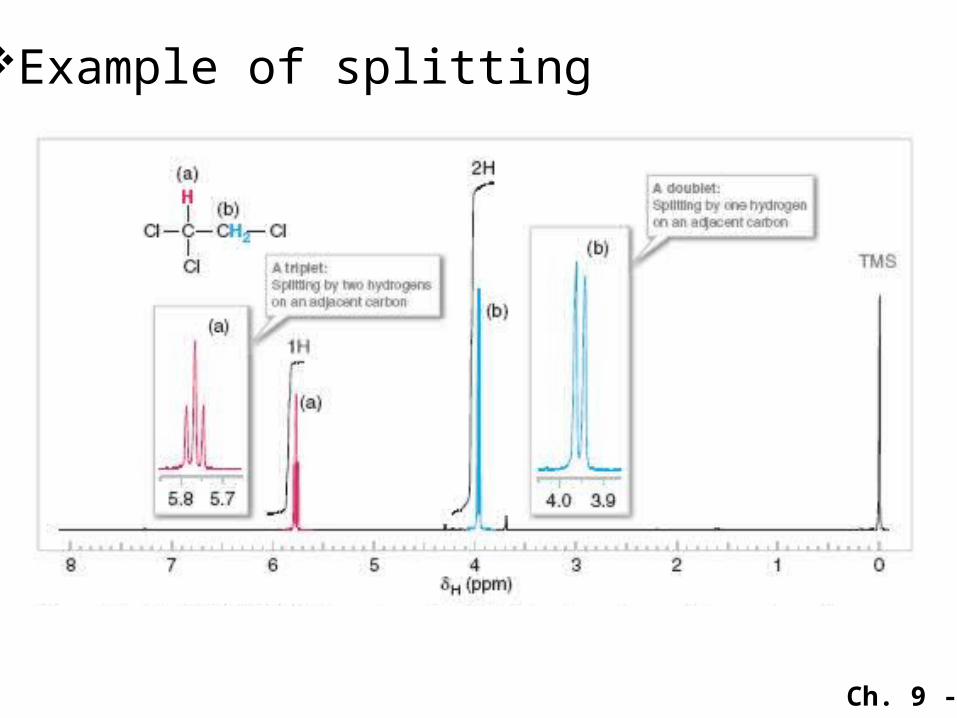
Example of splitting
Ch. 9 - 28
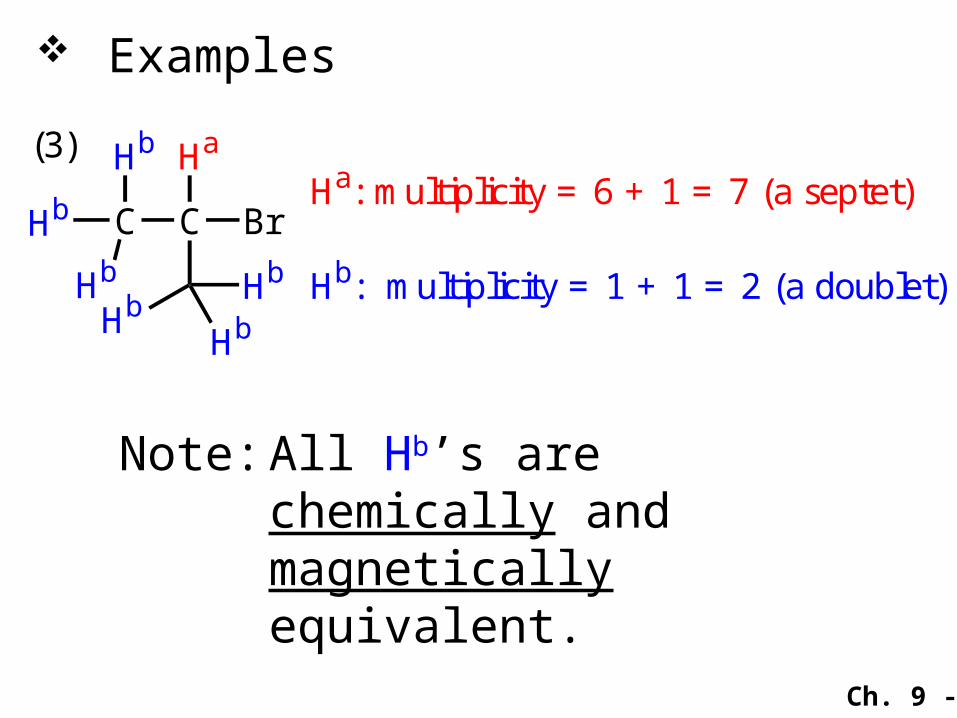
Examples
Note: All Hb’s are chemically and magnetically equivalent.
Hb C C Br
HaHb
Hb
Ha: multiplicity = 6 + 1 = 7 (a septet)
Hb: multiplicity = 1 + 1 = 2 (a doublet)
(3)
HbHb
Hb
Ch. 9 - 29
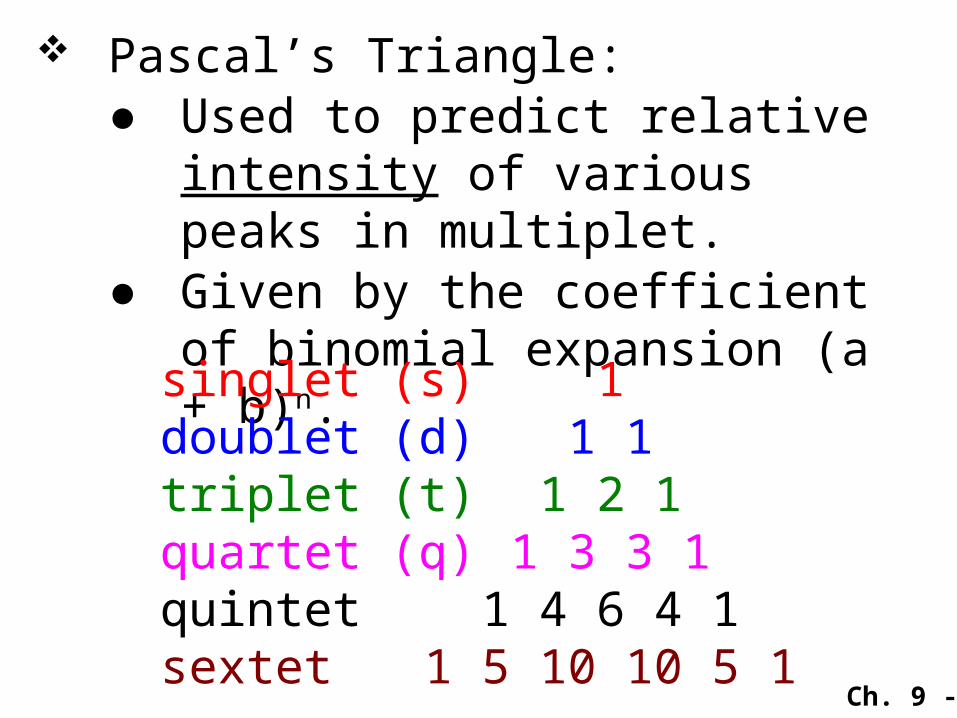
Pascal’s Triangle:● Used to predict relative
intensity of various peaks in multiplet.
● Given by the coefficient of binomial expansion (a + b)n.singlet (s) 1doublet (d) 1 1triplet (t) 1 2 1quartet (q) 1 3 3 1quintet 1 4 6 4 1sextet 1 5 10 10 5 1
Ch. 9 - 30
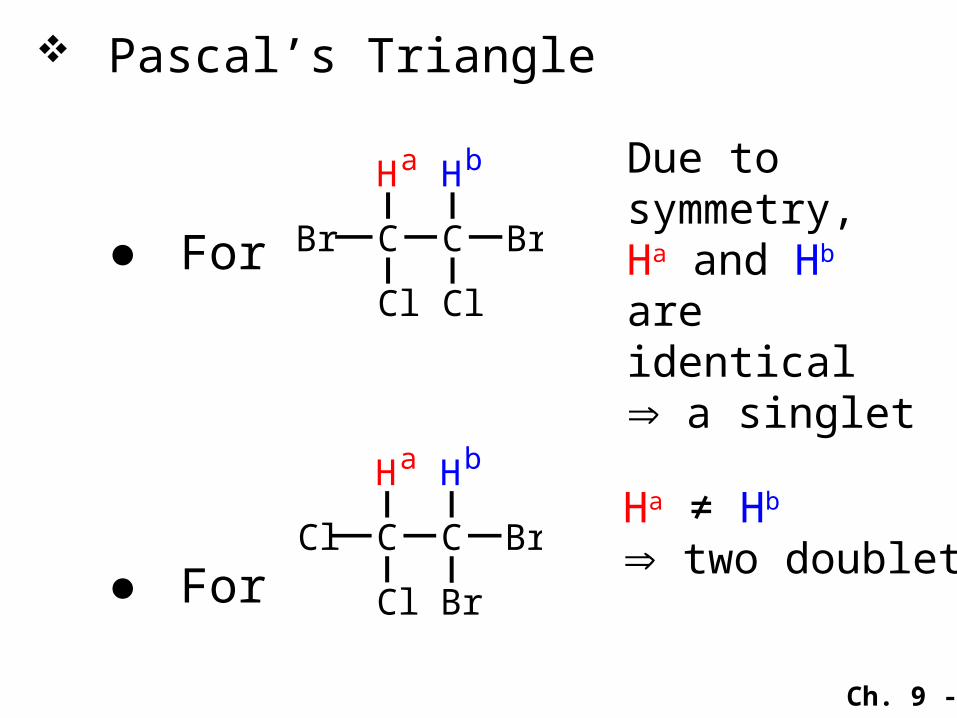
Pascal’s Triangle
● For
● For
Br C C Br
HbHa
Cl Cl
Due to symmetry, Ha and Hb are identical a singlet
Cl C C Br
HbHa
Cl Br
Ha ≠ Hb
two doublets
Ch. 9 - 31
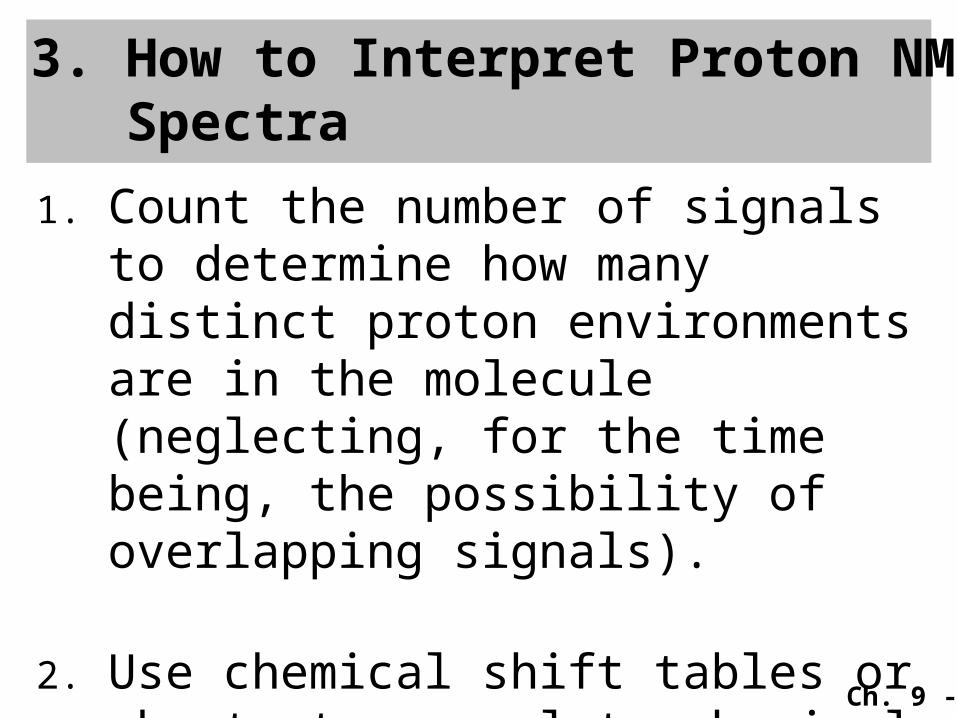
3. How to Interpret Proton NMRSpectra
1. Count the number of signals to determine how many distinct proton environments are in the molecule (neglecting, for the time being, the possibility of overlapping signals).
2. Use chemical shift tables or charts to correlate chemical shifts with possible structural environments.
Ch. 9 - 32
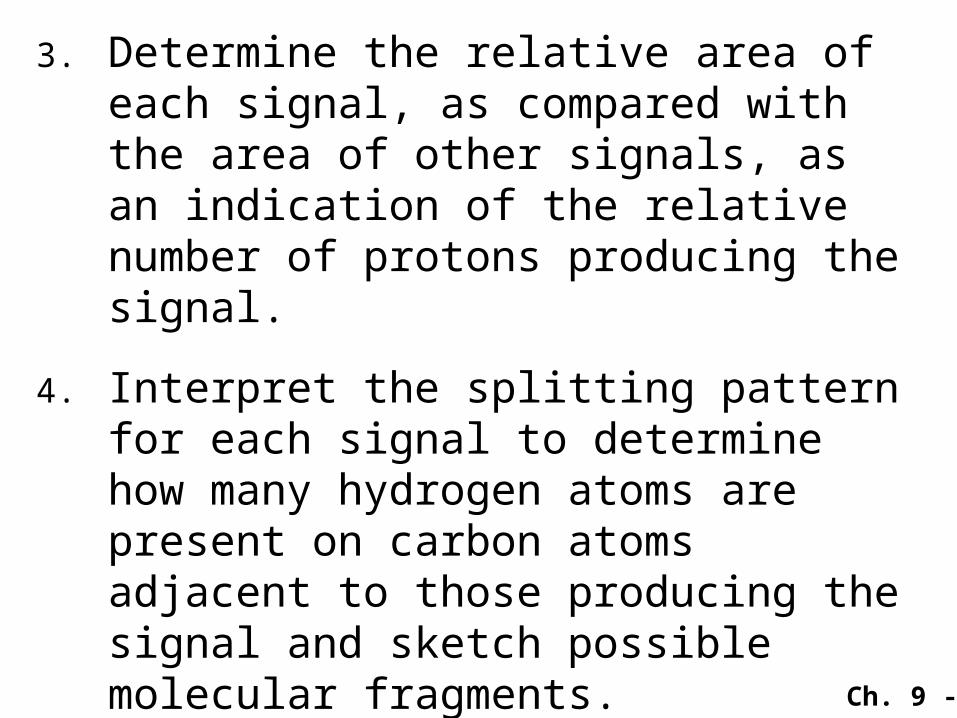
3. Determine the relative area of each signal, as compared with the area of other signals, as an indication of the relative number of protons producing the signal.
4. Interpret the splitting pattern for each signal to determine how many hydrogen atoms are present on carbon atoms adjacent to those producing the signal and sketch possible molecular fragments.
5. Join the fragments to make a molecule in a fashion that is consistent with the data.

Ch. 9 - 33
Example: 1H NMR (300 MHz) of an unknown compound with molecular formula C3H7Br.
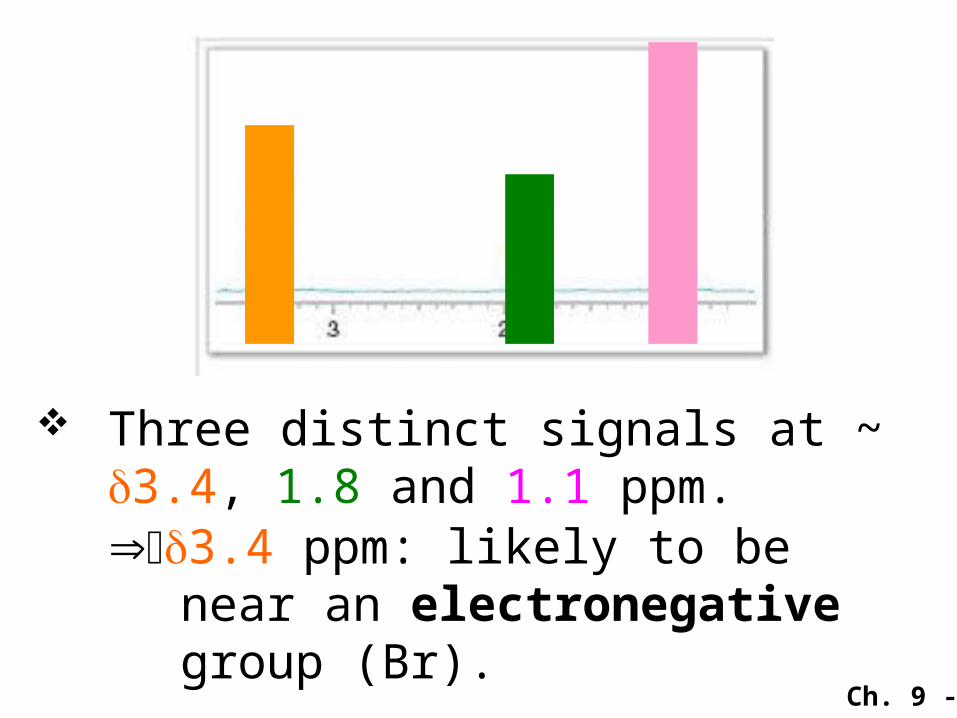
Ch. 9 - 34
Three distinct signals at ~ 3.4, 1.8 and 1.1 ppm.3.4 ppm: likely to be near an
electronegative group (Br).
Ch. 9 - 35
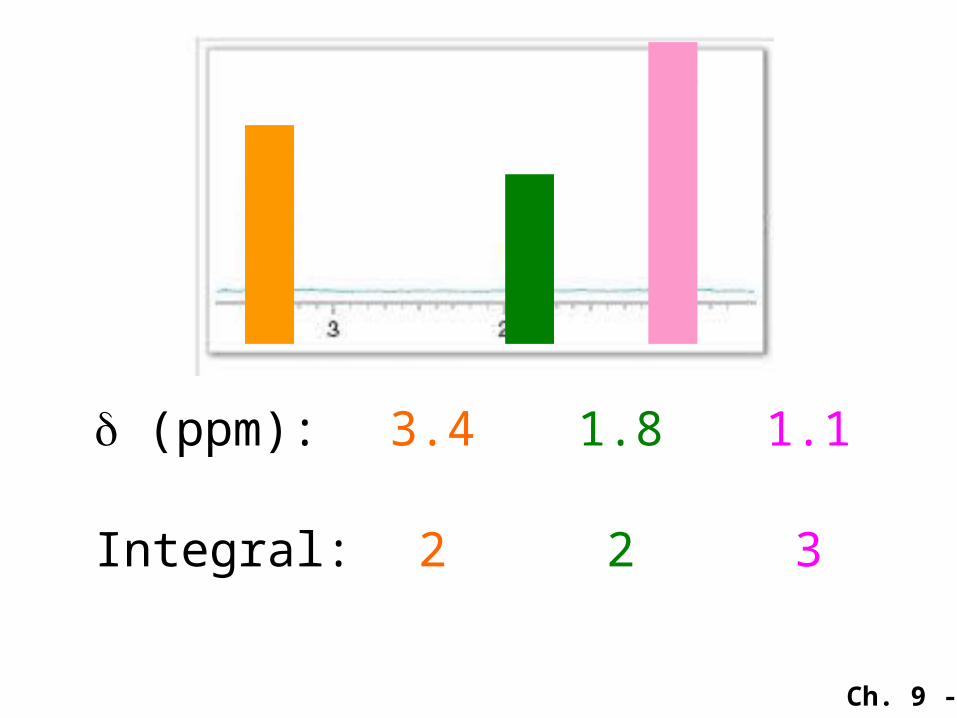
(ppm): 3.4 1.8 1.1
Integral: 2 2 3
Ch. 9 - 36
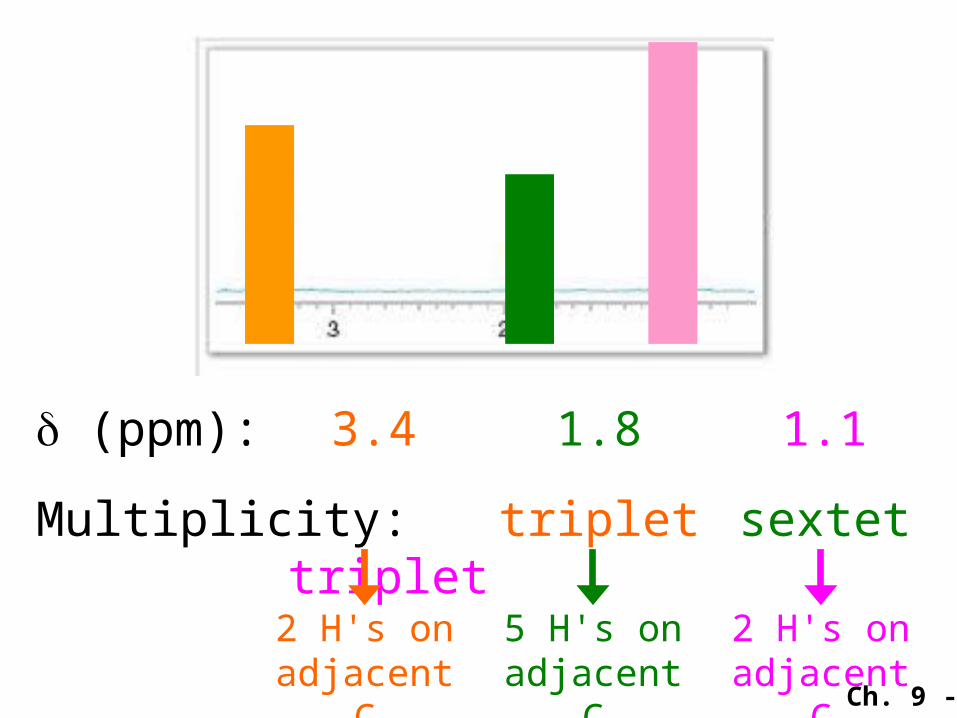
(ppm): 3.4 1.8 1.1
Multiplicity:triplet sextet triplet
2 H's on adjacent C
5 H's on adjacent C
2 H's on adjacent C
Ch. 9 - 37
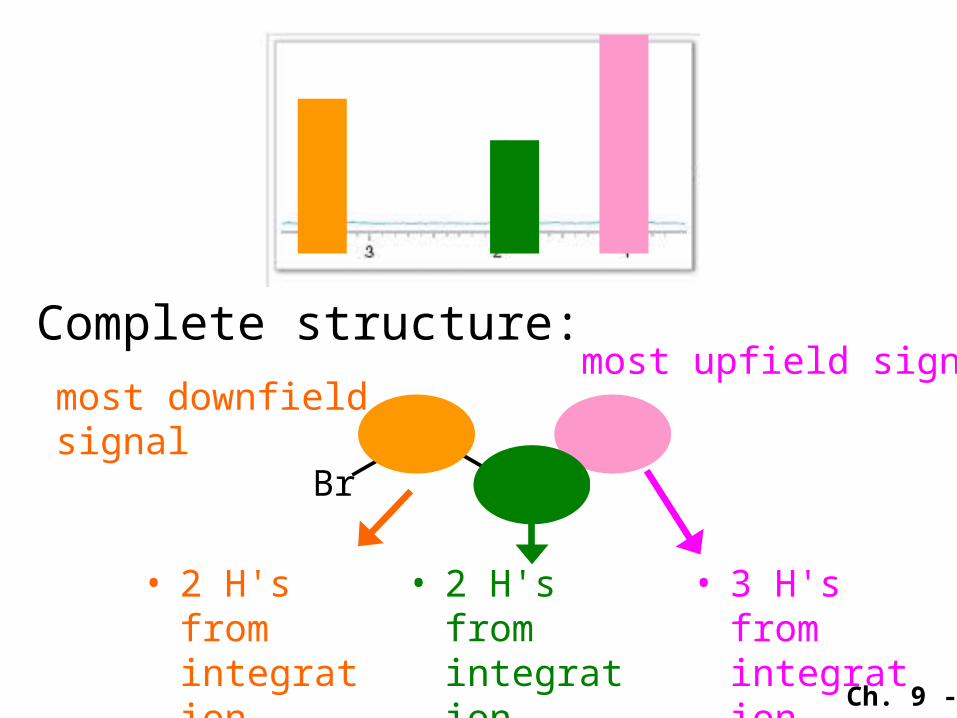
Complete structure:
BrCH2
CH2
CH3
• 2 H's from integration
• triplet
• 2 H's from integration
• sextet
• 3 H's from integration
• triplet
most upfield signalmost downfieldsignal
Ch. 9 - 38
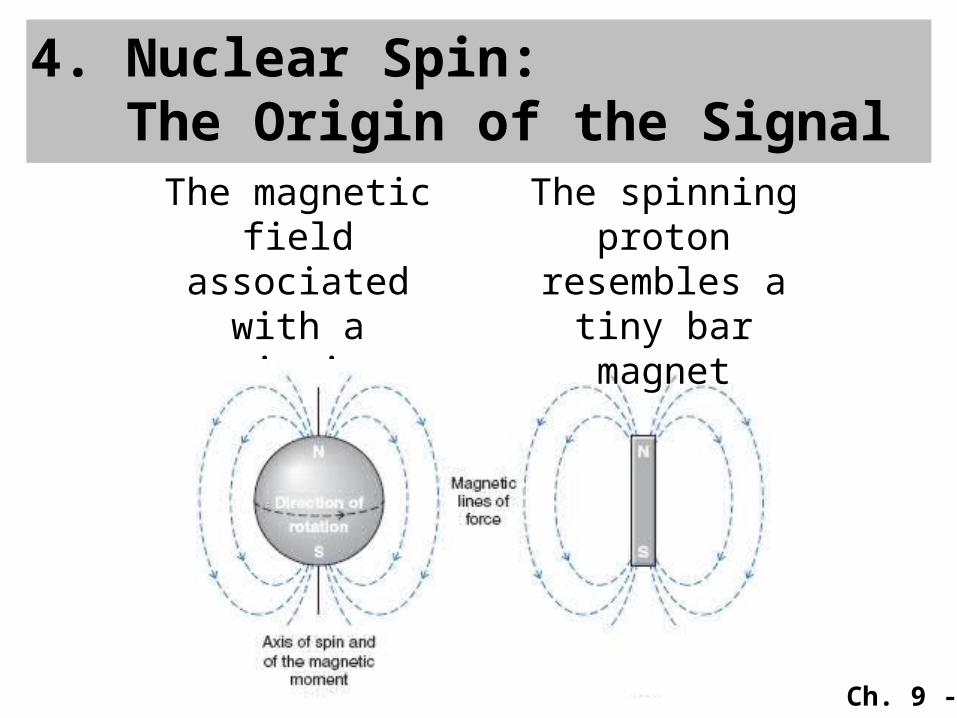
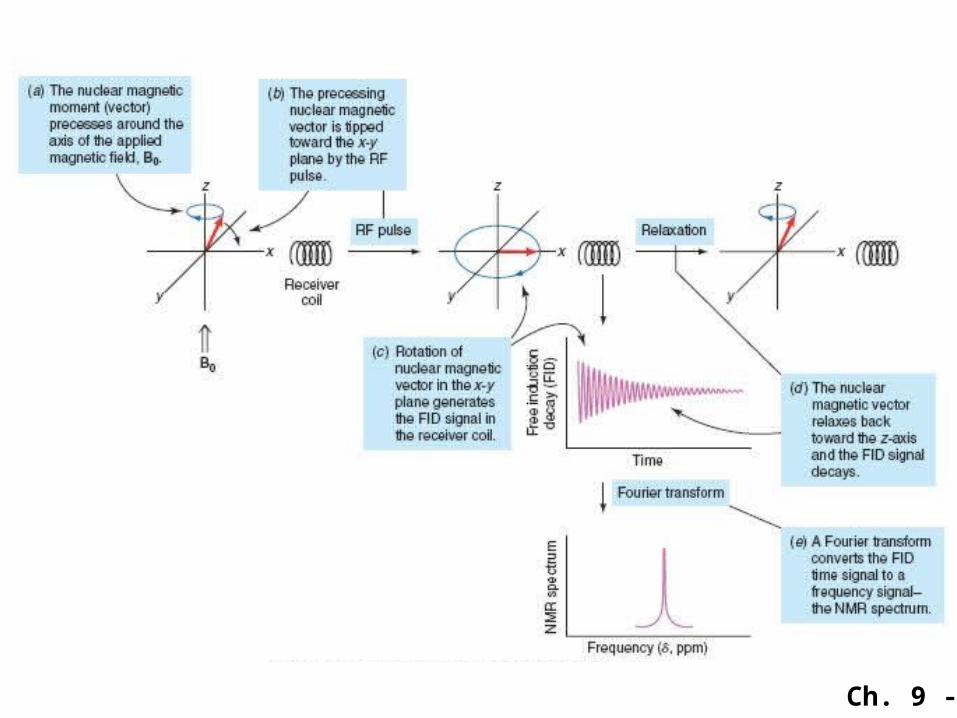
4. Nuclear Spin:The Origin of the Signal
The magnetic field
associated with a
spinning proton
The spinning proton
resembles a tiny bar magnet
Ch. 9 - 39
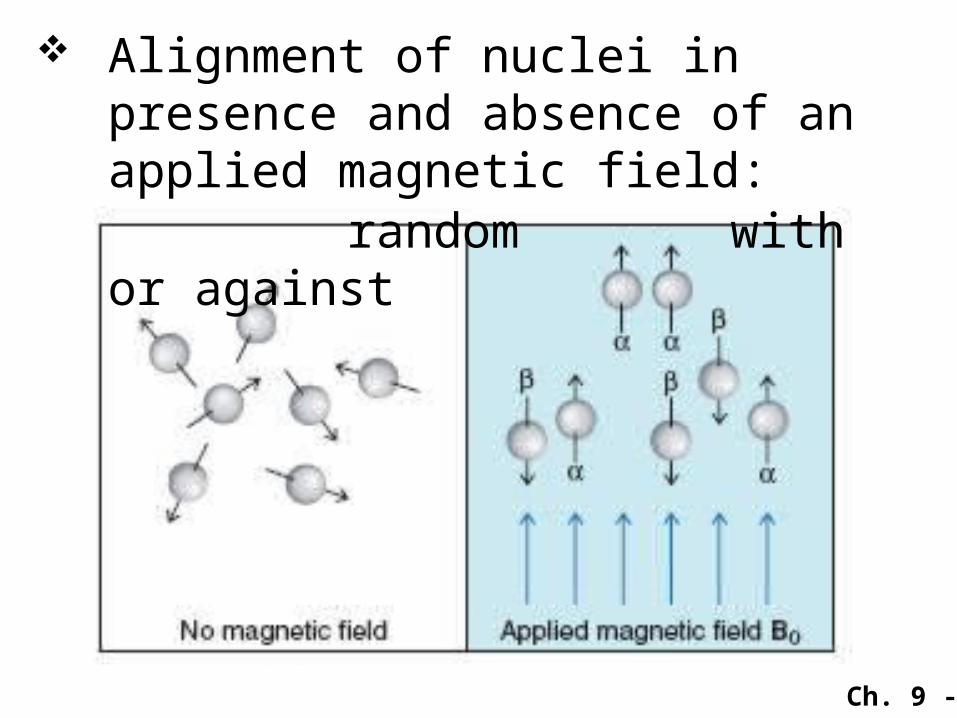
Alignment of nuclei in presence and absence of an applied magnetic field:
random with or against
Ch. 9 - 40
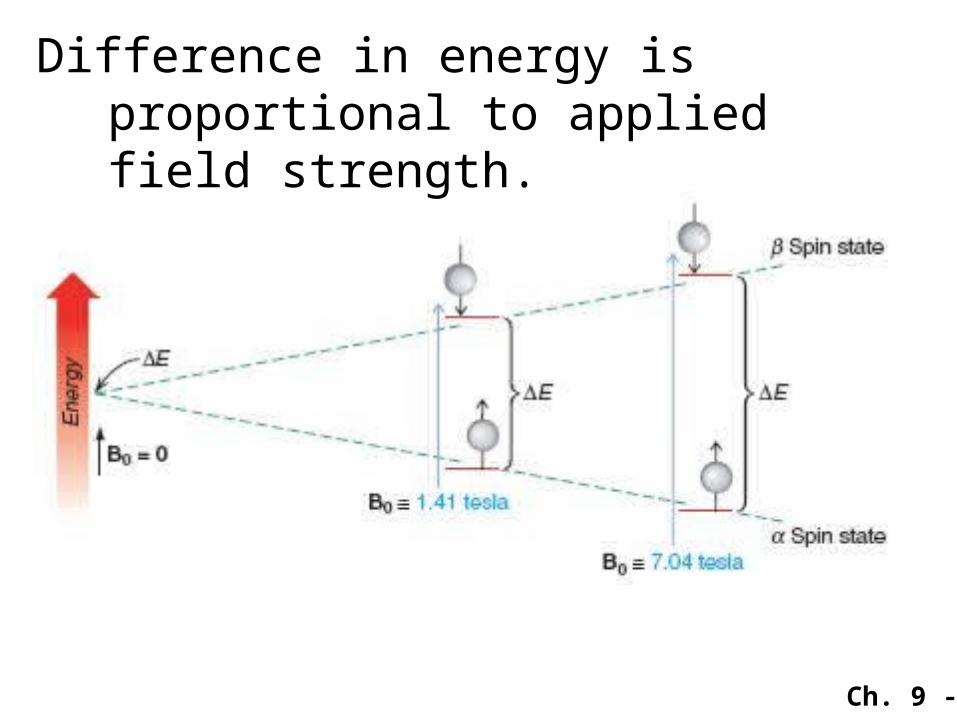
Difference in energy is proportional to applied field strength.
Ch. 9 - 41
Spin quantum number (I)
1H: I = ½ (two spin states: +½ or -½) (similar for 13C, 19F, 31P)
12C, 16O, 32S: I = 0 These nuclei do not give an NMR spectrum
Ch. 9 - 42
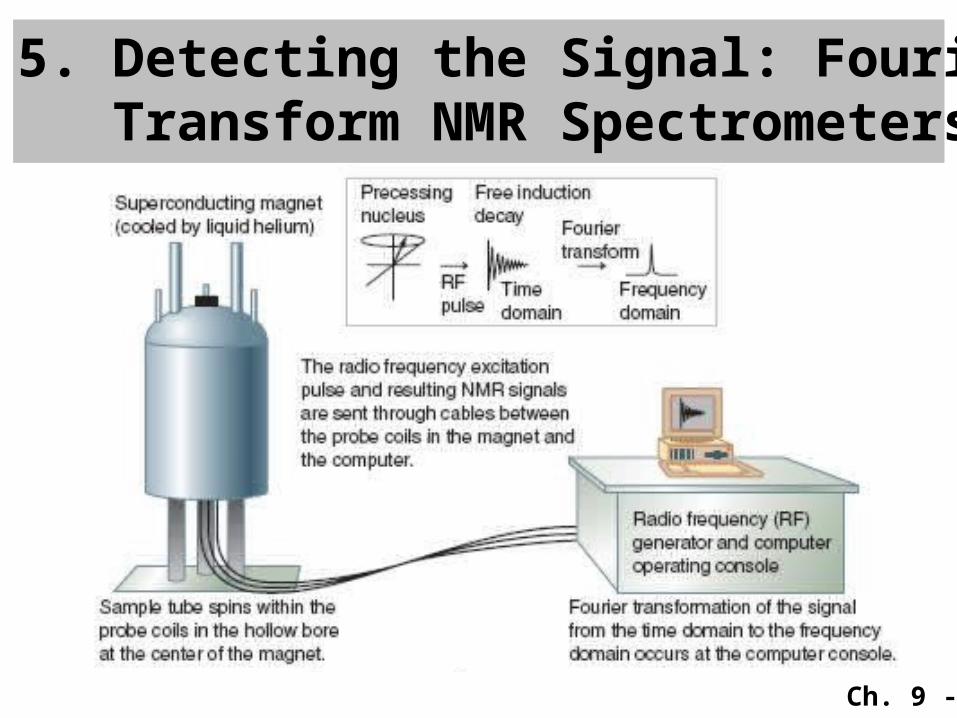
5. Detecting the Signal: Fourier Transform NMR Spectrometers
Ch. 9 - 43
Ch. 9 - 44
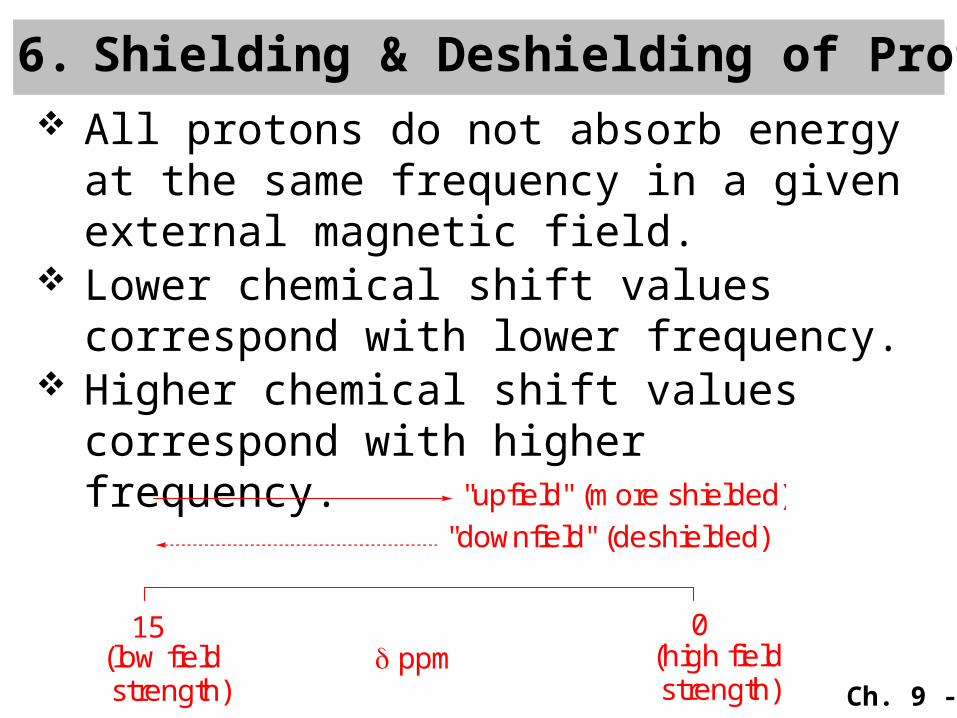
All protons do not absorb energy at the same frequency in a given external magnetic field.
Lower chemical shift values correspond with lower frequency.
Higher chemical shift values correspond with higher frequency.
6. Shielding & Deshielding of Protons
15 0 ppm
"upfield" (more shielded)
"downfield" (deshielded)
(high field strength)
(low field strength)
Ch. 9 - 45
Ch. 9 - 46
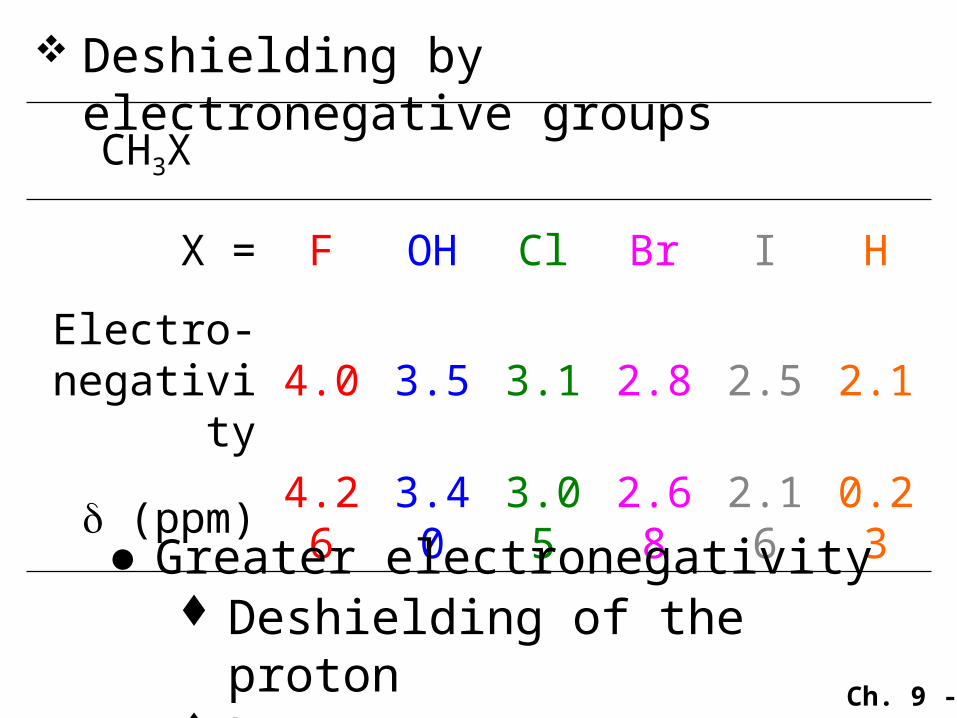
Deshielding by electronegative groupsCH3X
X = F OH Cl Br I H
Electro-negativity
4.0 3.5 3.1 2.8 2.5 2.1
(ppm)4.26
3.40
3.05
2.68
2.16
0.23
●Greater electronegativity Deshielding of the proton Larger

Ch. 9 - 47
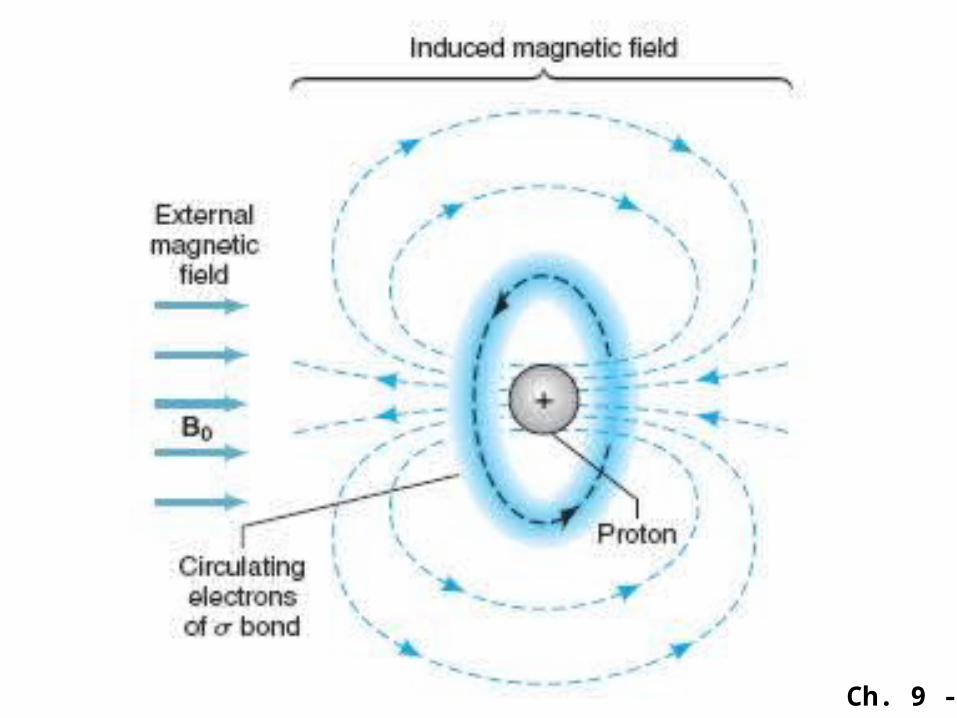
Shielding and deshielding by circulation of electrons:●If we were to consider only the
relative electronegativities of carbon in its three hybridization states, we might expect the following order of protons attached to each type of carbon:
(higher frequency)
sp < sp2 < sp3
(lower frequency)
Ch. 9 - 48
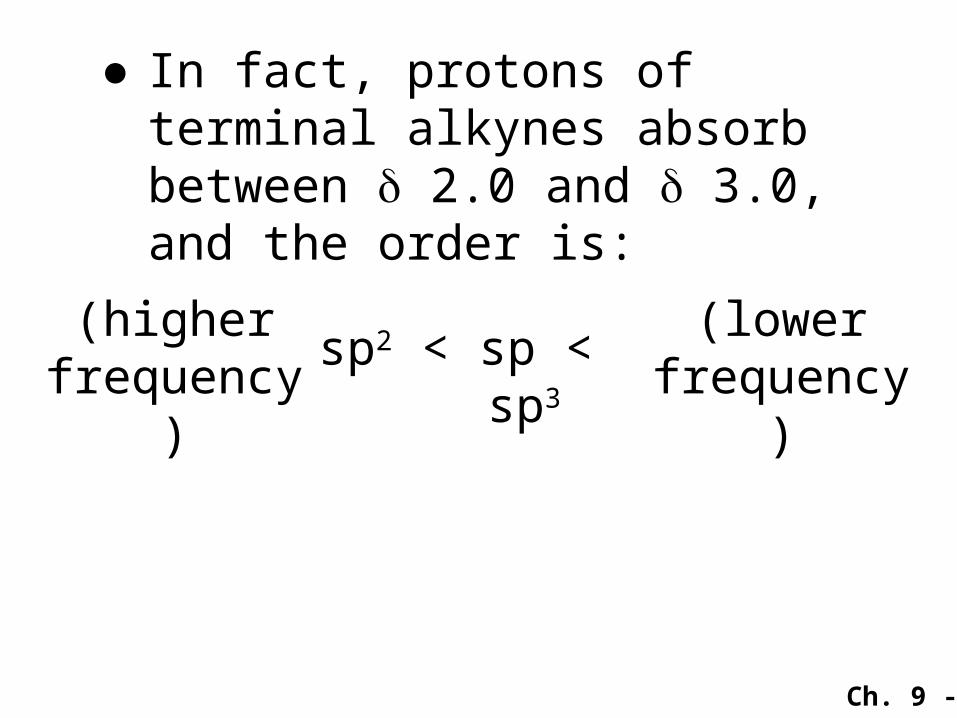
●In fact, protons of terminal alkynes absorb between 2.0 and 3.0, and the order is:
(higher frequency)
sp2 < sp < sp3
(lower frequency)
Ch. 9 - 49
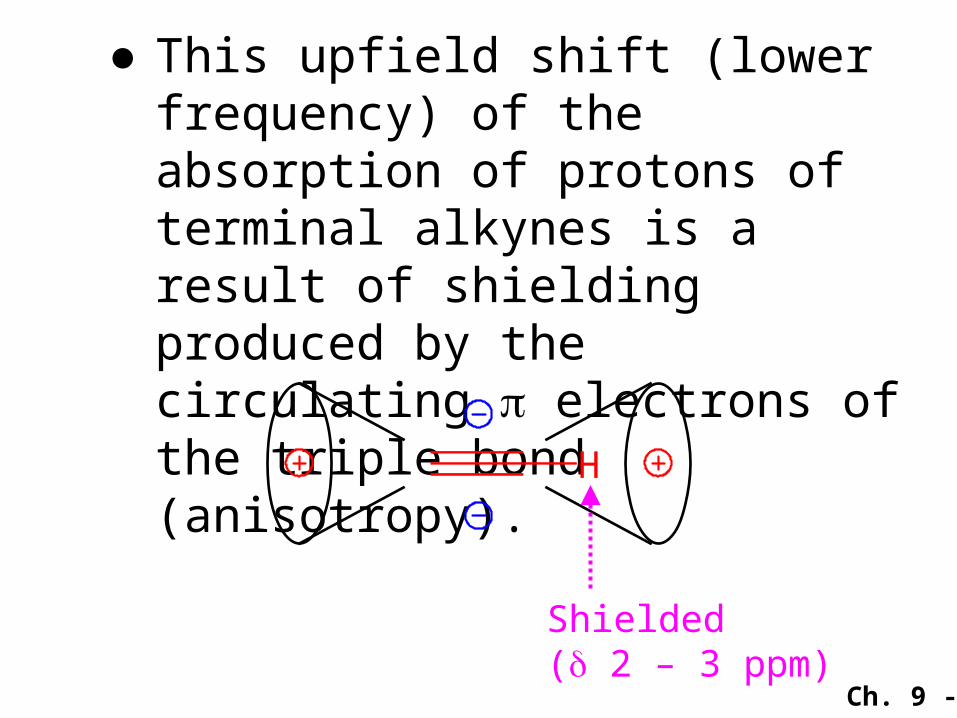
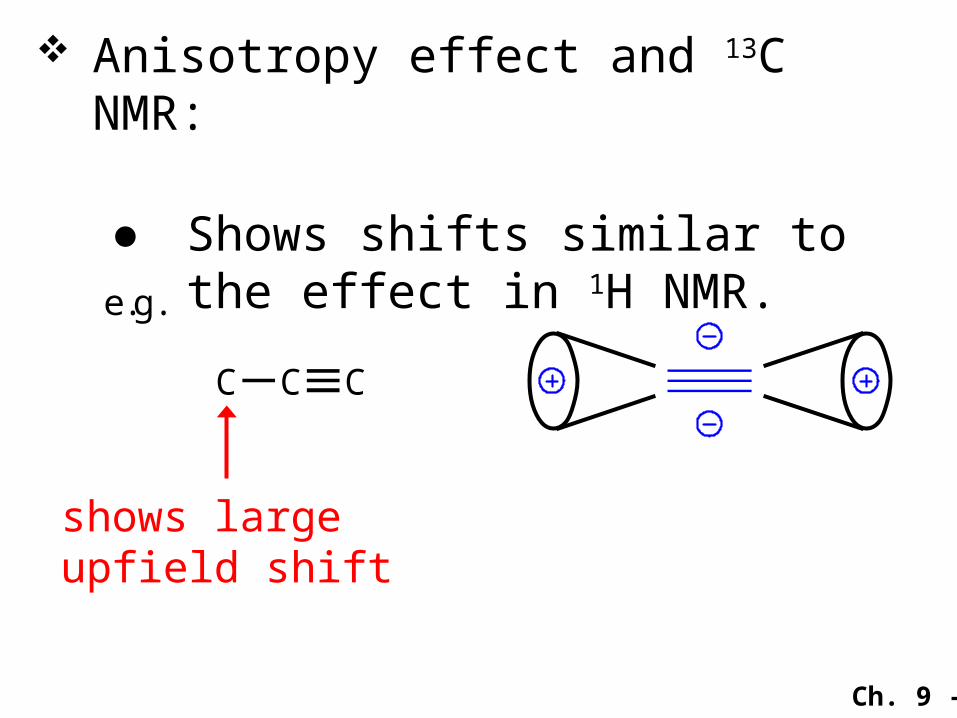
●This upfield shift (lower frequency) of the absorption of protons of terminal alkynes is a result of shielding produced by the circulating electrons of the triple bond (anisotropy).
H
Shielded( 2 – 3 ppm)
Ch. 9 - 50
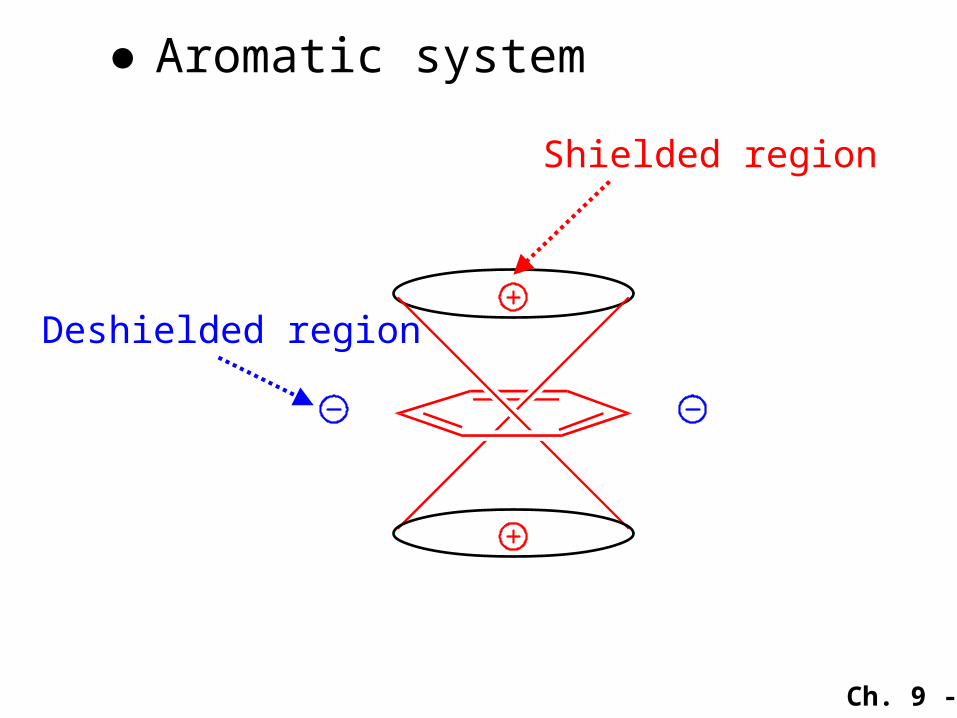
●Aromatic system
Shielded region
Deshielded region
Ch. 9 - 51
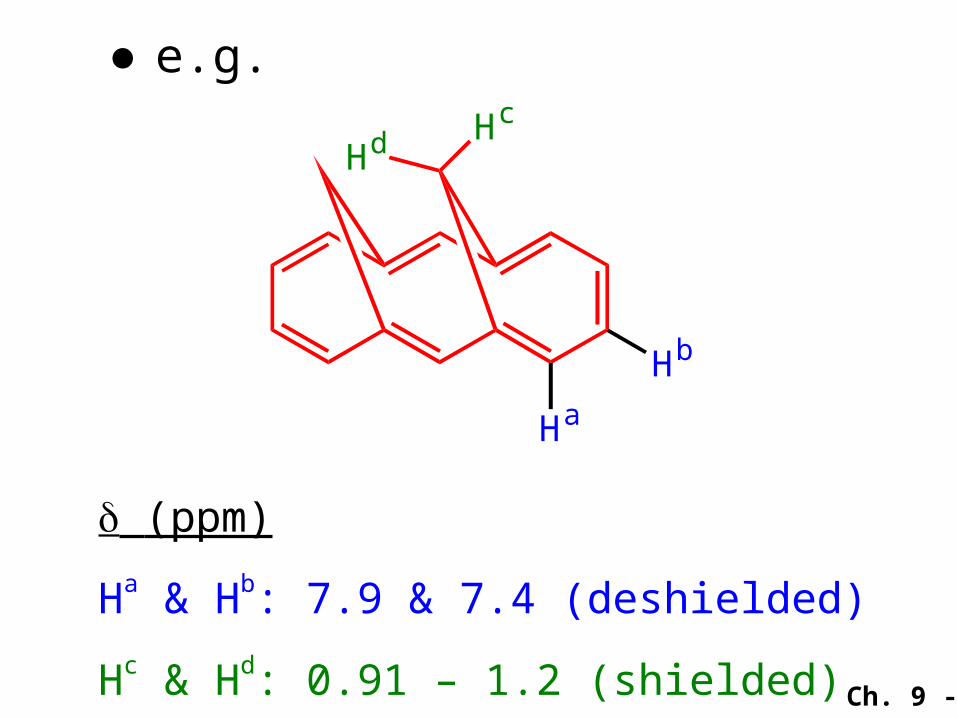
●e.g.
Hd Hc
Hb
Ha
(ppm)
Ha & Hb: 7.9 & 7.4 (deshielded)
Hc & Hd: 0.91 – 1.2 (shielded)
Ch. 9 - 52
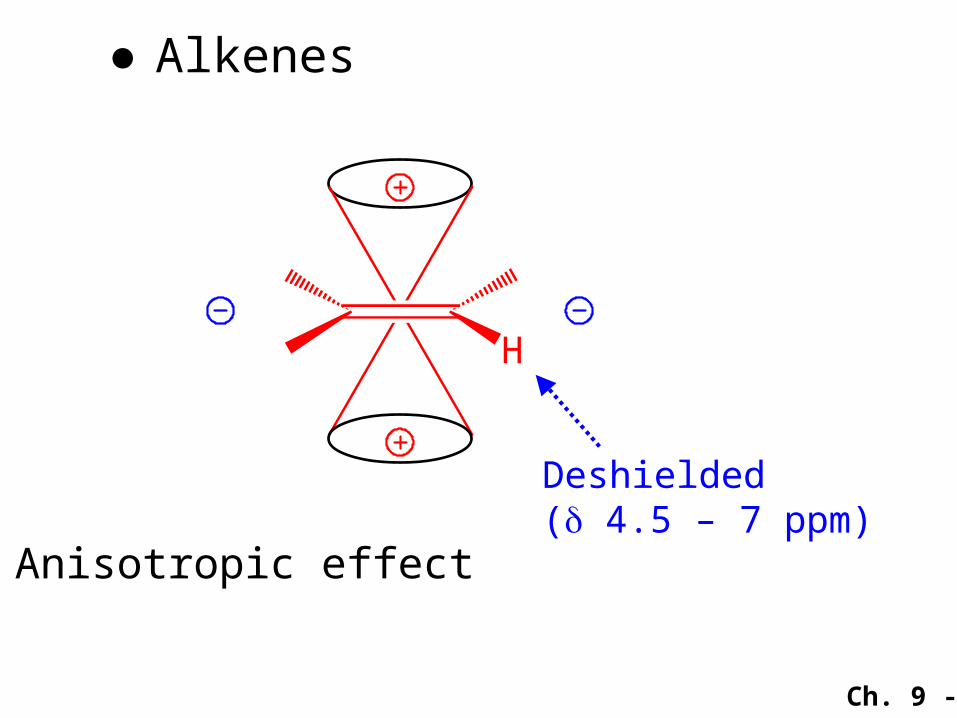
●Alkenes
Deshielded( 4.5 – 7 ppm)
H
Anisotropic effect
Ch. 9 - 53
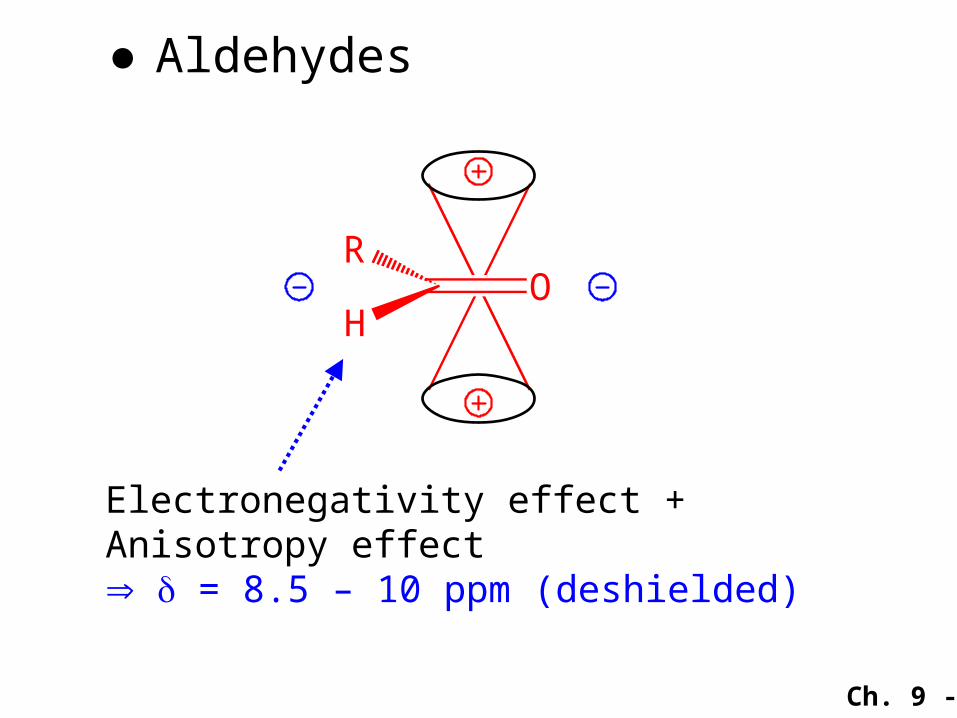
●Aldehydes
OR
H
Electronegativity effect + Anisotropy effect = 8.5 – 10 ppm (deshielded)

Ch. 9 - 54
Reference compound:
● TMS = tetramethylsilaneas a reference standard (0 ppm).
● Reasons for the choice of TMS as reference: Resonance position at higher
field than other organic compounds.
Unreactive and stable, not toxic.
Volatile and easily removed(B.P. = 28oC).
Me
Si MeMe
Me
7. The Chemical Shift

Ch. 9 - 55
7A.7A. PPM and the PPM and the Scale Scale The chemical shift of a proton,
when expressed in hertz (Hz), is proportional to the strength of the external magnetic field.
Since spectrometers with different magnetic field strengths are commonly used, it is desirable to express chemical shifts in a form that is independent of the strength of the external field.
Ch. 9 - 56
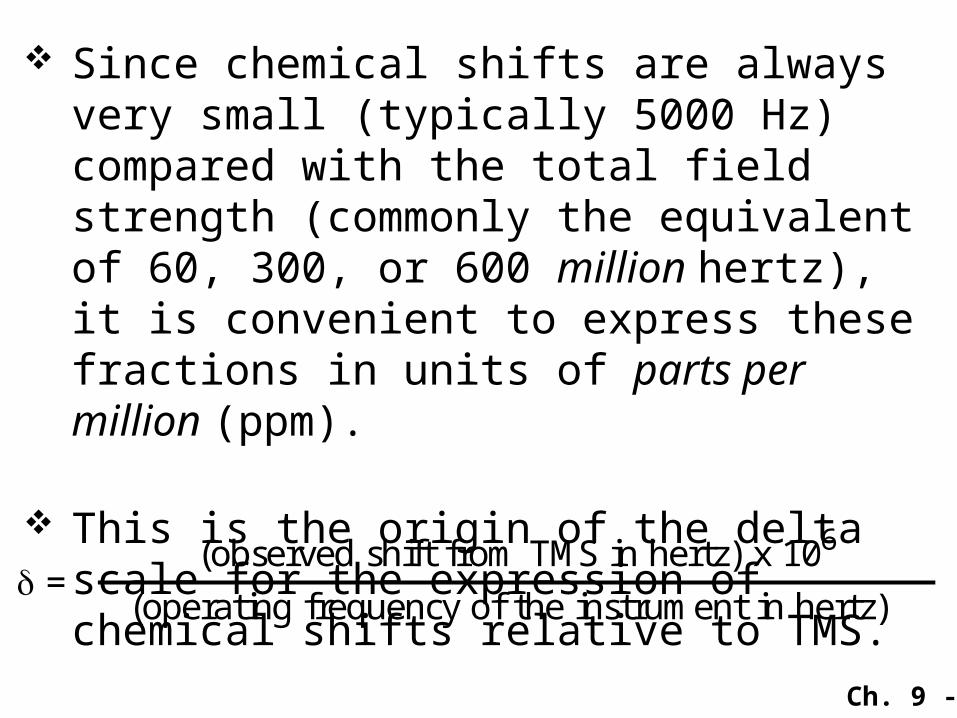
Since chemical shifts are always very small (typically 5000 Hz) compared with the total field strength (commonly the equivalent of 60, 300, or 600 million hertz), it is convenient to express these fractions in units of parts per million (ppm).
This is the origin of the delta scale for the expression of chemical shifts relative to TMS. =
(observed shift from TMS in hertz) x 106
(operating frequency of the instrument in hertz)
Ch. 9 - 57
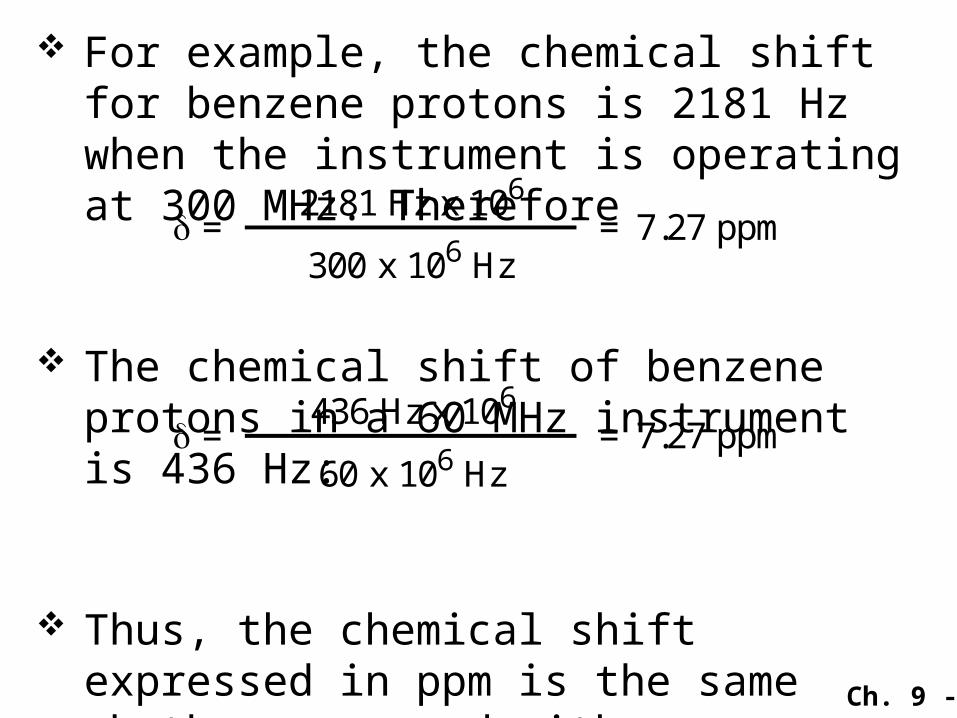
For example, the chemical shift for benzene protons is 2181 Hz when the instrument is operating at 300 MHz. Therefore
The chemical shift of benzene protons in a 60 MHz instrument is 436 Hz:
Thus, the chemical shift expressed in ppm is the same whether measured with an instrument operating at 300 or 60 MHz (or any other field strength).
=2181 Hz x 106
300 x 106 Hz= 7.27 ppm
=436 Hz x 106
60 x 106 Hz= 7.27 ppm
Ch. 9 - 58
Two or more protons that are in identical environments have the same chemical shift and, therefore, give only one 1H NMR signal.
Chemically equivalent protons are chemical shift equivalent in 1H NMR spectra.
8. Chemical Shift Equivalent and Nonequivalent Protons
Ch. 9 - 59
8A.8A. Homotopic and Heterotopic AtomsHomotopic and Heterotopic Atoms If replacing the hydrogens by a
different atom gives the same compound, the hydrogens are said to be homotopic.
Homotopic hydrogens have identical environments and will have the same chemical shift. They are said to be chemical shift equivalent.
Ch. 9 - 60
H
C CH
H
H
H
H
Ethane
H
C CH
H
H
H
Br
H
C CH
H
Br
H
H
H
C CH
H
H
Br
HH
CC H
H
H
Br
H
H
CC H
H
Br
H
H
H
CC H
H
H
H
Br
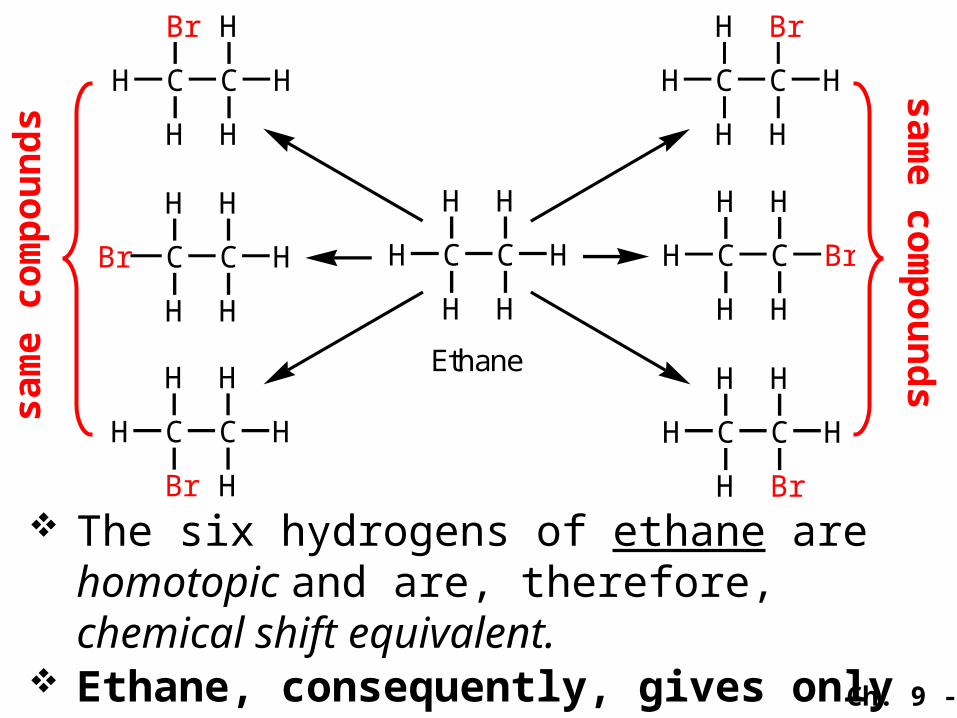
The six hydrogens of ethane are homotopic and are, therefore, chemical shift equivalent.
Ethane, consequently, gives only one signal in its 1H NMR spectrum.
sam
e
com
pou
nd
ssam
e
com
pou
nd
s
Ch. 9 - 61
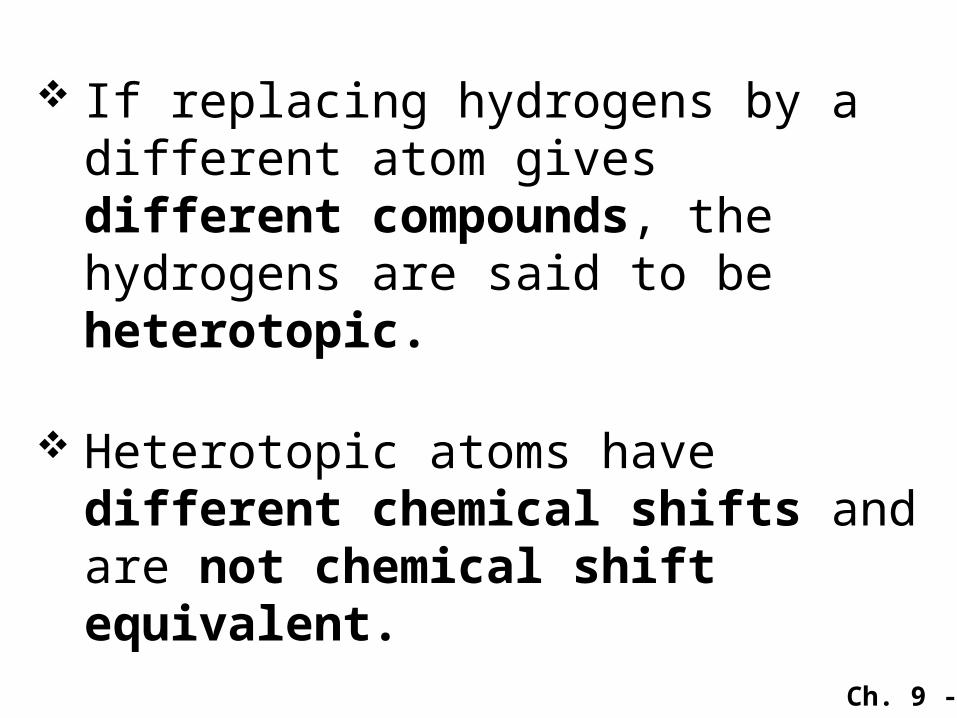
If replacing hydrogens by a different atom gives different compounds, the hydrogens are said to be heterotopic.
Heterotopic atoms have different chemical shifts and are not chemical shift equivalent.
Ch. 9 - 62
H
C CH
H
H
H
Br
H
C CH
H
H
Cl
Br
Br
CC
H
H
H
Cl
H
Br
CC H
H
H
Cl
H
Br
CC H
H
Cl
H
H
Br
CC H
H
H
H
Cl
These 2 H’s are also homotopic to each other
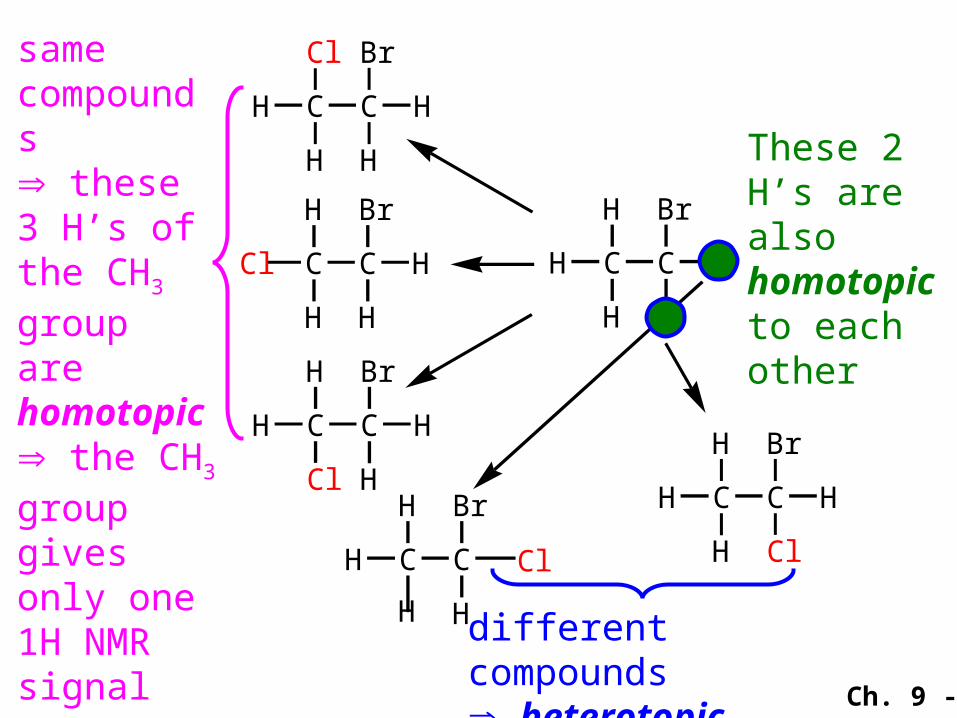
different compounds heterotopic
same compounds these 3 H’s of the CH3 group are homotopic the CH3 group gives only one 1H NMR signal
Ch. 9 - 63
H
C CH
H
H
H
Br
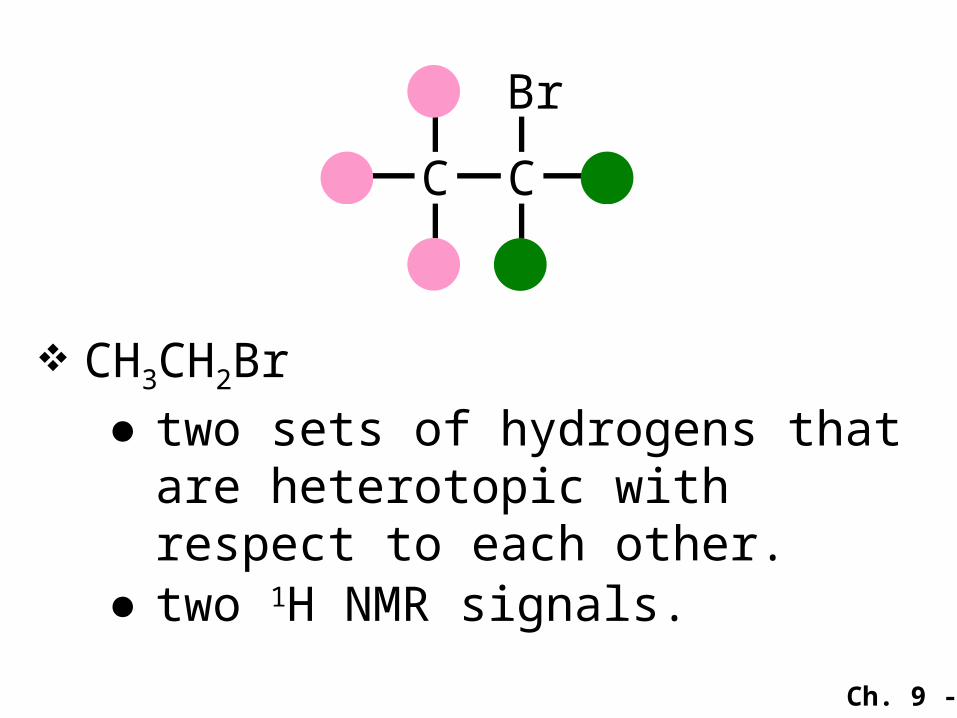
CH3CH2Br●two sets of hydrogens that are
heterotopic with respect to each other.
●two 1H NMR signals.
Ch. 9 - 64
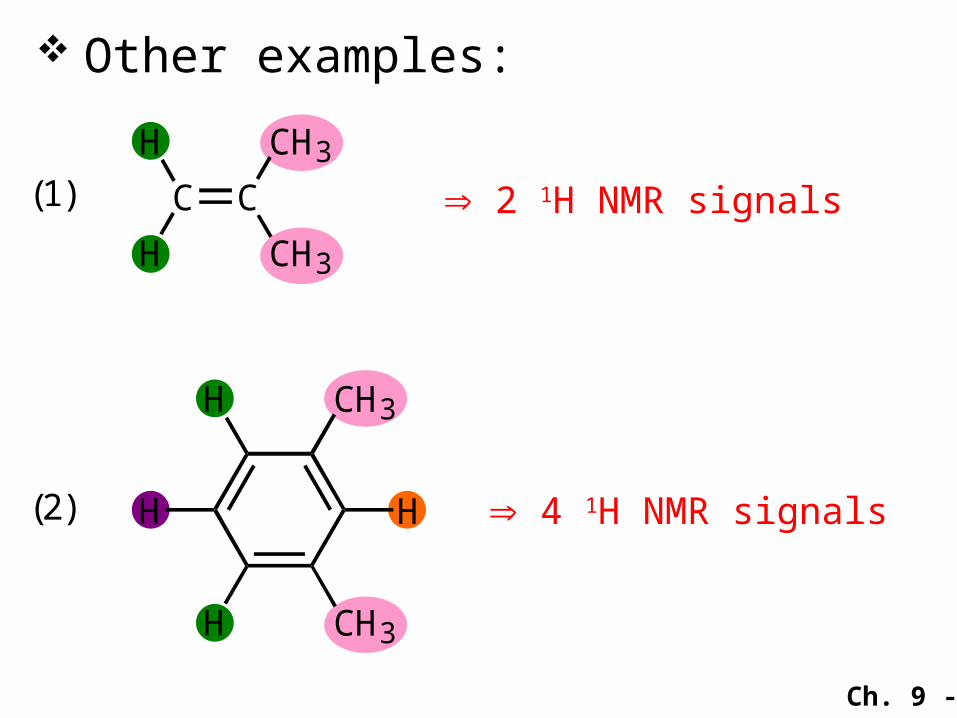
Other examples:
(1) C C
H
H
CH3
CH3
2 1H NMR signals
(2) H
CH3H
H
H CH3
4 1H NMR signals
Ch. 9 - 65
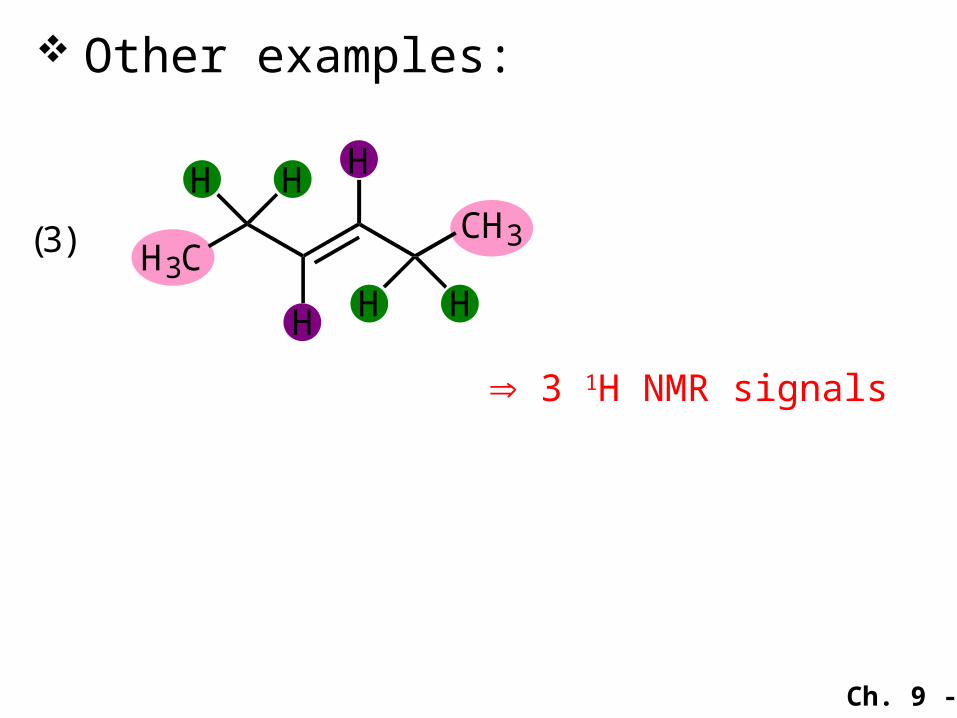
Other examples:
(3) H3CCH3
H H
H
H
H H
3 1H NMR signals
Ch. 9 - 66
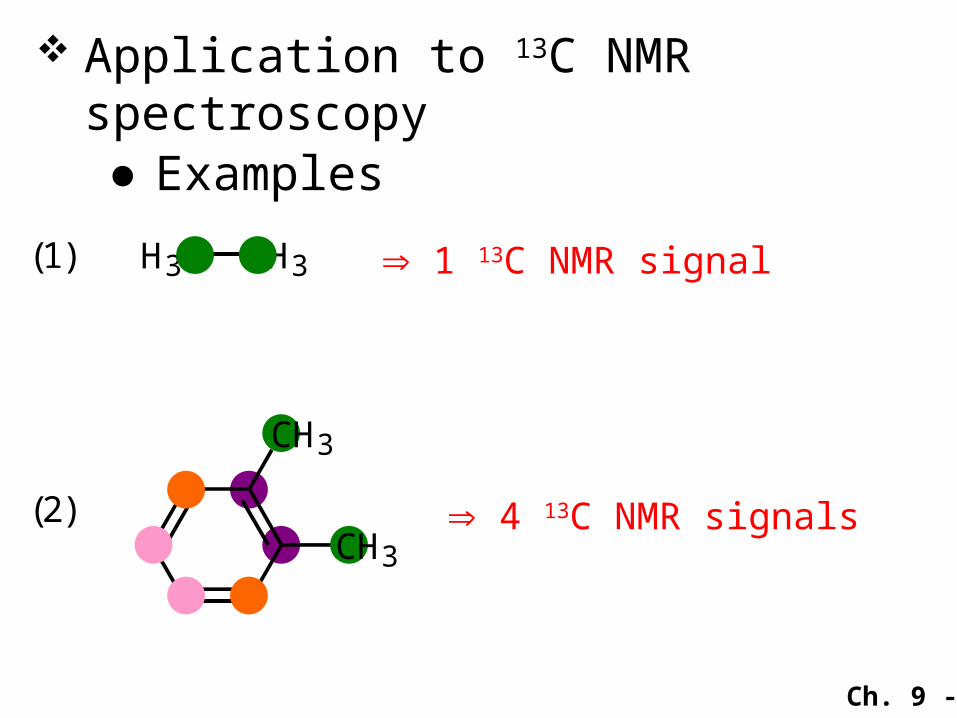
Application to 13C NMR spectroscopy●Examples
(1) H3C CH3 1 13C NMR signal
(2)
CH3
CH3 4 13C NMR signals
Ch. 9 - 67
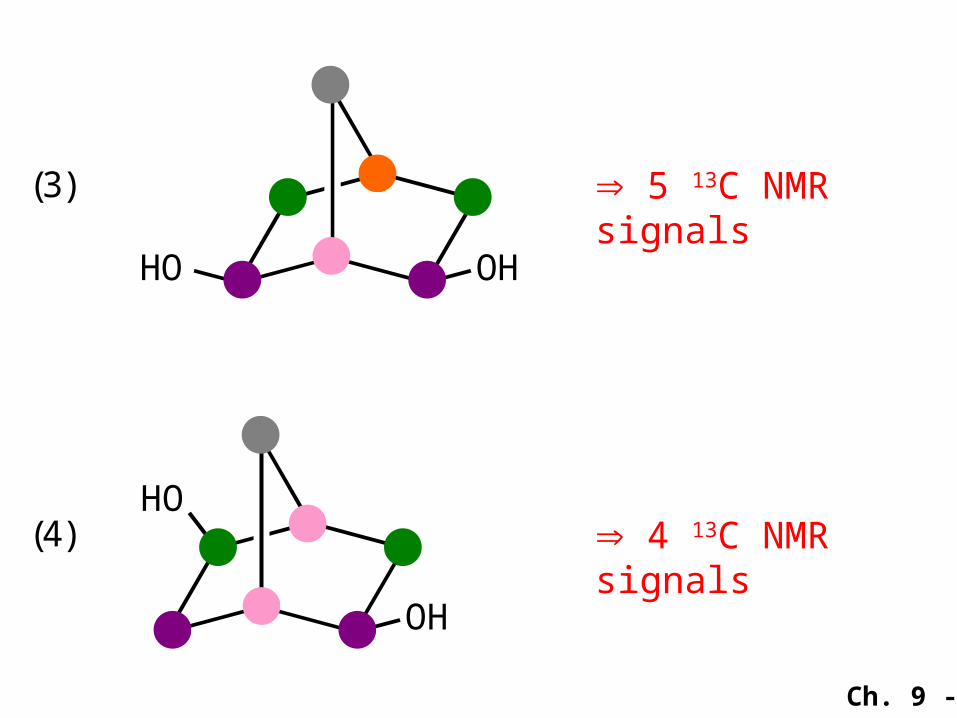
(3)
OHHO
5 13C NMR signals
(4)
OH
HO 4 13C NMR signals
Ch. 9 - 68
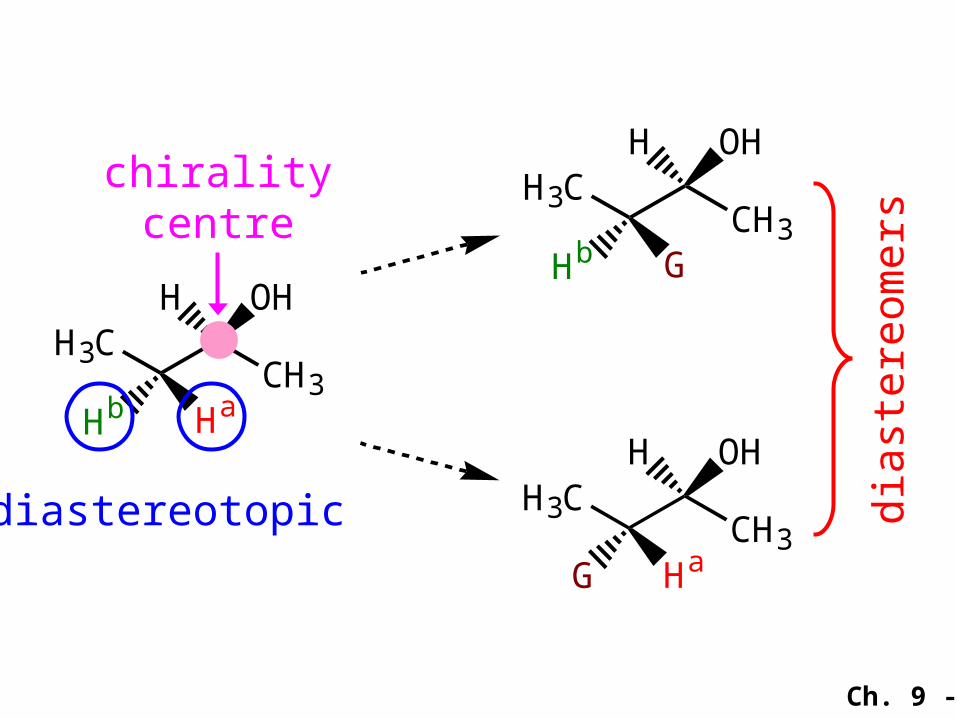
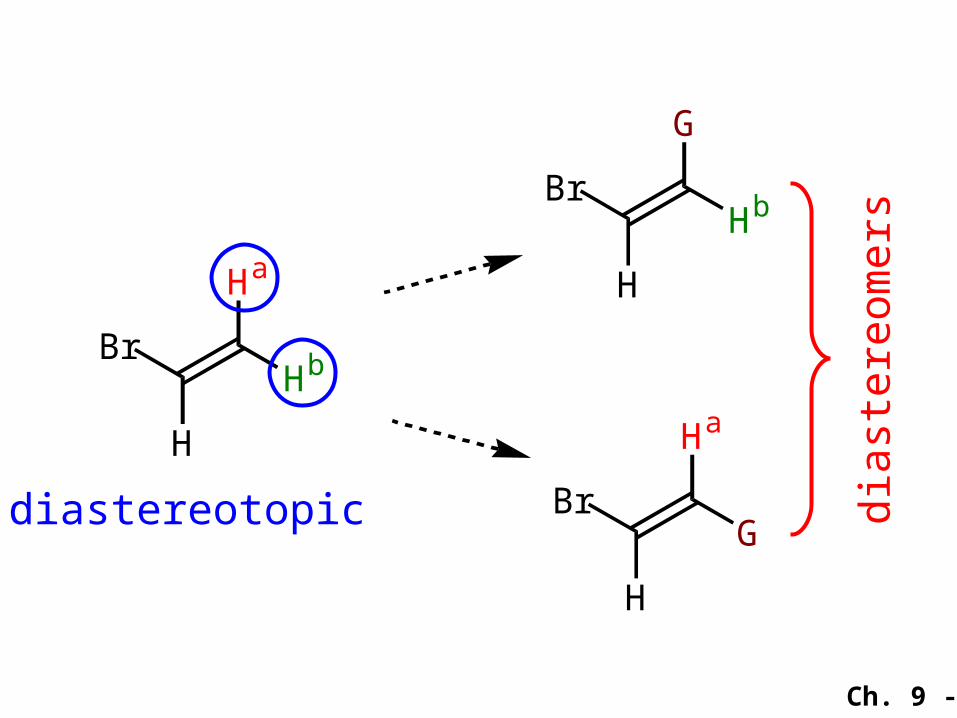
8B.8B. Enantiotopic and Diastereotopic Enantiotopic and Diastereotopic Hydrogen AtomsHydrogen Atoms
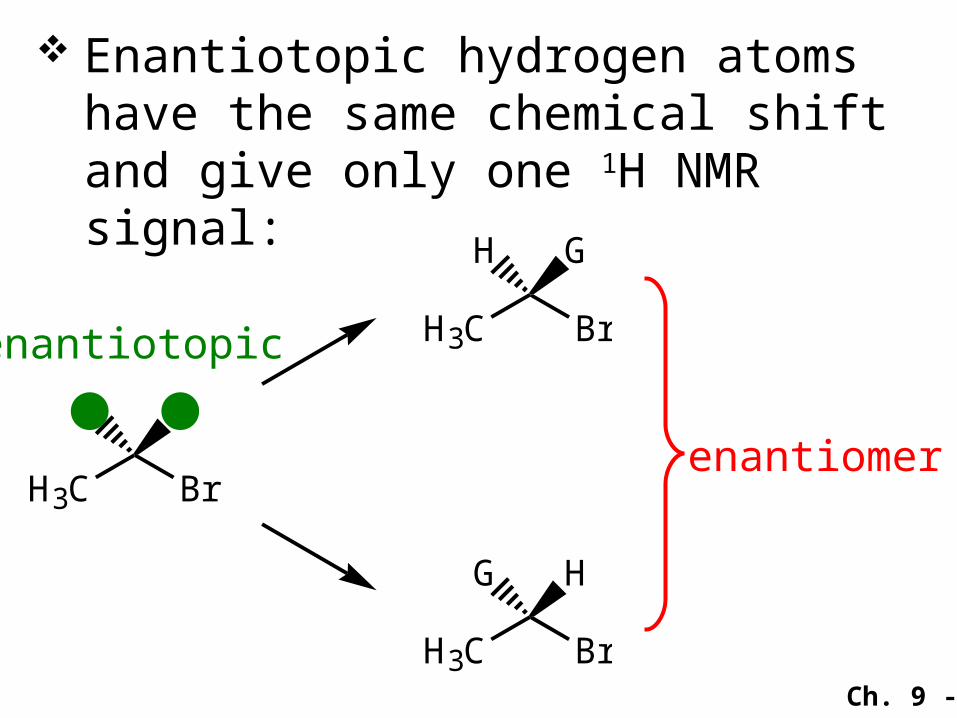
If replacement of each of two hydrogen atoms by the same group yields compounds that are enantiomers, the two hydrogen atoms are said to be enantiotopic.
Ch. 9 - 69
Enantiotopic hydrogen atoms have the same chemical shift and give only one 1H NMR signal:
H3C Br
H H
H3C Br
H G
H3C Br
G H
enantiomer
enantiotopic
Ch. 9 - 70
CH3
H OHH3C
HaHb
dia
stere
om
ers
diastereotopic
CH3
H OHH3C
GHb
CH3
H OHH3C
HaG
chiralitycentre
Ch. 9 - 71
HbBr
Ha
H
dia
stere
om
ers
diastereotopic
HbBr
G
H
GBr
Ha
H
Ch. 9 - 72
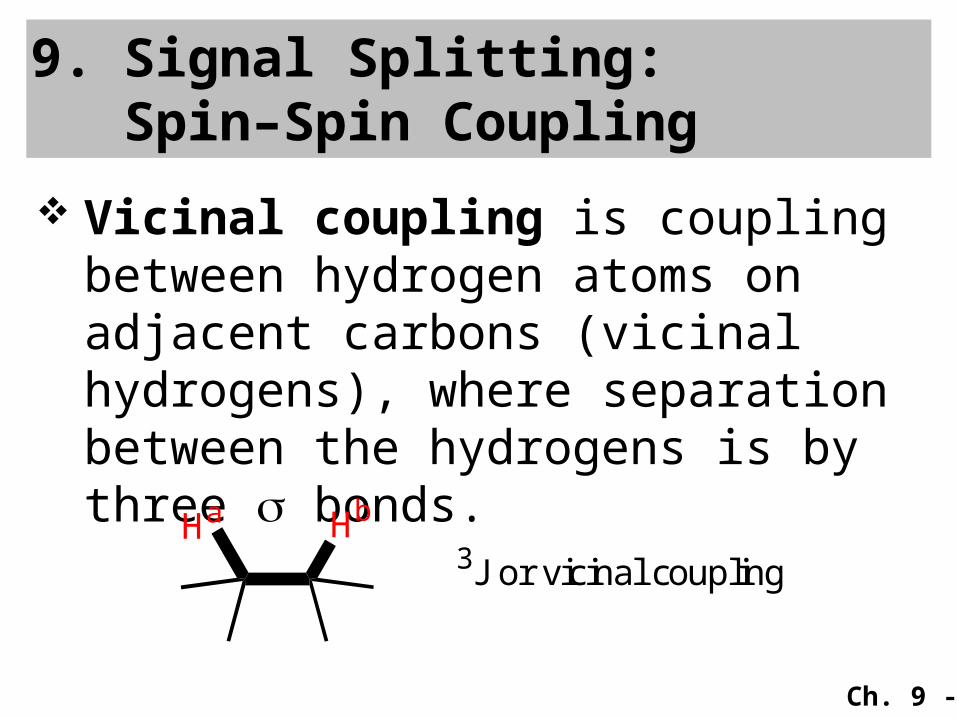
Vicinal coupling is coupling between hydrogen atoms on adjacent carbons (vicinal hydrogens), where separation between the hydrogens is by three bonds.
9. Signal Splitting:Spin–Spin Coupling
Ha Hb
3J or vicinal coupling
Ch. 9 - 73
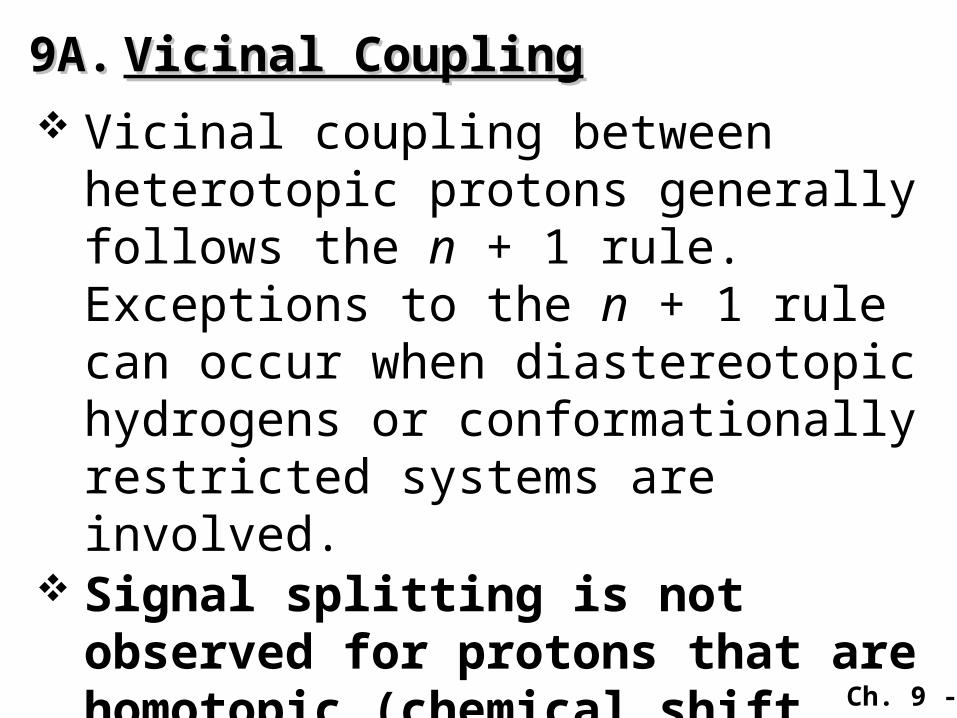
9A.9A. Vicinal CouplingVicinal Coupling Vicinal coupling between
heterotopic protons generally follows the n + 1 rule. Exceptions to the n + 1 rule can occur when diastereotopic hydrogens or conformationally restricted systems are involved.
Signal splitting is not observed for protons that are homotopic (chemical shift equivalent) or enantiotopic.
Ch. 9 - 74
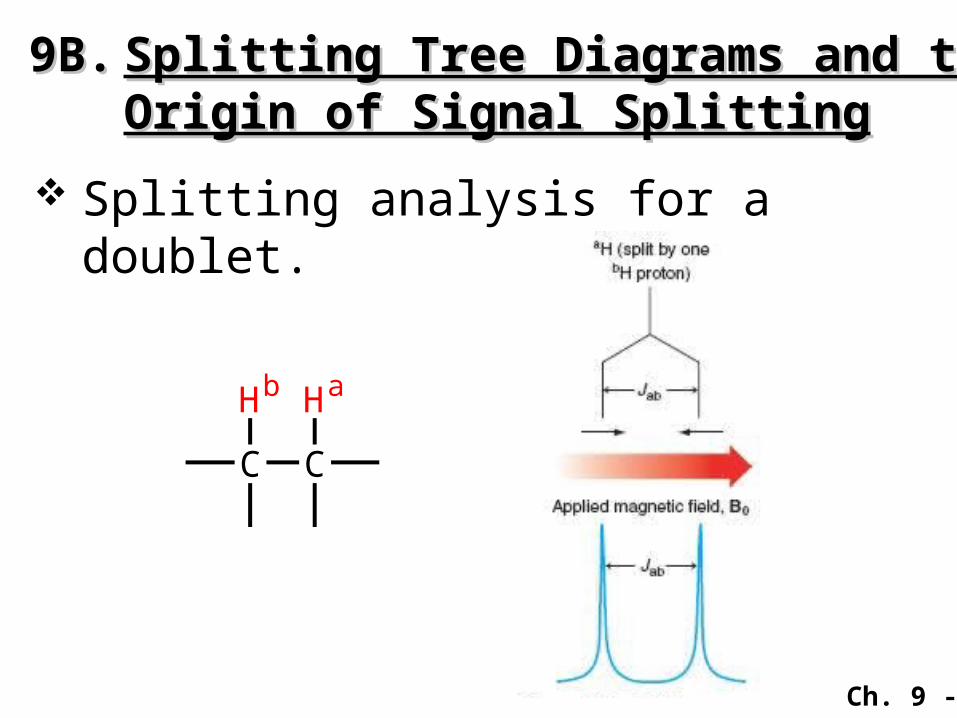
9B.9B. Splitting Tree Diagrams and the Splitting Tree Diagrams and the Origin of Signal SplittingOrigin of Signal Splitting
Splitting analysis for a doublet.
C C
HaHb
Ch. 9 - 75
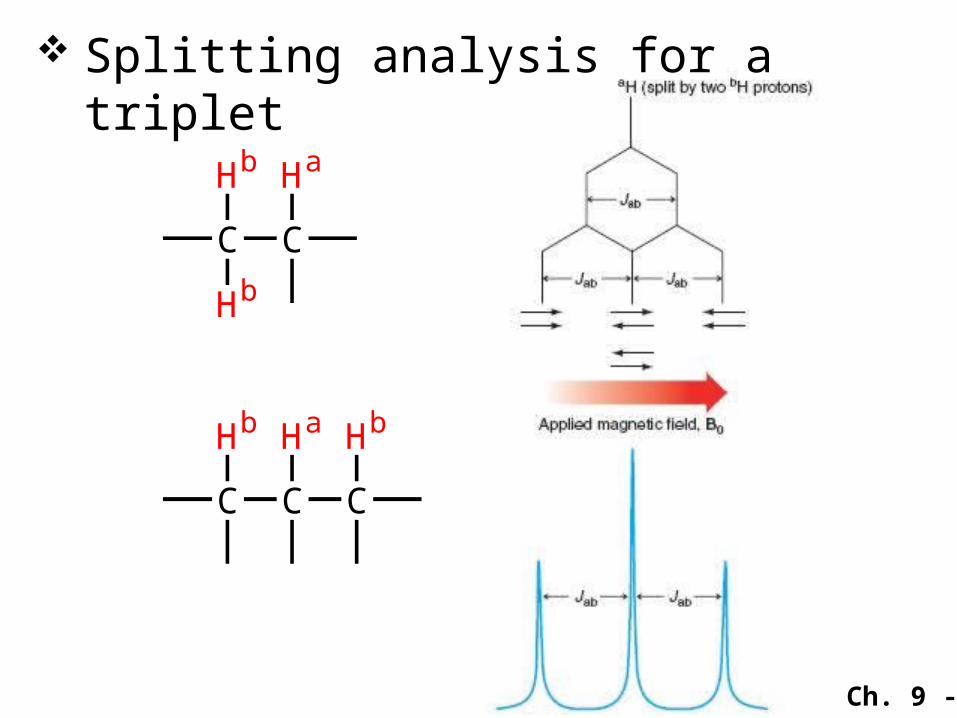
Splitting analysis for a triplet
C
Hb
C
HaHb
C C C
HaHb Hb
Ch. 9 - 76
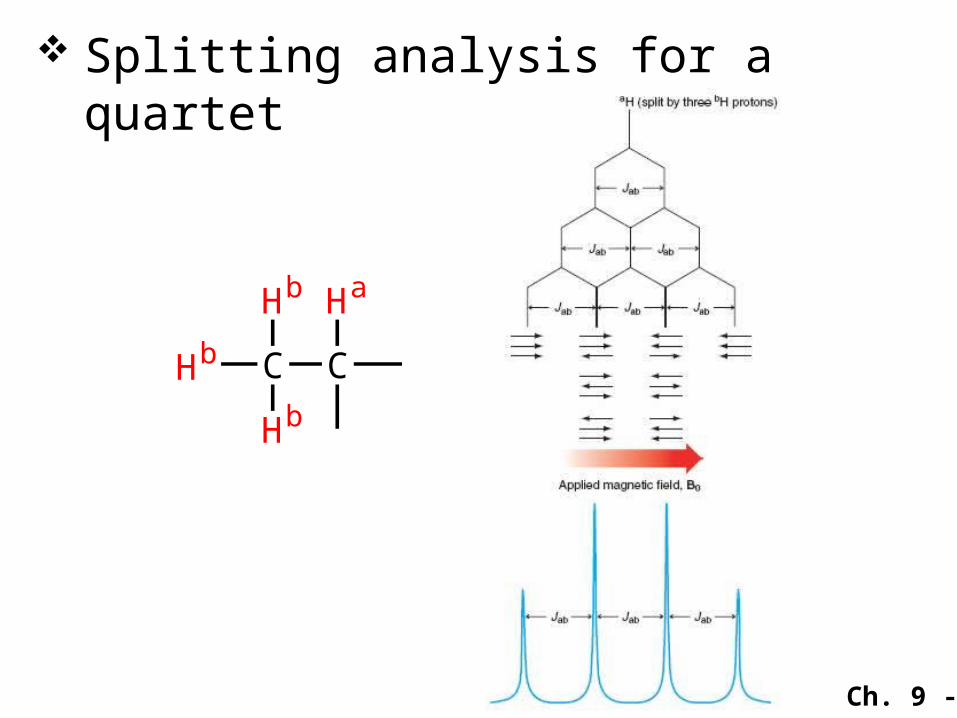
Splitting analysis for a quartet
Hb C
Hb
C
HaHb
Ch. 9 - 77
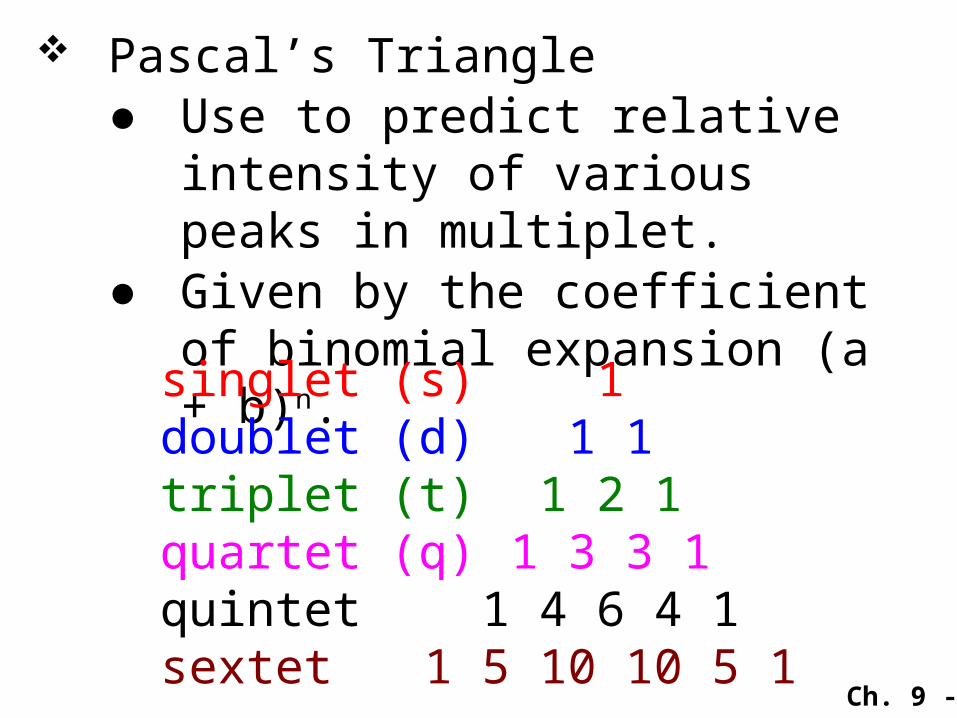
Pascal’s Triangle● Use to predict relative
intensity of various peaks in multiplet.
● Given by the coefficient of binomial expansion (a + b)n.singlet (s) 1doublet (d) 1 1triplet (t) 1 2 1quartet (q) 1 3 3 1quintet 1 4 6 4 1sextet 1 5 10 10 5 1

Ch. 9 - 78
9C.9C. Coupling Constants Coupling Constants –– Recognizing Recognizing Splitting PatternsSplitting Patterns
X C
Ha
C
Hb
Hb
HbHa
Ch. 9 - 79
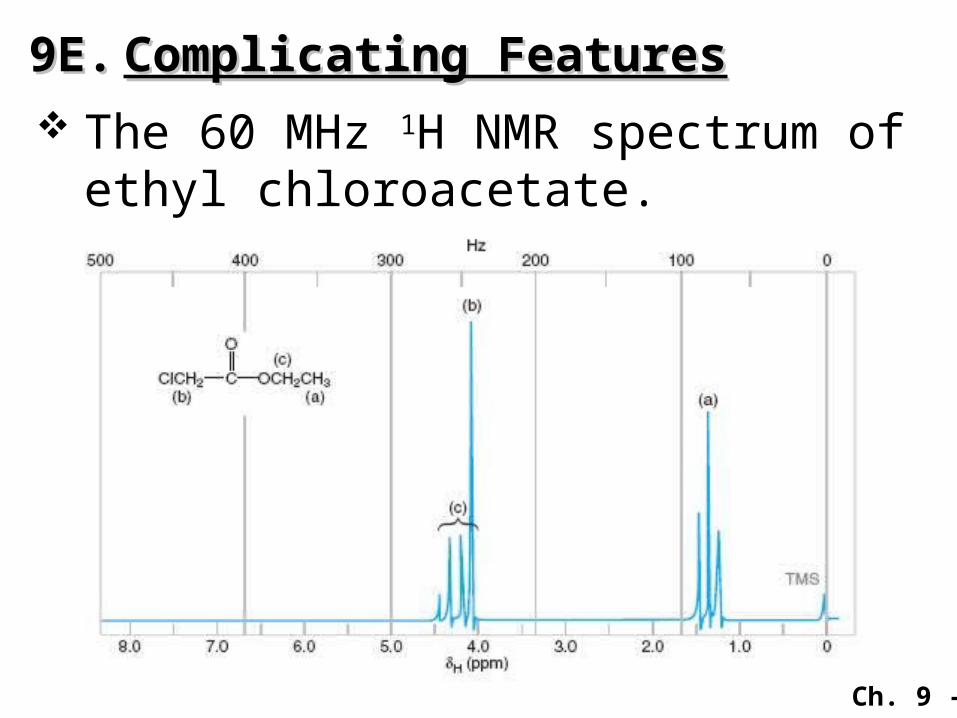
9E.9E. Complicating FeaturesComplicating Features The 60 MHz 1H NMR spectrum of
ethyl chloroacetate.
Ch. 9 - 80
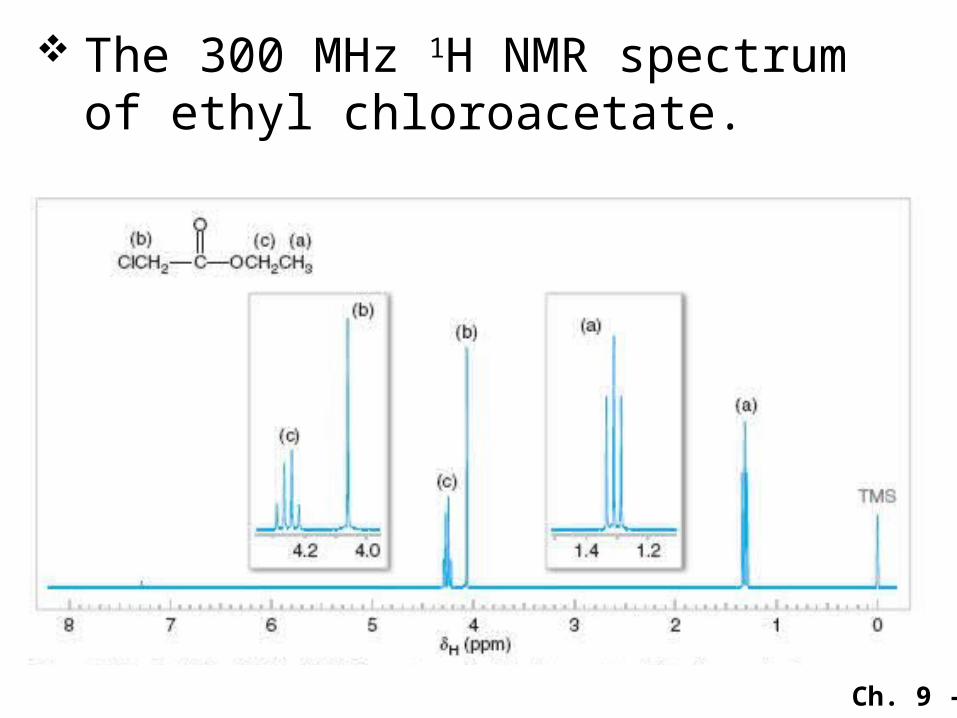
The 300 MHz 1H NMR spectrum of ethyl chloroacetate.
Ch. 9 - 81
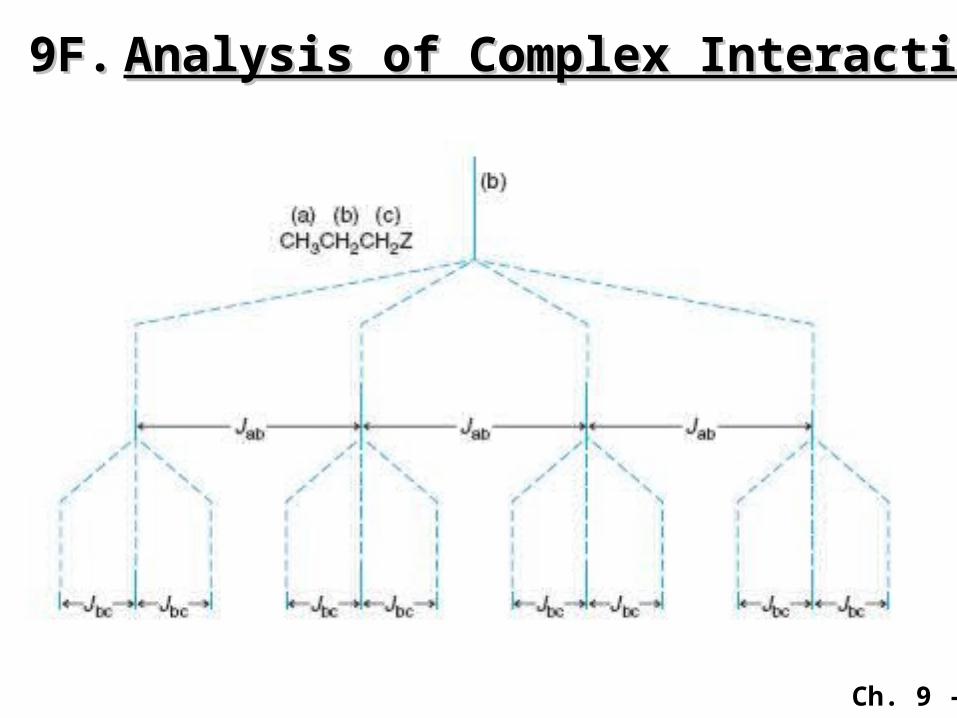
9F.9F. Analysis of Complex InteractionsAnalysis of Complex Interactions
Ch. 9 - 82
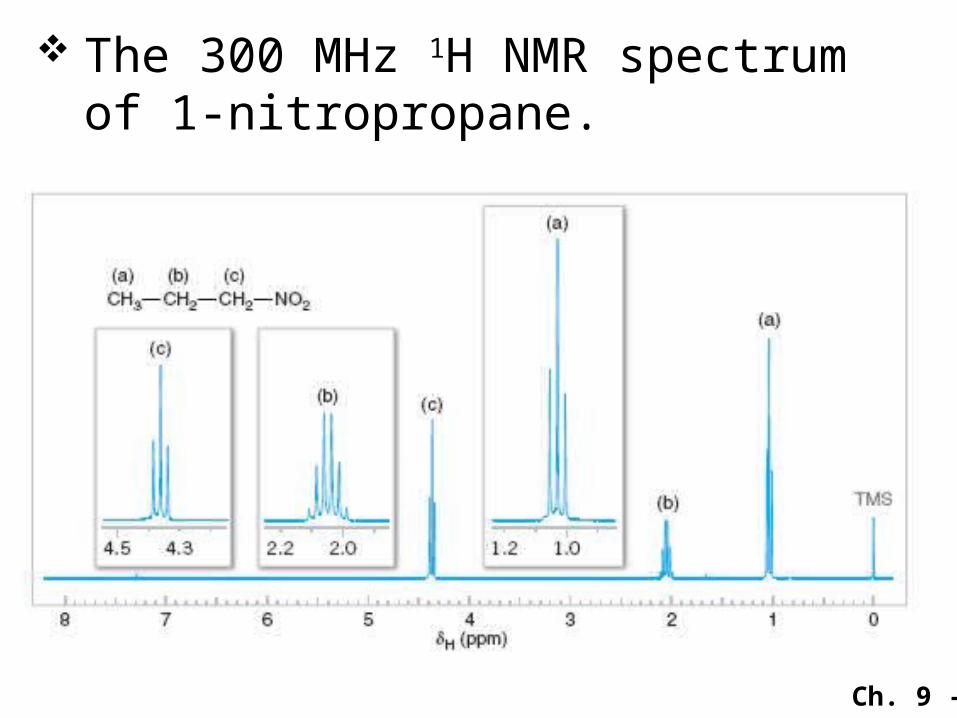
The 300 MHz 1H NMR spectrum of 1-nitropropane.
Ch. 9 - 83
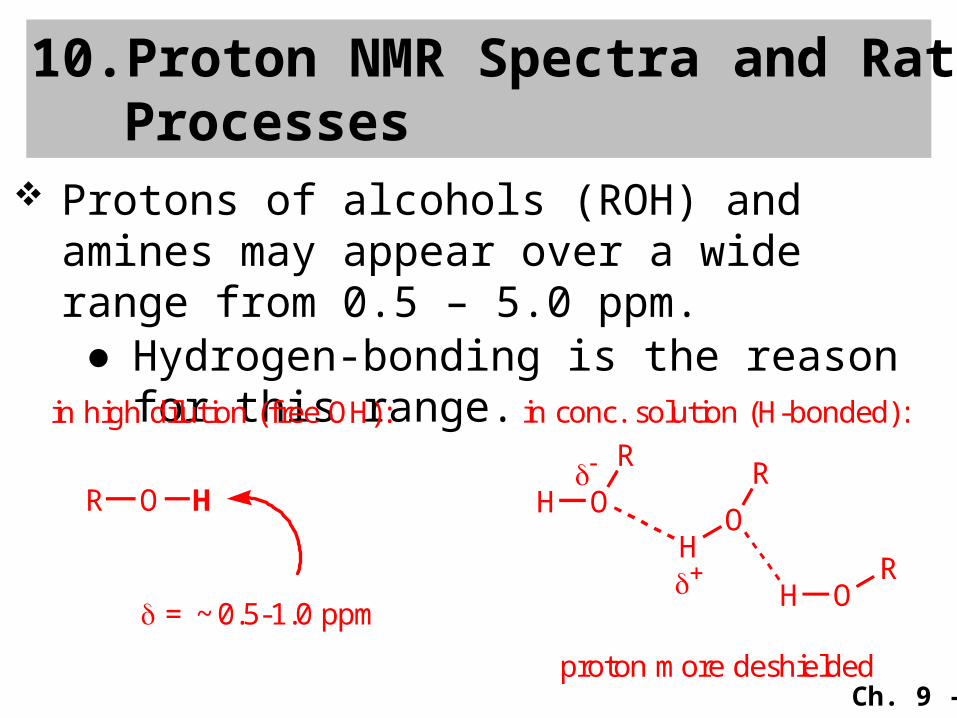
Protons of alcohols (ROH) and amines may appear over a wide range from 0.5 – 5.0 ppm.● Hydrogen-bonding is the reason for
this range.
10.Proton NMR Spectra and Rate Processes
in high dilution (free OH):
= ~0.5-1.0 ppm
in conc. solution (H-bonded):
H O
R
HO
R
H OR
proton more deshielded
R O H
Ch. 9 - 84
Why don’t we see coupling with the O–H proton, e.g. –CH2–OH (triplet?). ●Because the acidic protons
are exchangeable about 105 protons per second (residence time 10-5 sec), but the NMR experiment requires a time of 10-2 – 10-3 sec. to “take” a spectrum, usually we just see an average (thus, OH protons are usually a broad singlet).
Ch. 9 - 85
Trick:●Run the spectrum at lower
temperaturewhichslows the H exchangeand coupling is observed,or
●Run NMR in d6-DMSO where H-bonding with DMSO’s oxygen prevents H’s from exchanging and we may be able to see the coupling.
Ch. 9 - 86
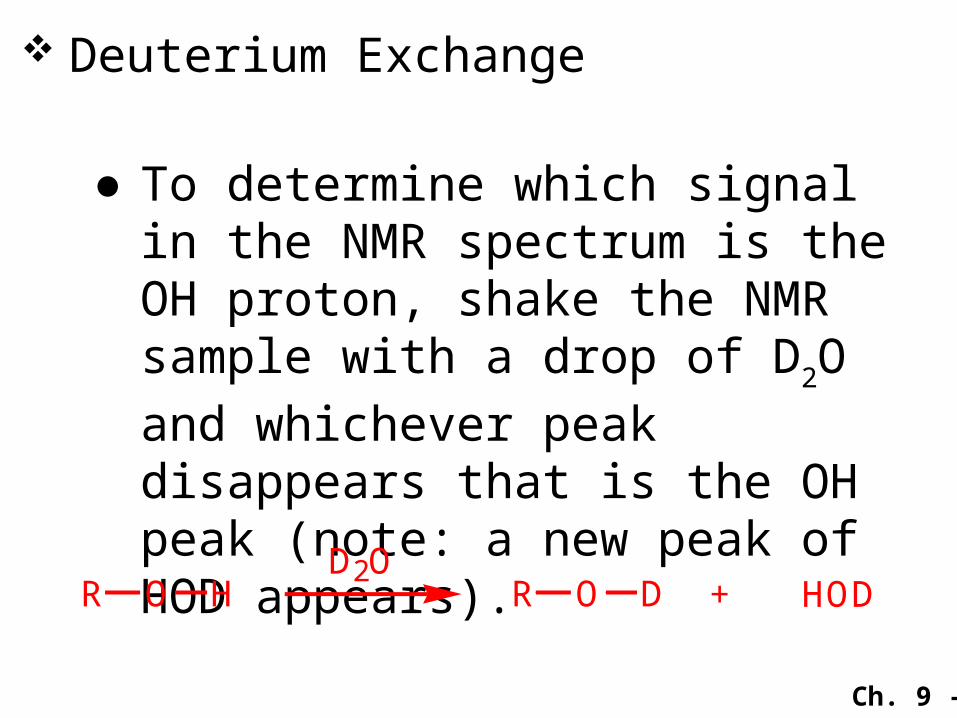
Deuterium Exchange
●To determine which signal in the NMR spectrum is the OH proton, shake the NMR sample with a drop of D2O and whichever peak disappears that is the OH peak (note: a new peak of HOD appears).
D2O+ HODR O H R O D
Ch. 9 - 87
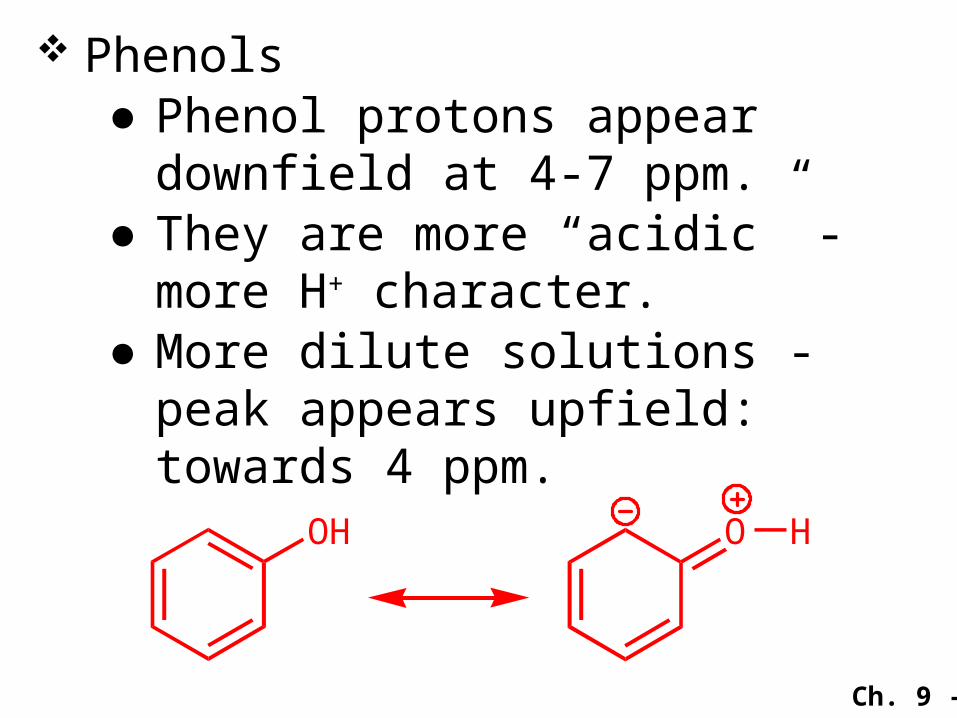
Phenols●Phenol protons appear
downfield at 4-7 ppm. ●They are more “acidic” - more
H+ character. ●More dilute solutions - peak
appears upfield: towards 4 ppm.
OH O H
Ch. 9 - 88
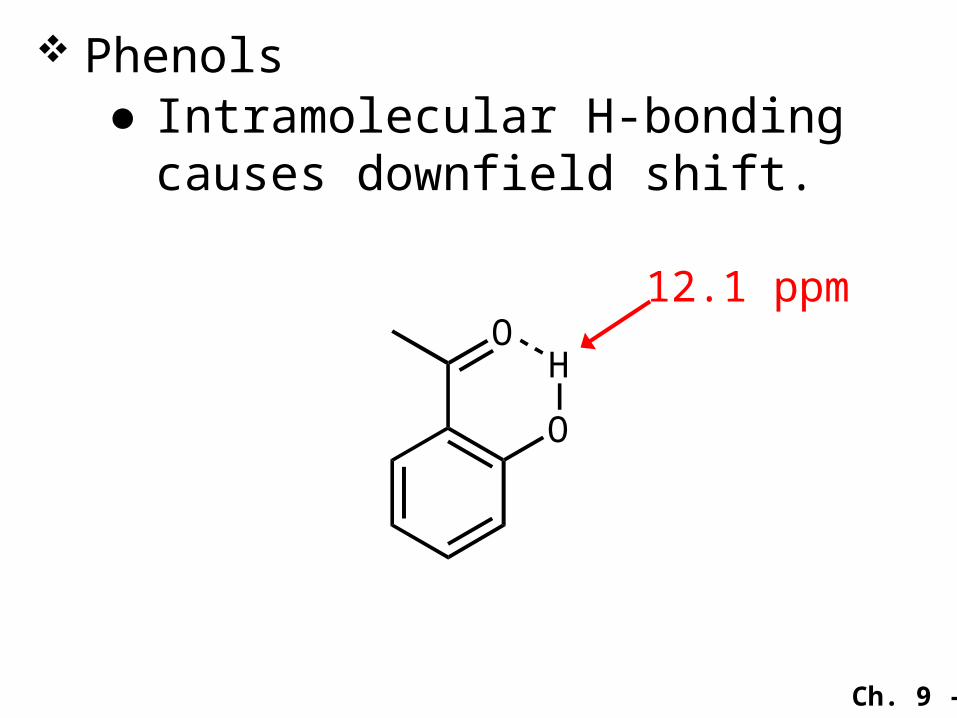
Phenols●Intramolecular H-bonding
causes downfield shift.
O
HO
12.1 ppm
Ch. 9 - 89
Unlike 1H with natural abundance ~99.98%, only 1.1% of carbon, namely 13C, is NMR active.
11.Carbon-13 NMR Spectroscopy
11A.11A. Interpretation of Interpretation of 1313C NMR C NMR SpectraSpectra
Ch. 9 - 90
11B.11B.One Peak for Each Magnetically One Peak for Each Magnetically Distinct Carbon AtomDistinct Carbon Atom
13C NMR spectra have only become commonplace more recently with the introduction of the Fourier Transform (FT) technique, where averaging of many scans is possible (note 13C spectra are 6000 times weaker than 1H spectra, thus require a lot more scans for a good spectrum).
Ch. 9 - 91
Note for a 200 MHz NMR (field strength 4.70 Tesla)
●1H NMR Frequency = 200 MHz
●13C NMR Frequency = 50 MHz
Ch. 9 - 92
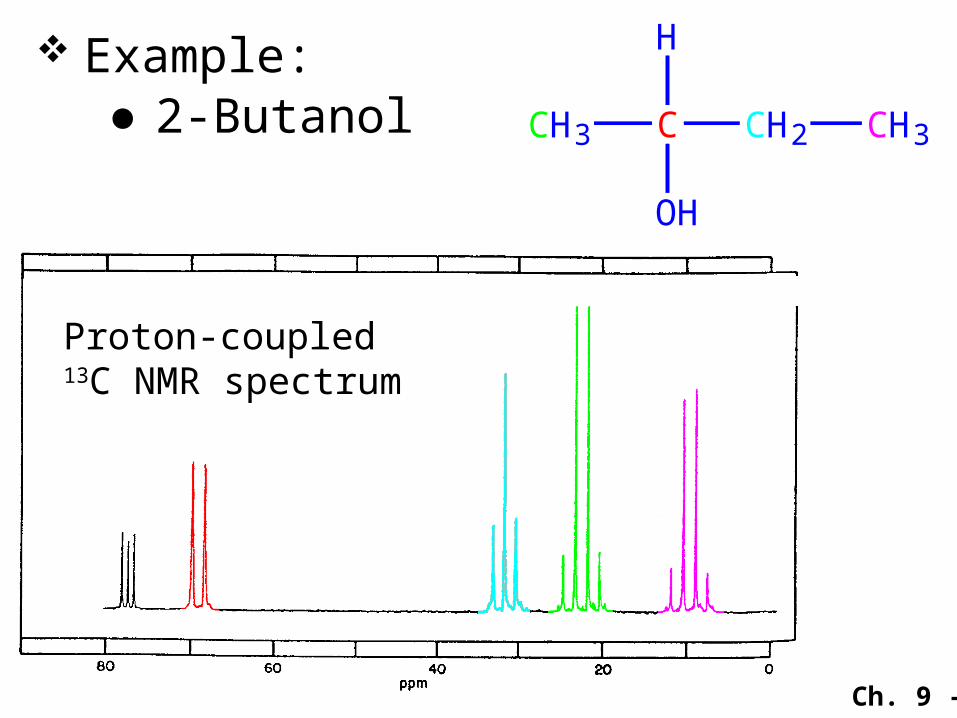
CH3 C CH2 CH3
H
OH
Example:●2-Butanol
Proton-coupled13C NMR spectrum
Ch. 9 - 93
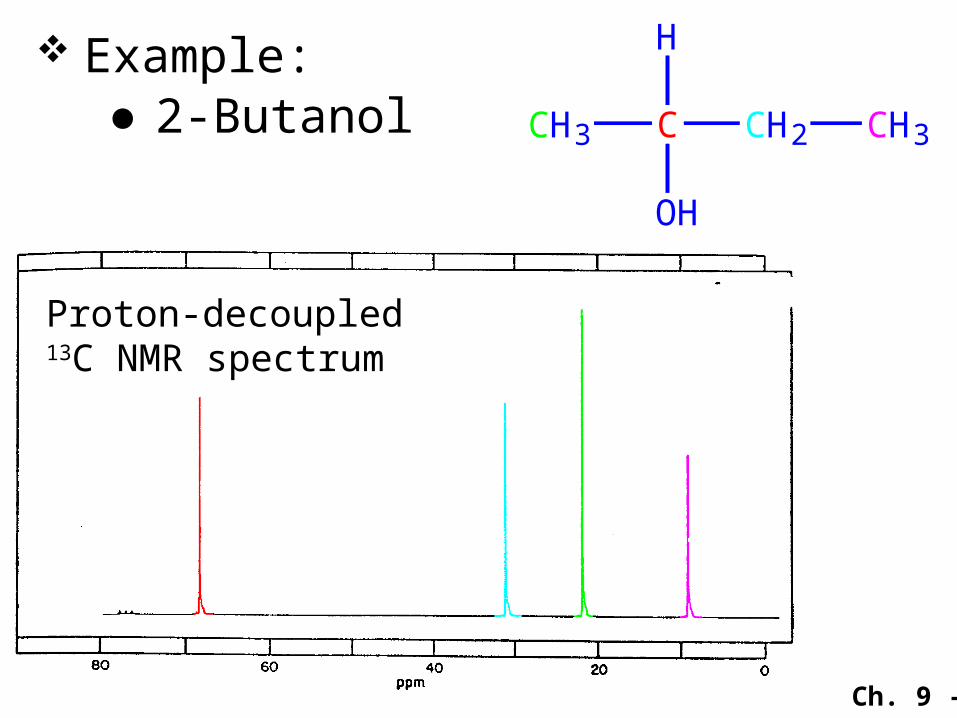
CH3 C CH2 CH3
H
OH
Example:●2-Butanol
Proton-decoupled13C NMR spectrum
Ch. 9 - 94
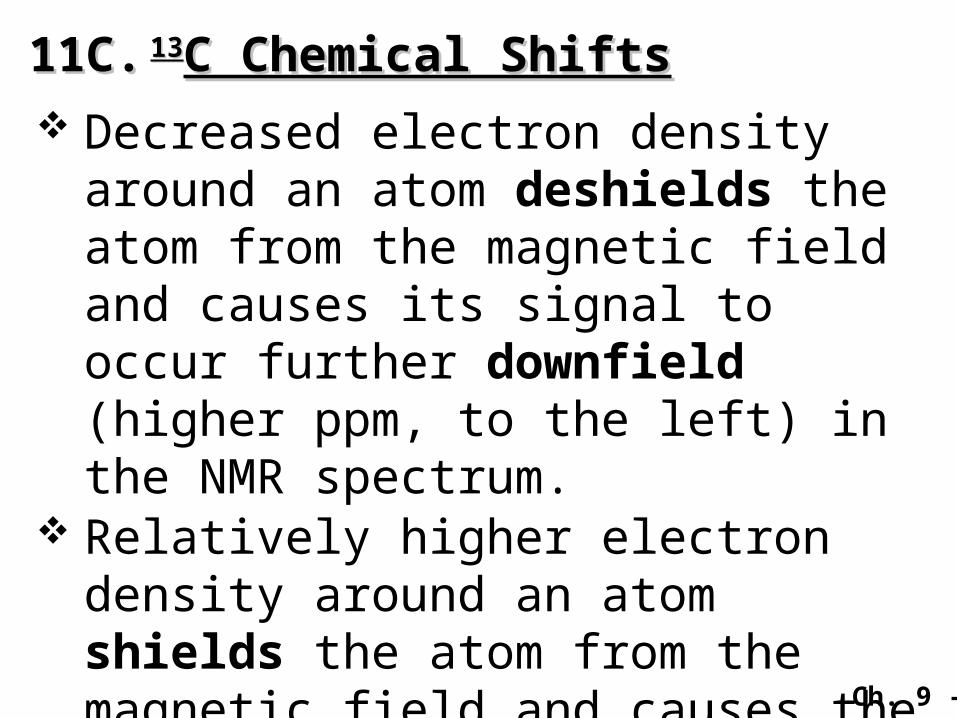
11C.11C.1313C Chemical ShiftsC Chemical Shifts Decreased electron density
around an atom deshields the atom from the magnetic field and causes its signal to occur further downfield (higher ppm, to the left) in the NMR spectrum.
Relatively higher electron density around an atom shields the atom from the magnetic field and causes the signal to occur upfield (lower ppm, to the right) in the NMR spectrum.
Ch. 9 - 95
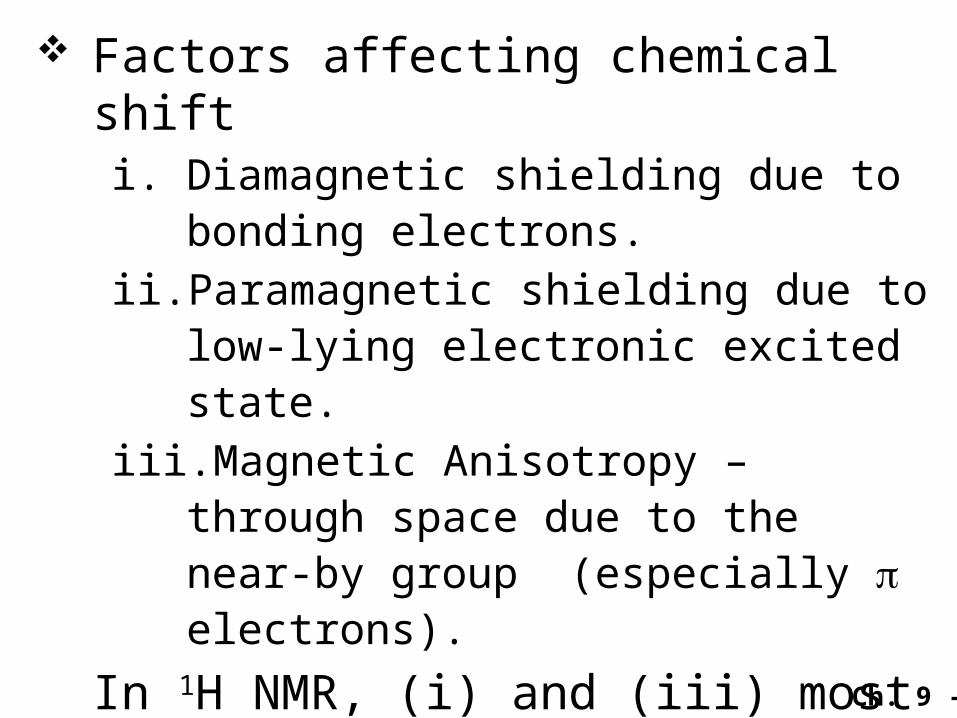
Factors affecting chemical shifti. Diamagnetic shielding due to
bonding electrons. ii. Paramagnetic shielding due to low-
lying electronic excited state. iii. Magnetic Anisotropy – through
space due to the near-by group (especially electrons).
In 1H NMR, (i) and (iii) most significant; in 13C NMR, (ii) most significant (since chemical shift range >> 1H NMR).
Ch. 9 - 96
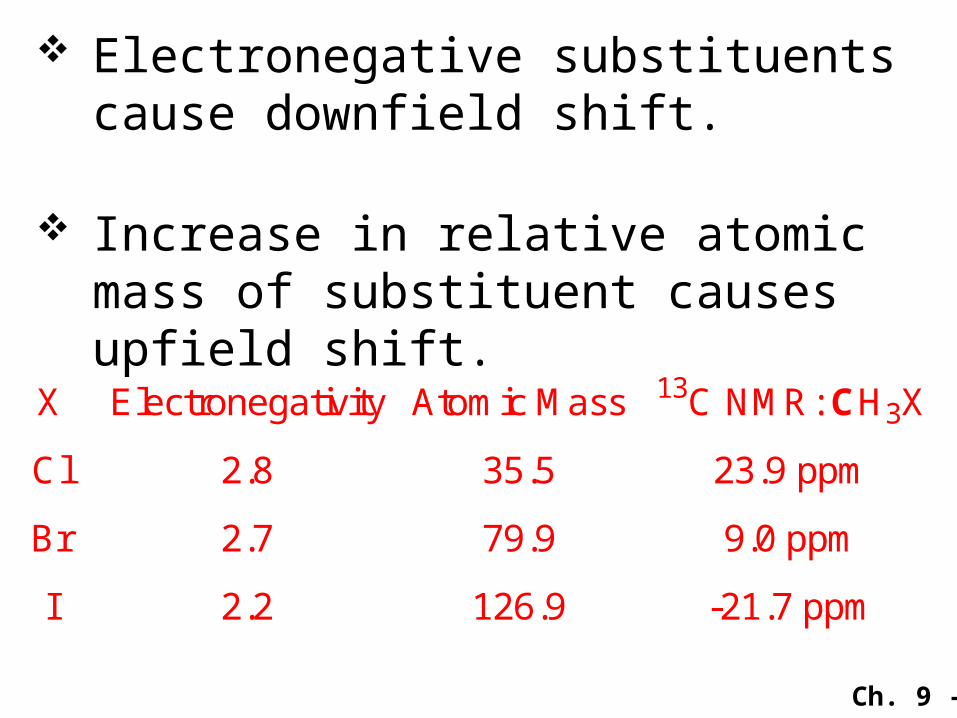
Electronegative substituents cause downfield shift.
Increase in relative atomic mass of substituent causes upfield shift.
X
Cl
Br
I
Electronegativity
2.8
2.7
2.2
Atomic Mass
35.5
79.9
126.9
13C NMR: CH3X
23.9 ppm
9.0 ppm
-21.7 ppm
Ch. 9 - 97
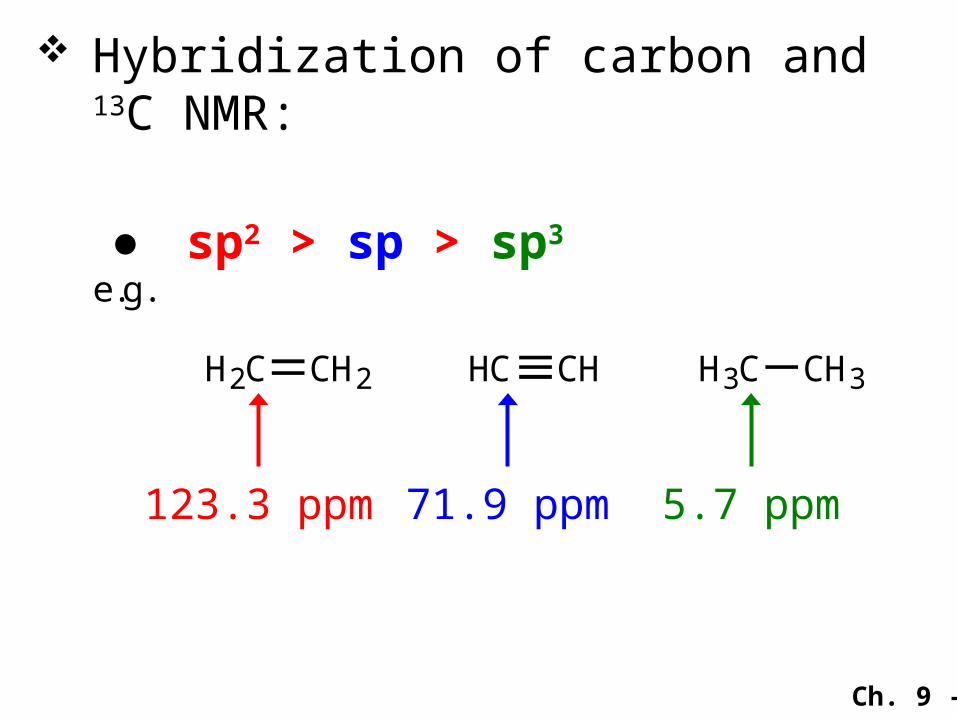
Hybridization of carbon and 13C NMR:
● sp2 > sp > sp3
H2C CH2 HC CH H3C CH3
e.g.
123.3 ppm 71.9 ppm 5.7 ppm
Ch. 9 - 98
Anisotropy effect and 13C NMR:
● Shows shifts similar to the effect in 1H NMR.
C C
e.g.
C
shows largeupfield shift

Ch. 9 - 99
Ch. 9 - 100
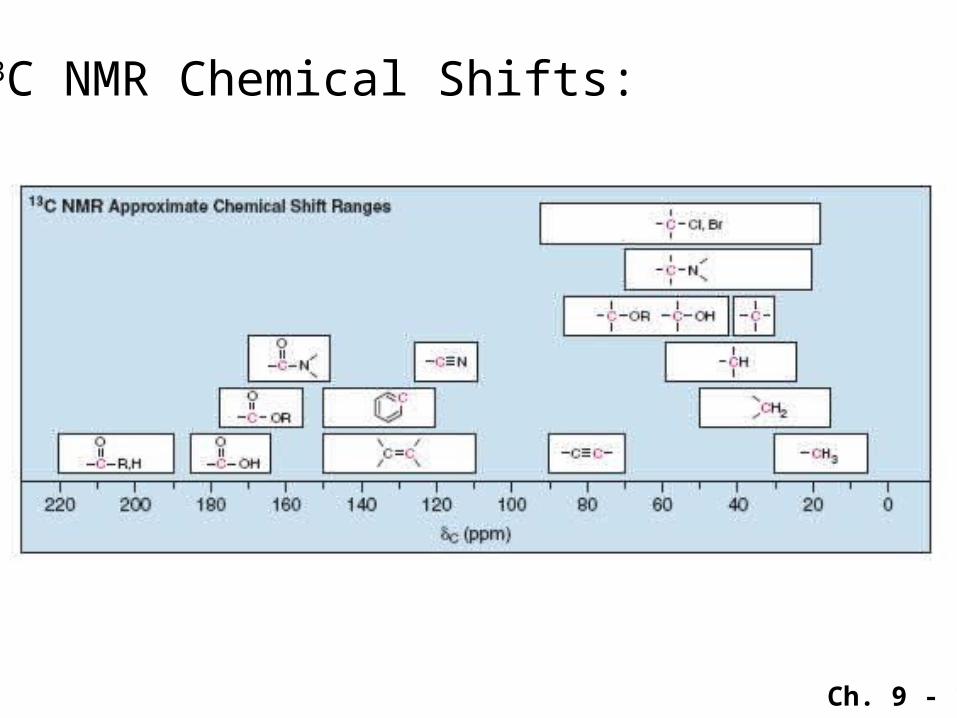
13C NMR Chemical Shifts:

Ch. 9 - 101
Cl CH2 CH CH3
OH
(a) (b) (c)
1-Chloro-2-propanol
(a)(b)(c)
13C NMR spectrum:
Ch. 9 - 102
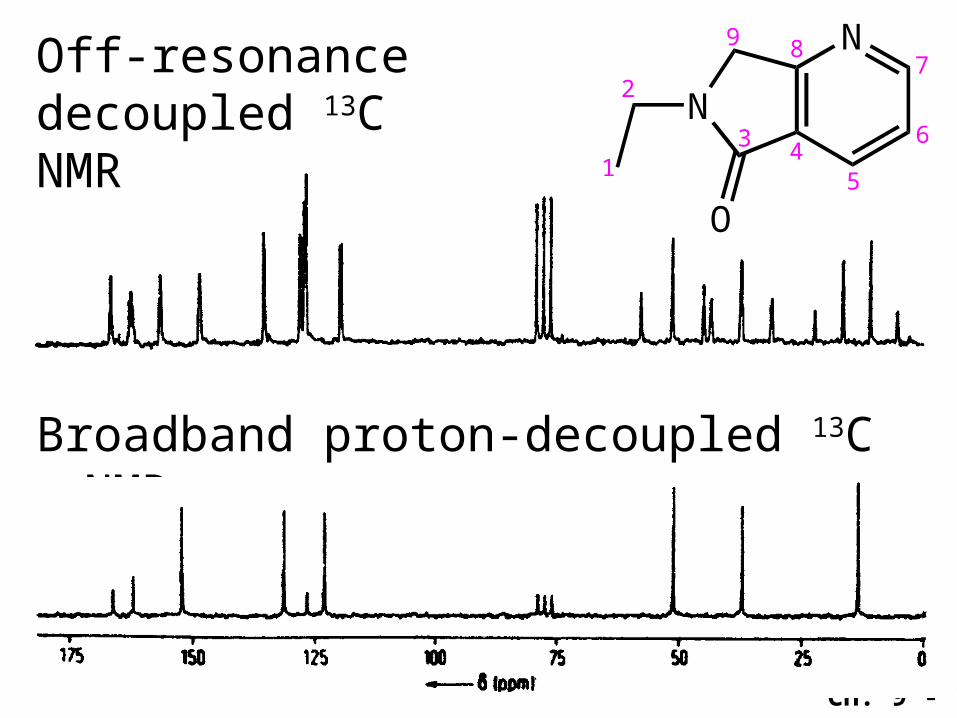
11D.11D. Off-Resonance Decoupled SpectraOff-Resonance Decoupled Spectra NMR spectrometers can differentiate among
carbon atoms on the basis of the number of hydrogen atoms that are attached to each carbon.
In an off-resonance decoupled 13C NMR spectrum, each carbon signal is split into a multiplet of peaks depending on how many hydrogens are attached to that carbon. An n + 1 rule applies, where n is the number of hydrogens on the carbon in question. A carbon with no hydrogens produces a singlet (n = 0), a carbon with one hydrogen produces a doublet (two peaks), a carbon with two hydrogens produces a triplet (three peaks), and a methyl group carbon produces a quartet (four peaks).
Ch. 9 - 103
Off-resonance decoupled 13C NMR
N
N
O
1
2
3 45
6
789
Broadband proton-decoupled 13C NMR
Ch. 9 - 104
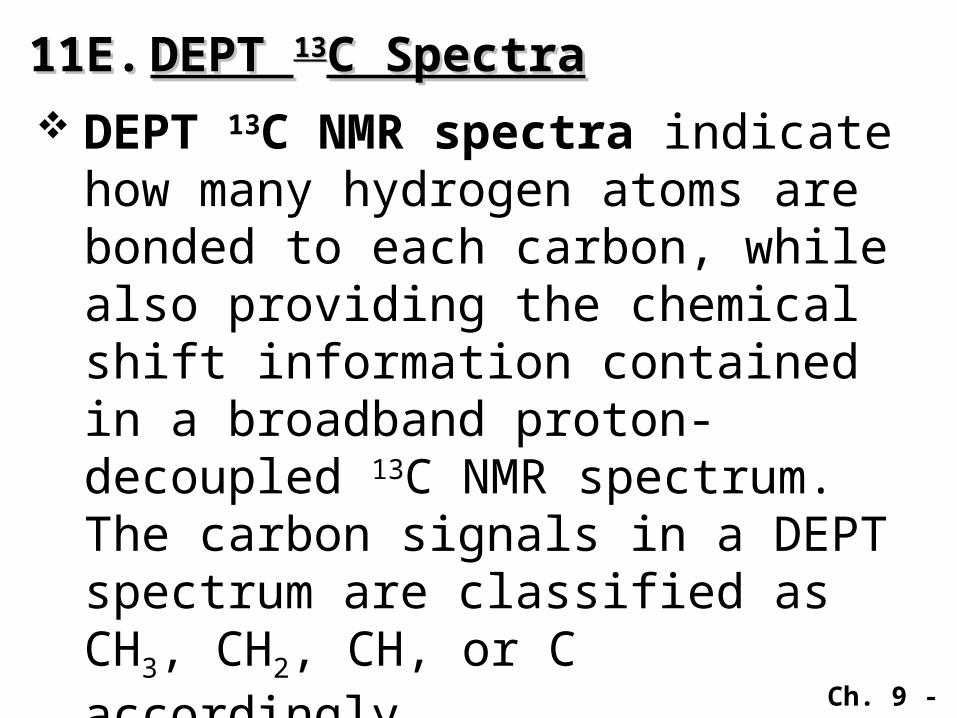
11E.11E.DEPT DEPT 1313C SpectraC Spectra DEPT 13C NMR spectra indicate
how many hydrogen atoms are bonded to each carbon, while also providing the chemical shift information contained in a broadband proton-decoupled 13C NMR spectrum. The carbon signals in a DEPT spectrum are classified as CH3, CH2, CH, or C accordingly.
Ch. 9 - 105
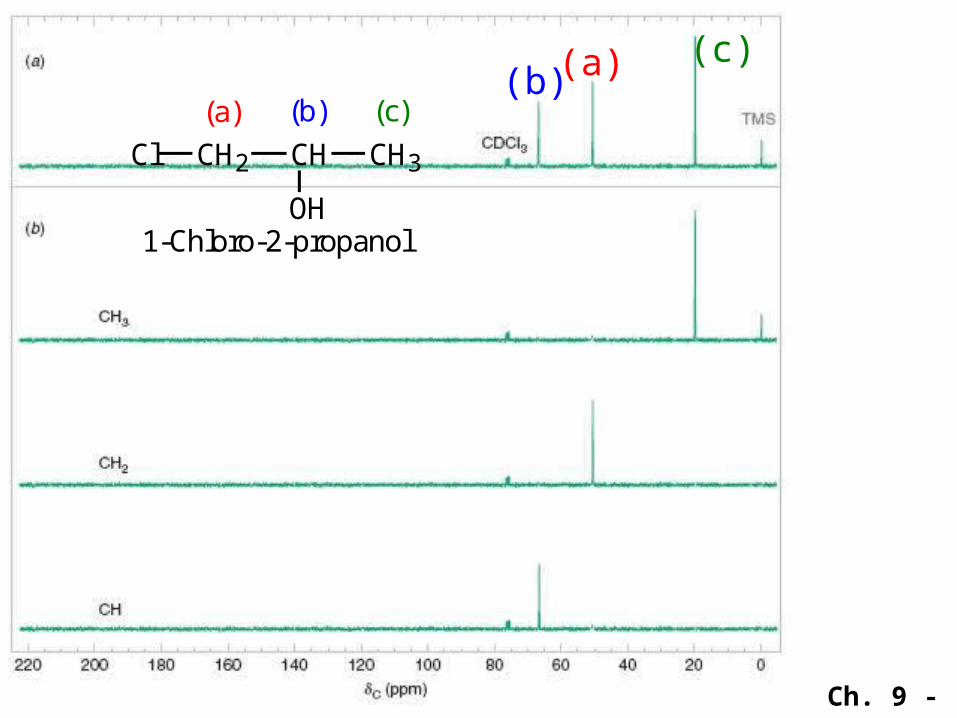
Cl CH2 CH CH3
OH
(a) (b) (c)
1-Chloro-2-propanol
(a)(b)(c)
Ch. 9 - 106
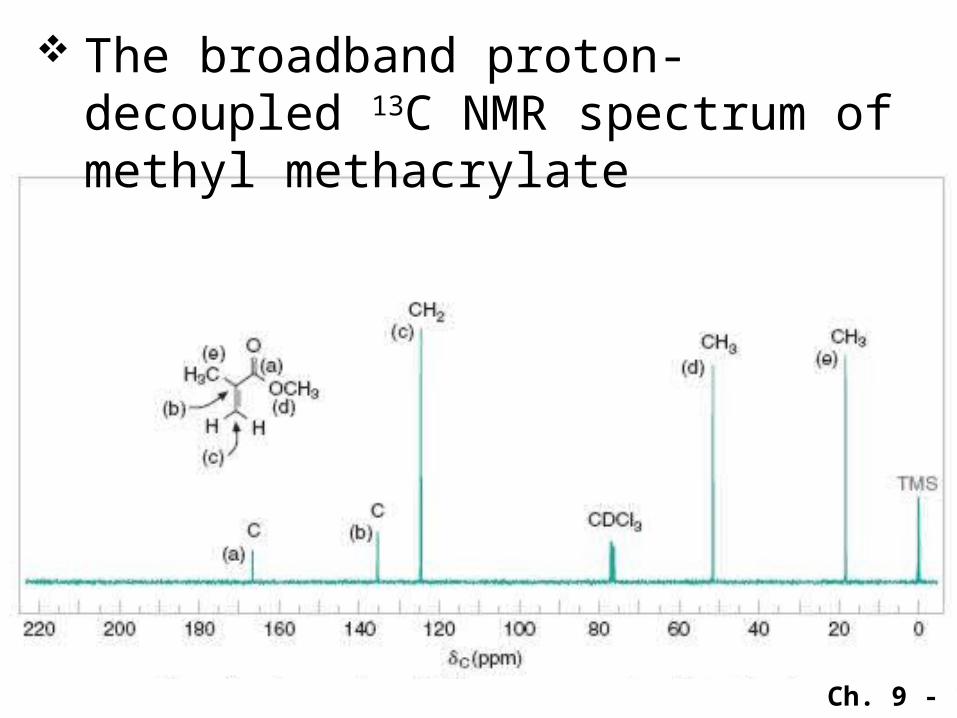
The broadband proton-decoupled 13C NMR spectrum of methyl methacrylate
Ch. 9 - 107
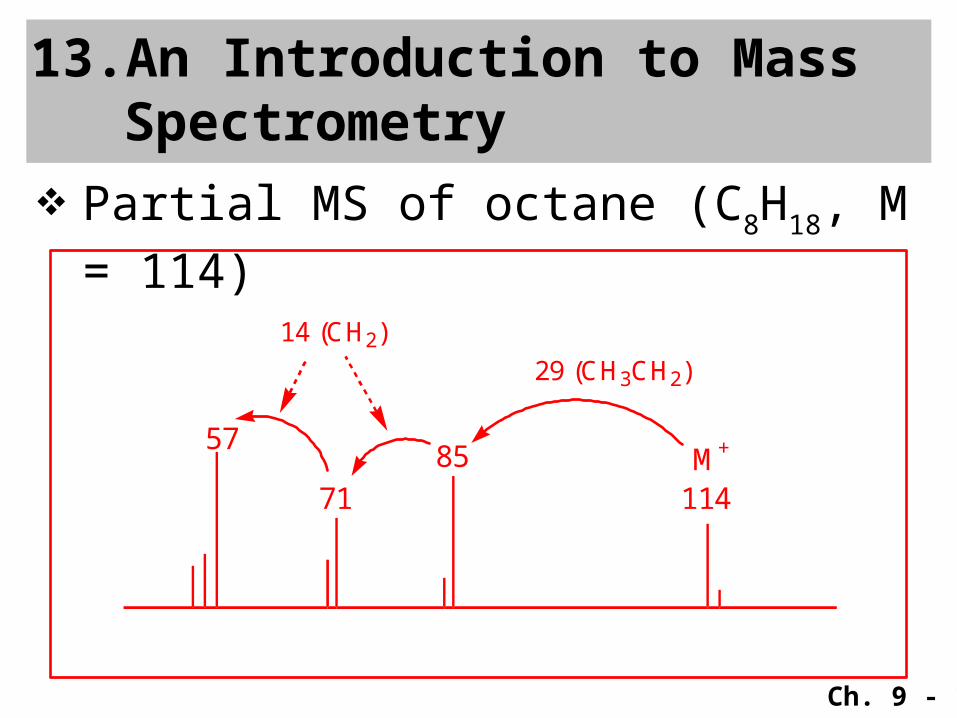
Partial MS of octane (C8H18, M = 114)
13.An Introduction to Mass Spectrometry
114
85
71
57M+
29 (CH3CH2)
14 (CH2)
Ch. 9 - 108
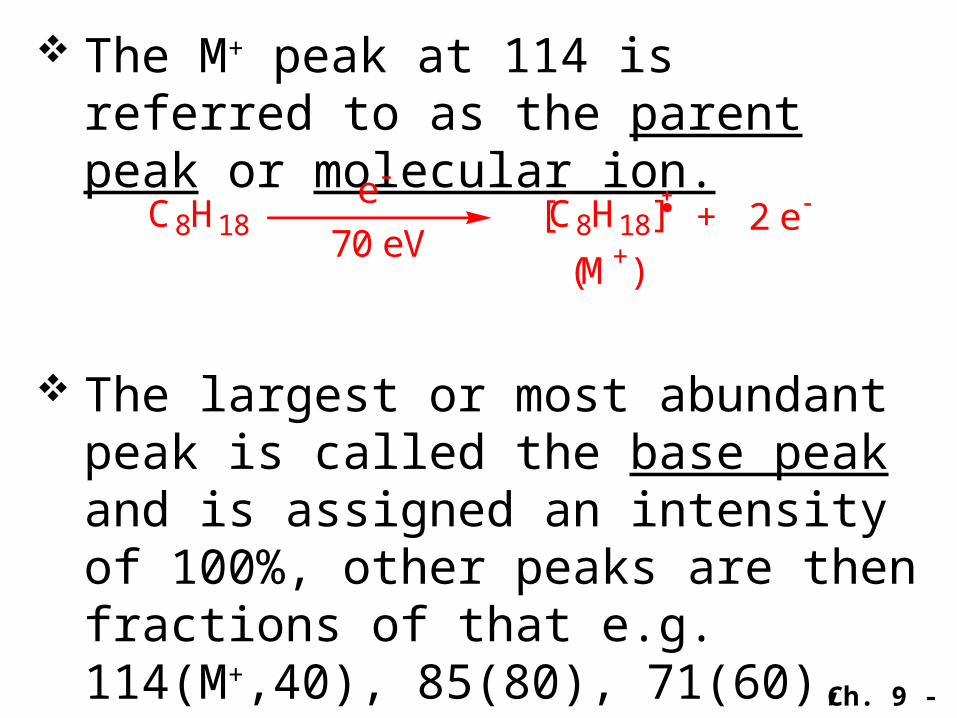
The M+ peak at 114 is referred to as the parent peak or molecular ion.
C8H18e-
70 eV+ 2 e-[C8H18]
(M+)
The largest or most abundant peak is called the base peak and is assigned an intensity of 100%, other peaks are then fractions of that e.g. 114(M+,40), 85(80), 71(60), 57(100) etc.

Ch. 9 - 109
Masses are usually rounded off to whole numbers assuming:
H = 1, C = 12, N = 14, O = 16, F = 19 etc.
Molecular ion (parent peak)
Daughterions[C8H18]
(M+, 114)
[C6H13]
(85)
fragmentation
-CH3CH2 (29)
[C5H11]
(71)-CH3CH2CH2 (29+14)
Ch. 9 - 110
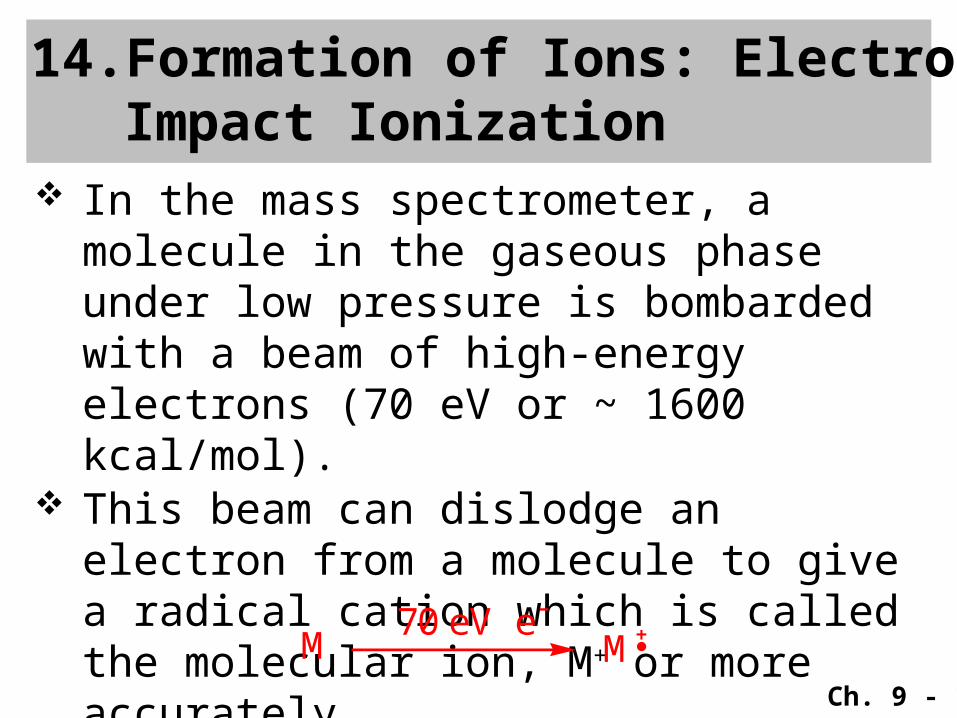
In the mass spectrometer, a molecule in the gaseous phase under low pressure is bombarded with a beam of high-energy electrons (70 eV or ~ 1600 kcal/mol).
This beam can dislodge an electron from a molecule to give a radical cation which is called the molecular ion, M+ or more accurately.
14.Formation of Ions: Electron Impact Ionization
M70 eV e-
M
Ch. 9 - 111
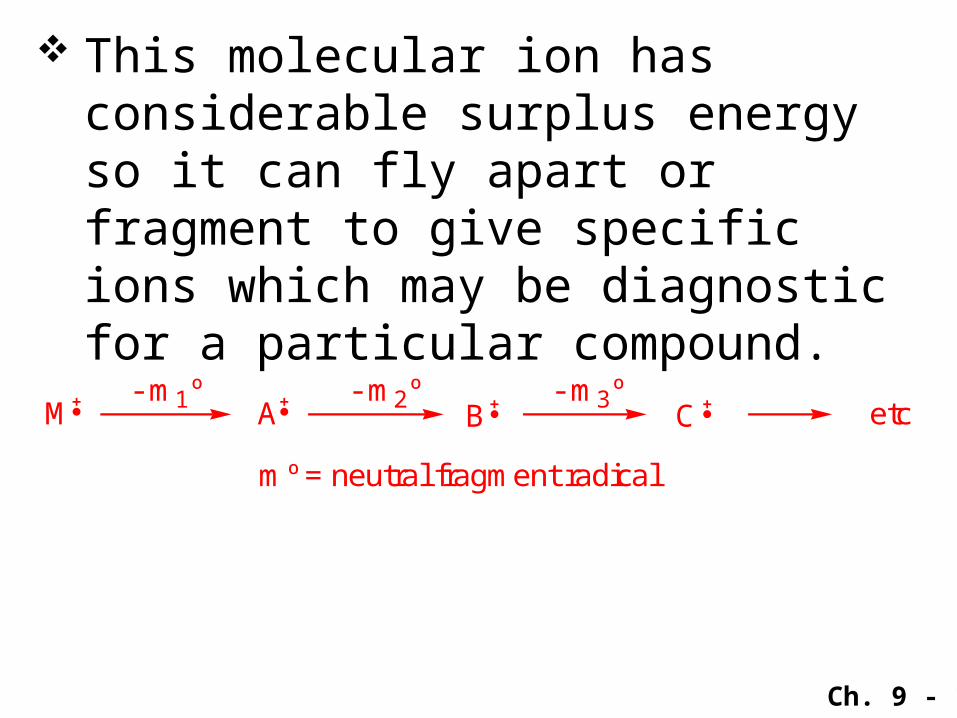
This molecular ion has considerable surplus energy so it can fly apart or fragment to give specific ions which may be diagnostic for a particular compound.
M A B C- m1º - m2º - m3º
mº = neutral fragment radical
etc.
Ch. 9 - 112
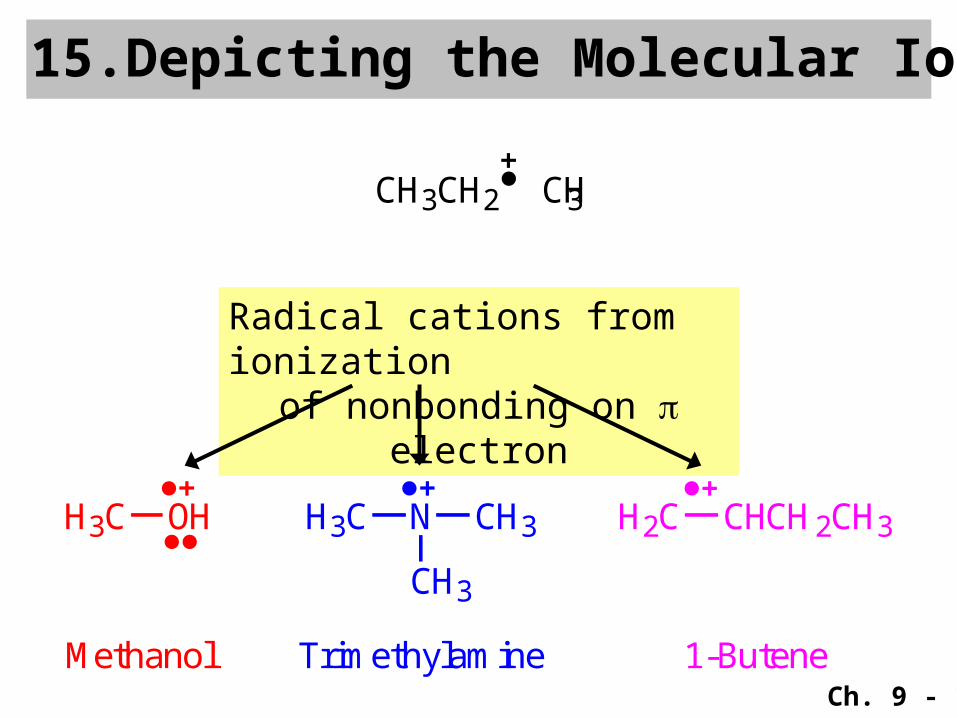
15.Depicting the Molecular Ion
CH3CH2 CH3
H3C OH H3C N CH3
CH3
H2C CHCH2CH3
Methanol Trimethylamine 1-Butene
Radical cations from ionization
of nonbonding on electron
Ch. 9 - 113
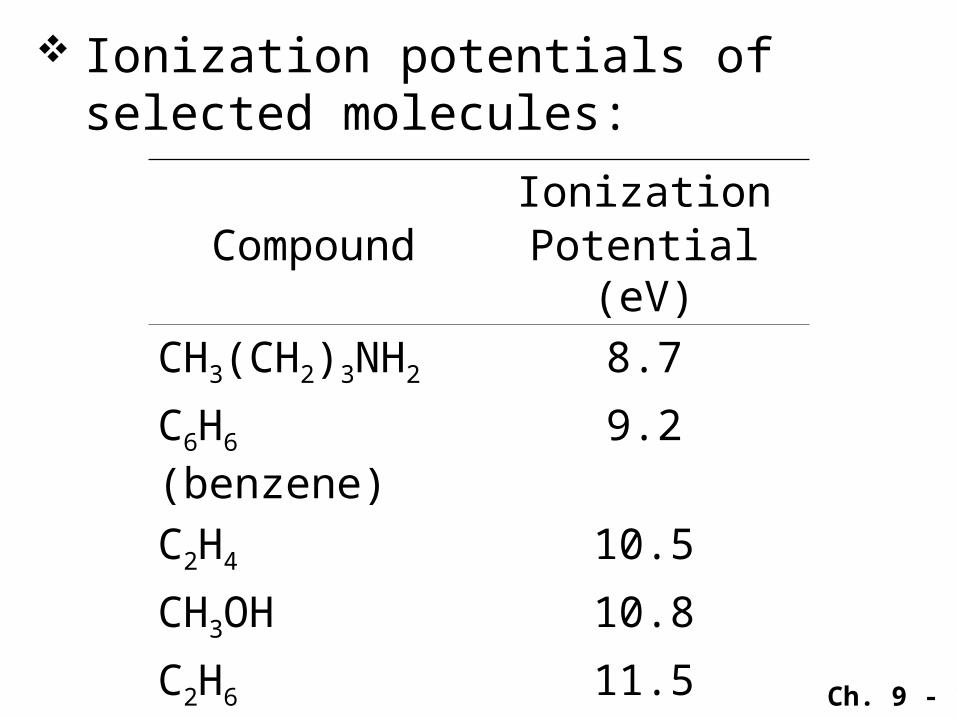
CompoundIonization
Potential (eV)CH3(CH2)3NH2 8.7
C6H6 (benzene)
9.2
C2H4 10.5
CH3OH 10.8
C2H6 11.5
CH4 12.7
Ionization potentials of selected molecules:
Ch. 9 - 114
16.Fragmentation
1. The reactions that take place in a mass spectrometer are unimolecular, that is, they do not involve collisions between molecules or ions. This is true because the pressure is kept so low (10-6 torr) that reactions. involving bimolecular collisions do not occur
2. We use single-barbed arrows to depict mechanisms involving single electron movements.
3. The relative ion abundances, as indicated by peak intensities, are very important.
Ch. 9 - 115
16A.16A. Fragmentation by Cleavage at a Fragmentation by Cleavage at a Single BondSingle Bond
When a molecular ion fragments, it will yield a neutral radical (not detected) and a carbocation (detected) with an even number of electrons.
The fragmentation will be dictated to some extent by the fragmention of the more stable carbocation:
ArCH2+ > CH2=CHCH2
+ > 3o > 2o > 1o >
CH3+
Ch. 9 - 116
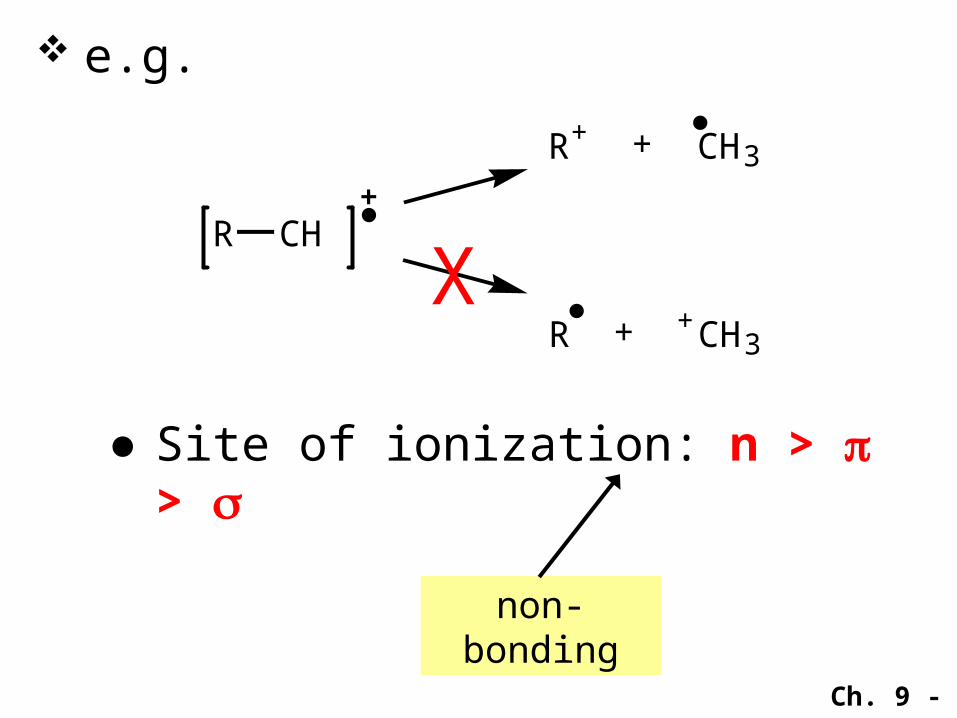
e.g.
R CH
R+ CH3+
R +CH3+X
●Site of ionization: n > >
non-bonding
Ch. 9 - 117
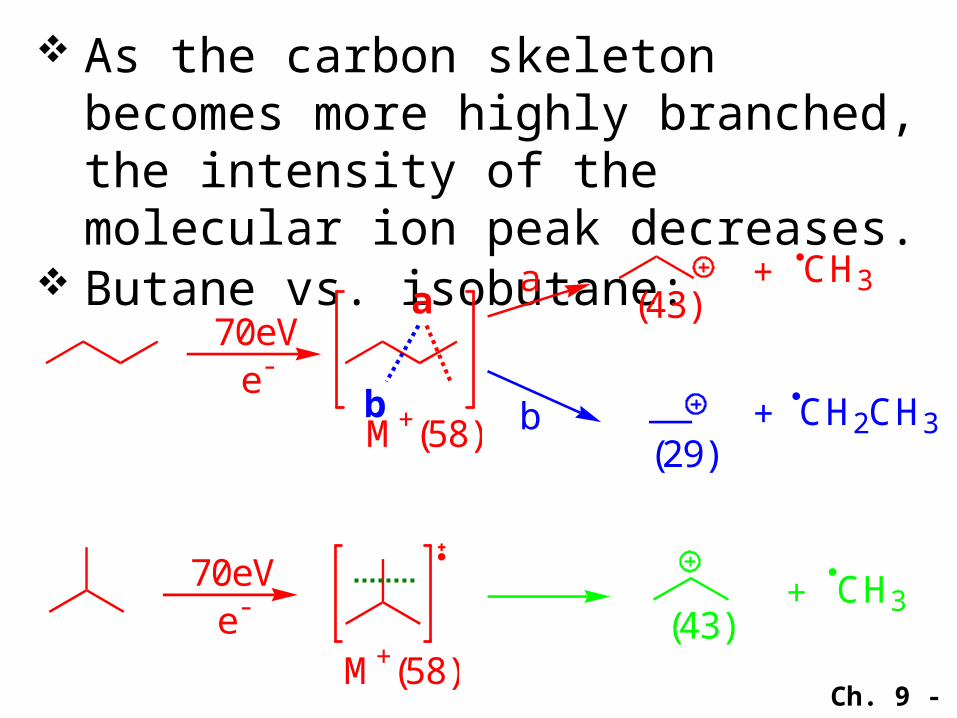
As the carbon skeleton becomes more highly branched, the intensity of the molecular ion peak decreases.
Butane vs. isobutane:
70eVe-
M+(58)
70eVe-
M+(58)
aCH3+
(43)a
b CH2CH3+(29)
b
CH3+(43)
Ch. 9 - 118
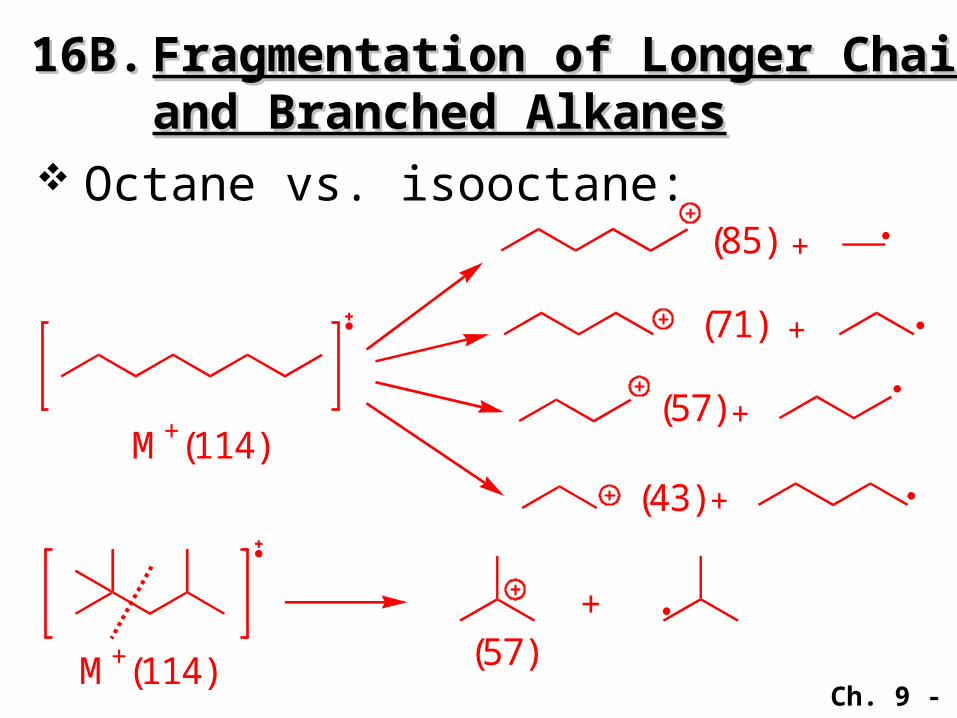
16B.16B.Fragmentation of Longer Chain Fragmentation of Longer Chain and Branched Alkanesand Branched Alkanes
Octane vs. isooctane:
M+(114)
(85)
(71)
(57)
(43)
M+(114)
+
+
+
+
+(57)

Ch. 9 - 119
16C.16C.Fragmentation to Form Fragmentation to Form Resonance-Stabilized CationsResonance-Stabilized Cations
Alkenes●Important fragmentation of
terminal alkenes. Allyl carbocation (m/e = 41)
R
(41)
R +

Ch. 9 - 120
Carbon–carbon bonds next to an atom with an unshared electron pair usually break readily because the resulting carbocation is resonance stabilized.
Ethers● Cleavage (to ether oxygen) C–C
bondsO
O
(m/e = 59)
+ OCH3

Ch. 9 - 121
Alcohols●Most common fragmentation: -
loss of alkyl groups.
OH
M+(74)
CH3+OHOH
a(m/e = 59)
a
OH OHCH3CH2 +
b
(m/e = 45)
b
Ch. 9 - 122
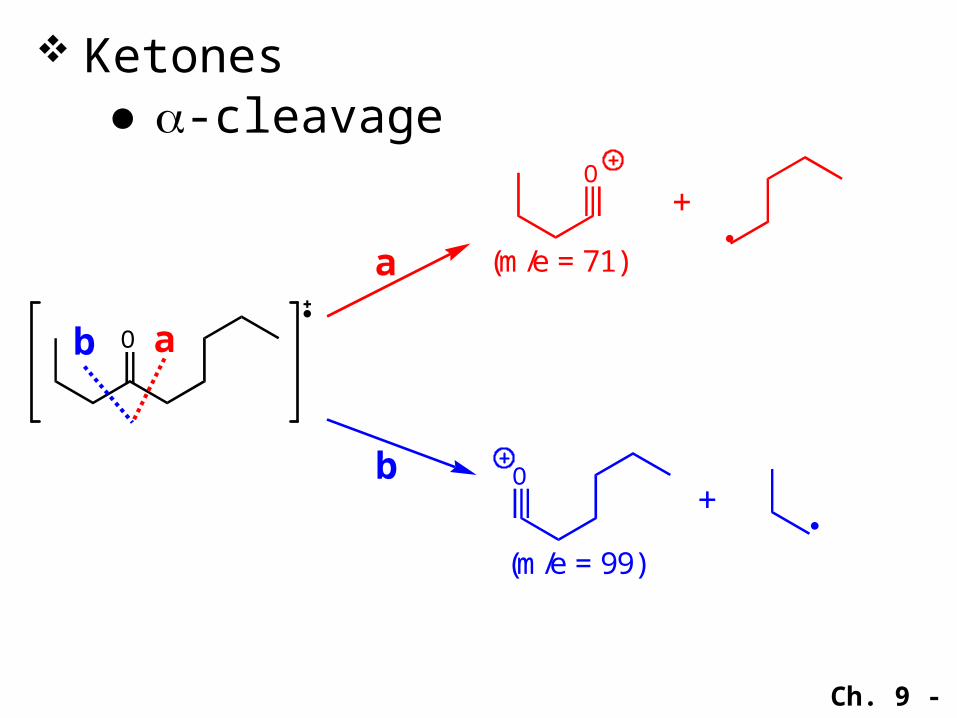
Carbon–carbon bonds next to the carbonyl group of an aldehyde or ketone break readily because resonance-stabilized ions called acylium ions are produced via an -cleavage.
Ch. 9 - 123
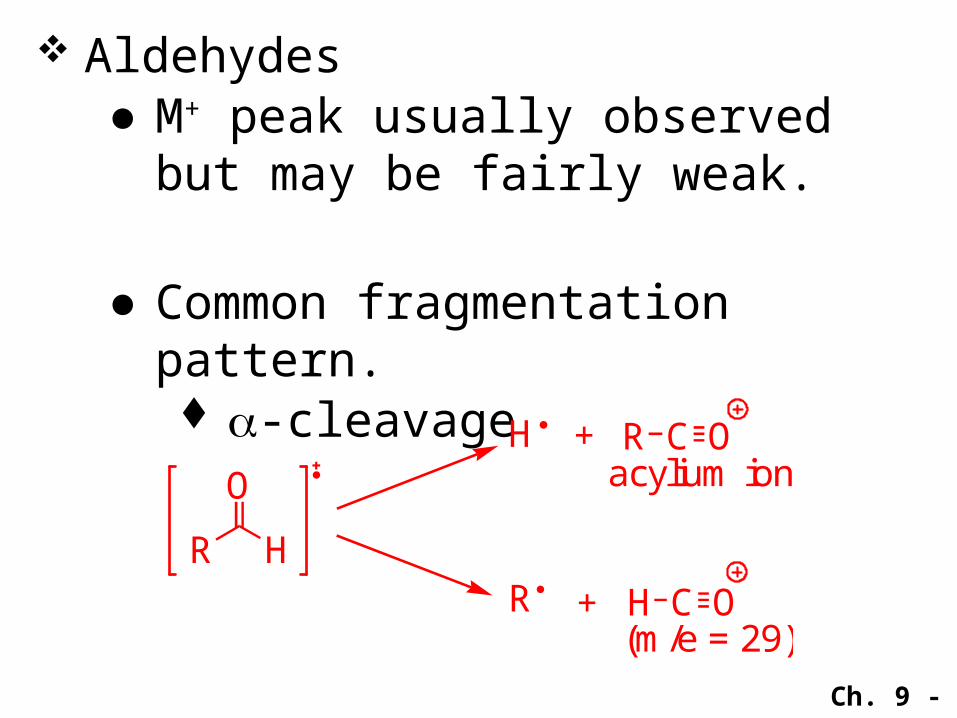
Aldehydes●M+ peak usually observed but
may be fairly weak.
●Common fragmentation pattern. -cleavage
RR H
OH C OR
C OH
+
+(m/e = 29)
acylium ion
Ch. 9 - 124
Ketones●-cleavage
O a
a
b
b
O+
(m/e = 71)
O+
(m/e = 99)
Ch. 9 - 125
Alkyl-substituted benzenes ionize by loss of a π electron and undergo loss of a hydrogen atom or methyl group to yield the relatively stable tropylium ion (see Section 14.7C). This fragmentation gives a prominent peak (sometimes the base peak) at m/z 91.

Ch. 9 - 126
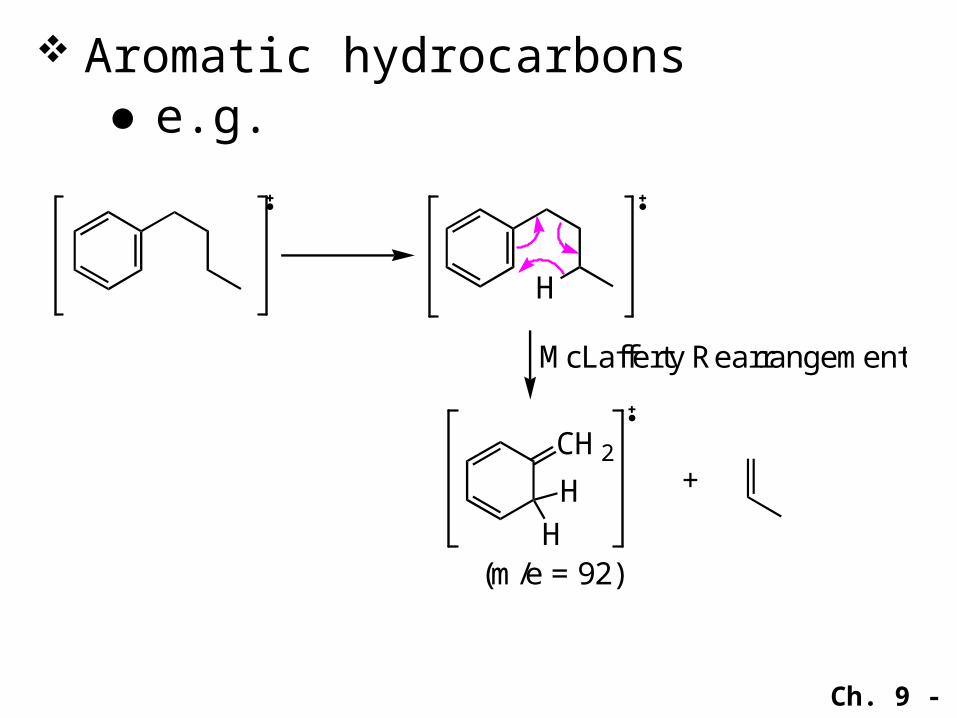
Aromatic hydrocarbons●very intense M+ peaks ●characteristic fragmentation
pattern (when an alkyl group attached to the benzene ring): - tropylium cation.
CH3CH2
CH3
(m/e = 91)tropylium cation
rearrangement+
benzyl cation
Ch. 9 - 127
16D.16D. Fragmentation by Cleavage of Fragmentation by Cleavage of Two BondsTwo Bonds
Alcohols frequently show a prominent peak at M - 18. This corresponds to the loss of a molecule of water.
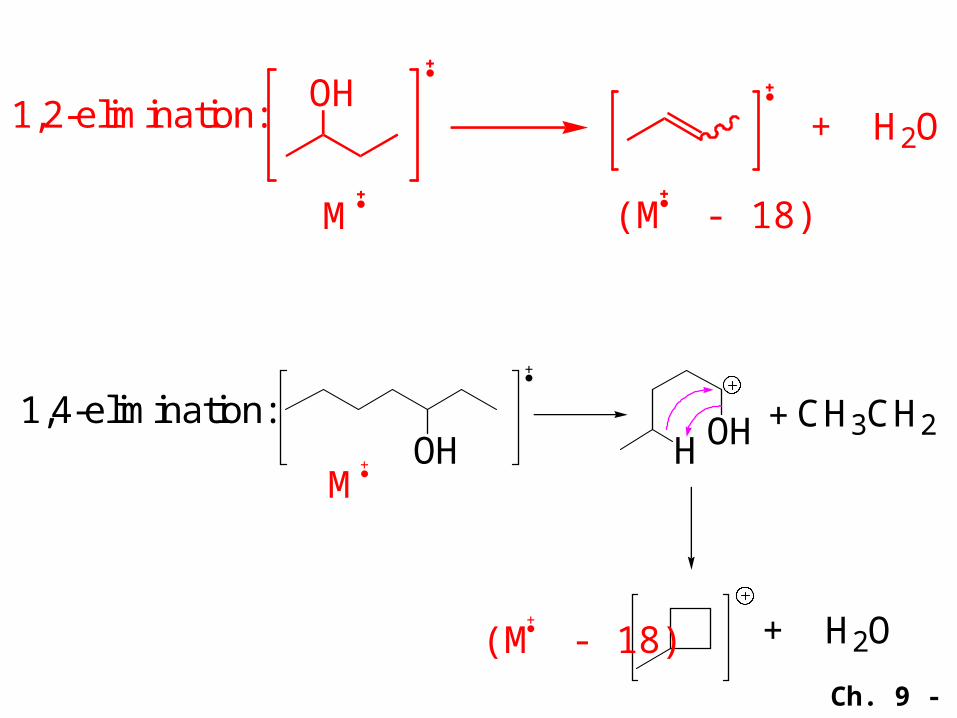
●May lose H2O by 1,2- or 1,4-elimination.
+●
Ch. 9 - 128
1,2-elimination:OH
+ H2O
M (M - 18)
1,4-elimination:OH H OH
+ H2O
+ CH3CH2
M
(M - 18)
Ch. 9 - 129
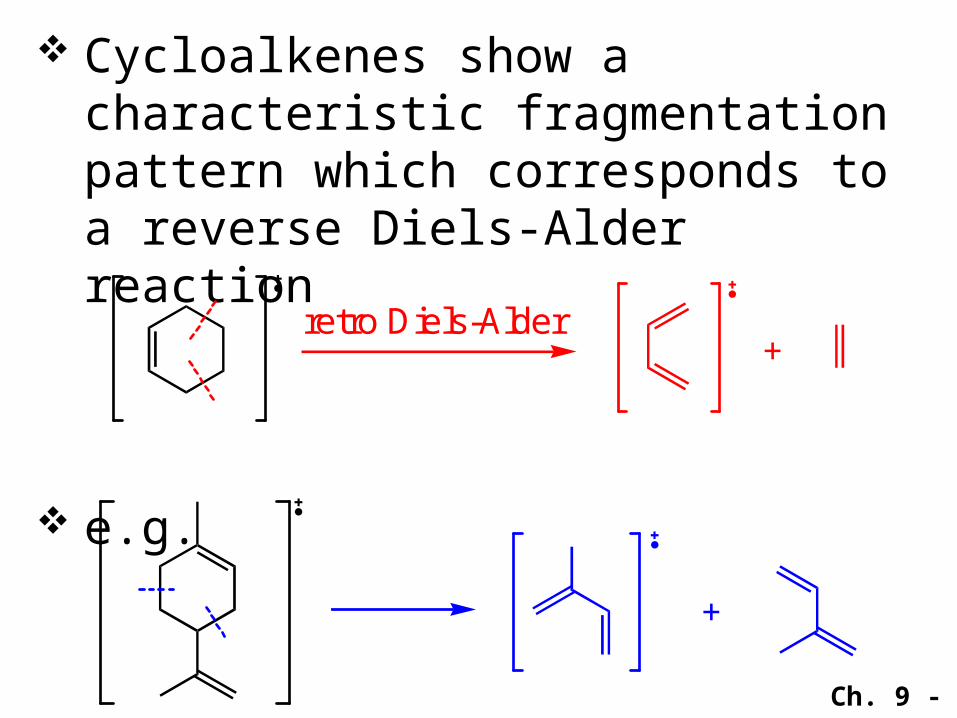
Cycloalkenes show a characteristic fragmentation pattern which corresponds to a reverse Diels-Alder reaction
e.g.
retro Diels-Alder+
+
Ch. 9 - 130
H
CH2
H
H(m/e = 92)
+
McLafferty Rearrangement
Aromatic hydrocarbons●e.g.
Ch. 9 - 131
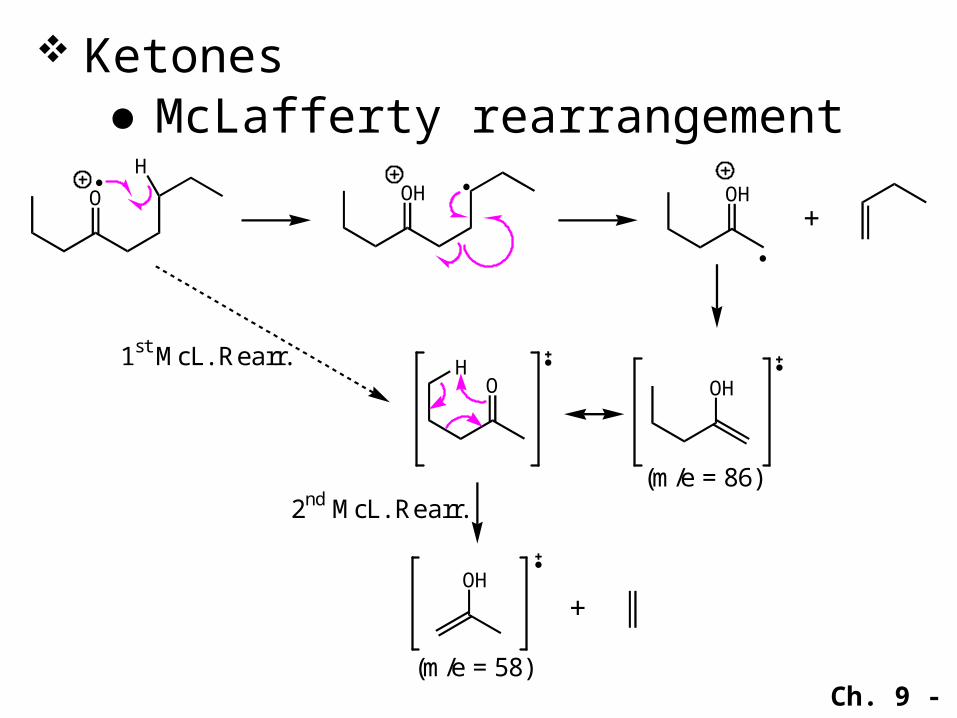
Ketones●McLafferty rearrangement
O
HOH OH
OHOH
OH
+
(m/e = 86)
(m/e = 58)
+
1st McL. Rearr.
2nd McL. Rearr.

Ch. 9 - 132
OH H
OH OH
(m/e = 86)2º radical
observedi
i
OH
1º radical
OH
(m/e = 114)NOT observed
ii
ii
McLafferty rearrangement:

Ch. 9 - 133
Characteristic of McLafferty rearrangement.1. No alkyl migrations to C=O,
only H migrates.
OH
O
O
R
R
R
H
HX
Ch. 9 - 134
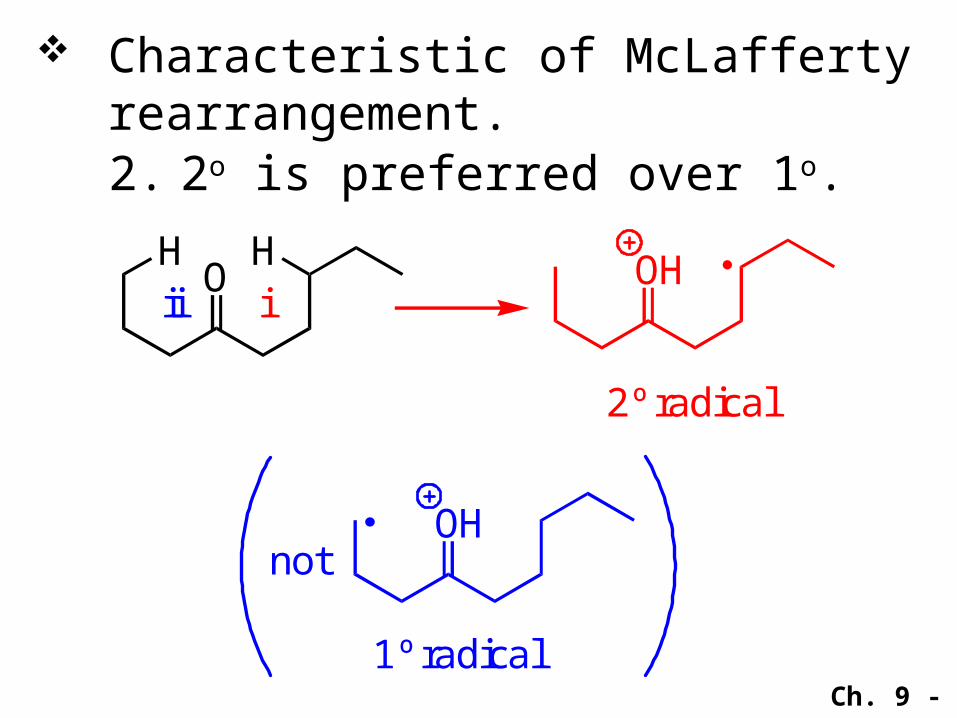
Characteristic of McLafferty rearrangement.2. 2o is preferred over 1o.
OH H
iiiOH
2º radical
OH
1º radical
not
Ch. 9 - 135
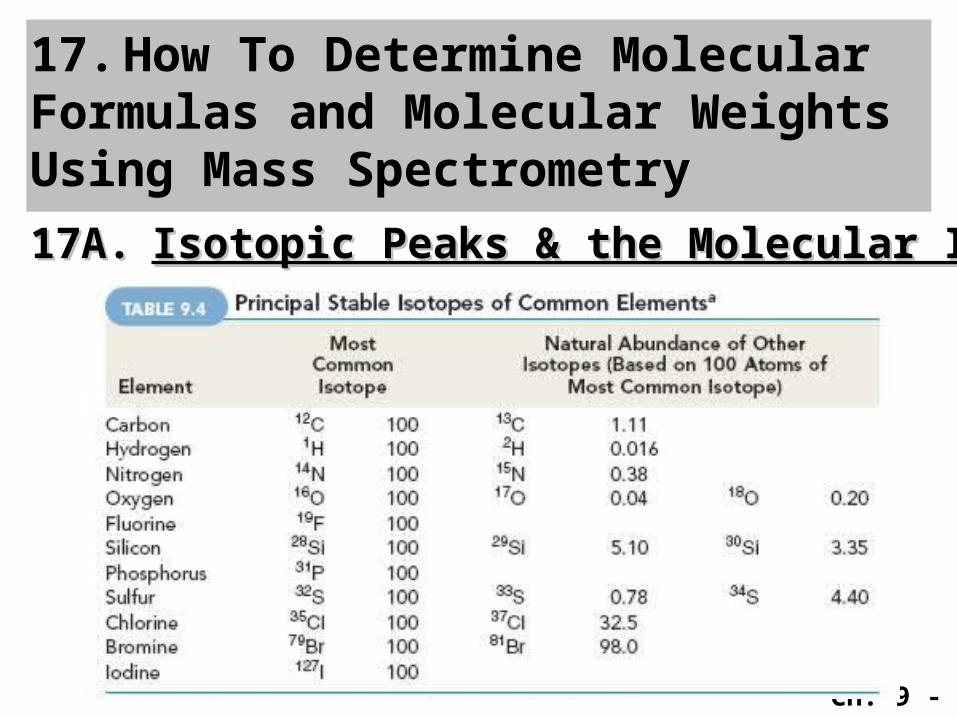
17. How To Determine Molecular Formulas and Molecular Weights Using Mass Spectrometry
17A.17A. Isotopic Peaks & the Molecular IonIsotopic Peaks & the Molecular Ion
Ch. 9 - 136
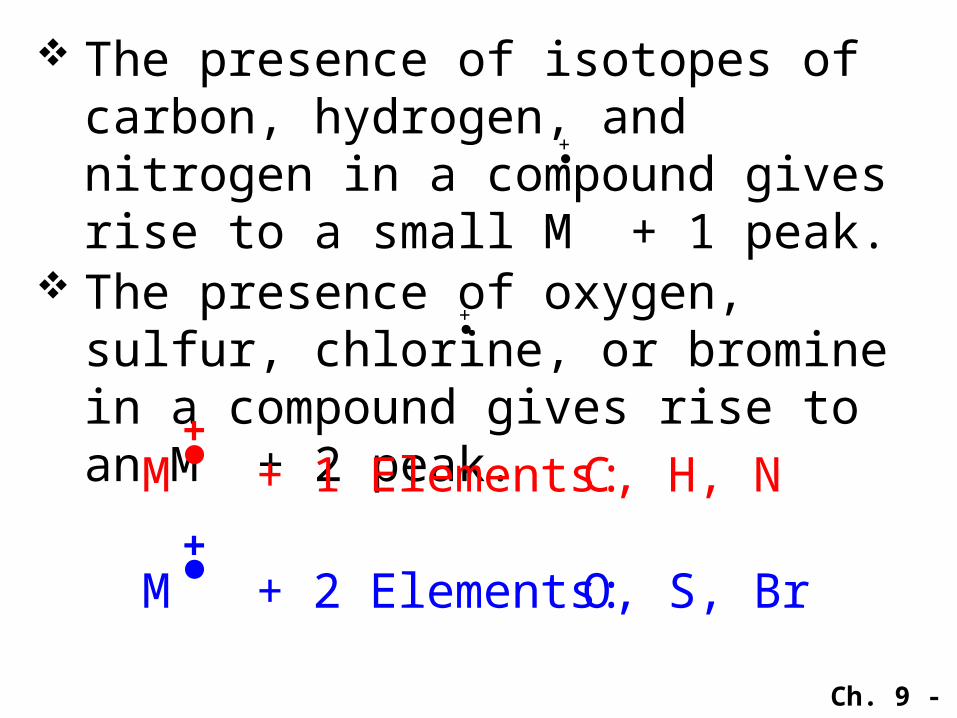
The presence of isotopes of carbon, hydrogen, and nitrogen in a compound gives rise to a small M + 1 peak.
The presence of oxygen, sulfur, chlorine, or bromine in a compound gives rise to an M + 2 peak.M + 1 Elements:
M + 2 Elements:
C, H, N
O, S, Br, Cl
+●
+●
Ch. 9 - 137
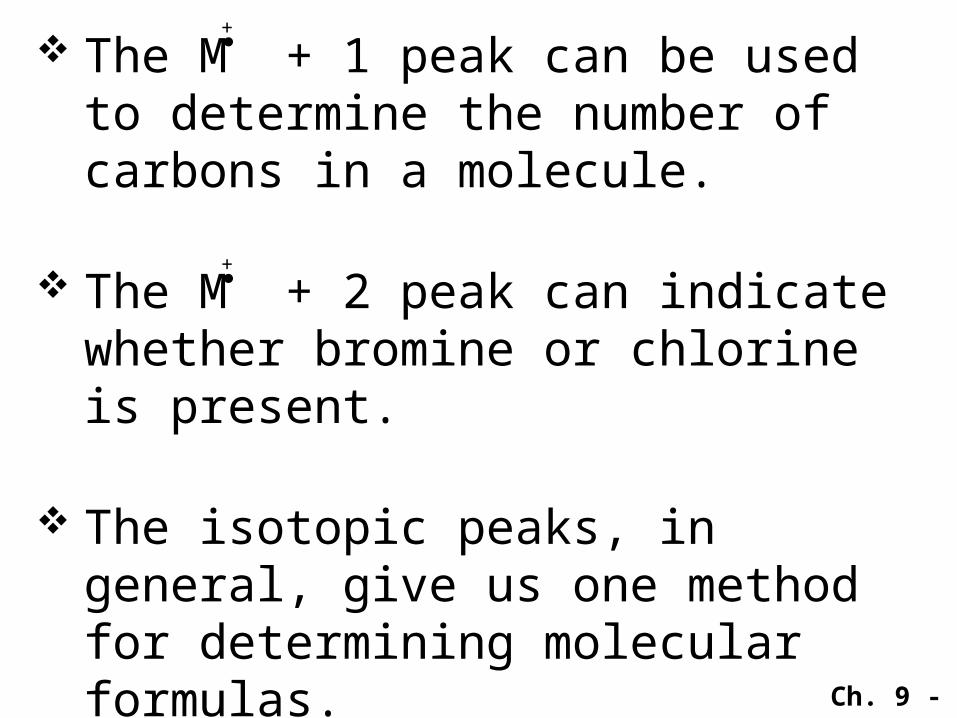
The M + 1 peak can be used to determine the number of carbons in a molecule.
The M + 2 peak can indicate whether bromine or chlorine is present.
The isotopic peaks, in general, give us one method for determining molecular formulas.
+●
+●
Ch. 9 - 138
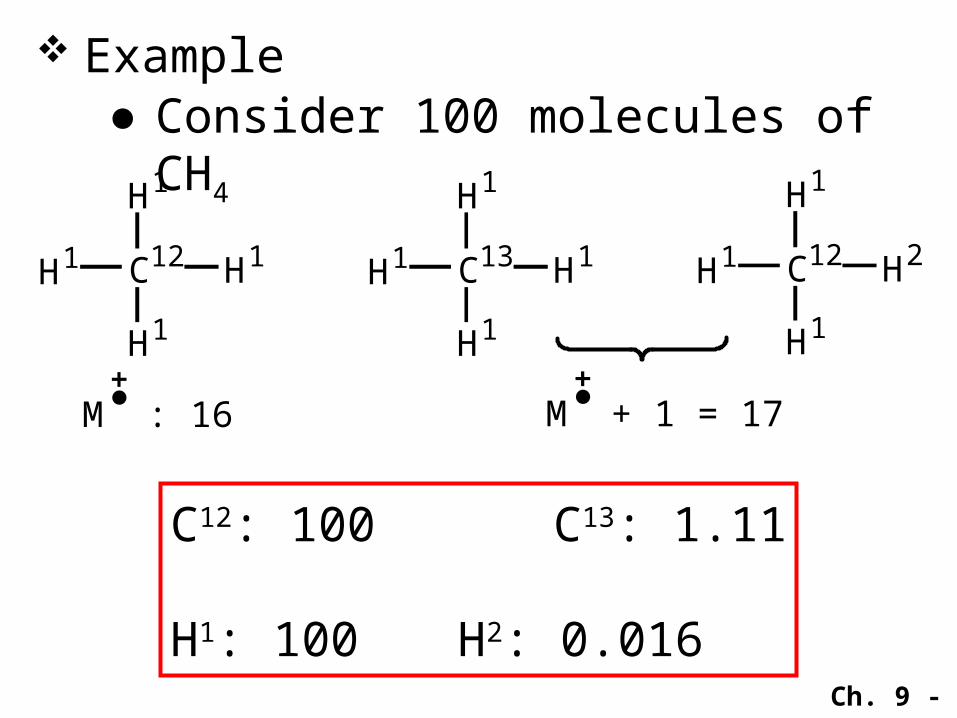
Example●Consider 100 molecules of CH4
M : 16
H1
C12H1 H1
H1
H1
C13H1 H1
H1
H1
C12H1 H2
H1
M + 1 = 17
C12: 100 C13: 1.11
H1: 100 H2: 0.016
Ch. 9 - 139
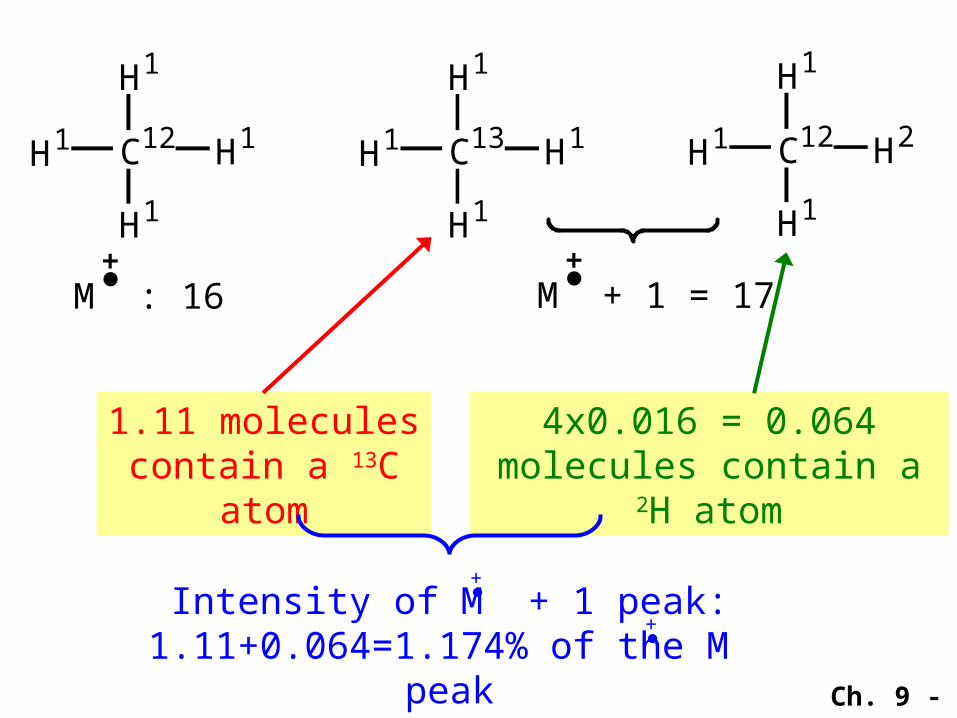
M : 16
H1
C12H1 H1
H1
H1
C13H1 H1
H1
H1
C12H1 H2
H1
M + 1 = 17
1.11 molecules contain a 13C
atom
4x0.016 = 0.064 molecules contain a 2H
atom
Intensity of M + 1 peak:1.11+0.064=1.174% of the M
peak
+●
+●

Ch. 9 - 140
≈
100
1.17
m/z
rela
tive ion a
bundance
M
M +1
+●
+●
Ch. 9 - 141
17B.17B.How To How To Determine the Molecular Determine the Molecular FormulaFormula
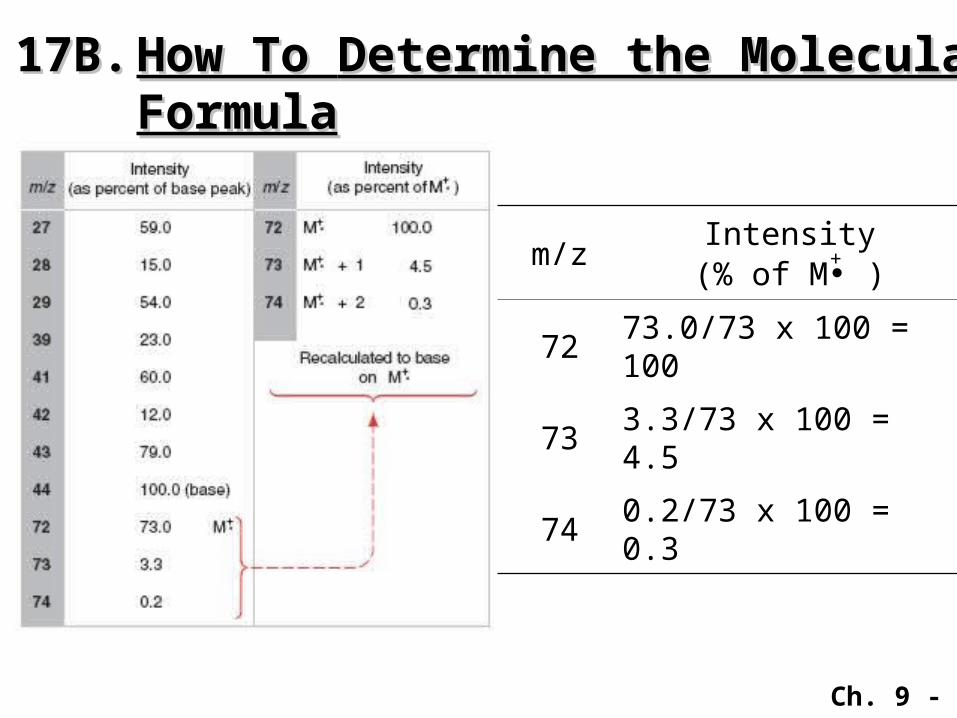
m/zIntensity(% of M )
72 73.0/73 x 100 = 100
73 3.3/73 x 100 = 4.5
74 0.2/73 x 100 = 0.3
+●
Ch. 9 - 142
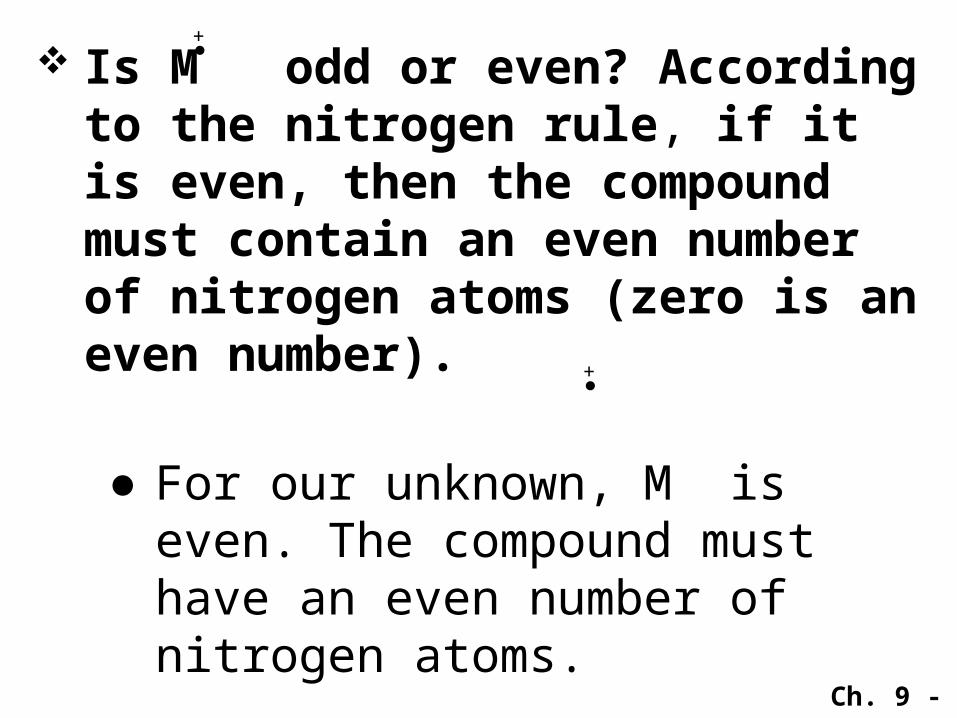
Is M odd or even? According to the nitrogen rule, if it is even, then the compound must contain an even number of nitrogen atoms (zero is an even number).
●For our unknown, M is even. The compound must have an even number of nitrogen atoms.
+●
+●
Ch. 9 - 143
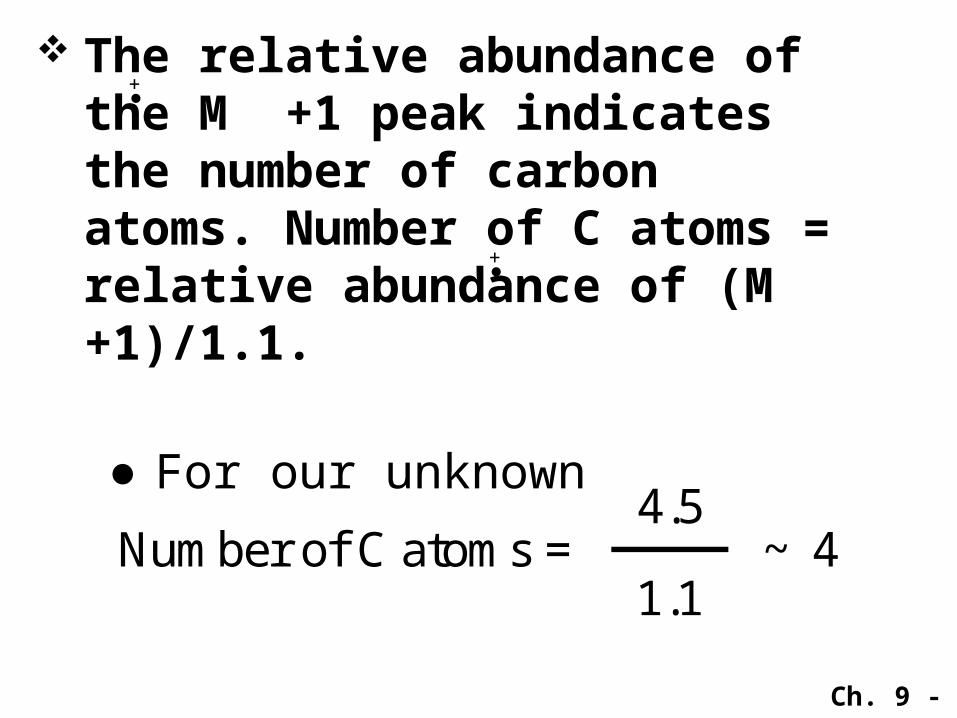
The relative abundance of the M +1 peak indicates the number of carbon atoms. Number of C atoms = relative abundance of (M +1)/1.1.
●For our unknown
Number of C atoms =4.5
1.1~ 4
+●
+●

Ch. 9 - 144
The relative abundance of the M +2 peak indicates the presence (or absence) of S (4.4%), Cl (33%), or Br (98%).● For our unknown M +2 = 0.3%;
thus, we can assume that S, Cl, and Br are absent.
The molecular formula can now be established by determining the number of hydrogen atoms and adding the appropriate number of oxygen atoms, if necessary.
+●
+●

Ch. 9 - 145
Since M is m/z 72 molecular weight = 72.
As determined using the relative abundance of M +1 peak, number of carbons present is 4.
Using the “nitrogen rule”, this unknown must have an even number of N. Since M.W. = 72, and there are 4 C present, (12 x 4 = 48), adding 2 “N” will be greater than the M.W. of the unknown. Thus, this unknown contains zero “N”.
+●
+●
Ch. 9 - 146
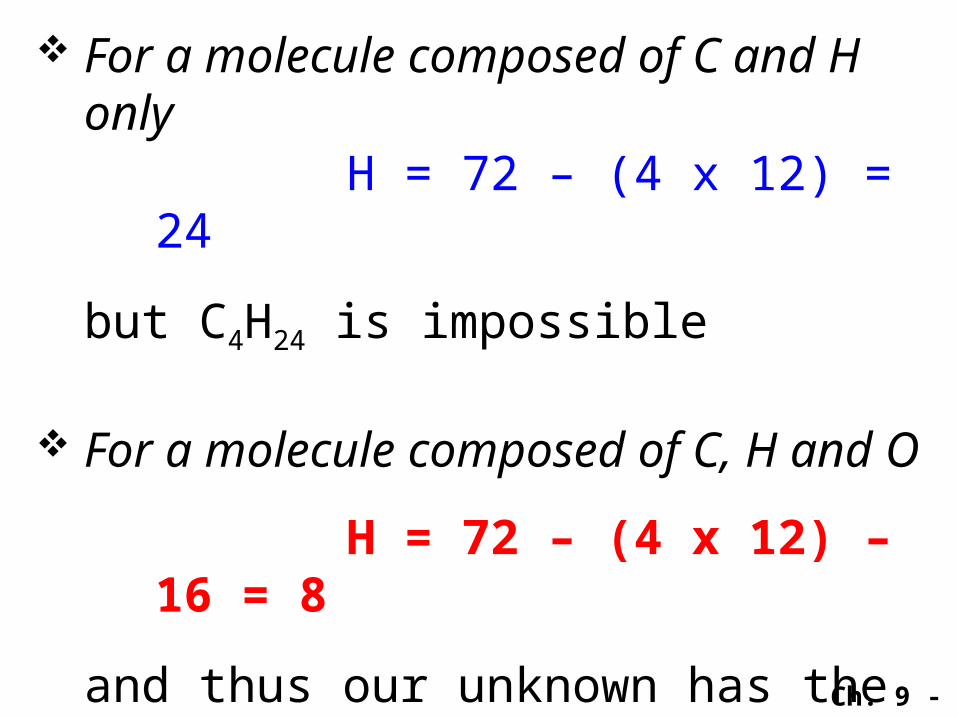
For a molecule composed of C and H only
H = 72 – (4 x 12) = 24
but C4H24 is impossible
For a molecule composed of C, H and O
H = 72 – (4 x 12) – 16 = 8
and thus our unknown has the molecular formula C4H8O.
Ch. 9 - 147
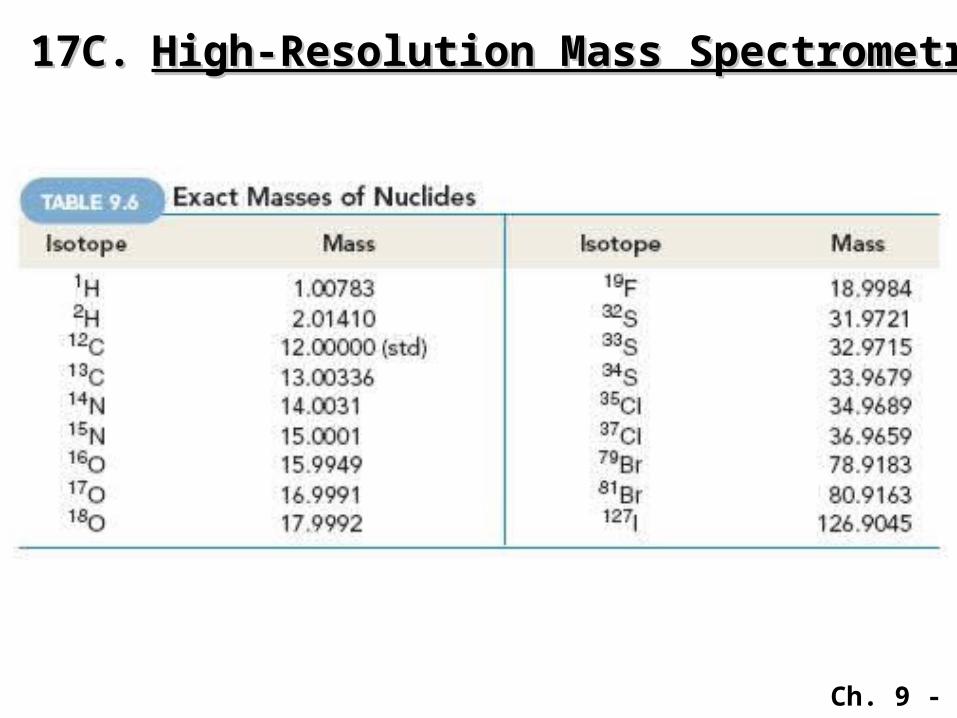
17C.17C. High-Resolution Mass SpectrometryHigh-Resolution Mass Spectrometry
Ch. 9 - 148
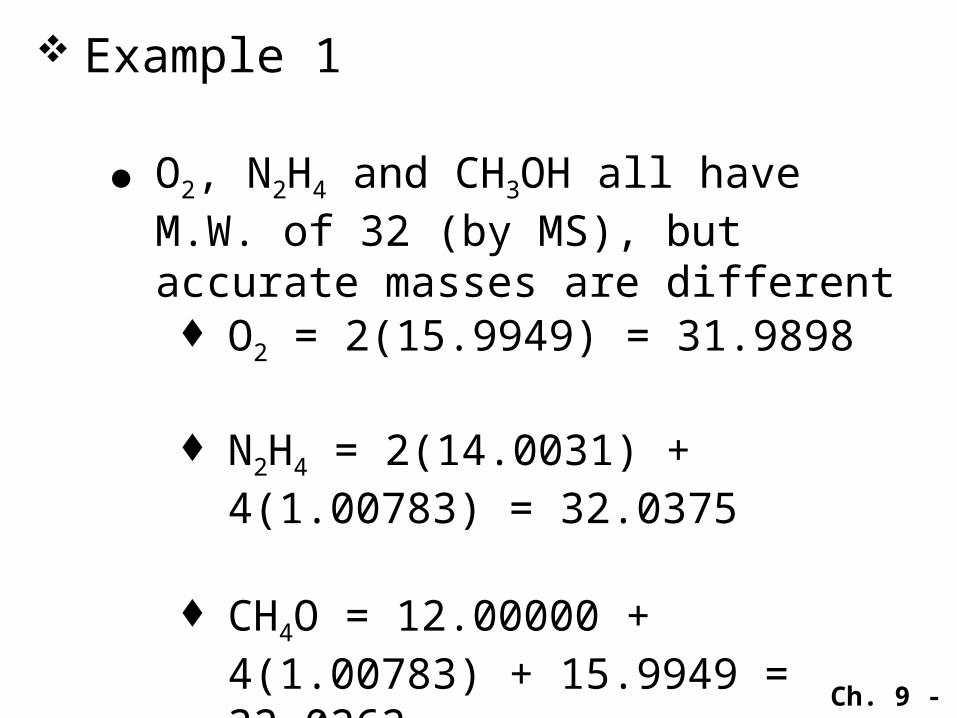
Example 1
● O2, N2H4 and CH3OH all have M.W. of 32 (by MS), but accurate masses are different O2 = 2(15.9949) = 31.9898
N2H4 = 2(14.0031) + 4(1.00783) = 32.0375
CH4O = 12.00000 + 4(1.00783) + 15.9949 = 32.0262
Ch. 9 - 149
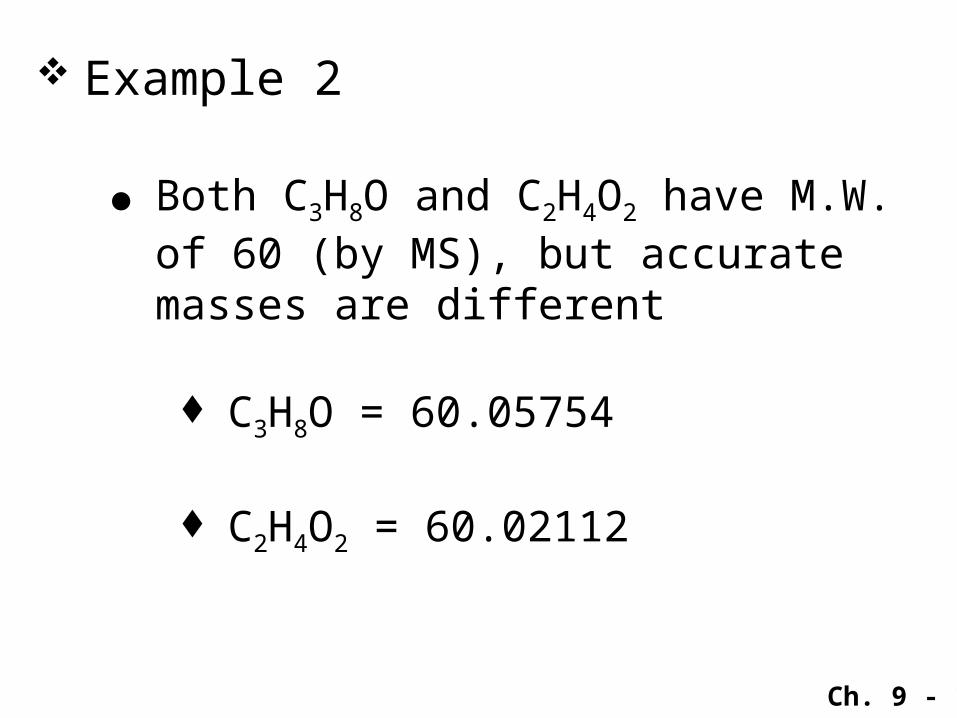
Example 2
● Both C3H8O and C2H4O2 have M.W. of 60 (by MS), but accurate masses are different
C3H8O = 60.05754
C2H4O2 = 60.02112
Ch. 9 - 150
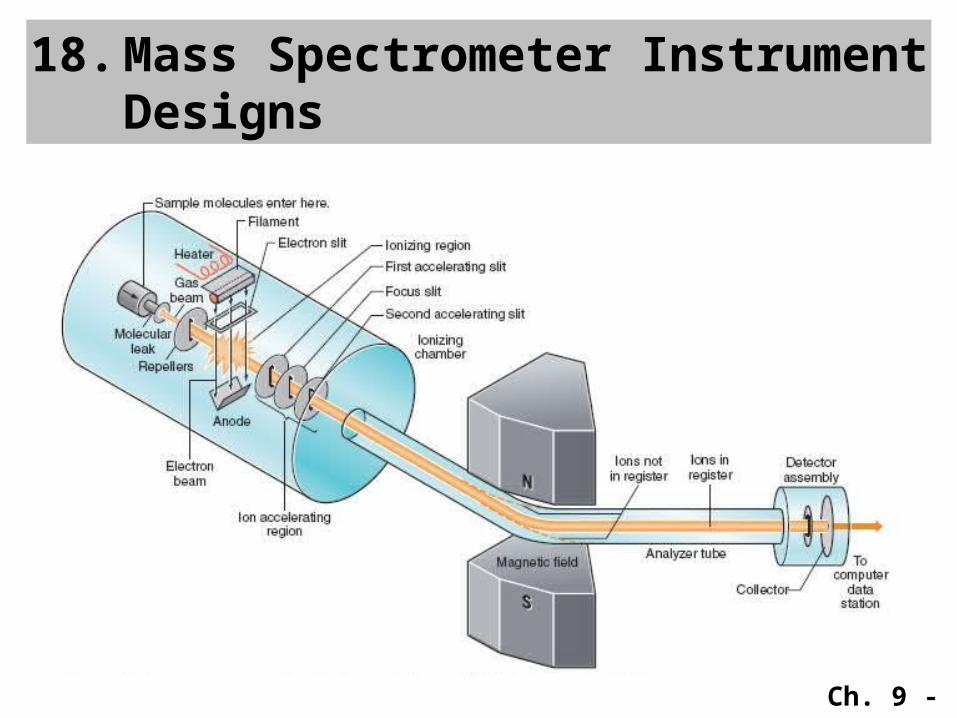
18. Mass Spectrometer Instrument Designs
Ch. 9 - 151
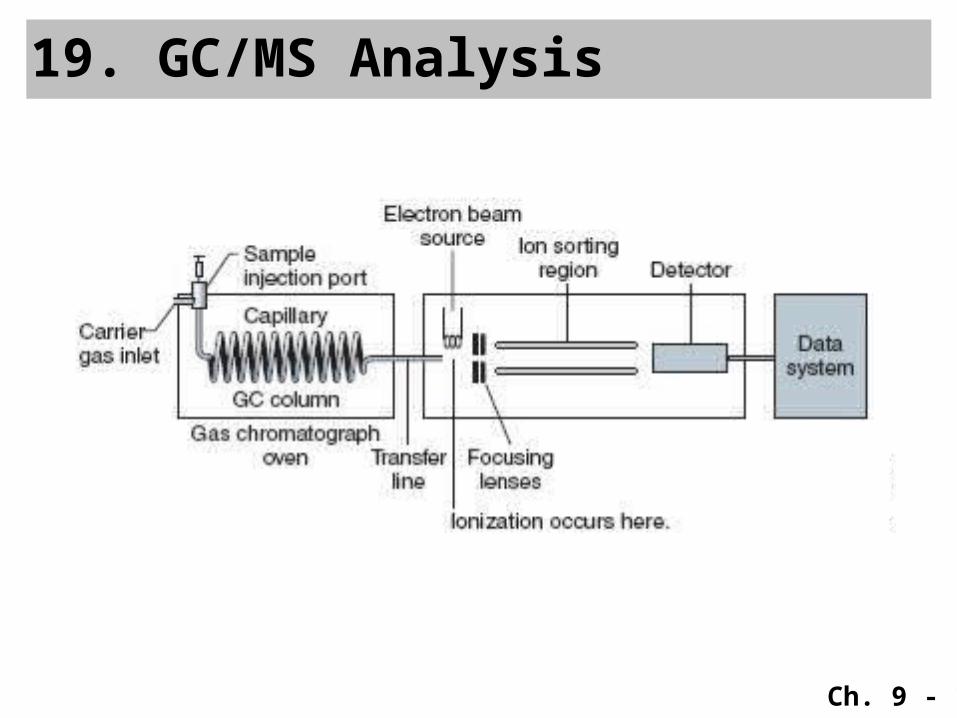
19. GC/MS Analysis

Ch. 9 - 152
END OF CHAPTER 9