Embed Size (px)
Citation preview
Chapter 9, 4th edition Chapter 10, 3rd edition
Banking and the Management of
Financial Institutions
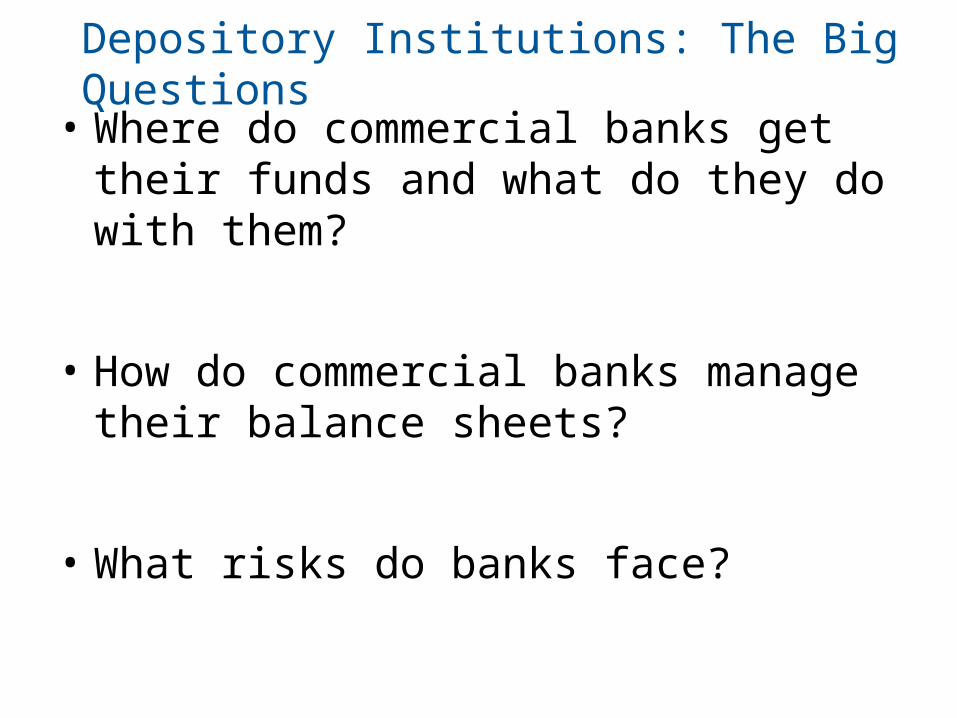
Depository Institutions: The Big Questions
• Where do commercial banks get their funds and what do they do with them?
• How do commercial banks manage their balance sheets?
• What risks do banks face?
Balance Sheet of Commercial Banks: Assets, Liabilities, and Capital
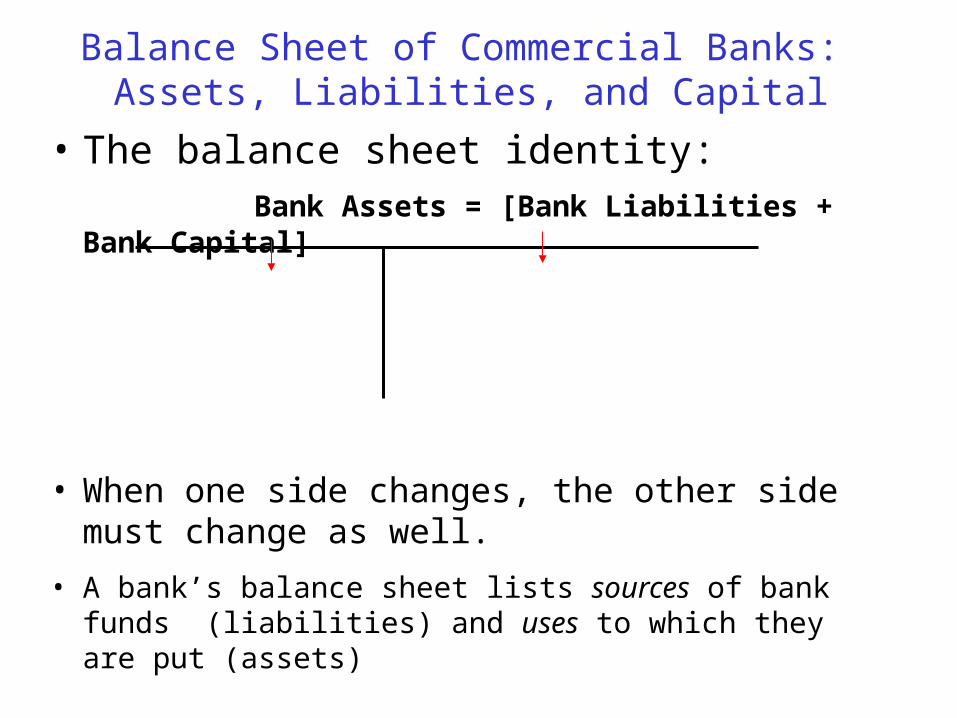
• The balance sheet identity: Bank Assets = [Bank Liabilities + Bank Capital]
• When one side changes, the other side must change as well.
• A bank’s balance sheet lists sources of bank funds (liabilities) and uses to which they are put (assets)
© 2012 Pearson Prentice Hall. All rights reserved. 17-4
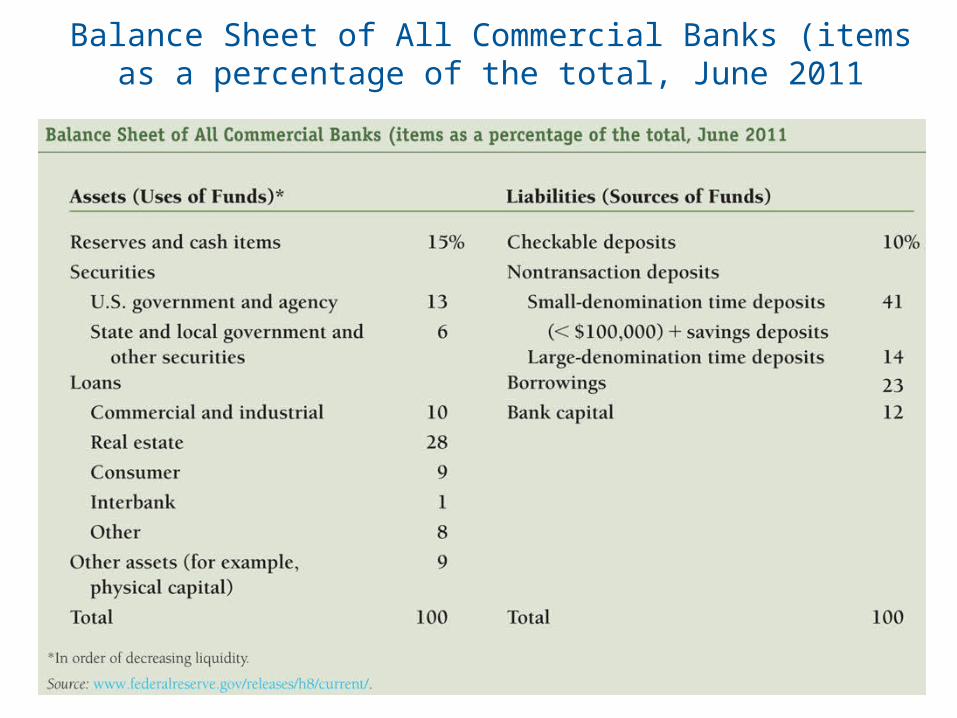
Balance Sheet of All Commercial Banks (items as a percentage of the total, June 2011
© 2012 Pearson Prentice Hall. All rights reserved. 17-5
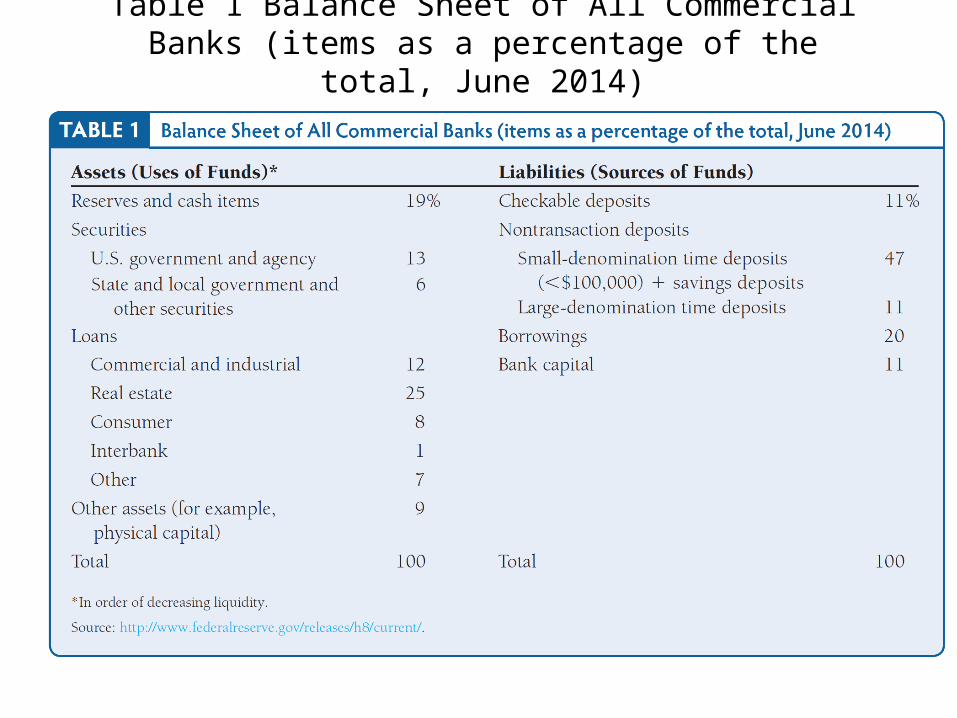
Table 1 Balance Sheet of All Commercial Banks (items as a percentage of the total, June 2014)
Liabilities – Sources of Funds
Checkable Deposits: Referred to as transactions deposits, includes all accounts that allow the owner (depositor) to write checks to third parties; ─ Include non-interest earning checking accounts (known as -
demand deposit accounts),
─ Interest earning negotiable orders of withdrawal (NOW) accounts, and
─ Money-market deposit accounts (MMDAs), which typically pay the most interest among checkable deposit accounts
─ About 11% of bank source of funds
Liabilities – Sources of Funds
Non-transaction Deposits: generally a bank’s highest cost funds.
Banks want deposits which are more stable and predictable and will pay more to attract such funds.
Also the largest source of funds ~ 58%
Liabilities – Sources of Funds Borrowings:
Banks borrow from:─ the Federal Reserve System: discount loans
─ other banks: Fed funds and repos
─ Corporations: Repos and commercial paper
─ About 20% of bank source of funds
Bank Capital – Source of Funds Bank Capital: the source of funds supplied by the
bank owners, ─ either through purchase of ownership shares or
retained earnings
Bank capital provides a cushion, thus capital levels are important.
About 11% of bank source of funds
Currently a very important topic in bank regulation
Assets – Uses of Funds Reserves: funds held in account with the Fed
(vault cash and cash in the ATM machine is included).
Required reserves represent what is required by law - reserve requirement or required reserve ratios.
Any reserves beyond this are called excess reserves.
About 19% of bank assets.
Assets – Uses of Funds
Securities: includes U.S. government debt, agency debt, municipal debt, and other (non-equity) securities.
About 19% of assets.
Short-term Treasury debt (Treasury Bills) is often referred to as secondary reserves because of its high liquidity.
Assets – Uses of Funds
Loans: business loans, auto loans, and mortgages.
Generally not very liquid.
About 53% of bank assets.
Most banks tend to specialize in either consumer loans or business loans, and even take that as far as loans to specific groups (such as a particular industry).
Assets – Uses of Funds
Other Assets: bank buildings, computer systems, and other equipment.
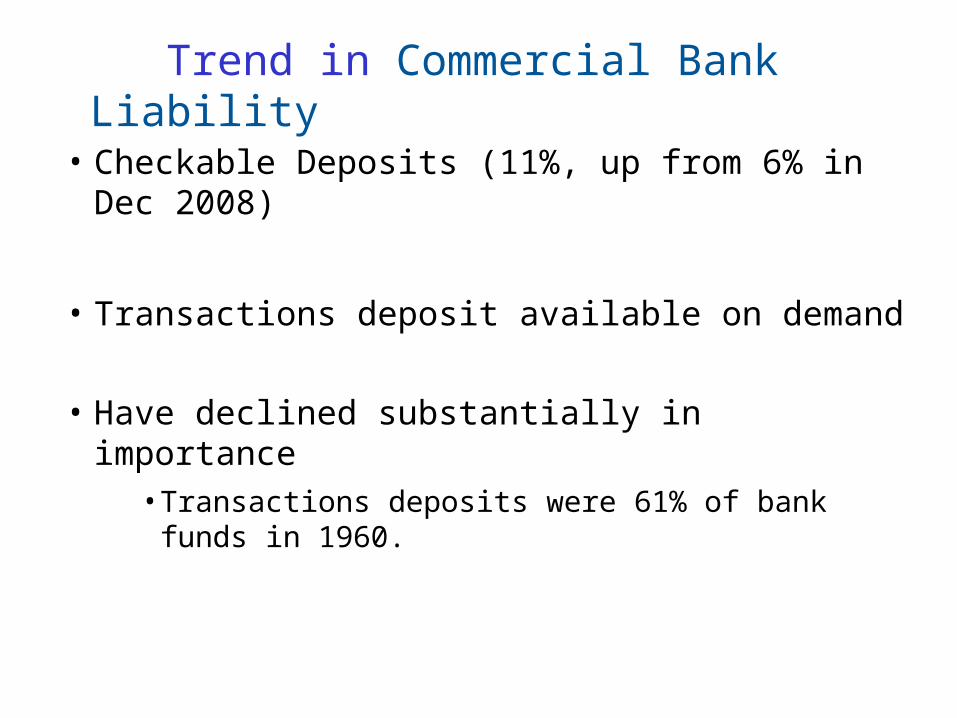
Trend in Commercial Bank Liability
• Checkable Deposits (11%, up from 6% in Dec 2008)
• Transactions deposit available on demand
• Have declined substantially in importance• Transactions deposits were 61% of bank funds
in 1960.
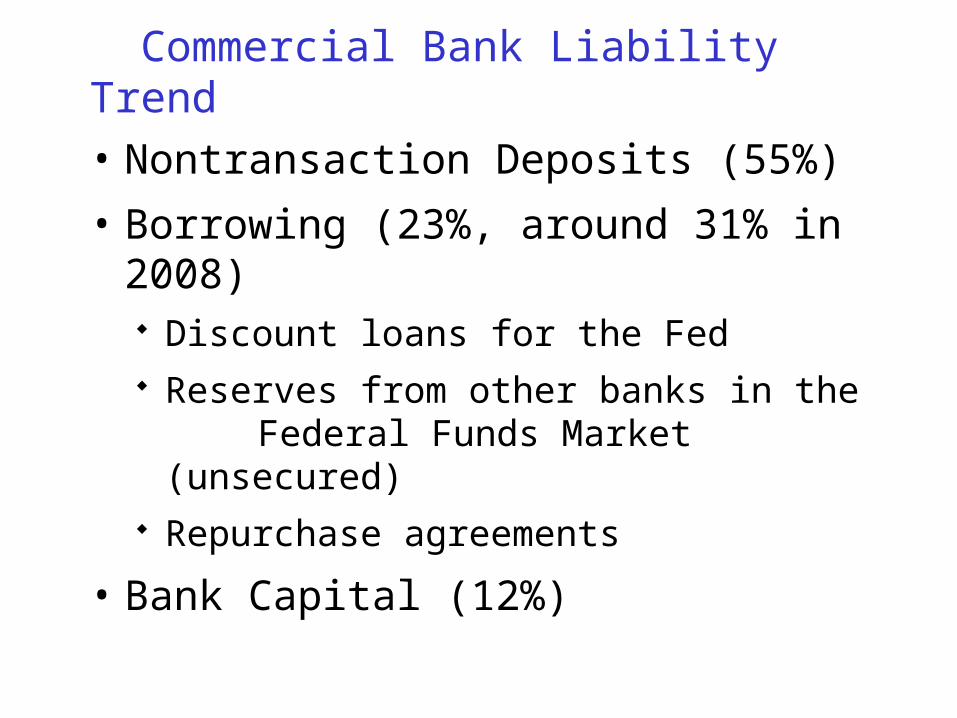
Commercial Bank Liability Trend
• Nontransaction Deposits (55%)
• Borrowing (23%, around 31% in 2008) Discount loans for the Fed Reserves from other banks in the
Federal Funds Market (unsecured) Repurchase agreements
• Bank Capital (12%)
© 2012 Pearson Prentice Hall. All rights reserved. 17-17
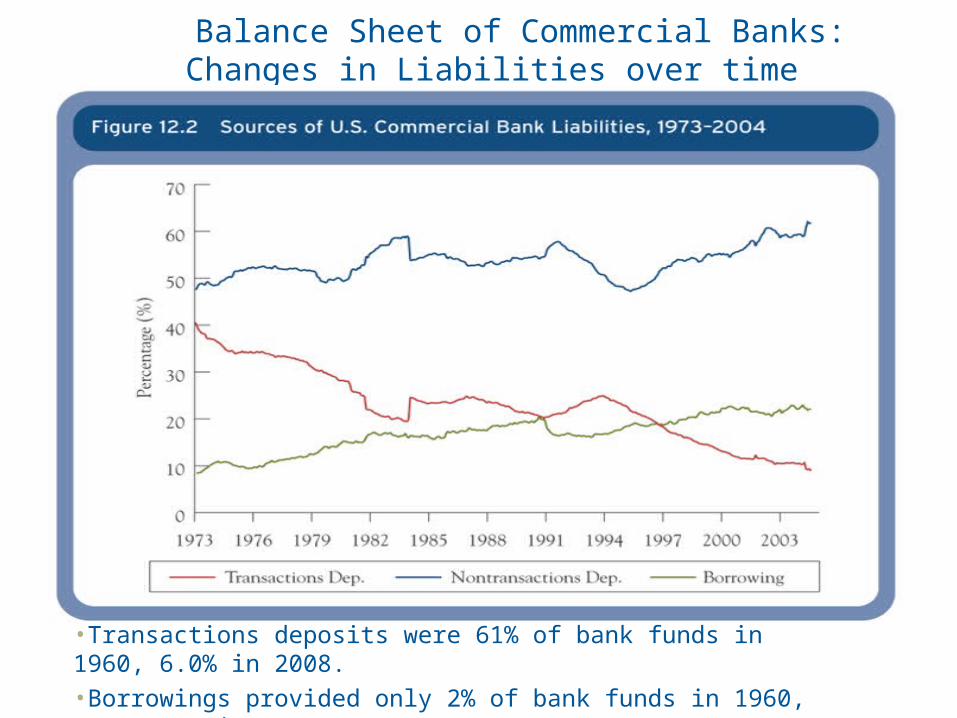
Balance Sheet of Commercial Banks: Changes in Liabilities over time
•Transactions deposits were 61% of bank funds in 1960, 6.0% in 2008.
•Borrowings provided only 2% of bank funds in 1960, up to 31% in 2008.
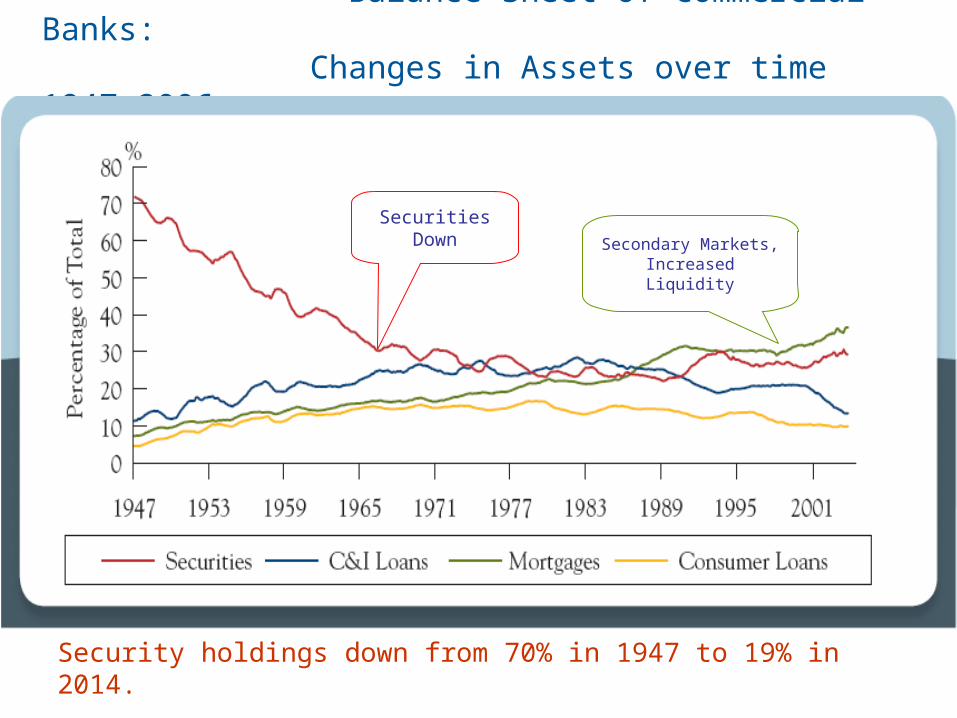
Balance Sheet of Commercial Banks: Changes in Assets over time 1947-2006
Securities DownSecondary Markets, Increased Liquidity
Security holdings down from 70% in 1947 to 19% in 2014.
Loans( C&I, mortgage, and consumer loans) over 50%.
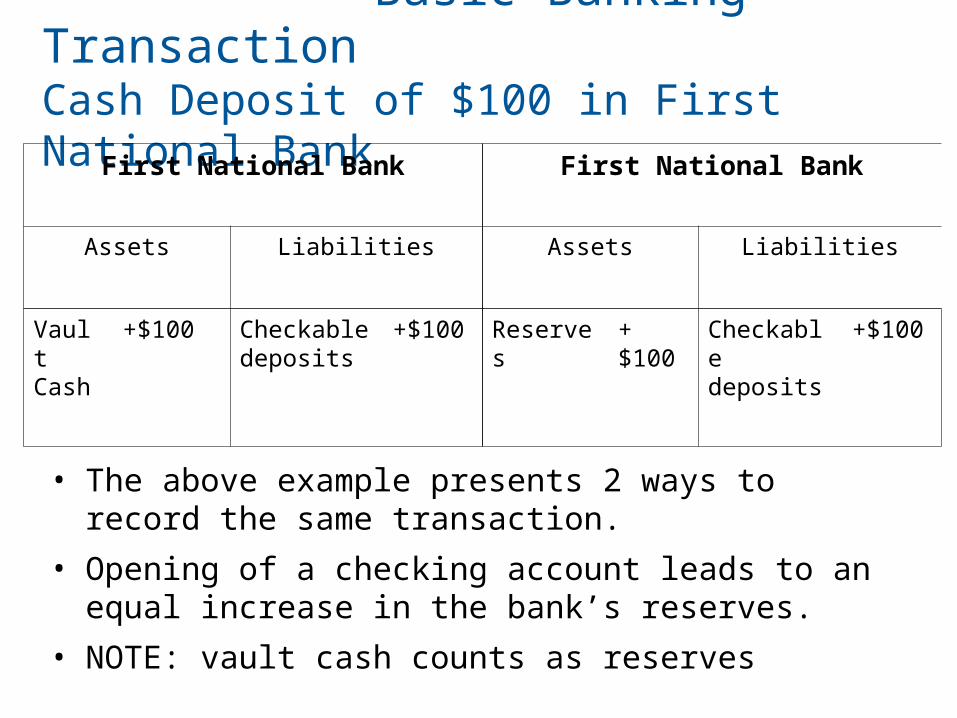
Basic Banking Transaction Cash Deposit of $100 in First National Bank
• The above example presents 2 ways to record the same transaction.
• Opening of a checking account leads to an equal increase in the bank’s reserves.
• NOTE: vault cash counts as reserves
First National Bank First National Bank
Assets Liabilities Assets Liabilities
Vault Cash
+$100 Checkable deposits
+$100 Reserves +$100 Checkable deposits
+$100
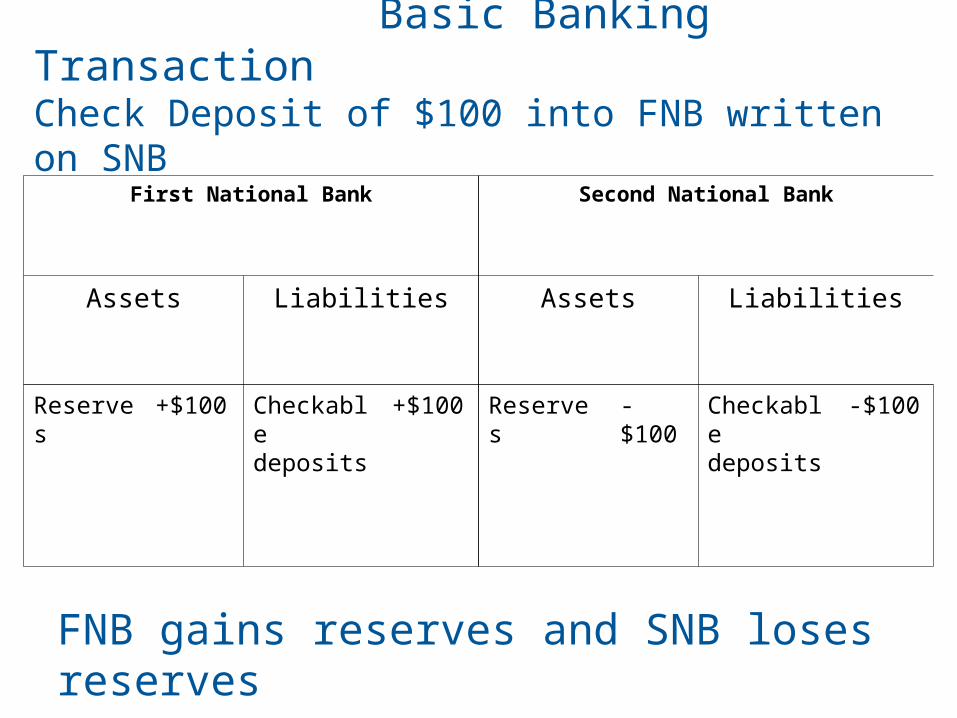
First National Bank Second National Bank
Assets Liabilities Assets Liabilities
Reserves +$100 Checkable deposits
+$100 Reserves -$100 Checkable deposits
-$100
Basic Banking Transaction Check Deposit of $100 into FNB written on SNB
FNB gains reserves and SNB loses reserves
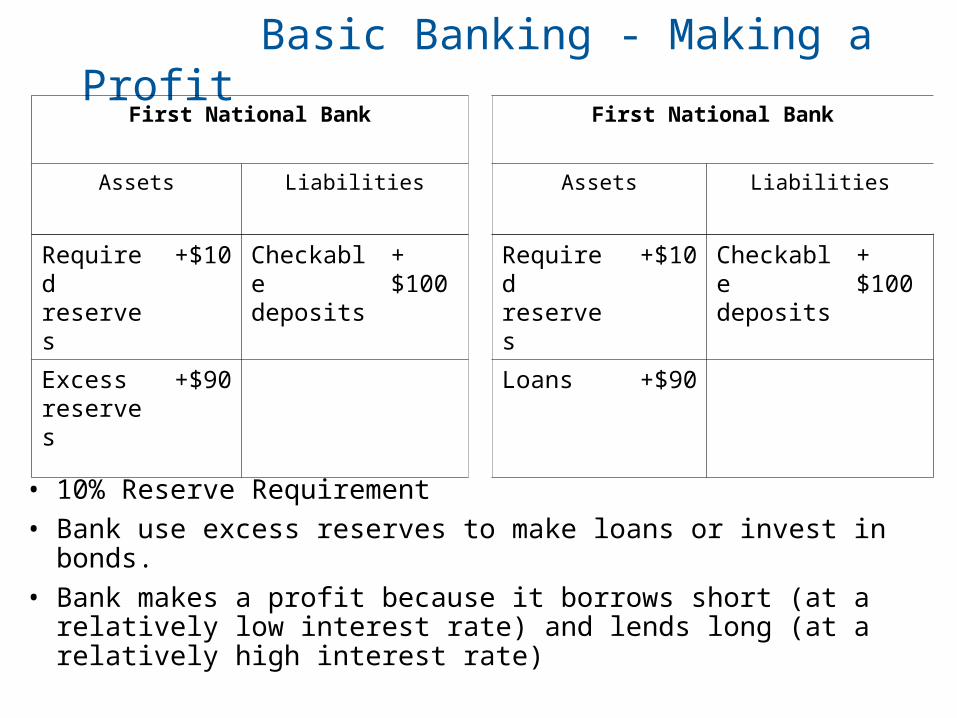
Basic Banking - Making a Profit
• 10% Reserve Requirement
• Bank use excess reserves to make loans or invest in bonds.
• Bank makes a profit because it borrows short (at a relatively low interest rate) and lends long (at a relatively high interest rate)
First National Bank First National Bank
Assets Liabilities Assets Liabilities
Required reserves
+$10 Checkable deposits
+$100 Required reserves
+$10 Checkable deposits
+$100
Excess reserves
+$90 Loans +$90
General Principles of Bank Management
• The basic operation of a bank -
• Make profits by: Selling liabilities with one set of characteristics
(liquidity, risk ,size, return). [Source of Funds] Buying assets with a different set of
characteristics. (liquidity, risk ,size, return). [Use of Funds]
Process known as “asset transformation” also referred to as maturity transformation
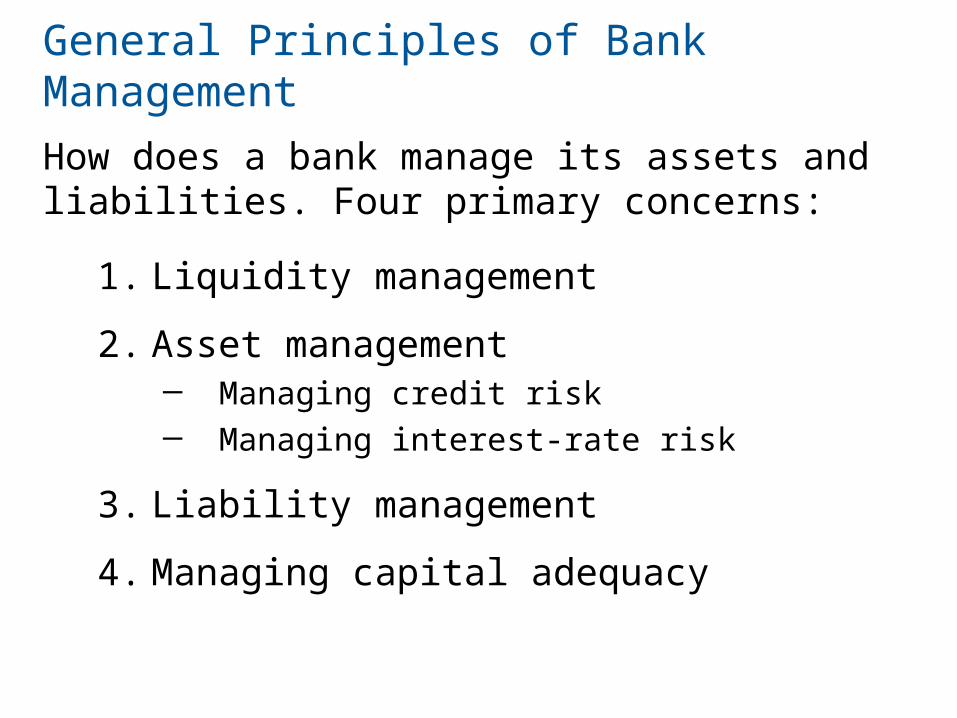
General Principles of Bank Management
1. Liquidity management
2. Asset management─ Managing credit risk─ Managing interest-rate risk
3. Liability management
4. Managing capital adequacy
How does a bank manage its assets and liabilities. Four primary concerns:
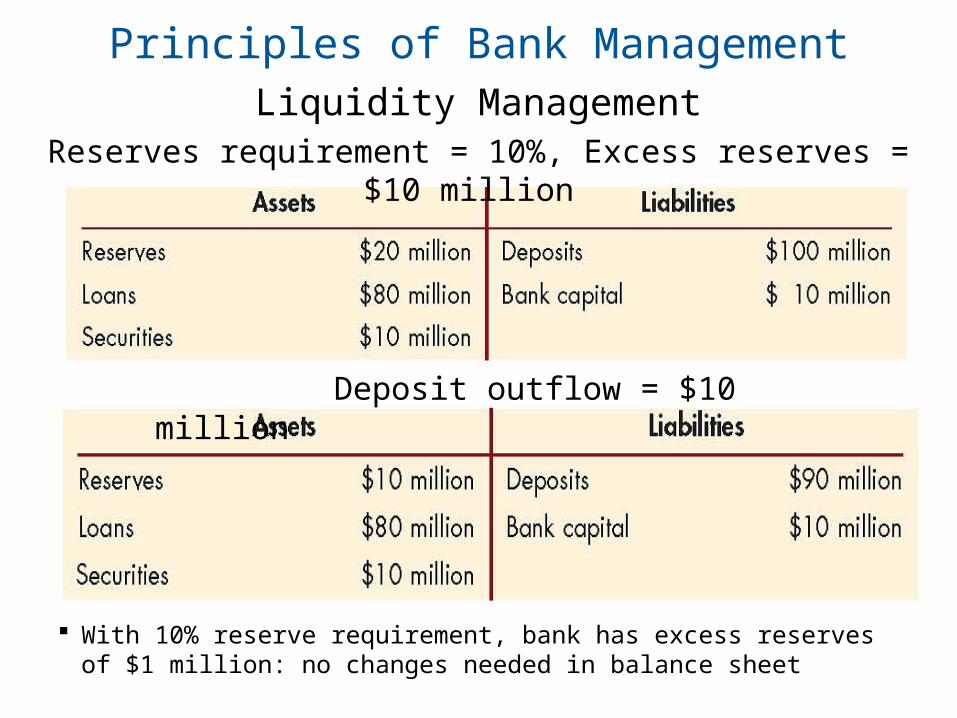
Principles of Bank ManagementLiquidity Management
Reserves requirement = 10%, Excess reserves = $10 million
With 10% reserve requirement, bank has excess reserves of $1 million: no changes needed in balance sheet
Deposit outflow = $10 million
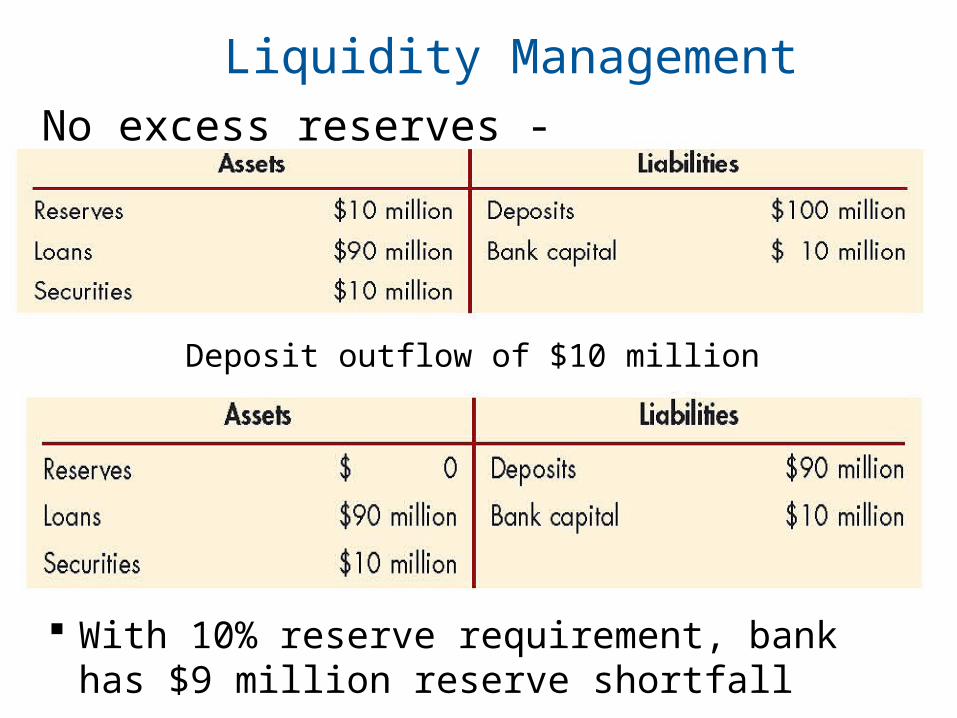
Liquidity Management
With 10% reserve requirement, bank has $9 million reserve shortfall
No excess reserves -
Deposit outflow of $10 million
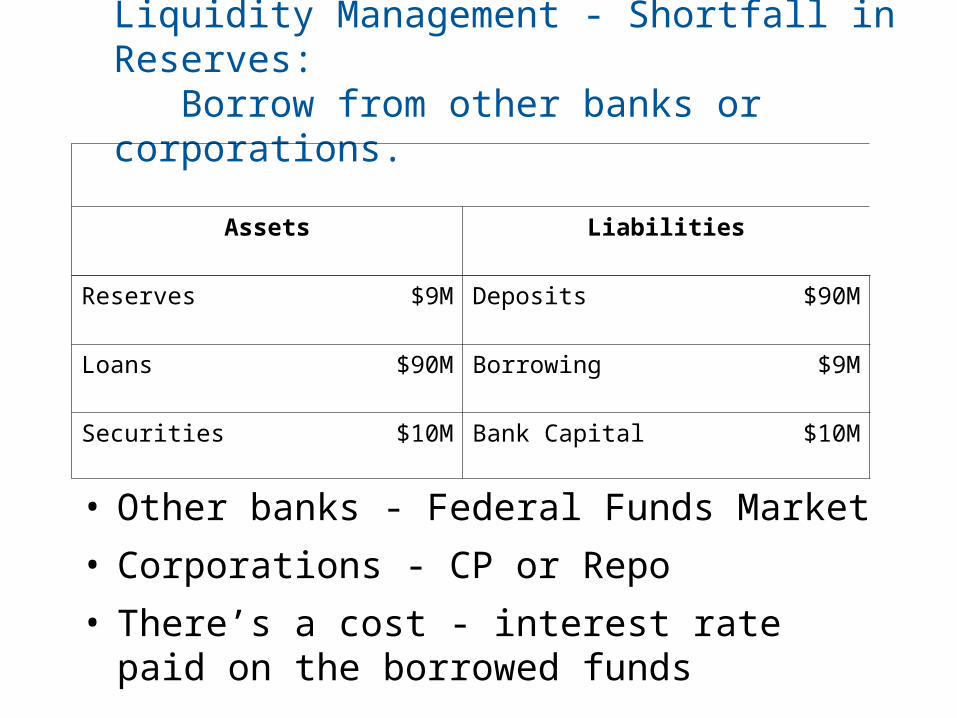
Liquidity Management - Shortfall in Reserves: Borrow from other banks or corporations.
• Other banks - Federal Funds Market
• Corporations - CP or Repo
• There’s a cost - interest rate paid on the borrowed funds
Assets Liabilities
Reserves $9M Deposits $90M
Loans $90M Borrowing $9M
Securities $10M Bank Capital $10M
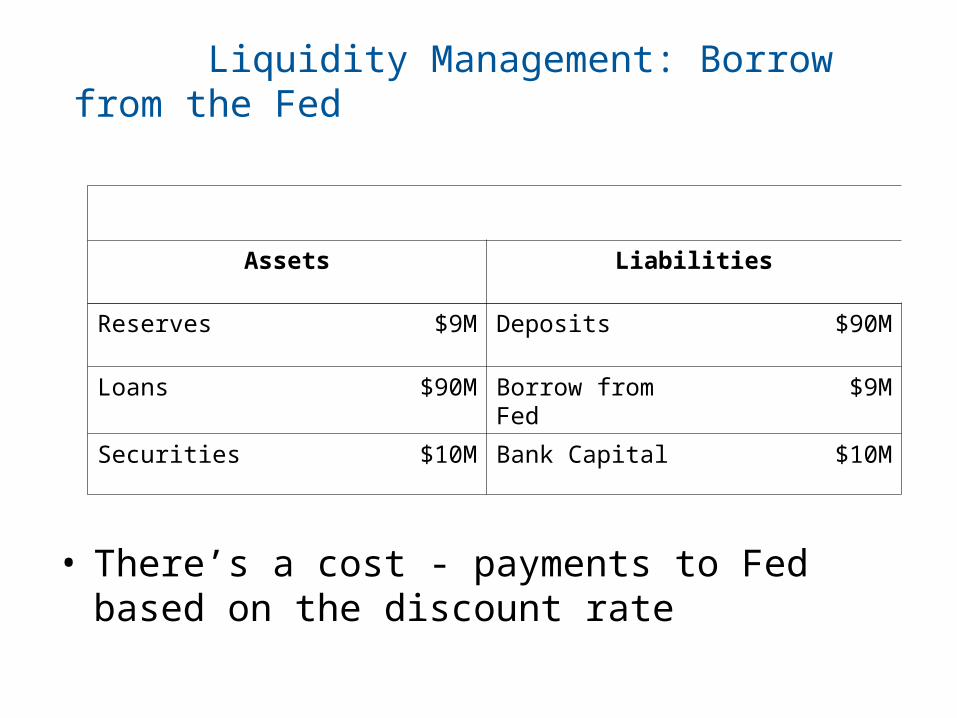
Liquidity Management: Borrow from the Fed
• There’s a cost - payments to Fed based on the discount rate
Assets Liabilities
Reserves $9M Deposits $90M
Loans $90M Borrow from Fed $9M
Securities $10M Bank Capital $10M
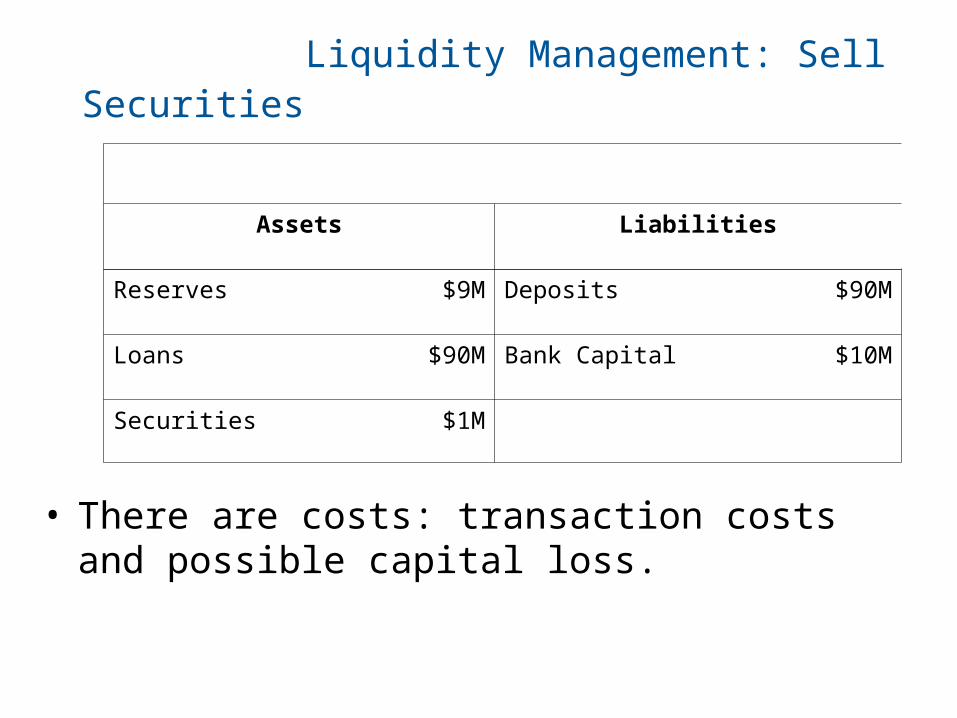
Liquidity Management: Sell Securities
• There are costs: transaction costs and possible capital loss.
Assets Liabilities
Reserves $9M Deposits $90M
Loans $90M Bank Capital $10M
Securities $1M
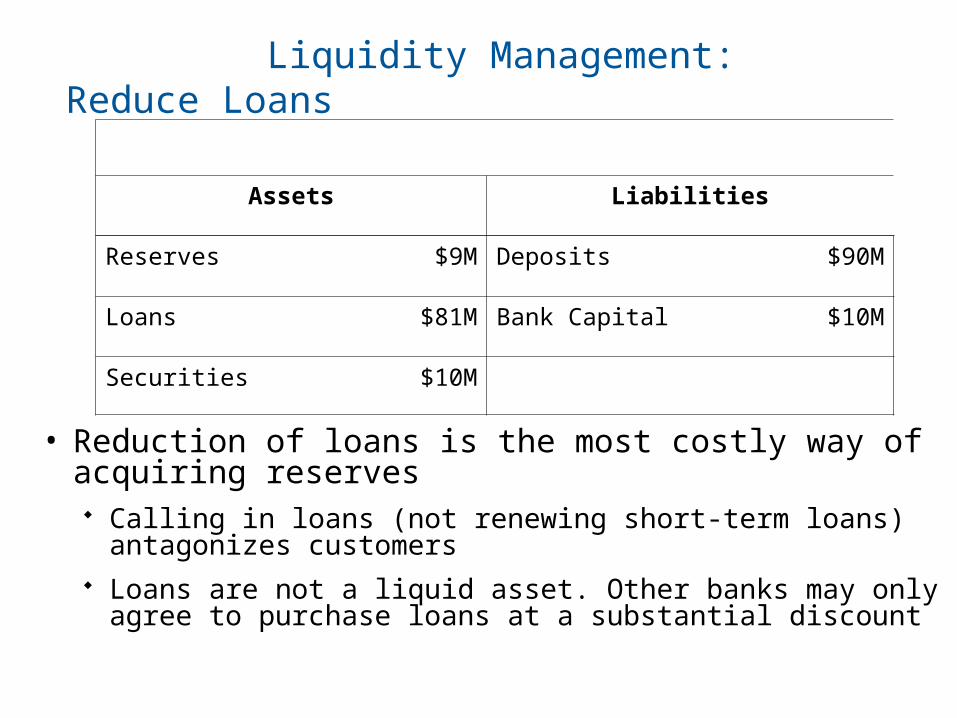
Liquidity Management: Reduce Loans
• Reduction of loans is the most costly way of acquiring reserves Calling in loans (not renewing short-term loans)
antagonizes customers Loans are not a liquid asset. Other banks may only agree to
purchase loans at a substantial discount
Assets Liabilities
Reserves $9M Deposits $90M
Loans $81M Bank Capital $10M
Securities $10M
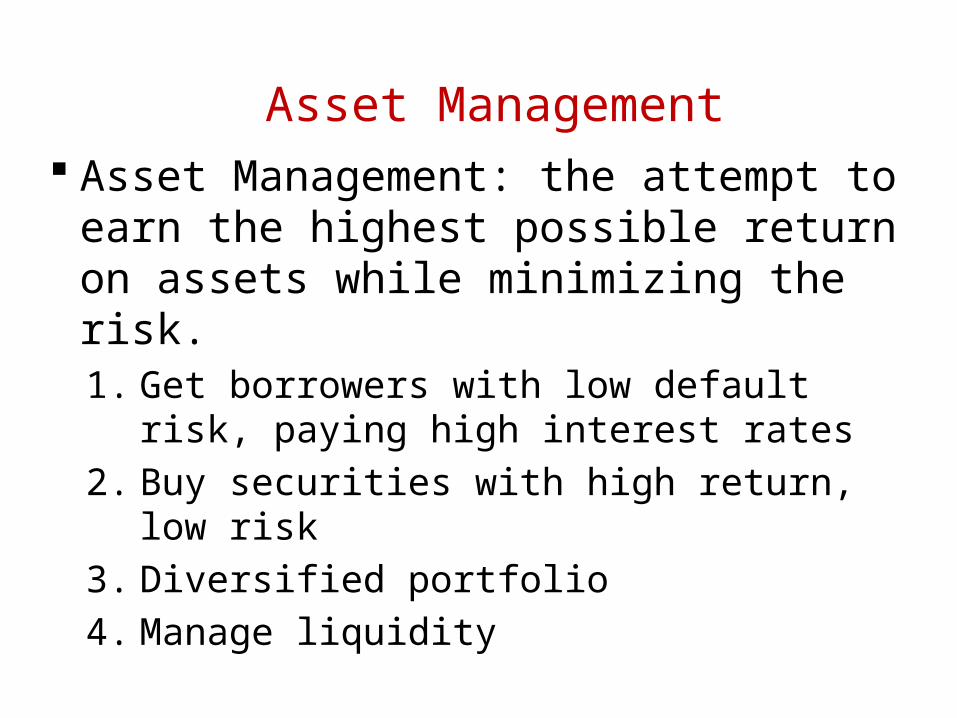
Asset Management Asset Management: the attempt to earn the
highest possible return on assets while minimizing the risk.1. Get borrowers with low default risk, paying
high interest rates
2. Buy securities with high return, low risk
3. Diversified portfolio
4. Manage liquidity
Asset Management - Credit Risk: Overcoming Adverse Selection and Moral Hazard
• Screening and information collection
• Specialization in lending (e.g. energy sector)
• Diversification - by industry and geography
• Monitoring and enforcement of restrictive covenants
• Long-term customer relationships
• Collateral and compensating balances
Liability Management
Managing the source of funds: from deposits, to CDs, to other debt.1. Important since 1960s
2. No longer primarily depend on deposits
3. More dependent on non-transactions deposits and borrowing.
─ Growth in borrowing from 2% in 1960 to 31% in 2008.
─ Negotiable CDs at 19%
Bank Capital (Equity)
• Assets – Liabilities = Net Worth
• Called Bank Capital. The value of the bank to its owners.
• In Jan 2007, commercial bank capital was $860 billion equal to 8.8% of total assets of $9.77 Trillion)
• June 2011 bank capital at 12% of assets
Capital Adequacy Management
• Bank capital is a cushion that helps prevent bank failure. As banks write down assets, bank capital
takes a hit.
• Regulatory requirement – regulators set minimum capital requirements.
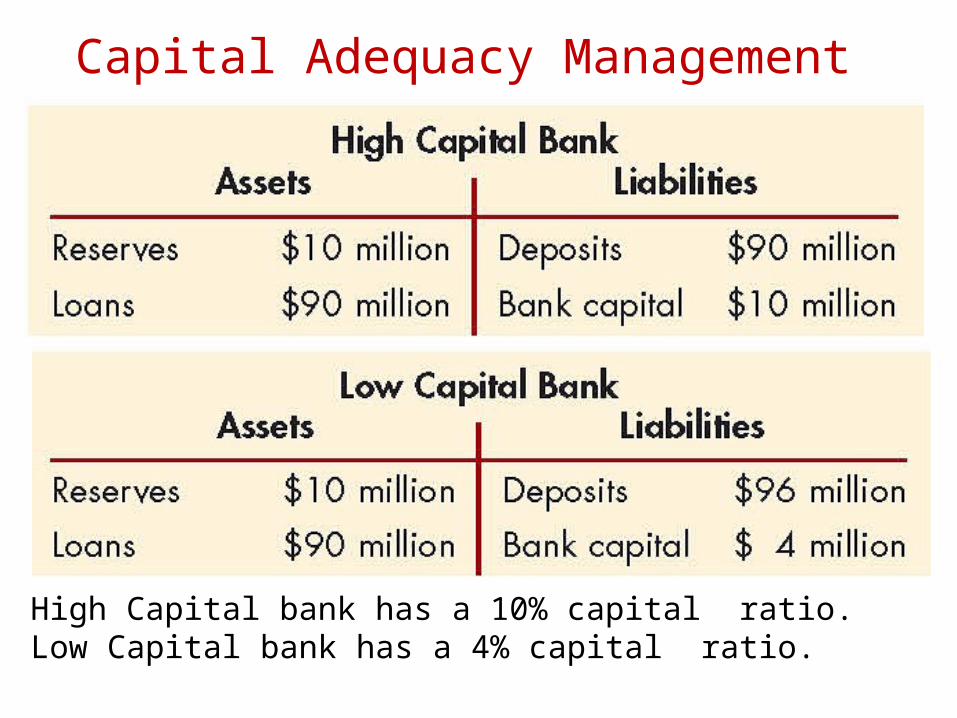
Capital Adequacy Management
High Capital bank has a 10% capital ratio.Low Capital bank has a 4% capital ratio.
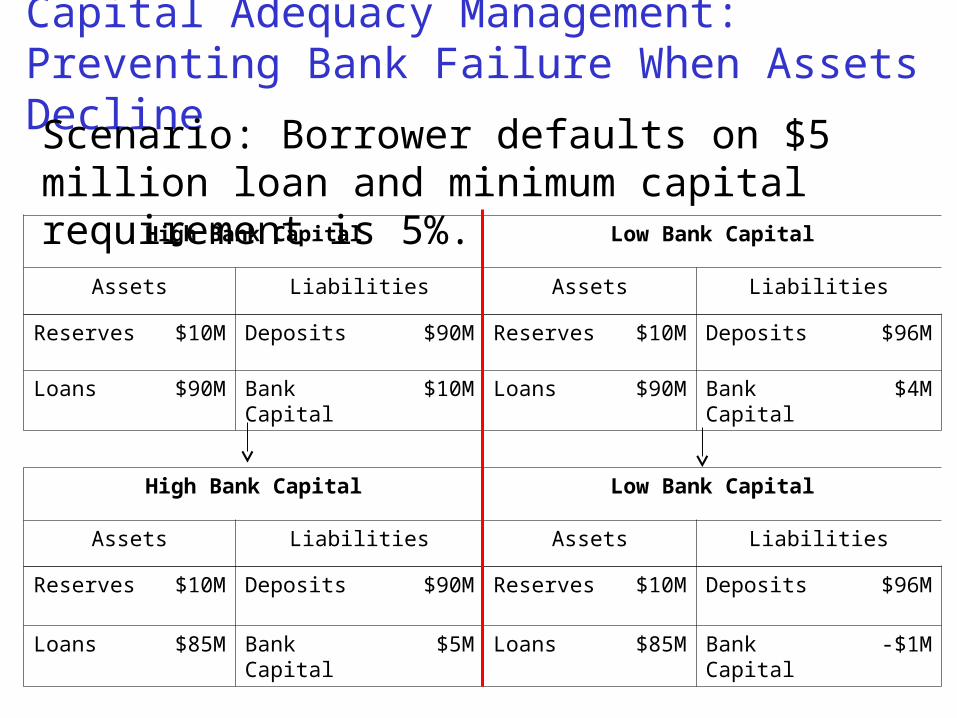
Capital Adequacy Management: Preventing Bank Failure When Assets Decline
High Bank Capital Low Bank Capital
Assets Liabilities Assets Liabilities
Reserves $10M Deposits $90M Reserves $10M Deposits $96M
Loans $90M Bank Capital $10M Loans $90M Bank Capital $4M
High Bank Capital Low Bank Capital
Assets Liabilities Assets Liabilities
Reserves $10M Deposits $90M Reserves $10M Deposits $96M
Loans $85M Bank Capital $5M Loans $85M Bank Capital -$1M
Scenario: Borrower defaults on $5 million loan and minimum capital requirement is 5%.
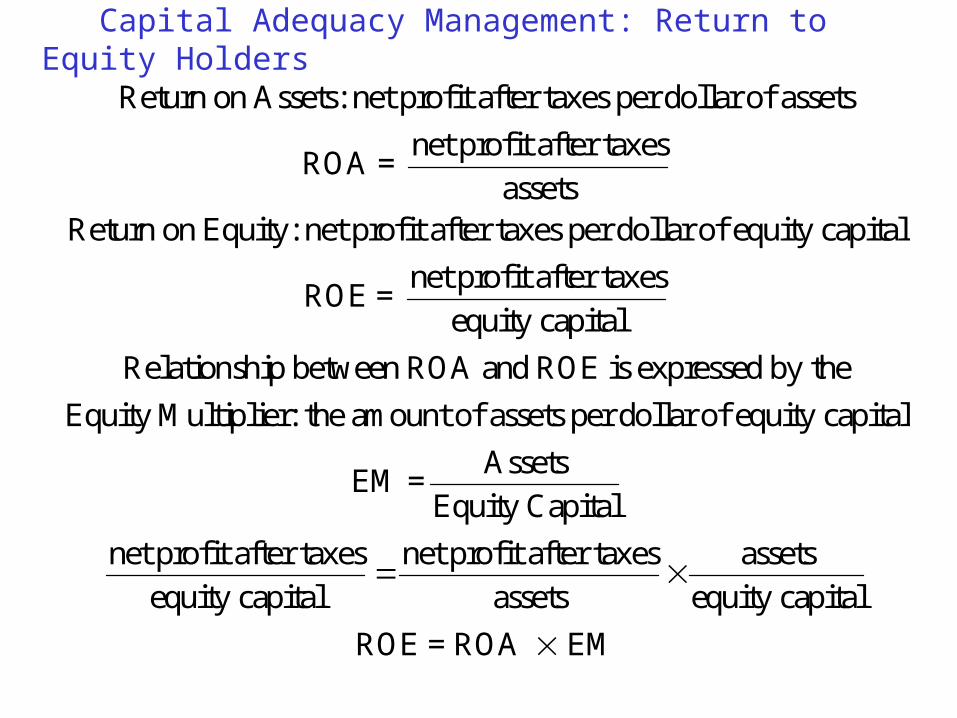
Capital Adequacy Management: Return to Equity Holders
Return on Assets: net profit after taxes per dollar of assets
ROA = net profit after taxes
assetsReturn on Equity: net profit after taxes per dollar of equity capital
ROE = net profit after taxes
equity capital
Relationship between ROA and ROE is expressed by the
Equity Multiplier: the amount of assets per dollar of equity capital
EM =Assets
Equity Capital
net profit after taxes
equity capitalnet profit after taxes
assets assets
equity capital
ROE = ROA EM
© 2012 Pearson Prentice Hall. All rights reserved. 17-38
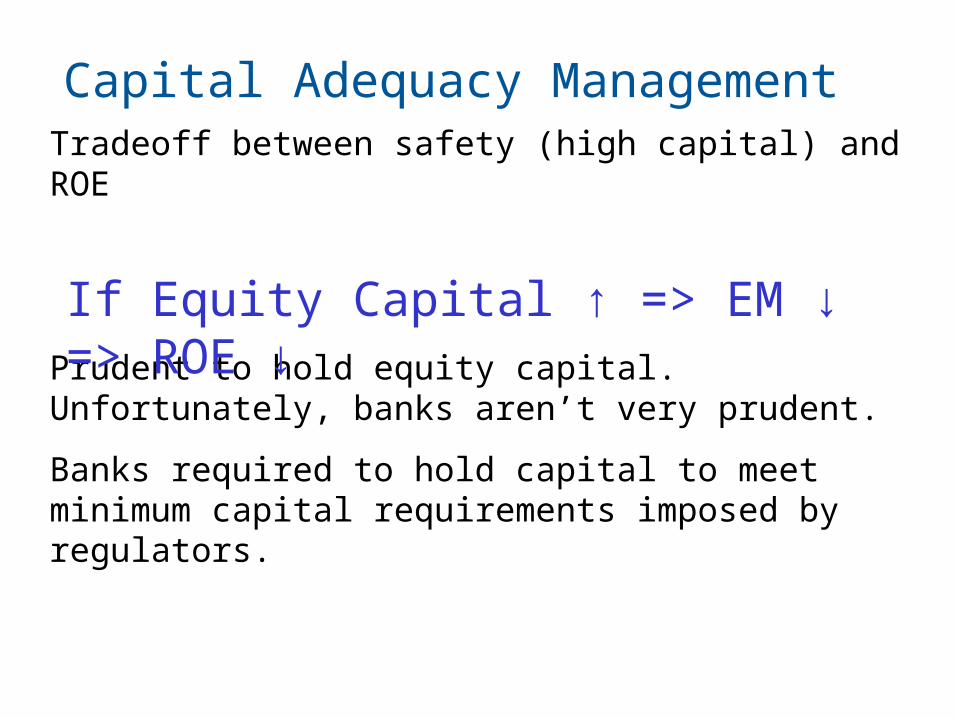
Capital Adequacy ManagementTradeoff between safety (high capital) and ROE
Prudent to hold equity capital. Unfortunately, banks aren’t very prudent.
Banks required to hold capital to meet minimum capital requirements imposed by regulators.
If Equity Capital ↑ => EM ↓ => ROE ↓
© 2012 Pearson Prentice Hall. All rights reserved. 17-39
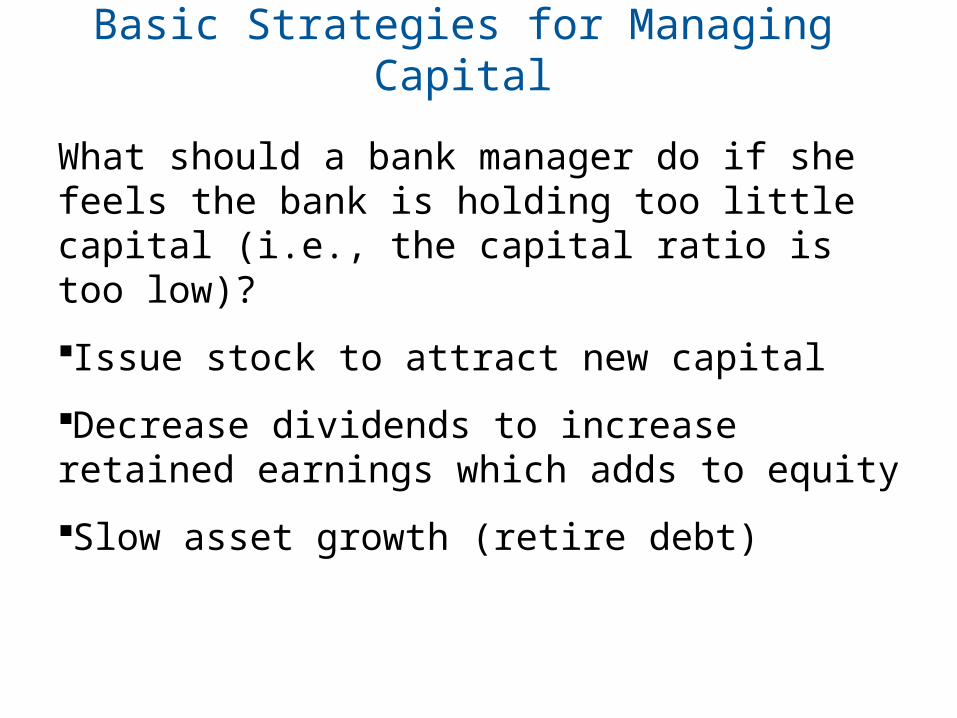
Basic Strategies for Managing Capital
What should a bank manager do if she feels the bank is holding too little capital (i.e., the capital ratio is too low)?
Issue stock to attract new capital
Decrease dividends to increase retained earnings which adds to equity
Slow asset growth (retire debt)
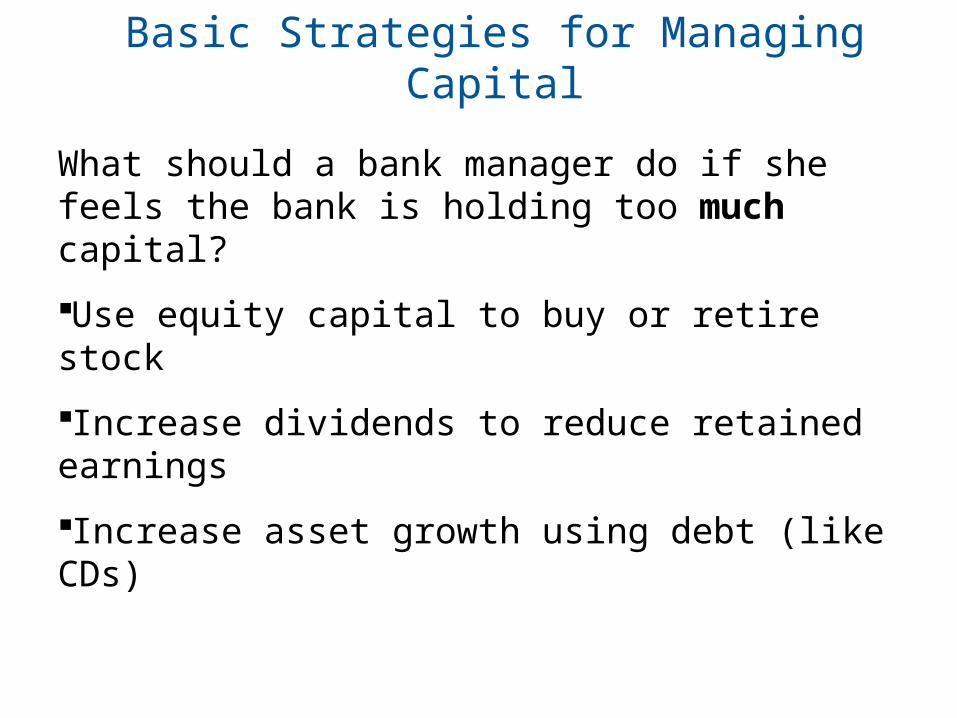
Basic Strategies for Managing Capital
What should a bank manager do if she feels the bank is holding too much capital?
Use equity capital to buy or retire stock
Increase dividends to reduce retained earnings
Increase asset growth using debt (like CDs)
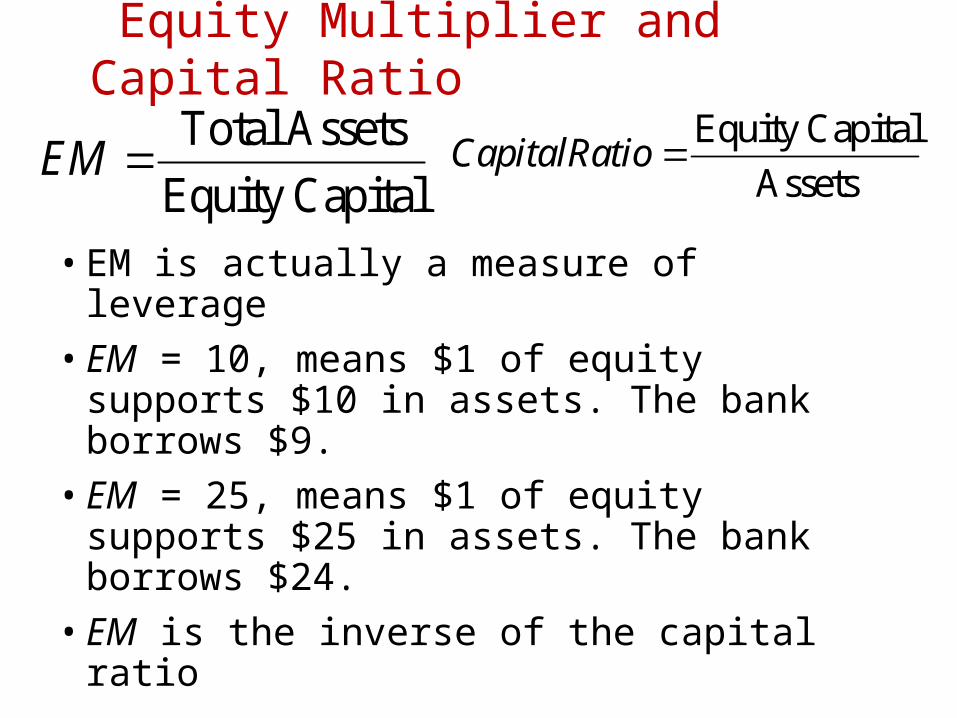
Equity Multiplier and Capital Ratio
• EM is actually a measure of leverage
• EM = 10, means $1 of equity supports $10 in assets. The bank borrows $9.
• EM = 25, means $1 of equity supports $25 in assets. The bank borrows $24.
• EM is the inverse of the capital ratio
Total Assets
Equity CapitalEM
Equity Capital
AssetsCapitalRatio
Bank Profitability
ROA is typically 1.2 to 1.3%
ROE is 10 to 12 times ROA.
Let’s take a look:
https://www2.fdic.gov/qbp/2014dec/cb1.html
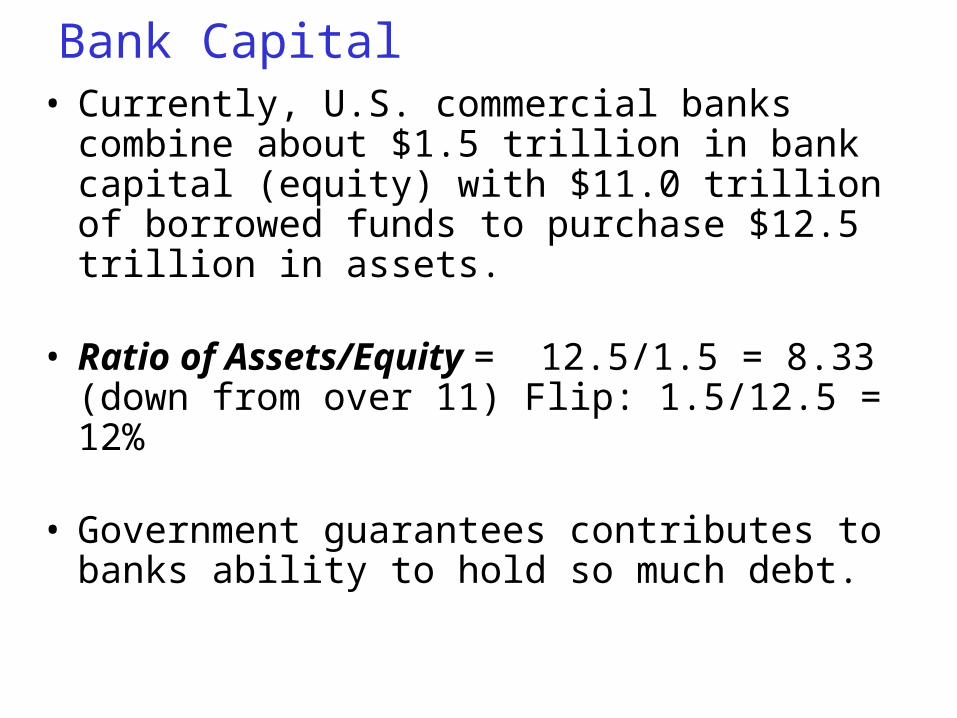
Bank Capital• Currently, U.S. commercial banks combine
about $1.5 trillion in bank capital (equity) with $11.0 trillion of borrowed funds to purchase $12.5 trillion in assets.
• Ratio of Assets/Equity = 12.5/1.5 = 8.33 (down from over 11) Flip: 1.5/12.5 = 12%
• Government guarantees contributes to banks ability to hold so much debt.
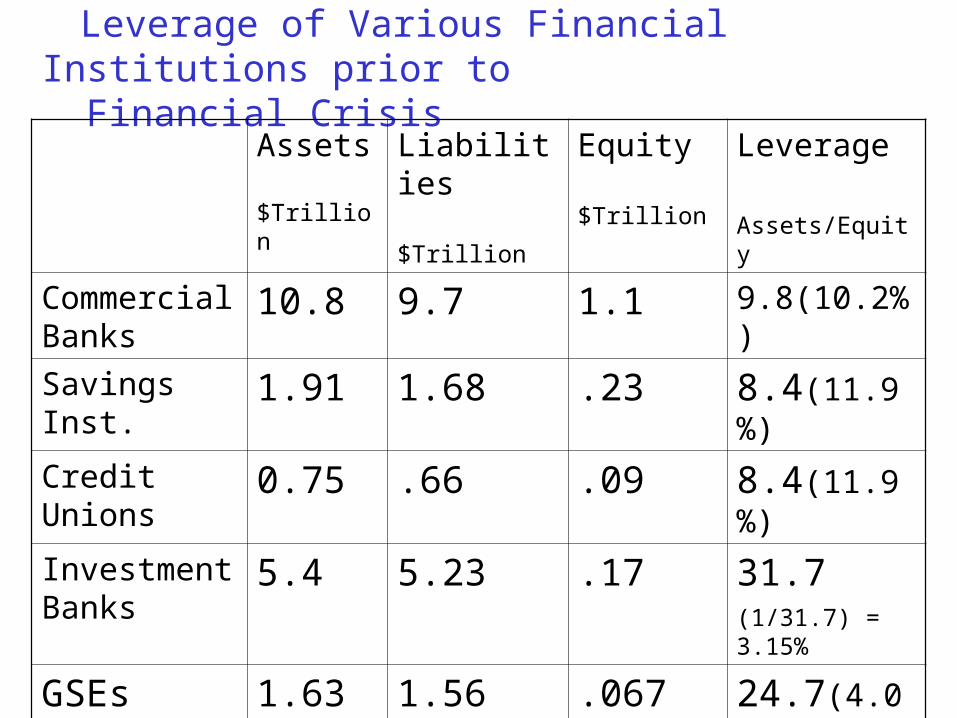
Leverage of Various Financial Institutions prior to Financial Crisis
Assets $Trillion
Liabilities $Trillion
Equity $Trillion
Leverage
Assets/Equity
Commercial Banks
10.8 9.7 1.1 9.8(10.2%)
Savings Inst. 1.91 1.68 .23 8.4(11.9%)
Credit Unions 0.75 .66 .09 8.4(11.9%)
Investment Banks
5.4 5.23 .17 31.7 (1/31.7) = 3.15%
GSEs 1.63 1.56 .067 24.7(4.0%)
Overall 20.5 18.8 1.7 12.2(8.2%)
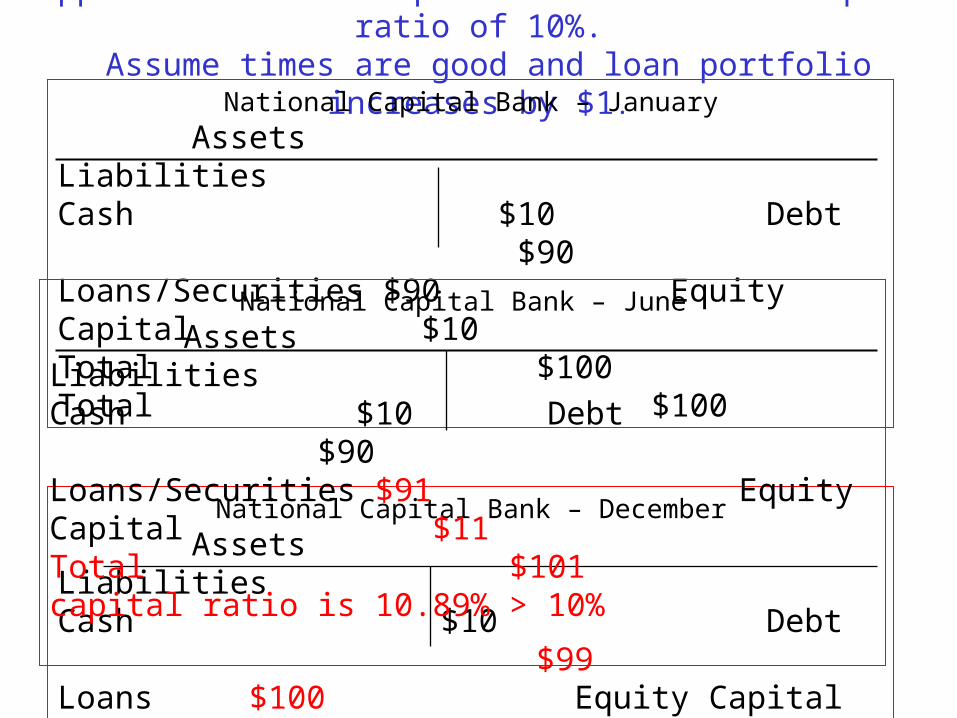
Suppose banks are required to maintain a capital ratio of 10%. Assume times are good and loan portfolio increases by $1.
National Capital Bank – January
Assets LiabilitiesCash $10 Debt $90 Loans/Securities $90 Equity Capital $10Total $100 Total $100
National Capital Bank – December
Assets LiabilitiesCash $10 Debt $99 Loans $100 Equity Capital $11Total $110 Total $110
National Capital Bank – June
Assets LiabilitiesCash $10 Debt $90 Loans/Securities $91 Equity Capital $11Total $101 capital ratio is 10.89% > 10%
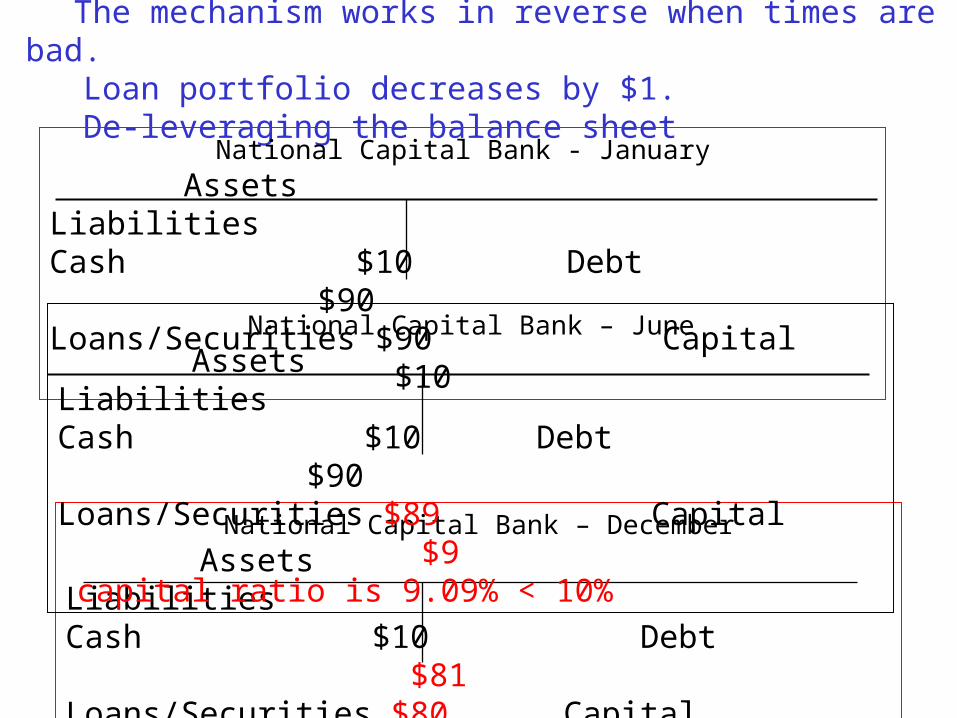
The mechanism works in reverse when times are bad. Loan portfolio decreases by $1. De-leveraging the balance sheet
National Capital Bank - January
Assets LiabilitiesCash $10 Debt $90 Loans/Securities $90 Capital $10
National Capital Bank – December
Assets LiabilitiesCash $10 Debt $81 Loans/Securities $80 Capital $9Total $90 Total $90
National Capital Bank – June
Assets LiabilitiesCash $10 Debt $90 Loans/Securities $89 Capital $9 capital ratio is 9.09% < 10%
9-47
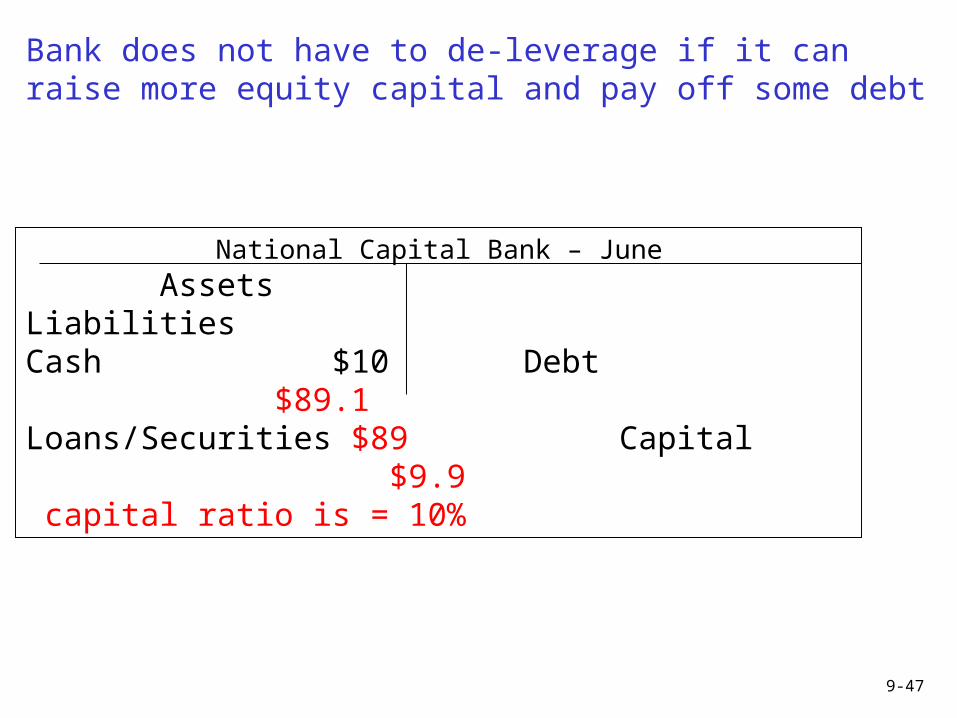
Bank does not have to de-leverage if it can raise more equity capital and pay off some debt
National Capital Bank – June
Assets LiabilitiesCash $10 Debt $89.1 Loans/Securities $89 Capital $9.9 capital ratio is = 10%
How a Capital Crunch Caused a Credit Crunch in 2008 Housing boom and bust led to large bank
losses (including losses on SIVs which had to be
recognized on the balance sheet).
Value of assets reduced.
The losses reduced bank capital.
Banks required to rebuild capital – a capital crunch!
How a Capital Crunch Caused a Credit Crunch in 2008 Banks had two option: (1) raise new capital
or (2) reduce lending.
Guess which route they chose?
Why would banks be hesitant to raise new capital (equity) during an economic downturn and a financial crisis?
Banks Must also Manage Interest-Rate Risk: • Bank assets don’t match liabilities
• Banks “borrow short” and “lend long”
• Creates a maturity mismatch
Managing Interest Rate Risk
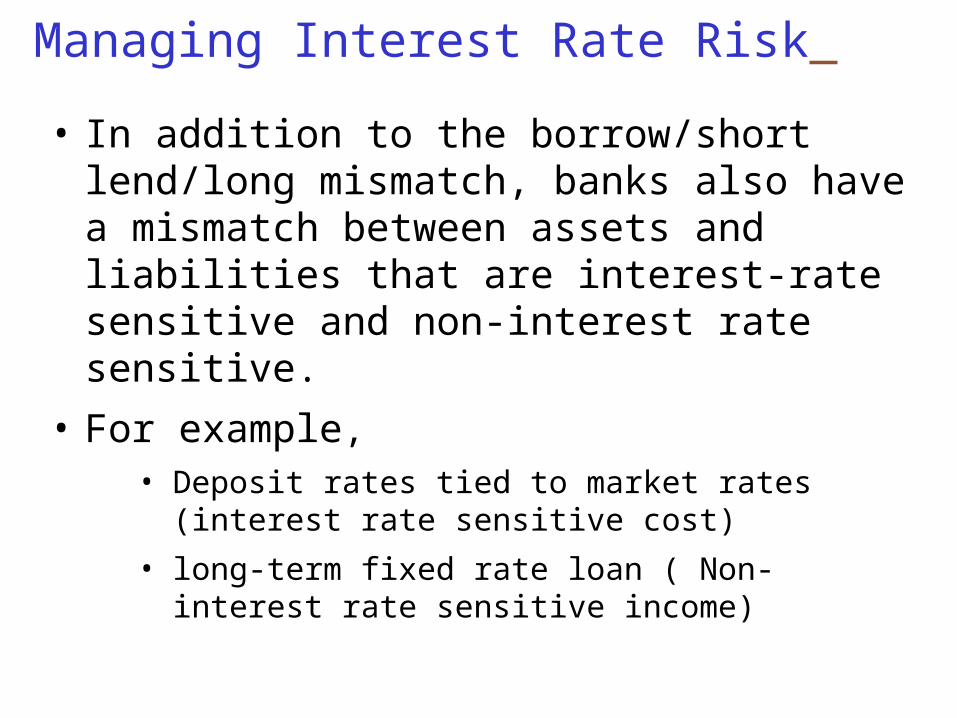
• In addition to the borrow/short lend/long mismatch, banks also have a mismatch between assets and liabilities that are interest-rate sensitive and non-interest rate sensitive.
• For example, • Deposit rates tied to market rates (interest rate
sensitive cost)
• long-term fixed rate loan ( Non-interest rate sensitive income)
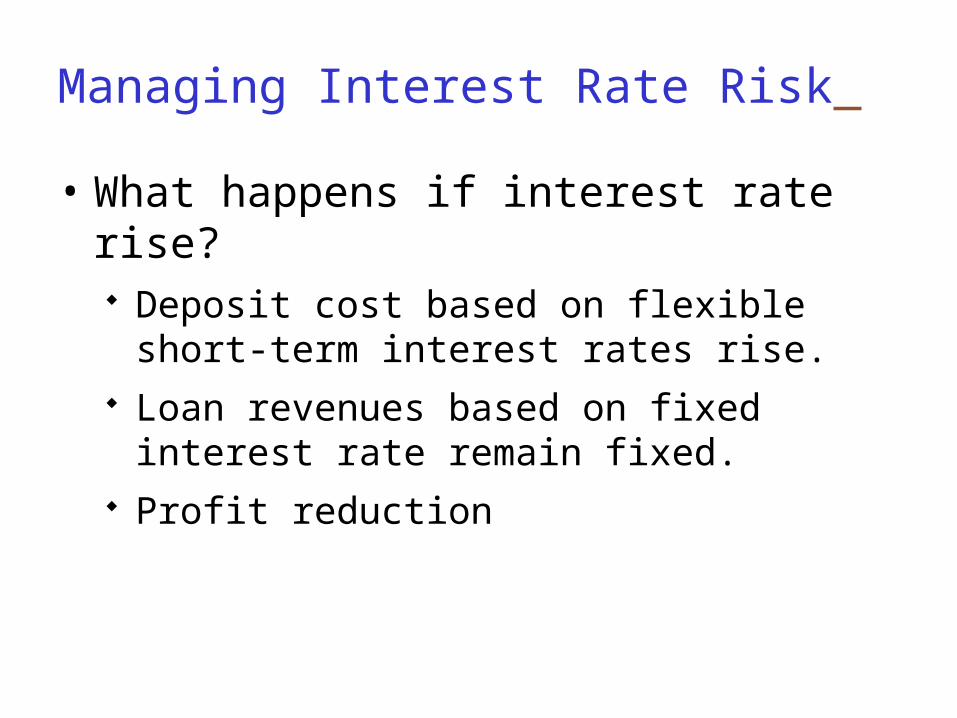
Managing Interest Rate Risk
• What happens if interest rate rise? Deposit cost based on flexible short-term
interest rates rise. Loan revenues based on fixed interest rate
remain fixed. Profit reduction
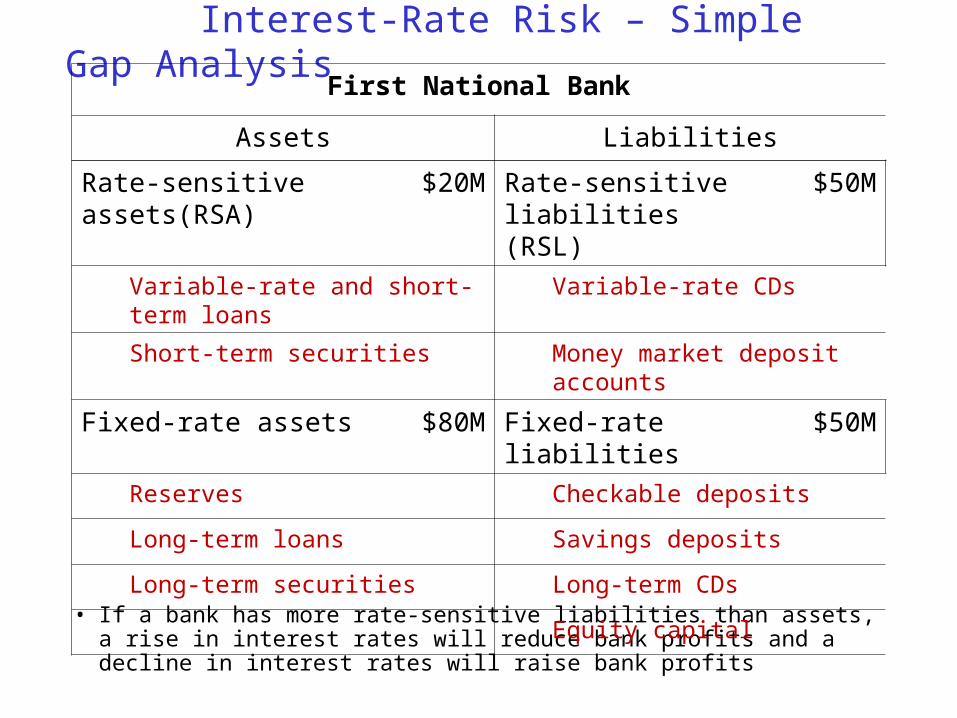
Interest-Rate Risk – Simple Gap Analysis
• If a bank has more rate-sensitive liabilities than assets, a rise in interest rates will reduce bank profits and a decline in interest rates will raise bank profits
First National Bank
Assets Liabilities
Rate-sensitive assets(RSA)
$20M Rate-sensitive liabilities (RSL)
$50M
Variable-rate and short-term loans
Variable-rate CDs
Short-term securities Money market deposit accounts
Fixed-rate assets $80M Fixed-rate liabilities $50M
Reserves Checkable deposits
Long-term loans Savings deposits
Long-term securities Long-term CDs
Equity capital
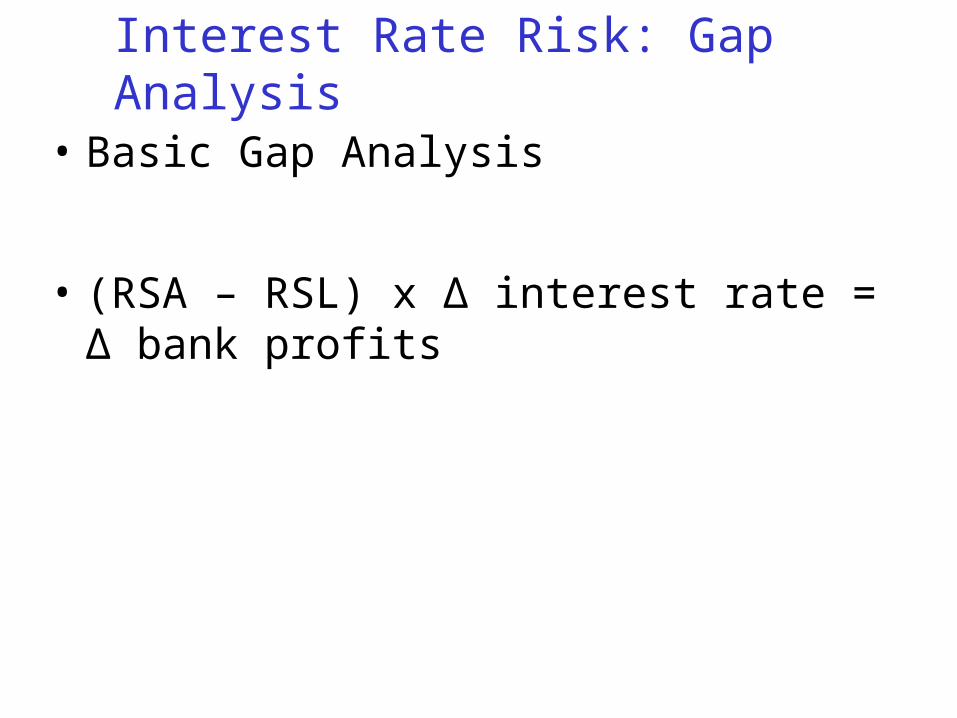
Interest Rate Risk: Gap Analysis
• Basic Gap Analysis
• (RSA – RSL) x Δ interest rate = Δ bank profits
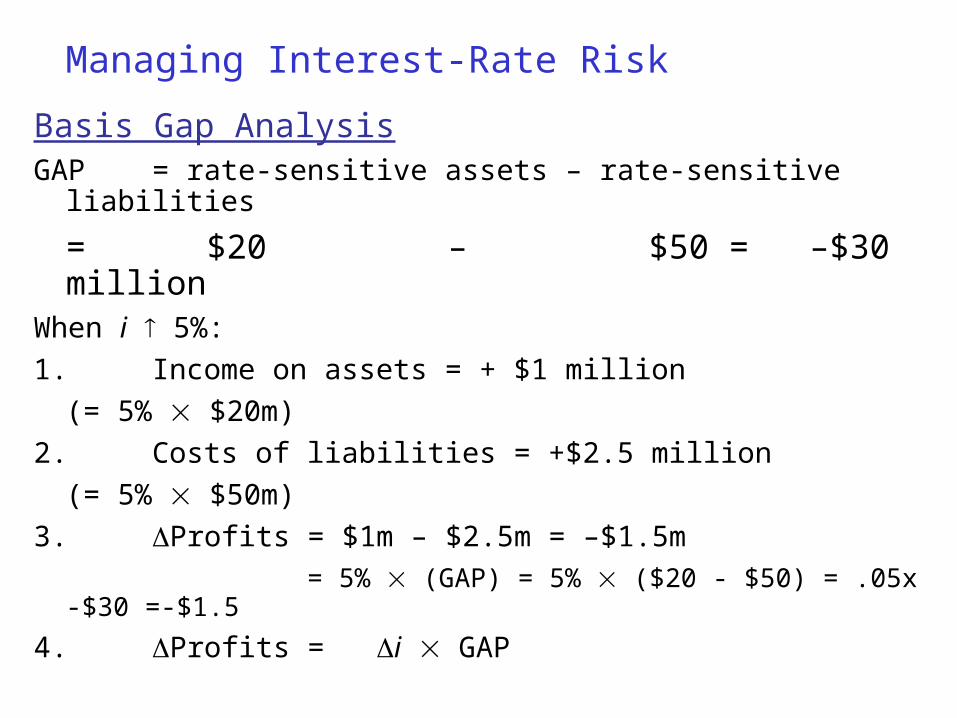
Managing Interest-Rate Risk
Basis Gap AnalysisGAP = rate-sensitive assets – rate-sensitive liabilities
= $20 – $50 = –$30 millionWhen i 5%:
1. Income on assets = + $1 million
(= 5% $20m)
2. Costs of liabilities = +$2.5 million
(= 5% $50m)
3. Profits = $1m – $2.5m = –$1.5m
= 5% (GAP) = 5% ($20 - $50) = .05x -$30 =-$1.5
4. Profits = i GAP
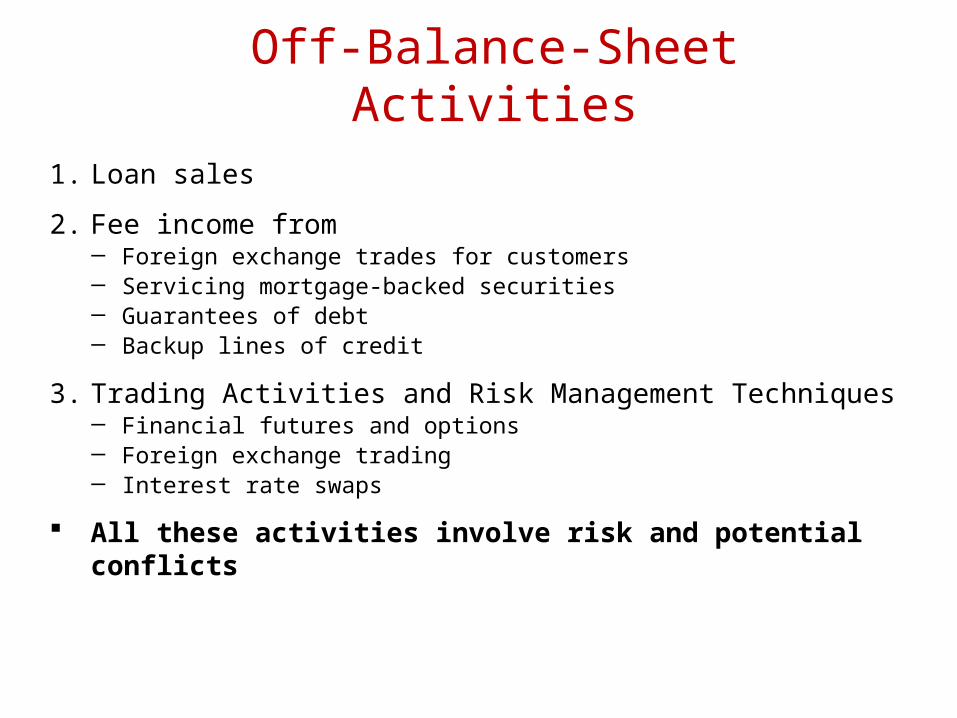
Off-Balance-Sheet Activities
1. Loan sales
2. Fee income from─ Foreign exchange trades for customers─ Servicing mortgage-backed securities─ Guarantees of debt─ Backup lines of credit
3. Trading Activities and Risk Management Techniques─ Financial futures and options ─ Foreign exchange trading─ Interest rate swaps
All these activities involve risk and potential conflicts