Embed Size (px)
Citation preview
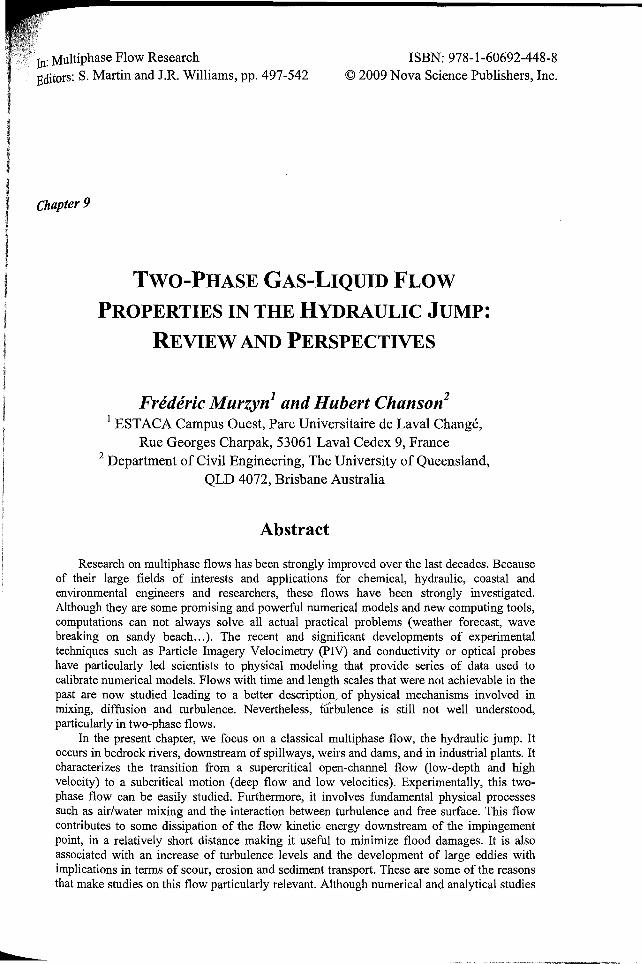
In: Multiphase Flow ResearchEditors: S. Martin and l.R. Williams, pp. 497-542
Chapter 9
ISBN: 978-1-60692-448-8© 2009 Nova Science Publishers, Inc.
...
TWO-PHASE GAs-LIQUID FLOW
PROPERTIES IN THE HYDRAULIC JUMP:
REVIEW AND PERSPECTIVES
Frederic Murzyn] and Hubert Chanson2
1 ESTACA Campus Ouest, Parc Universitaire de Laval Change,Rue Georges Charpak, 53061 Laval Cedex 9, France
2 Department of Civil Engineering, The University of Queensland,QLD 4072, Brisbane Australia
Abstract
Research on multiphase flows has been strongly improved over the last decades. Becauseof their large fields of interests and applications for chemical, hydraulic, coastal andenvironmental engineers and researchers, these flows have been strongly investigated.Although they are some promising and powerful numerical models and new computing tools,computations can not always solve all actual practical problems (weather forecast, wavebreaking on sandy beach... ). The recent and significant developments of experimentaltechniques such as Particle Imagery Velocimetry (PIV) and conductivity or optical probeshave particularly led scientists to physical modeling that provide series of data used tocalibrate numerical models. Flows with time and length scales that were not achievable in thepast are now studied leading to a better descriptio~ of physical mechanisms involved inmixing, diffusion and turbulence. Nevertheless, ful-bulence is still not well understood,particularly in two-phase flows.
In the present chapter, we focus on a classical multiphase flow, the hydraulic jump. Itoccurs in bedrock rivers, downstream of spillways, weirs and dams, and in industrial plants. Itcharacterizes the transition from a supercritical open-channel flow (low-depth and highvelocity) to a subcritical motion (deep flow and low velocities). Experimentally, this twophase flow can be easily studied. Furthermore, it involves fundamental physical processessuch as air/water mixing and the interaction between turbulence and free surface. This flowcontributes to some dissipation of the flow kinetic energy downstream of the impingementpoint, in a relatively short distance making it useful to minimize flood damages. It is alsoassociated with an increase of turbulence levels and the development of large eddies withimplications in terms of scour, erosion and sediment transport. These are some of the reasonsthat make studies on this flow particularly relevant. Although numerical and analytical studies
498 Frederic Murzyn and Hubert Chanson
exist, experimental investigations are still considered as the best way to improve Ourknowledge.
After a brief description of the hydraulic jumps, the first part of this chapter aims toreview some historical developments with special regards to the experimental techniques andphysical modeling (similitude). In the second part, we describe and discuss the basicproperties of the two-phase flow including void fraction, bubble frequency, bubble velocityand bubble size. The free surface and turbulence properties are presented as well. In the lastpart, we develop some conclusions, perspectives and further measurements that should beundertaken in the future.
Keywords: Hydraulic jump, Two phase flows, Turbulence, Turbulence length and timescales, Froude number, Reynolds number, Void fraction, Free-surface, Bubble frequency
Notations
C
D*
F max
FrFsean
g
heL e
L f
L g
Lr
Lxx
Lxz
IeNab
Q
Re
St
Void fraction defined as the volume of air per unit volume ofmixtureMaximum void fraction in the air bubble diffusion layerTurbulent diffusivity (m2/s) of air bubbles in air-water flow
Dimensionless turbulent diffusivity: D * =~Ujdj
Mean bubble chord length (m)Upstream flow depth (m)Downstream flow depth (m)Bubble count rate (Hz) or bubble frequencyMaximum bubble count rate (Hz) at a given cross-sectionUpstream Froude numberSampling rate (Hz)Acceleration of gravity: g=9.80rn/S2
Channel height (m)Channel length (m)Longitudinal length scale of turbulence (m) for free surface [42]Transversal length scale of turbulence (m) for free surface [42]Length of the roller (m)Auto-correlation length scale (m) in the bubbly flow [12, 13]Transverse air-water integral length scale (m) in the bubbly flow [12, 13]
'j .~
Channel width (m)Number of air bubbles per recordWater discharge (m3/s)
pUjdj Ujd jReynolds number: Re = =
fl V
Normalized auto-correlation function (reference probe)Normalised cross-correlation function between two probe output signals
SFtoedj
Strouhal number: t = ---Vj
d
Two-Phase Gas-Liquid Flow Properties in the Hydraulic Jump
T Average air-water interfacial travel time between the two probe sensors (s)Tscan Sampling duration (s)Tt Free surface integral time scale of turbulence measured by wire gages (s)Tu Measure of the turbulence level in the air-water flow
,=,(R"" =0)
Txx Auto-correlationintegral time scale (s): Txx = fRxxd't,=0
499
b
To.5 Characteristic time lag 't for which Rxx = 0.5 (s)VI Depth-averaged flow velocity upstream of the hydraulic jump (m/s)x Longitudinal distance from the upstream gate (m)Xl Longitudinal distance from the gate to the jump toe (m)y Distance measured normal to the bed channel (m)*y Distance measured normal to the channel bed corresponding to the boundary
between the turbulent shear layer and the mixing layer (m)YCmax Distance normal to the bed corresponding to C=Cmax (m)YFmax Distance normal to the bed corresponding to F=Fmax (m)z Transverse distance from the channel centreline (m)
Greek Symbols
8 Boundary layer thickness (m)~ Longitudinal distance between probe sensors for dual-tip conductivity probe (m)ilH Head loss (m)11 Free surface mean level of the jump above the channel bottom (m)11' Root mean square of the free surface level fluctuation (m)v Kinematic viscosity of water (m2/s)Il Dynamic viscosity ofwater (Pas)p Density ofwater (kg/m3
)
(j Surface tension between air and water (N/m)t Time lag (s)to.5 Characteristic time lag for which Rxz = 0.5 (Rxz)max
Subscripts
1 Upstream flow conditions2 Downstream flow conditions
Abbreviations
PD Partially-Developed inflow conditionsFD Fully-Developed inflow conditions
500 Frederic Murzyn and Hubert Chanson
1. Introduction
1.1. Multiphase Flows and the Hydraulic Jump
Multiphase flows are everywhere around us. According to Andrea Prosperetti and GretarTryggvason [43], "it is estimated that over half of anything which is produced in a modernindustrial society depends to some extent on a multiphase flow process". By multiphaseflows, we consider a mix of at least two phases among liquid, gas and solid.
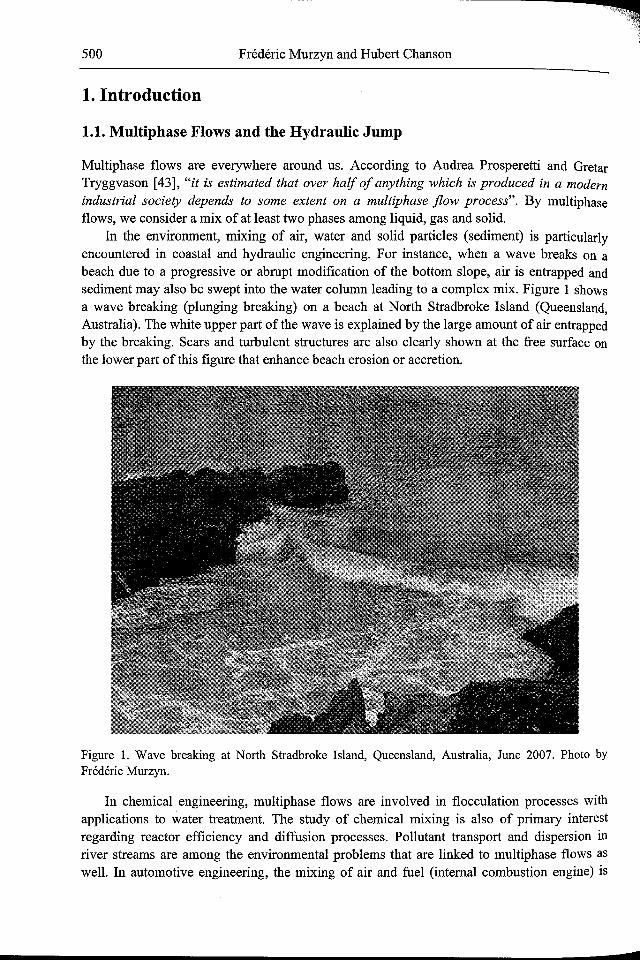
In the environment, mixing of air, water and solid particles (sediment) is particularlyencountered in coastal and hydraulic engineering. For instance, when a wave breaks on abeach due to a progressive or abrupt modification of the bottom slope, air is entrapped andsediment may also be swept into the water column leading to a complex mix. Figure I showsa wave breaking (plunging breaking) on a beach at North Stradbroke Island (Queensland,Australia). The white upper part of the wave is explained by the large amount of air entrappedby the breaking. Scars and turbulent structures are also clearly shown at the free surface onthe lower part of this figure that enhance beach erosion or accretion.
Figure 1. Wave breaking at North Stradbroke Island, Queensland, Australia, June 2007. Photo byFrederic Murzyn.
In chemical engineering, multiphase flows are involved in flocculation processes withapplications to water treatment. The study of chemical mixing is also of primary interestregarding reactor efficiency and diffusion processes. Pollutant transport and dispersion inriver streams are among the environmental problems that are linked to multiphase flows aswell. In automotive engineering, the mixing of air and fuel (internal combustion engine) is
d
Two-Phase Gas-Liquid Flow Properties in the Hydraulic Jump 501
also of primary importance to improve engine power and reduce pollution with ecologicalissues. Foam is a substance that is formed by trapping gas bubbles in a liquid. Their lowdensity makes them particularly suitable for thermal insulation, for flotation devices orpacking materials. They can also be used as ftre retardant when liquid. Multiphase flows arealso implied in clouds and rain formation or in pipelines flows.
These examples demonstrate our need to improve knowledge on the topic. Furthermore,these flows imply a wide range of spatial and temporal scales from the millimetric (foams) togeophysical world (cyclone and tropical storms) that require several experimental techniquesfrom the Pitot tube to optical sensors.
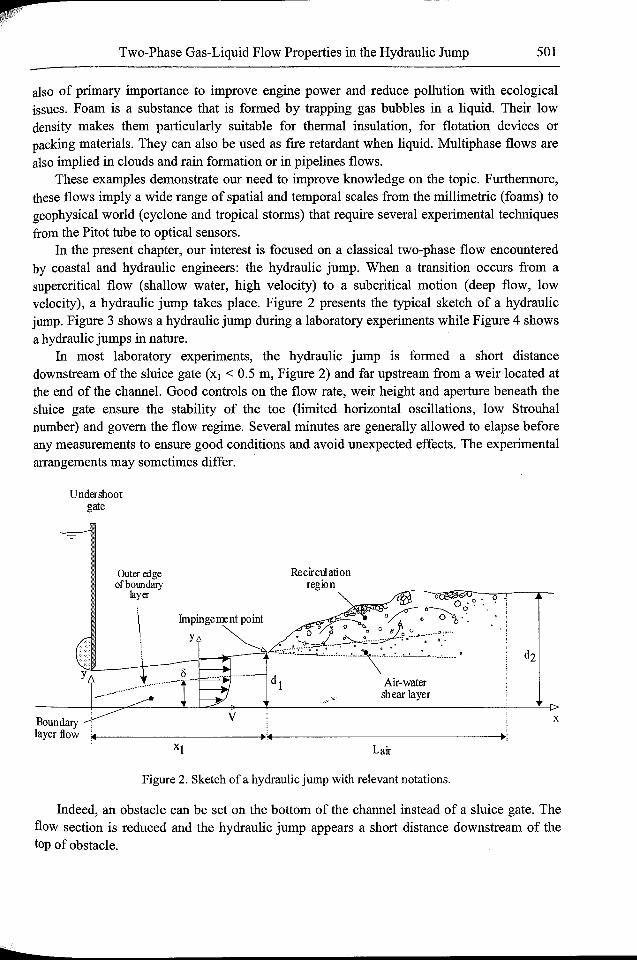
In the present chapter, our interest is focused on a classical two-phase flow encounteredby coastal and hydraulic engineers: the hydraulic jump. When a transition occurs from asupercritical flow (shallow water, high velocity) to a subcritical motion (deep flow, lowvelocity), a hydraulic jump takes place. Figure 2 presents the typical sketch of a hydraulicjump. Figure 3 shows a hydraulic jump during a laboratory experiments while Figure 4 showsa hydraulic jumps in nature.
In most laboratory experiments, the hydraulic jump is formed a short distancedownstream of the sluice gate (Xl < 0.5 m, Figure 2) and far upstream from a weir located atthe end of the channel. Good controls on the flow rate, weir height and aperture beneath thesluice gate ensure the stability of the toe (limited horizontal oscillations, low Strouhalnumber) and govern the flow regime. Several minutes are generally allowed to elapse beforeany measurements to ensure good conditions and avoid unexpected effects. The experimentalarrangements may sometimes differ.
Undershootgate
x
Recirculationregion
v
Outer edgeofboundaIy
layer
Boundary ,layer flow *~ --+•••~ ~.,
Lair
Figure 2. Sketch of a hydraulic jump with relevant notations.
Indeed, an obstacle can be set on the bottom of the channel instead of a sluice gate. Theflow section is reduced and the hydraulic jump appears a short distance downstream of thetop of obstacle.
b
502 Frederic Murzyn and Hubert Chanson
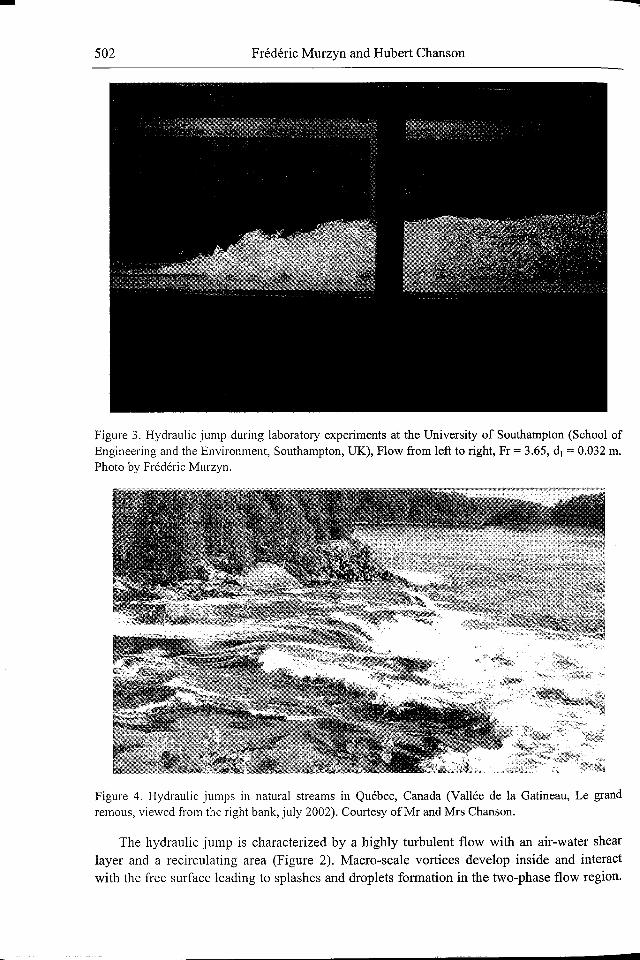
Figure 3. Hydraulic jump during laboratory experiments at the University of Southampton (School ofEngineering and the Environment, Southampton, UK), Flow from left to right, Fr = 3.65, d j = 0.032 m.Photo by Frederic Murzyn.
Figure 4. Hydraulic jumps in natural streams in Quebec, Canada (Vallee de la Gatineau, Le grandremous, viewed from the right bank, july 2002). Courtesy ofMr and Mrs Chanson.
The hydraulic jump is characterized by a highly turbulent flow with an air-water shearlayer and a recirculating area (Figure 2). Macro-scale vortices develop inside and interactwith the free surface leading to splashes and droplets formation in the two-phase flow region.
c
Two-Phase Gas-Liquid Flow Properties in the Hydraulic Jump 503
Beyond the region of turbulence production (downstream of the impingement point), somesignificant kinetic energy dissipation takes place. In tenns of environmental aspects, thisproperty is used, for instance, with low impact structures for river restoration and to minimizeflood damages.
The main parameter which characterizes the hydraulic jumps is its Froude numberdefined as:
Fr=~M
(1)
where VI is the inflow velocity (m/s), d l is the inflow water depth (m) and g is theacceleration of gravity (m/sz).
The Froude number is always greater than 1 for hydraulic jumps. Depending on thatdimensionless number, different kinds ofjumps are referenced including [7, 10, 15, 16]:
The undular hydraulic jump for 1 < Fr < 1.5 to 4;The breaking jump for larger Froude numbers encompassing the oscillating jumpstudied by Mossa [35] and the steady jump for large Froude numbers.
The study of Gualtieri and Chanson [28] showed that the air-water flow properties weresimilar in both steady and strong jump flows.
For a horizontal rectangular channel and neglecting boundary friction, the continuityequation leads to Belanger equation [2, 6, 7, 15]:
(2)
where d l is the inflow water depth (m) at the impingement point and dz is the downstreamflow depth (m) far from the impingement point.
The hydraulic jump is mainly used as an energy dissipator [6, 7, 10,29]. The stronger thejump is, the highest the energy dissipation is. The dimensionless head loss is given by:
(3)
>
For steady hydraulic jump, the energy dissipation goes from 45% to 70%. It reaches up to85% for strongly turbulent jump. Although hydraulic jumps dissipate a large part of theincoming flow energy, the high levels of turbulence in these flows tend to increase scour anderosion at bridge piers or in rivers (Figures 5 and 6).
For physical modeling and similitude purposes, the Reynold number (Re) is often used aswell to characterize the flow:
504 Frederic Murzyn and Hubert Chanson
Re= Did l
\)(4)
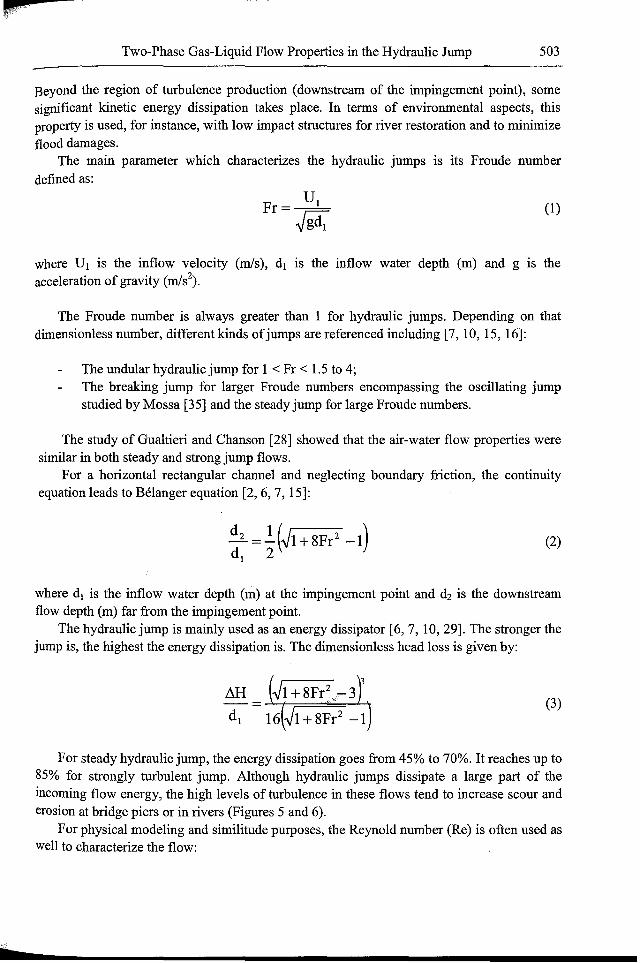
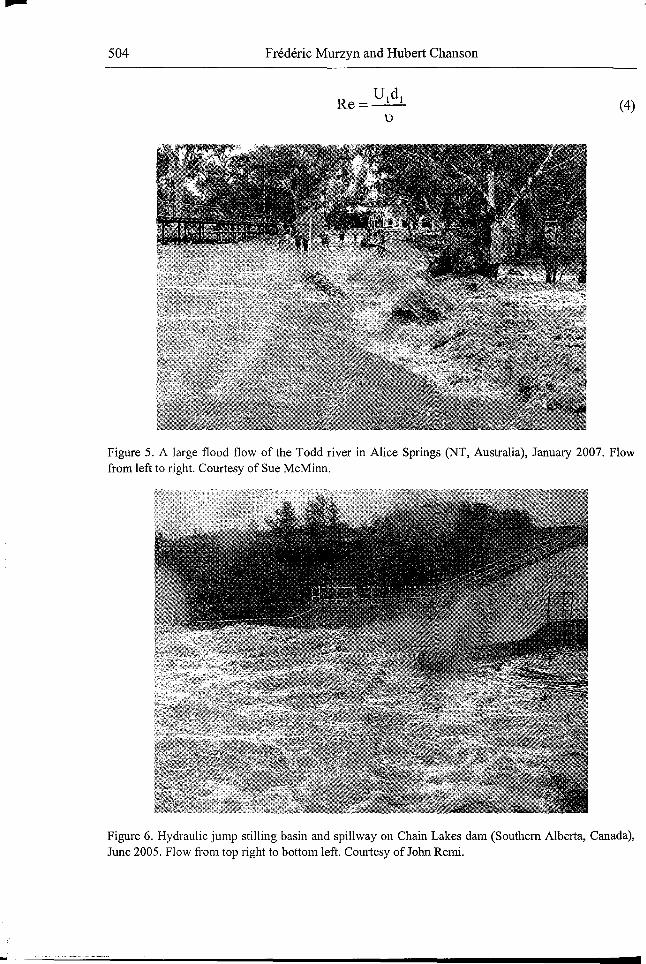
Figure 5. A large flood flow of the Todd river in Alice Springs (NT, Australia), January 2007. Flowfrom left to right. Courtesy of Sue McMinn.
Figure 6. Hydraulic jump stilling basin and spillway on Chain Lakes dam (Southern Alberta, Canada),June 2005. Flow from top right to bottom left. Courtesy of John Remi.
ji.. ·
Two-Phase Gas-Liquid Flow Properties in the Hydraulic Jump 505
•
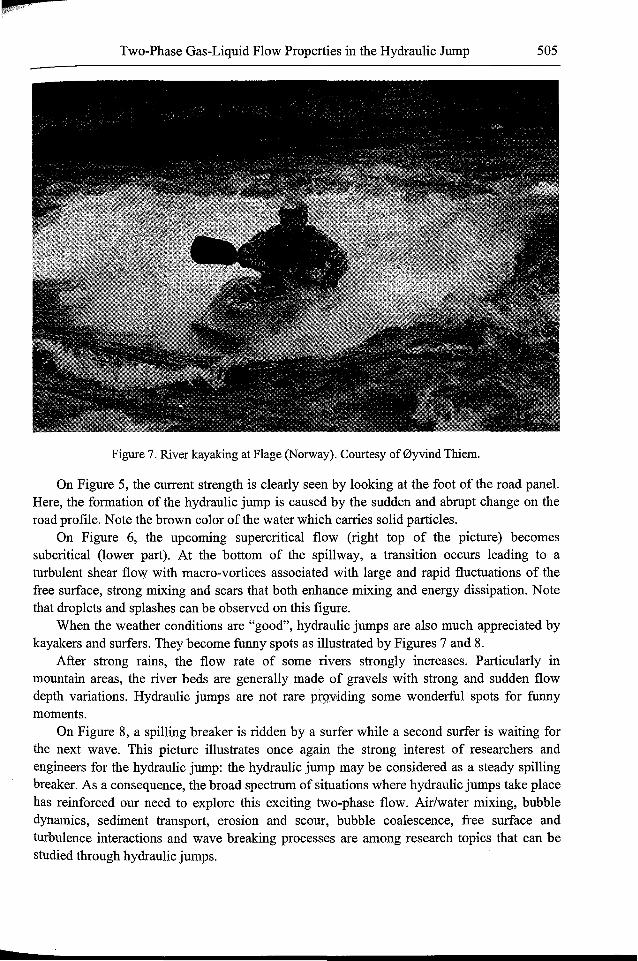
Figure 7. River kayaking at Flage (Norway). Courtesy of 0yvind Thiem.
On Figure 5, the current strength is clearly seen by looking at the foot of the road panel.Here, the formation of the hydraulic jump is caused by the sudden and abrupt change on theroad profile. Note the brown color of the water which carries solid particles.
On Figure 6, the upcoming supercritical flow (right top of the picture) becomessubcritical (lower part). At the bottom of the spillway, a transition occurs leading to aturbulent shear flow with macro-vortices associated with large and rapid fluctuations of thefree surface, strong mixing and scars that both enhance mixing and energy dissipation. Notethat droplets and splashes can be observed on this figure.
When the weather conditions are "good", hydraulic jumps are also much appreciated bykayakers and surfers. They become funny spots as illustrated by Figures 7 and 8.
After strong rains, the flow rate of some rivers strongly increases. Particularly inmountain areas, the river beds are generally made of gravels with strong and sudden flowdepth variations. Hydraulic jumps are not rare Pt."9viding some wonderful spots for funnymoments.
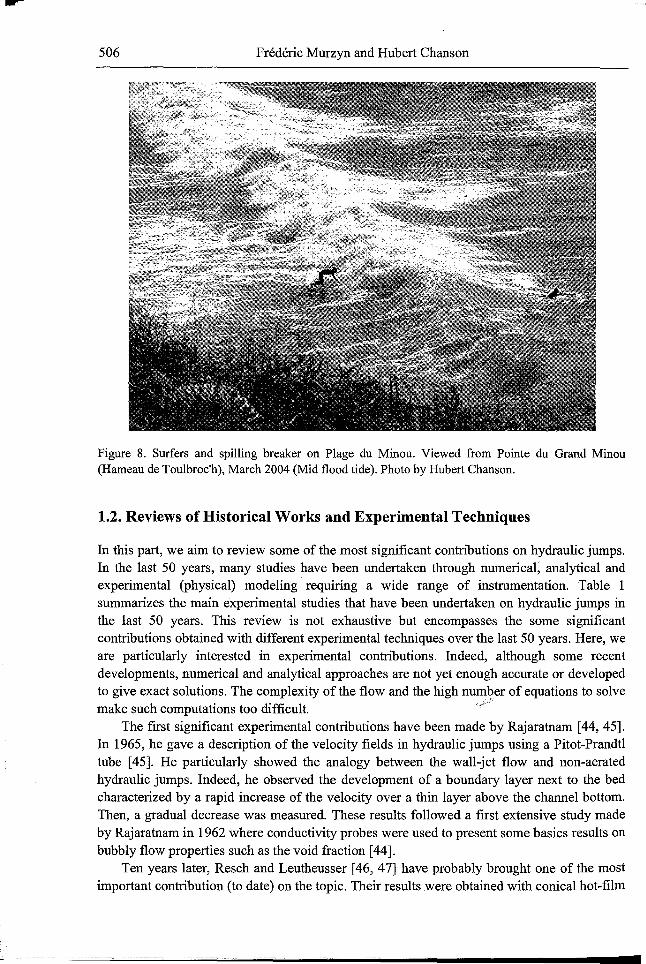
On Figure 8, a spilling breaker is ridden by a surfer while a second surfer is waiting forthe next wave. This picture illustrates once again the strong interest of researchers andengineers for the hydraulic jump: the hydraulic jump may be considered as a steady spillingbreaker. As a consequence, the broad spectrum of situations where hydraulic jumps take placehas reinforced our need to explore this exciting two-phase flow. Air/water mixing, bubbledynamics, sediment transport, erosion and scour, bubble coalescence, free surface andturbulence interactions and wave breaking processes are among research topics that can bestudied through hydraulic jumps.
....506 Frederic Murzyn and Hubert Chanson
Figure 8. Surfers and spilling breaker on Plage du Minou. Viewed from Pointe du Grand Minou(Hameau de Toulbroc'h), March 2004 (Mid flood tide). Photo by Hubert Chanson.
1.2. Reviews of Historical Works and Experimental Techniques
In this part, we aim to review some of the most significant contributions on hydraulic jumps.In the last 50 years, many studies have been undertaken through numerical; analytical andexperimental (physical) modeling' requiring a wide range of instrumentation. Table 1summarizes the main experimental studies that have been undertaken on hydraulic jumps inthe last 50 years. This review is not exhaustive but encompasses the some significantcontributions obtained with different experimental techniques over the last 50 years. Here, weare particularly interested in experimental contributions. Indeed, although some recentdevelopments, numerical and analytical approaches are not yet enough accurate or developedto give exact solutions. The complexity of the flow and the high number of equations to solve
Fmake such computations too difficult. ',,"
The first significant experimental contributions have been made by Rajaratnam [44,45].In 1965, he gave a description of the velocity fields in hydraulic jumps using a Pitot-Prandtltube [45]. He particularly showed the analogy between the wall-jet flow and non-aeratedhydraulic jumps. Indeed, he observed the development of a boundary layer next to the bedcharacterized by a rapid increase of the velocity over a thin layer above the channel bottom.Then, a gradual decrease was measured. These results followed a first extensive study madeby Rajaratnam in 1962 where conductivity probes were used to present some basics results onbubbly flow properties such as the void fraction [44].
Ten years later, Resch and Leutheusser [46, 47] have probably brought one of the mostimportant contribution (to date) on the topic. Their results were obtained with conical hot-film
Two-Phase Gas-Liquid Flow Properties in the Hydraulic Jump 507
b
probes in the bubbly flow region. Resch and Leutheusser have mainly showed that the airentrainment, momentum transfer and energy dissipation processes were strongly affected bythe incoming flow conditions. This point is fundamental and means that the quality of theresults depends on the experimental conditions. As a consequence, the relative boundary layerthickness (old!) developing upstream of the impingement point is a key-point that affect thebubbly flow. Depending on this relative boundary layer thickness, the inflow conditions areeither partially developed (PD) or fully developed (FD) (Table 1). Murzyn et al. [41] gave anestimation of their boundary layer thickness developing over a flat bed made of PVC. Theyfound that 0.18d! < 0 < 0.36d! which corresponds to partially-developed (PD) inflowconditions.
In 1981, Babb and Aus [1] used conical hot film probes which sizes were smaller thanthose of Resch and Leutheusser. This point is of interest. Indeed, intrusive probes may disturbthe flow. In hydraulic jumps, this is particularly true in the upper part of the flow wherenegative horizontal velocities are observed. Thus, the disturbances caused by the probespropagate upstream leading to some possible significant flow modifications. Thus, intrusiveprobes must be as small as possible to minimize such disturbances and optimize the accuracyof the results. Babb and Aus investigated the movement of air bubbles in and out of the jumpfor one experimental condition (Fr = 6). They found that large bubbles were mostly locatednear the impingement point. Their lifetime was very short because of the turbulence, shearand buoyancy.
In the last years, the improvement of these experimental techniques in terms of responsetimes, spatial and temporal resolution or data analysis procedures has led to an extraordinarynumber of studies with either conductivity and optical probes, wire gages or flowvisualizations [5, 11, 12, 13, 14, 15, 16, 19,23,28,31,32,33,35,36,37,38,39,40,41,42,48].
Since the beginning of the 90's, the most important contributions are probably those ofChanson [5, 11, 12, 13, 14, 15, 16], Chanson and Brattberg [19], Gualtieri and Chanson [28],Mossa [35, 36], Kucukali and Chanson [31], Mouaze et al. [37] or Murzyn et al. [41, 42].Other contributions include [23, 31, 38, 39, 40]. They have brought new developmentsleading to a better understanding of the physical mechanisms involved in hydraulic jumps.Nevertheless, this is not enough.
Chanson [5], Chanson and Brattberg [19], Chanson and Toombes [24] have preferentiallyused conductivity probes (single or dual tip conductivity probes) which have beenmanufactured, tested and used at the University of Queensland with a range of sensor sizefrom 0.025 mill to 0.35 mm including 0.1 mm andQ.25 mill. These phase-detection probesare designed to pierce bubbles. Based upon the diff~rence of electrical resistivity between airand water, they are well-adapted for bubbly flows such as hydraulic jumps. Figure 9 presentsa sketch of a single-tip probe. For instance, the study of Chanson and Brattberg [18] used a0.025 mm sensor size.
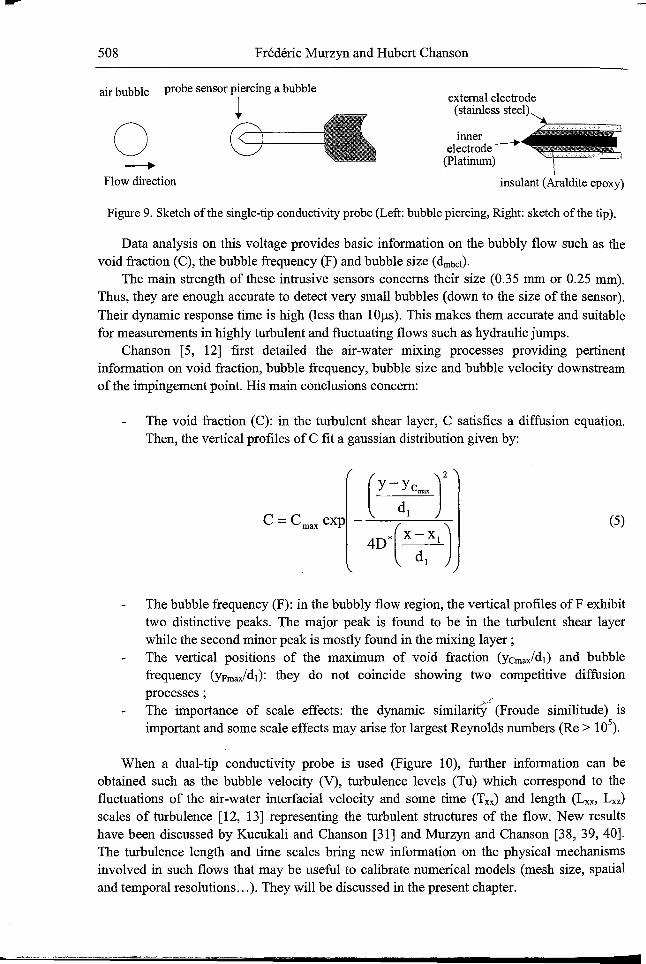
When the sensitive part of the probe is in water, current flows between the tip and thesupporting metal. Then, an output voltage is collected. It becomes nearly null when the tip isin air. Because the output voltage is subject to some fluctuations caused by dust flowing inwater, a single threshold technique is applied on the output signal to define time lagscorresponding to air and water [31, 38].
...508 Frederic Murzyn and Hubert Chanson
air bubble probe sensor piercing a bubble
~o---+
Flow direction
external electrode
(",in1", ""oil•..•....................•.......................................................................................mner -----.-electrode .
(Platinum) .
insulant (Araldite epoxy)
Figure 9. Sketch of the single-tip conductivity probe (Left: bubble piercing, Right: sketch of the tip).
Data analysis on this voltage provides basic infonnation on the bubbly flow such as thevoid fraction (C), the bubble frequency (F) and bubble size (dmbc\).
The main strength of these intrusive sensors concerns their size (0.35 mm or 0.25 mm).Thus, they are enough accurate to detect very small bubbles (down to the size of the sensor).
Their dynamic response time is high (less than lOllS). This makes them accurate and suitablefor measurements in highly turbulent and fluctuating flows such as hydraulic jumps.
Chanson [5, 12] first detailed the air-water mixing processes providing pertinentinfonnation on void fraction, bubble frequency, bubble size and bubble velocity downstreamof the impingement point. His main conclusions concern:
The void fraction (C): in the turbulent shear layer, C satisfies a diffusion equation.Then, the vertical profiles of C fit a gaussian distribution given by:
C =Cmax exp (5)
The bubble frequency (F): in the bubbly flow region, the vertical profiles ofF exhibittwo distinctive peaks. The major peak is found to be in the turbulent shear layerwhile the second minor peak is mostly found in the mixing layer;The vertical positions of the maximum of void fraction (Ycmax/d\) and bubblefrequency (YFmax/d\): they do not coincide showing two competitive diffusionprocesses ; ..The importance of scale effects: the dynamic similaritY'(Froude similitude) isimportant and some scale effects may arise for largest Reynolds numbers (Re > 105
).
When a dual-tip conductivity probe is used (Figure 10), further infonnation can beobtained such as the bubble velocity (V), turbulence levels (Tu) which correspond to thefluctuations of the air-water interfacial velocity and some time (Txx) and length (Lxx, Lxz)scales of turbulence [12, 13] representing the turbulent structures of the flow. New resultshave been discussed by Kucukali and Chanson [31] and Murzyn and Chanson [38, 39,40].The turbulence length and time scales bring new infonnation on the physical mechanismsinvolved in such flows that may be useful to calibrate numerical models (mesh size, spatialand temporal resolutions ... ). They will be discussed in the present chapter.
F
Two-Phase Gas-Liquid Flow Properties in the Hydraulic Jump 509
-
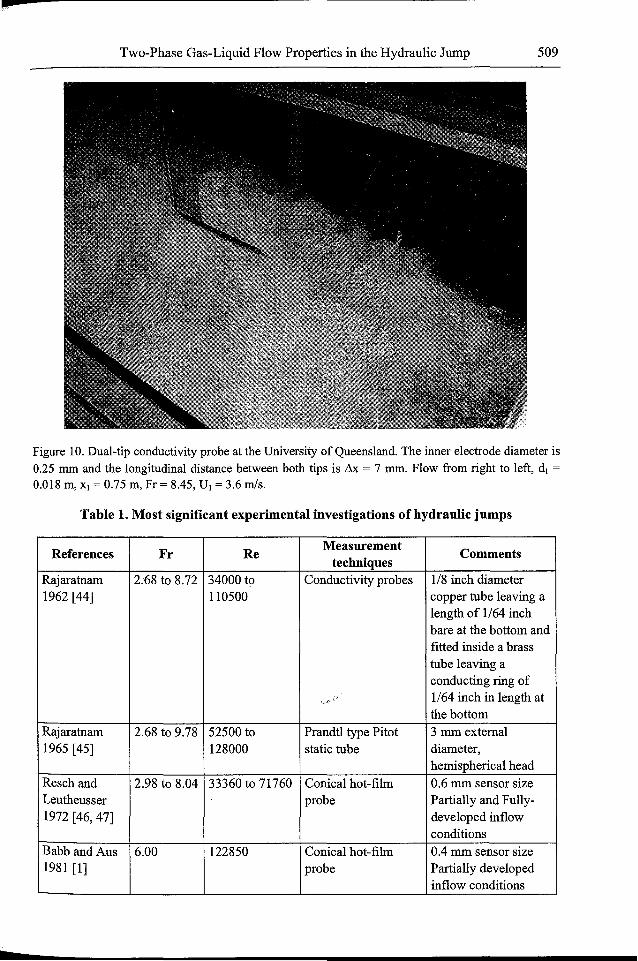
Figure 10. Dual-tip conductivity probe at the University of Queensland. The inner electrode diameter is0.25 mm and the longitudinal distance between both tips is & = 7 mm. Flow from right to left, d l =0.018 m, Xl = 0.75 m, Fr = 8.45, U I = 3.6 mls.
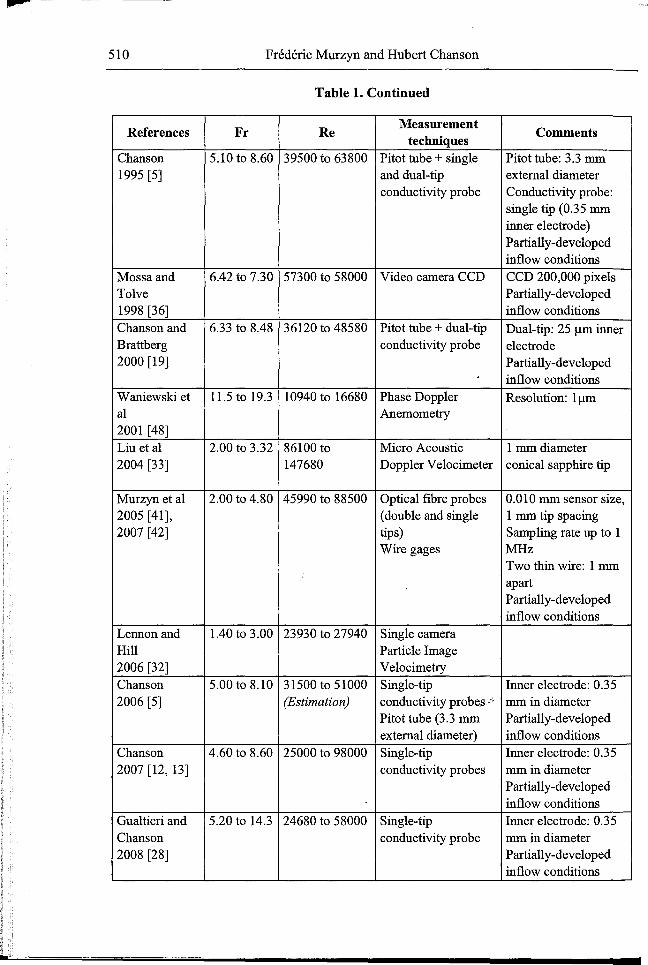
Table 1. Most significant experimental investigations of hydraulic jumps
References Fr ReMeasurement
Commentstechniques
Rajaratnam 2:68 to 8.72 34000 to Conductivity probes 1/8 inch diameter1962 [44] 110500 copper tube leaving a
length of 1/64 inchbare at the bottom andfitted inside a brasstube leaving aconducting ring of1/64 inch in length atthe bottom
Rajaratnam 2.68 to 9.78 52500 to Prandtl type Pitot 3 mmextemal1965 [45] 128000 static tube diameter,
hemispherical headResch and 2.98 to 8.04 33360 to 71760 Conical hot-film 0.6 rom sensor sizeLeutheusser probe Partially and Fully-1972 [46,47] developed inflow
conditionsBabb andAus 6.00 122850 Conical hot-film 0.4 rom sensor size1981 [1] probe Partially developed
inflow conditions
510 Frederic Murzyn and Hubert Chanson
Table 1. Continued
References Fr ReMeasurement
Commentstechniques
Chanson 5.10 to 8.60 39500 to 63800 Pitot tube + single Pitot tube: 3.3 mm1995 [5] and dual-tip external diameter
conductivity probe Conductivity probe:single tip (0.35 mminner electrode)Partially-developedinflow conditions
Mossaand 6.42 to 7.30 57300 to 58000 Video camera CCD CCD 200,000 pixelsTolve Partially-developed1998 [36] inflow conditionsChanson and 6.33 to 8.48 36120 to 48580 Pitot tube + dual-tip Dual-tip: 25 ~m innerBrattberg conductivity probe electrode2000 [19] Partially-developed
inflow conditionsWaniewski et 11.5 to 19.3 10940 to 16680 Phase Doppler Resolution: 1~mal Anemometry2001 [48]Liu et al 2.00 to 3.32 86100 to Micro Acoustic 1 mm diameter2004 [33] 147680 Doppler Velocimeter conical sapphire tip
Murzyn et al 2.00 to 4.80 45990 to 88500 Optical fibre probes 0.010 mm sensor size,2005 [41], (double and single 1 mm tip spacing2007 [42] tips) Sampling rate up to 1
Wire gages MHzTwo thin wire: 1 mmapartPartially-developedinflow conditions
Lennon and 1.40 to 3.00 23930 to 27940 Single cameraHill Particle Image2006 [32] VelocimetryChanson 5.00 to 8.10 31500 to 51000 Single-tip Inner electrode: 0.352006 [5] (Estimation) conductivity probes'" mm in diameter
Pitot tube (3.3 mm Partially-developedexternal diameter) inflow conditions
Chanson 4.60 to 8.60 25000 to 98000 Single-tip Inner electrode: 0.352007 [12, 13] conductivity probes mm in diameter
Partially-developedinflow conditions
Gualtieri and 5.20 to 14.3 24680 to 58000 Single-tip Inner electrode: 0.35Chanson conductivity probe mm in diameter2008 [28] Partially-developed
inflow conditions
Two-Phase Gas-Liquid Flow Properties in the Hydraulic Jump
Table 1. Continued
511
D
Fr ReMeasurement
CommentsReferencestechniques
Murzyn and 5.10 to 8.30 38550 to 64100 Dual-tip conductivity 0.25 mm innerChanson probes electrode, 7 mm tip2007 [38], spacing2008 [39,40] Partially-developed
inflow conditions
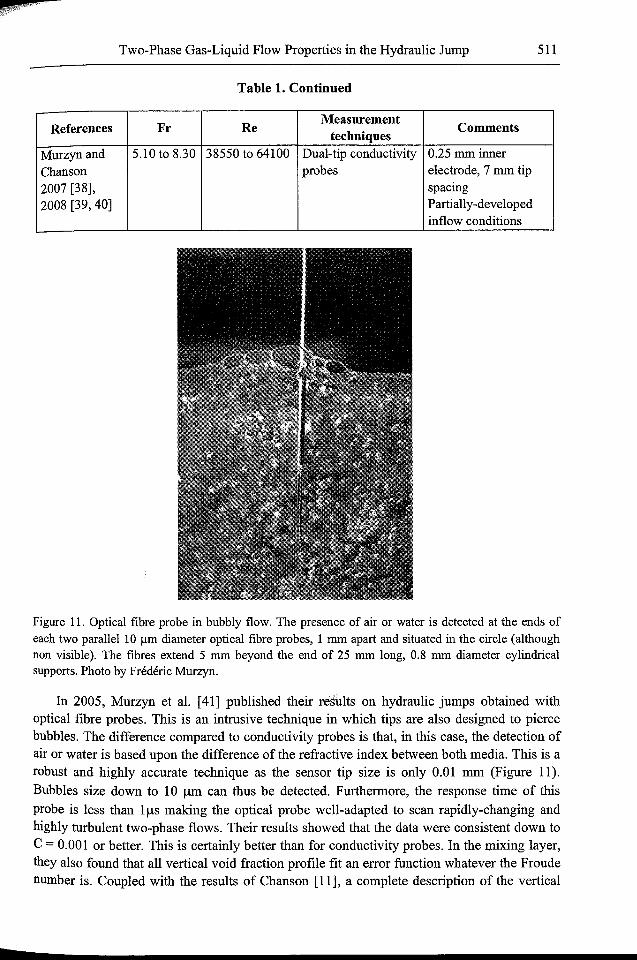
Figure 11. Optical fibre probe in bubbly flow. The presence of air or water is detected at the ends ofeach two parallel 10 IlID diameter optical fibre probes, 1 mm apart and situated in the circle (althoughnon visible). The fibres extend 5 mm beyond the end of 25 mm long, 0.8 mm diameter cylindricalsupports. Photo by Frederic Murzyn.
In 2005, Murzyn et al. [41] published their results on hydraulic jumps obtained withoptical fibre probes. This is an intrusive technique in which tips are also designed to piercebubbles. The difference compared to conductivity probes is that, in this case, the detection ofair or water is based upon the difference of the refractive index between both media. This is arobust and highly accurate technique as the sensor tip size is only 0.01 mm (Figure 11).
Bubbles size down to 10 f.lm can thus be detected. Furthermore, the response time of this
probe is less than If.ls making the optical probe well-adapted to scan rapidly-changing andhighly turbulent two-phase flows. Their results showed that the data were consistent down toC = 0.001 or better. This is certainly better than for conductivity probes. In the mixing layer,they also found that all vertical void fraction profile fit an error function whatever the Froudenumber is. Coupled with the results of Chanson [11], a complete description of the vertical
...512 Frederic Murzyn and Hubert Chanson
void fraction profiles is available in the turbulent shear layer as well as on the mixing layerfor a wide range of Froude numbers (2 < Fr < 8.5).
Murzyn et al. [42] have also investigated the free surface motion using two home-madethin wire gages (diameter = 0.05 mm, 1 mm apart). New description of the free surfacedynamics has been made in order to investigate the free surface interaction with turbulence.This part may be considered as independent of the bubbly flow. Nevertheless, the free surfacebehavior strongly influences the flow dynamics. Thus, it will be discussed in this chapter aswell. Concerning the free surface levels, their results pointed out a peak of turbulentfluctuations in the first half of the roller where turbulence production is the most intense.Downstream of this maximum, turbulence levels regularly decreased to reach smallest levels.Furthermore, using a correlation technique, typical length scales have also been estimated tobe smaller than 5d1 depicting the turbulent structures developing at the free surface andindicating that the upstream conditions have some influence on the predominant scales of theflow. Other contributions were obtained in different ways with different goals. They refereither to non intrusive techniques such as PIV or LDV or to other intrusive techniques thatwere not fully satisfying.
A relevant contribution has been made by Mossa and Tolve [36]. Using a video camera,they proposed to analyze the air concentration in hydraulic jumps through image processing.Their non invasive technique was able not only able to evaluate air concentration successfullybut also to visualize coherent structures of turbulence. Nevertheless, they were limited interms of experimental conditions. Indeed, only three Froude numbers (in the same range)were studied. Anyway, their technique seemed to be very promising and would need furtherinvestigations.
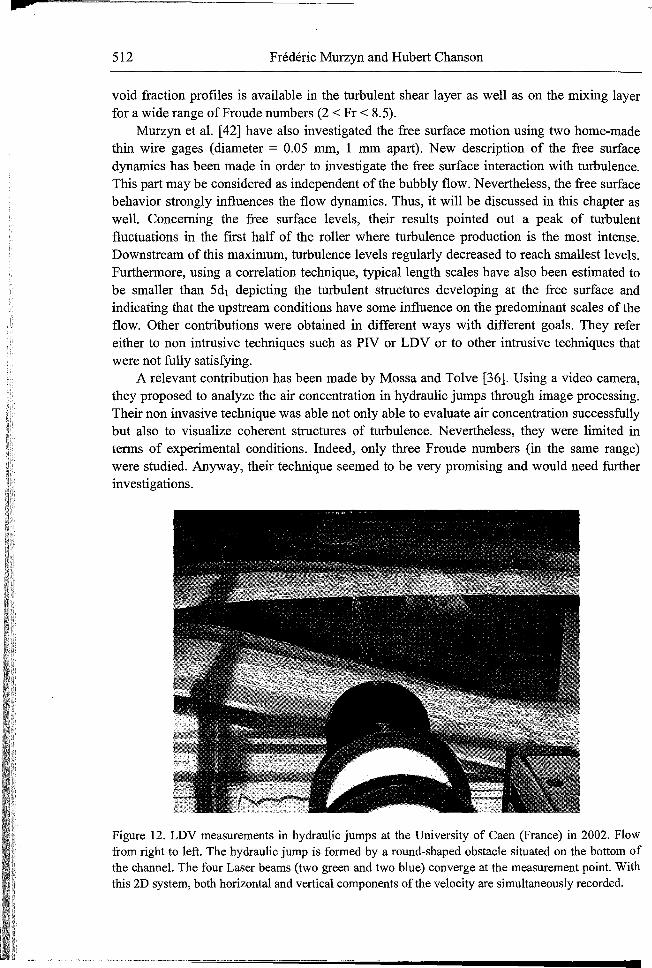
Figure 12. LDV measurements in hydraulic jumps at the University of Caen (France) in 2002. Flowfrom right to left. The hydraulic jump is formed by a round-shaped obstacle situated on the bottom ofthe channel. The four Laser beams (two green and two blue) converge at the measurement point. Withthis 2D system, both horizontal and vertical components ofthe velocity are simultaneously recorded.
Two-Phase Gas-Liquid Flow Properties in the Hydraulic Jump 513
z
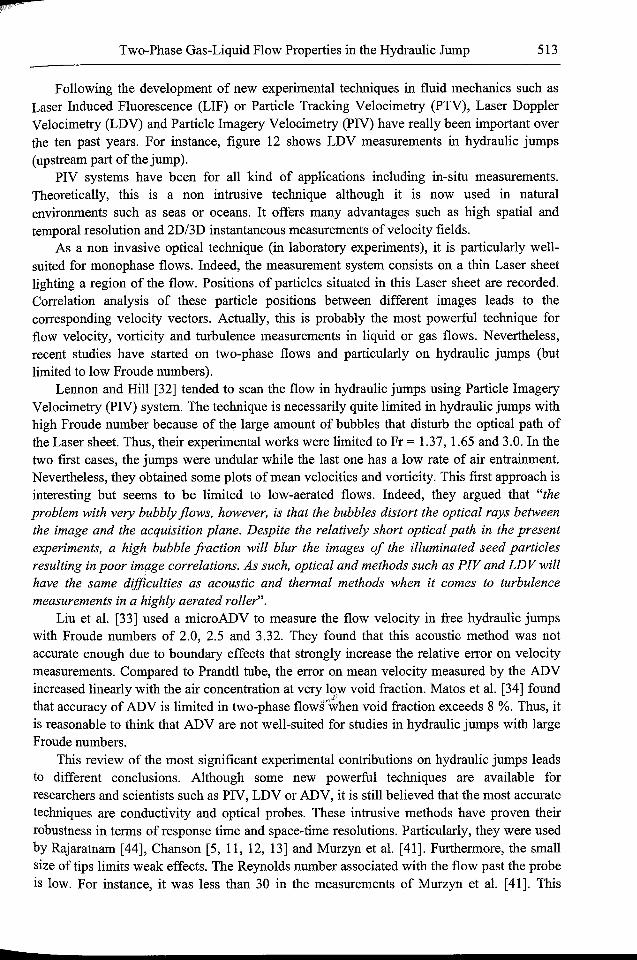
Following the development of new experimental techniques in fluid mechanics such asLaser Induced Fluorescence (LIF) or Particle Tracking Velocimetry (PTV), Laser DopplerVelocimetry (LDV) and Particle Imagery Velocimetry (PIV) have really been important overthe ten past years. For instance, figure 12 shows LDV measurements in hydraulic jumps(upstream part of the jump).
PIV systems have been for all kind of applications including in-situ measurements.Theoretically, this is a non intrusive technique although it is now used in naturalenvironments such as seas or oceans. It offers many advantages such as high spatial andtemporal resolution and 2D/3D instantaneous measurements ofvelocity fields.
As a non invasive optical technique (in laboratory experiments), it is particularly wellsuited for monophase flows. Indeed, the measurement system consists on a thin Laser sheetlighting a region of the flow. Positions of particles situated in this Laser sheet are recorded.Correlation analysis of these particle positions between different images leads to thecorresponding velocity vectors. Actually, this is probably the most powerful technique forflow velocity, vorticity and turbulence measurements in liquid or gas flows. Nevertheless,recent studies have started on two-phase flows and particularly on hydraulic jumps (butlimited to low Froude numbers).
Lennon and Hill [32] tended to scan the flow in hydraulic jumps using Particle ImageryVelocimetry (PIV) system. The technique is necessarily quite limited in hydraulic jumps withhigh Froude number because of the large amount of bubbles that disturb the optical path ofthe Laser sheet. Thus, their experimental works were limited to Fr = 1.37, 1.65 and 3.0. In thetwo first cases, the jumps were undular while the last one has a low rate of air entrainment.Nevertheless, they obtained some plots of mean velocities and vorticity. This first approach isinteresting but seems to be limited to low-aerated flows. Indeed, they argued that "theproblem with very bubbly flows, however, is that the bubbles distort the optical rays betweenthe image and the acquisition plane. Despite the relatively short optical path in the presentexperiments, a high bubble fraction will blur the images of the illuminated seed particlesresulting in poor im(lge correlations. As such, optical and methods such as PIV and LDV willhave the same difficulties as acoustic and thermal methods when it comes to turbulencemeasurements in a highly aerated roller".
Liu et al. [33] used a microADV to measure the flow velocity in free hydraulic jumpswith Froude numbers of 2.0, 2.5 and 3.32. They found that this acoustic method was notaccurate enough due to boundary effects that strongly increase the relative error on velocitymeasurements. Compared to Prandtl tube, the error on mean velocity measured by the ADVincreased linearly with the air concentration at very low void fraction. Matos et al. [34] foundthat accuracy of ADV is limited in two-phase flowt~hen void fraction exceeds 8 %. Thus, itis reasonable to think that ADV are not well-suited for studies in hydraulic jumps with largeFroude numbers.
This review of the most significant experimental contributions on hydraulic jumps leadsto different conclusions. Although some new powerful techniques are available forresearchers and scientists such as PIV, LDV or ADV, it is still believed that the most accuratetechniques are conductivity and optical probes. These intrusive methods have proven theirrobustness in terms of response time and space-time resolutions. Particularly, they were usedby Rajaratnam [44], Chanson [5, 11, 12, 13] and Murzyn et al. [41]. Furthermore, the smallsize of tips limits weak effects. The Reynolds number associated with the flow past the probeis low. For instance, it was less than 30 in the measurements of Murzyn et al. [41]. This
514 Frederic Murzyn and Hubert Chanson
contributes to minimize uncertainty on measurements. Optical probes can measure bubblesizes down to 10 /lm and void fraction down to 0.001 or better.
Concerning the data acquisition, attention must be focused on duration and sampling rateto ensure their quality. For conductivity probes, Chanson [12, 14] performed a sensitivityanalysis on the effects of sampling duration Tscan and sampling rate Fscan on void fraction andbubble count rate in hydraulic jumps. The sampling duration was selected within the range0.7 s < Tscan < 300 s and the sampling rate was between 600 Hz < Fscan < 80 kHz. First, thedata showed that the sampling rate had almost no effect on the void fraction for a givensampling duration. However, the bubble count rate was underestimated for sampling ratesbelow 5 to 8 kHz. Second, the sampling duration had little effect on both void fraction andbubble count rate for scan periods longer than 30 to 40 s. Then, he recommended a samplingduration of 45 s and a sampling rate of 20 kHz. For optical probes, Murzyn et al. [41]acquired their data during a maximum sampling duration of 120 seconds. Nevertheless, assoon as 10000 bubbles were recorded, data acquisition stopped. To date, these experimentalconditions are supposed to be large enough.
1.3. Physical Modeling of the Hydraulic Jump
Hydraulic jumps are commonly encountered in natural streams. This complex two-phase flowalways requires more and more investigations. Despite numerous studies over the lastdecades, there is still a lack of knowledge on the physical mechanisms involved in diffusion,turbulence and mixing processes occurring in such flows. Thus, developments of numericalcodes, analytical methods and experimental works are fundamental to improve our knowledgeon the flow dynamics. Nevertheless, analytical and numerical studies of multiphase flows arequite difficult due to the large amount of relevant equations to solve. Furthermore, manyinteractions take place between bubbles, droplets, particles, free surface, turbulence that makeanalytical methods quite limited. The same complexity often imposes reduced descriptions(averaged equations, basic hypothesis) for numerical modeling which can then not be fullysuccessful and satisfying.
Experimental investigations are thus required to help numerical modelers to calibratetheir codes with empirical data. This is the strong interaction between numerical andexperimental studies that will lead research to a better knowledge of the physical mechanismsinvolved in these flows. Experimental investigations are numerous and many sets of data areavailable in the literature regarding the two-phase flow properties (void fraction, bubblefrequency, bubble velocity... ). These were mainly obtained using phase-detection probes(optical fibre probes or conductivity probes). The accuracy of these measurements, the resultsand their meanings for natural flows are not only linked to the data acquisition parameters butalso to the experimental conditions (similitude). Data interpretation (extrapolation) to naturalstreams requires some similitude criterion that must be achieved (geometric, kinematic ordynamic similitude). Generally-speaking, two-phase flow laboratory experiments are basedon a geometric similitude. This means that model and prototype scales are geometricallysimilar. Note that dynamic similitude is sometimes used as well.
In fluid mechanics, the governing equations for fluid flow motion are known as theNavier-Stokes equations. In a free surface open-channel flow, gravity effect can not beneglected. The corresponding Navier-Stokes equations are then given by:
Two-Phase Gas-Liquid Flow Properties in the Hydraulic Jump
du 1 ap-=---+\)~u
dt pax
dv 1 ap-=---+\)~vdt pay
dw lap-=----g+\)~Wdt paz
515
(6)
Where (u, v, w) are the velocity components (mls), p the density of water (kg/m\ p thepressure (Pa), g the acceleration of gravity (mls2
), (x, y, z) the coordinate axis (z positiveupward), v the kinematic viscosity ofwater (m2/s).
To date, these nonlinear differential equations remain still unsolved. Indeed, turbulentflows are characterized by random processes that can not be exactly modeled unless somerestrictive hypothesis. To date, only approximated solutions can be proposed. That is one ofreason which explains why weather forecasts become meaningless after more than 1 week.This is partially due to random and unpredictable phenomena that may occur betweenforecasts and reality. It is not unbelievable to think that the Navier-Stokes equation willremain unsolved for a long time. This partially explains the limited number of numericalstudies on hydraulic jumps compared to experimental investigations: modeling turbulence isdifficult but modeling turbulence of two-phase flows becomes nearly impossible.
Equations (6) are not dimensionless. To make them so, let us introduce newdimensionless variables:
+ X y+ Y z+ ZX =- = =
d l d l d l
+ U v+ v w+ w (7)u =- =VI VI VI
t+ VI p+ P= -tdl
2pV I
Then, let us introduce them in equations (6). We obtain new dimensionless Navier-Stokesequations given by:
du+ 8p+ 1 '"'~,[" +--=---+-~udt+ ax+ Re
dv+ 8p+ 1 +--=---+-~vdt+ fJy+ Re
dw+ 8p+ 1 1 +--=-----+-~wdt+ 8z+ Fr Re
(8)
•
To ensure similarity between model (laboratory) and prototype (at scale), one mustensure that Navier-Stokes equations are similar in both cases. Indeed, same equations will
516 Frederic Murzyn and Hubert Chanson
have same solutions. For a free-surface open-channel flow (such as the hydraulic jump), thisis achieved when Froude and Reynolds numbers for model and prototype are equal (Eq. 8).Theoretically, this means that Froude and Reynolds similitude must be simultaneouslyachieved. Unless rare cases, they can not be simultaneously achieved. Nevertheless, for a freesurface flow, the Reynolds condition may be eliminated when diffusion process can beneglected (Re» 1).
The dimensional analysis proposed by Chanson [12] leads to a similar conclusion.Considering a hydraulic jump in a horizontal, rectangular channel, it is supposed that all flowproperties (C, F, U, dmbc\, ... ) depend on the fluid and experimental set-up properties. That is:
(9)
where C is the void fraction, F the bubble frequency, V the velocity, dmbc1 the mean bubble
chord length, x, y and z the coordinates, Yair and Vwater the kinematic viscosity of air and water
respectively, Pair and Pwater the density of air and water respectively. 8 is the boundary layerthickness of the inflow (defining partially or fully-developed inflow conditions). Neglecting
compressibility effects, one can ignore Pair and Yair such as equation (9) may be expressed indimensionless terms:
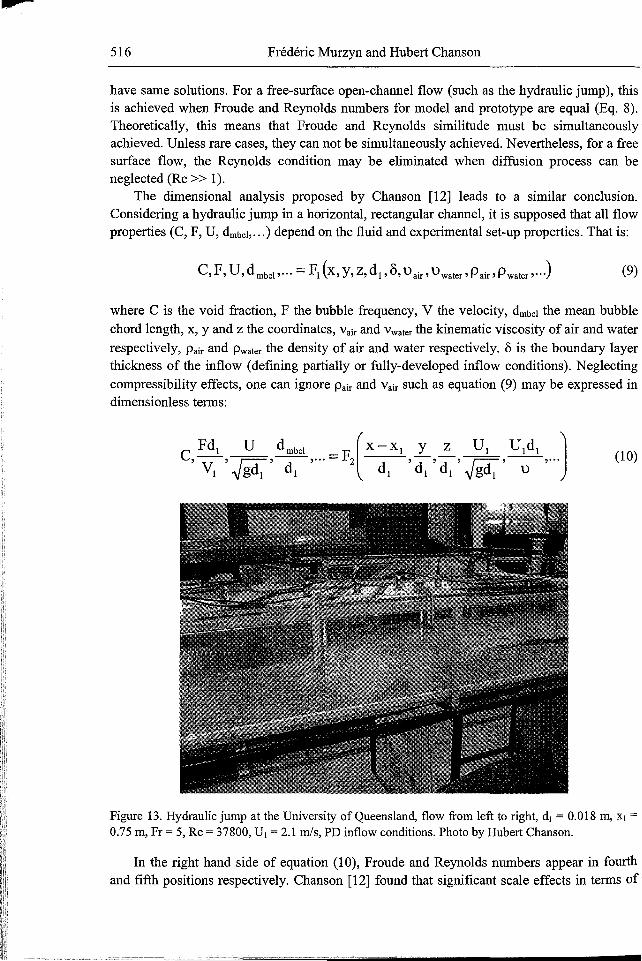
Figure 13. Hydraulic jump at the University of Queensland, flow from left to right, dl = 0.018 m, Xl =0.75 m, Fr = 5, Re = 37800, U I = 2.1 mis, PD inflow conditions. Photo by Hubert Chanson.
In the right hand side of equation (10), Froude and Reynolds numbers appear in fourthand fifth positions respectively. Chanson [12] found that significant scale effects in terms of
Two-Phase Gas-Liquid Flow Properties in the Hydraulic Jump 517
•
air-water flows properties (void fraction, bubble count rate and bubble chord timedistributions) may arise if only a Froude similitude is used. Thus, attention must be drawn onReynolds number as well. Recently, Gualtieri and Chanson [28] analyzed Froude numbereffect on air entrainment in the hydraulic jumps with Froude numbers up to 14.3. Theyshowed that aeration properties are enhanced by higher Froude numbers.
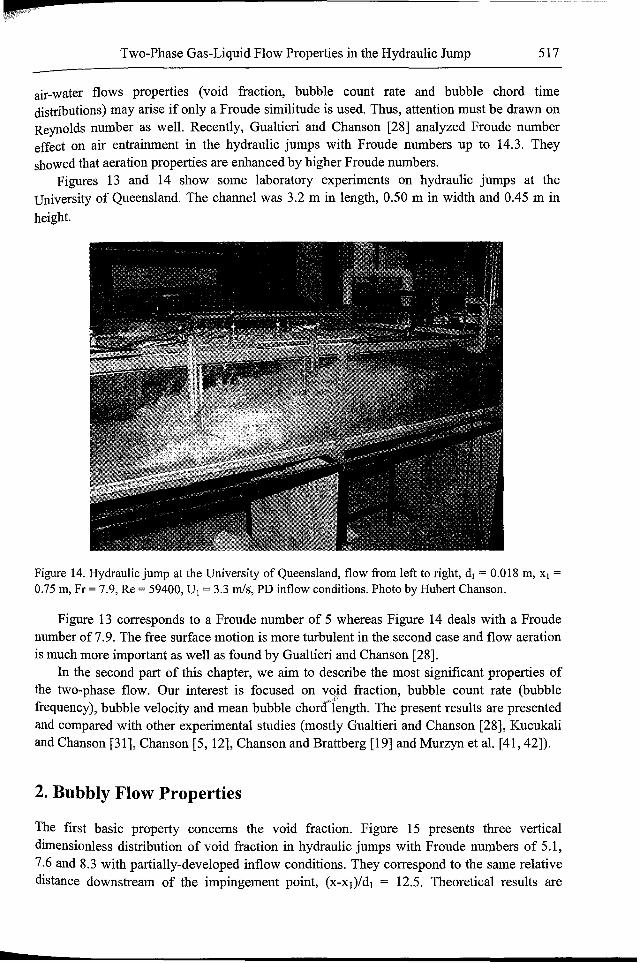
Figures 13 and 14 show some laboratory experiments on hydraulic jumps at theUniversity of Queensland. The channel was 3.2 m in length, 0.50 m in width and 0.45 m in
height.
Figure 14. Hydraulic jump at the University of Queensland, flow from left to right, d[ = 0.018 m, Xl =0.75 m, Fr = 7.9, Re = 59400, U i = 3.3 mis, PD inflow conditions. Photo by Hubert Chanson.
Figure 13 corresponds to a Froude number of 5 whereas Figure 14 deals with a Froudenumber of7.9. The free surface motion is more turbulent in the second case and flow aerationis much more important as well as found by Gualtieri and Chanson [28].
In the second part of this chapter, we aim to describe the most significant properties ofthe two-phase flow. Our interest is focused on void fraction, bubble count rate (bubblefrequency), bubble velocity and mean bubble chordl~ngth. The present results are presentedand compared with other experimental studies (mostly Gualtieri and Chanson [28], Kucukaliand Chanson [31], Chanson [5, 12], Chanson and Brattberg [19] and Murzyn et al. [41,42]).
2. Bubbly Flow Properties
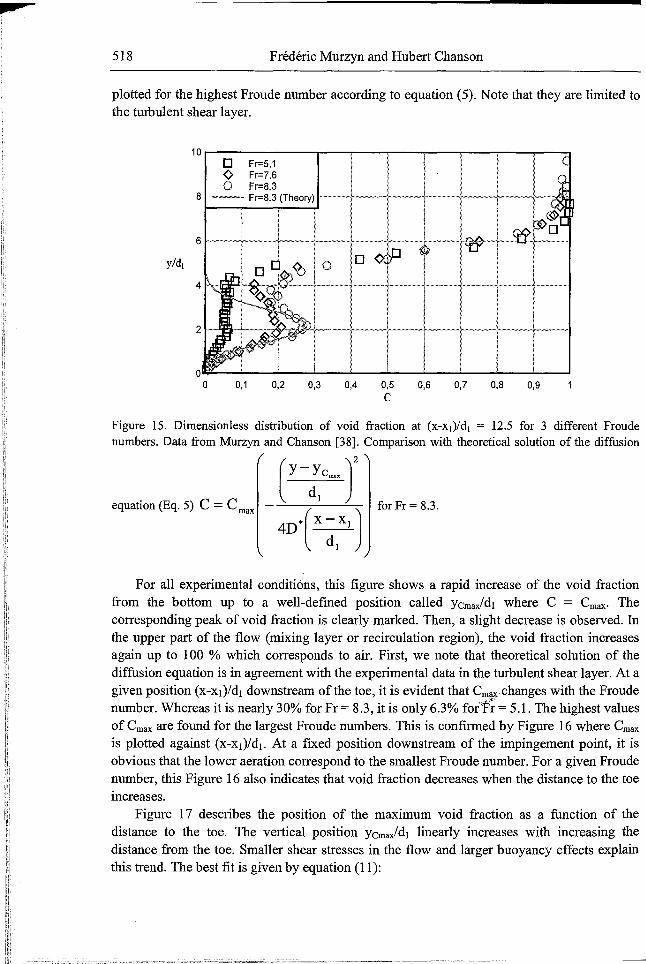
The first basic property concerns the void fraction. Figure 15 presents three verticaldimensionless distribution of void fraction in hydraulic jumps with Froude numbers of 5.1,7.6 and 8.3 with partially-developed inflow conditions. They correspond to the same relativedistance downstream of the impingement point, (x-xI)/d l = 12.5. Theoretical results are
518 Frederic Murzyn and Hubert Chanson
plotted for the highest Froude number according to equation (5). Note that they are limited tothe turbulent shear layer.
10 ...--------,---r----,,....--,....----r---,....--....,....---,
0,90,80,70,60,5C
0,40,30,20,1Oll;l'----'----'---'----'---"------'----'---'-----'------'a
o Fr=5.1¢ Fr=7.6o Fr=8.3
8 -- Fr=8.3 (Theory) I~-+-~--_+··----·r-_t··-·~--+--·-+·~_;:(!
Figure 15. Dimensionless distribution of void fraction at (x-xl)/d1 = 12.5 for 3 different Froudenumbers. Data from Murzyn and Chanson [38]. Comparison with theoretical solution of the diffusion
equation (Eq. 5) C = Cmax for Fr = 8.3.
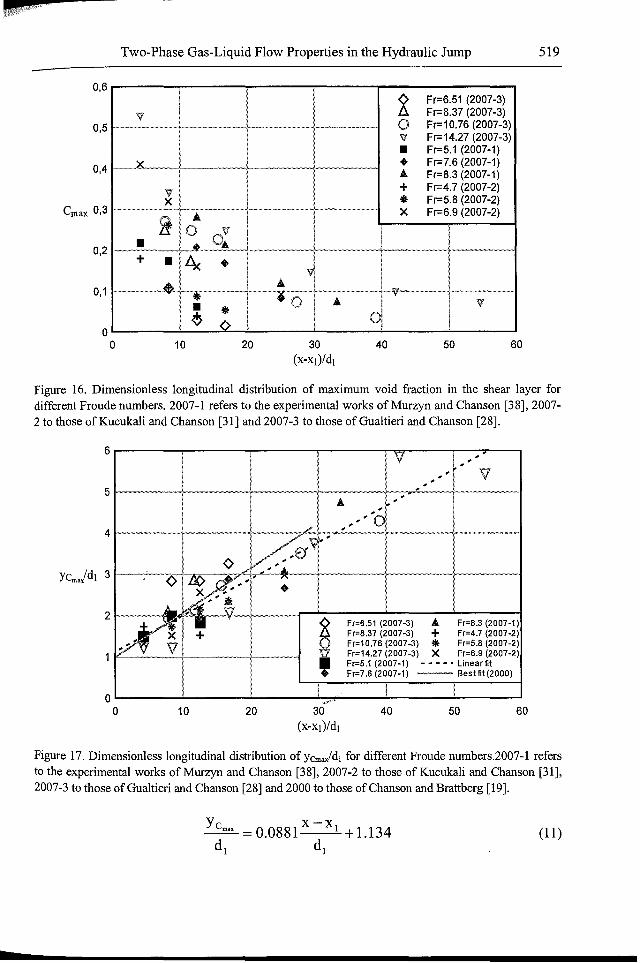
For all experimental conditions, this figure shows a rapid increase of the void fractionfrom the bottom up to a well-defined position called YCmax/dl where C = Cmax. Thecorresponding peak of void fraction is clearly marked. Then, a slight decrease is observed. Inthe upper part of the flow (mixing layer or recirculation region), the void fraction increasesagain up to 100 % which corresponds to air. First, we note that theoretical solution of thediffusion equation is in agreement with the experimental data in the turbulent shear layer. At agiven position (x-xI)/dl downstream ofthe toe, it is evident that Cm'll'changes with the Froudenumber. Whereas it is nearly 30% for Fr = 8.3, it is only 6.3% for"Fr = 5.1. The highest valuesof Cmax are found for the largest Froude numbers. This is confirmed by Figure 16 where Cmaxis plotted against (x-xI)/dl. At a fixed position downstream of the impingement point, it isobvious that the lower aeration correspond to the smallest Froude number. For a given Froudenumber, this Figure 16 also indicates that void fraction decreases when the distance to the toeincreases.
Figure 17 describes the position of the maximum void fraction as a function of thedistance to the toe. The vertical position Ycmax/dl linearly increases with increasing thedistance from the toe. Smaller shear stresses in the flow and larger buoyancy effects explainthis trend. The best fit is given by equation (11):
Two-Phase Gas-Liquid Flow Properties in the Hydraulic Jump 519
6050402010
~Fr=6.51 (2007-3)
V Fr=8.37 (2007-3)0 Fr=10.76 (2007-3)V Fr=14.27 (2007-3)
• Fr=5.1 (2007-1))( I • Fr=7.6 (2007-1)
.A Fr=8.3 (2007-1)
V + Fr=4.7 (2007-2)X * Fr=5.8 (2007-2)
"ff~="~~'~ ~~~NNmffmffff X Fr=6.9 (2007-2).A0
0:!!
• ....+ • 4< • v
AI. .A
: • .A V
* 0~ <>oo
0,2
0,1
0,5
0,6
0,4
Cmax 0,3
Figure 16. Dimensionless longitudinal distribution of maximum void fraction in the shear layer fordifferent Froude numbers. 2007-1 refers to the experimental works of Murzyn and Chanson [38], 20072 to those of Kucukali and Chanson [31] and 2007-3 to those of Gualtieri and Chanson [28].
6 , ..l ..I ..
V5
4
Fr=6.51 (2007-3) .A Fr=B.3 (2007-1)Fr=B.37 (2007-3) + Fr=4.7 (2007-2)Fr=10.76 (2007-3) * Fr=5.B (2007-2)Fr=14.27 (2007-3) X Fr=6.9 (2007-2)Fr=5.1 (2007-1) - - - - • LinearfitFr=7.6 (2007-1) -- Best fit (2000)
605040o '-----....l...------'----..J.'-..,0;'/""'..'------"-----........------Io 10 20 30
(X-xI)/d1
Figure 17. Dimensionless longitudinal distribution ofYcmax/dl for different Froude numbers.2007-1 refersto the experimental works of Murzyn and Chanson [38], 2007-2 to those of Kucukali and Chanson [31],2007-3 to those of Gualtieri and Chanson [28] and 2000 to those of Chanson and Brattberg [19].
(11)
•
520 Frederic Murzyn and Hubert Chanson
A comparison is also shown with the best linear fit obtained by Chanson and Brattberg[19]. For this study, measurements were performed with a smaller sensor. The closeagreement between all data set would show that the main fmdings are nearly independent ofthe instrumentation characteristics.
2
20 40 60 80Frequency (Hz)
o Fr=5.1o Fr=7.6o Fr=8.3
100
o@
120 140
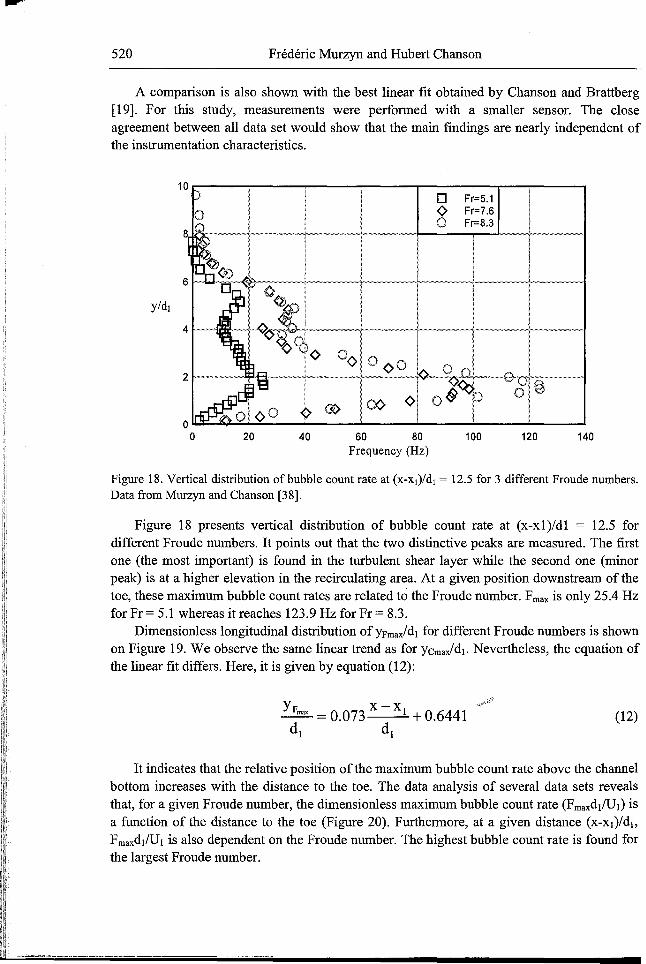
Figure 18. Vertical distribution of bubble count rate at (x-xl)/d1 = 12.5 for 3 different Froude numbers.Data from Murzyn and Chanson [38].
Figure 18 presents vertical distribution of bubble count rate at (x-xl)/dl = 12.5 fordifferent Froude numbers. It points out that the two distinctive peaks are measured. The firstone (the most important) is found in the turbulent shear layer while the second one (minorpeak) is at a higher elevation in the recirculating area. At a given position downstream of thetoe, these maximum bubble count rates are related to the Froude number. Fmax is only 25.4 Hzfor Fr = 5.1 whereas it reaches 123.9 Hz for Fr = 8.3.
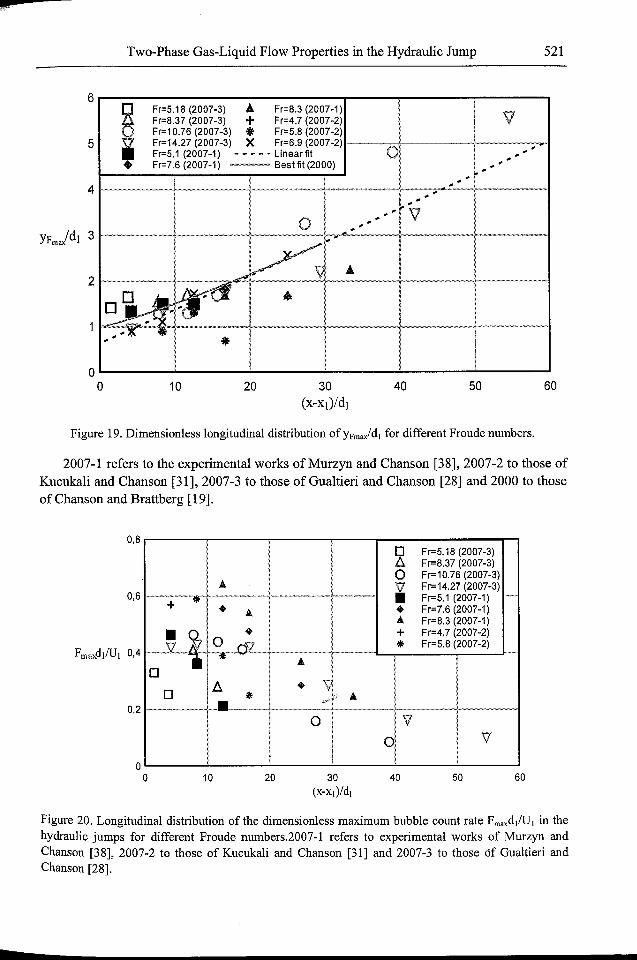
Dimensionless longitudinal distribution OfYFmax/dl for different Froude numbers is shownon Figure 19. We observe the same linear trend as for YCmax/dl' Nevertheless, the equation ofthe linear fit differs. Here, it is given by equation (12):
YFroax =0.073 X - Xl + 0.6441d l d l
(12)
It indicates that the relative position of the maximum bubble count rate above the channelbottom increases with the distance to the toe. The data analysis of several data sets revealsthat, for a given Froude number, the dimensionless maximum bubble count rate (FmaxdllUl) isa function of the distance to the toe (Figure 20). Furthermore, at a given distance (x-xl)/db
Fmaxdl/Ul is also dependent on the Froude number. The highest bubble count rate is found forthe largest Froude number.
j44-
Two-Phase Gas-Liquid Flow Properties in the Hydraulic Jump 521
H Fr=5.18 (2007-3) A- Fr=8.3 (2007-1)VFr=8.37 (2007-3) + Fr=4.7 (2007-2)
0 Fr=10.76 (2007-3) .. Fr=5.8 (2007-2)
i Fr=14.27 (2007-3) X Fr=6.9 (2007-2)0
__~..w
Fr=5.1 (2007-1) - - - - • Linear fit .. .... ..• Fr=7.6 (2007-1) --- Best fit (2000) .. ...... ....
~ .. "..
.... V0 .. .... ..-""","""-..,,,-,,
~J.AA-
DD ...A~~ •.~\.)l
~;'cJ1
"",,,,,,,,,,, .. ..
6
5
4
2
oo 10 20 40 50 60
Figure 19. Dimensionless longitudinal distribution ofYFmax/dl for different Froude numbers.
2007-1 refers to the experimental works of Murzyn and Chanson [38], 2007-2 to those ofKucukali and Chanson [31],2007-3 to those of Gualtieri and Chanson [28] and 2000 to thoseof Chanson and Brattberg [19].
I
~l Fr=5.18 (2007-3),! Fr=8.37 (2007-3)\ 0 Fr=10.76 (2007-3)
A i Fr=14.27 (2007-3).-...~.+.~-....• Fr=5.1 (2007-1) 1··_...
• A • Fr=7.6 (2007-1)A Fr=8.3 (2007-1)
• 2r• + Fr=4.7 (2007-2)
0 riJ *' Fr=5.8 (2007-2)--2--1 ~~,~
'" A0
~ • 'V0 • *' ,'f' if A
0 \]
0 \]
0,8
0,6
0,2
oo 10 20 40 50 60
z
Figure 20. Longitudinal distribution of the dimensionless maximum bubble count rate Fmaxd/U1 in thehydraulic jumps for different Froude numbers.2007-1 refers to experimental works of Murzyn andChanson [38], 2007-2 to those of Kucukali and Chanson [31] and 2007-3 to those of Gualtieri andChanson [28].
522 Frederic Murzyn and Hubert Chanson
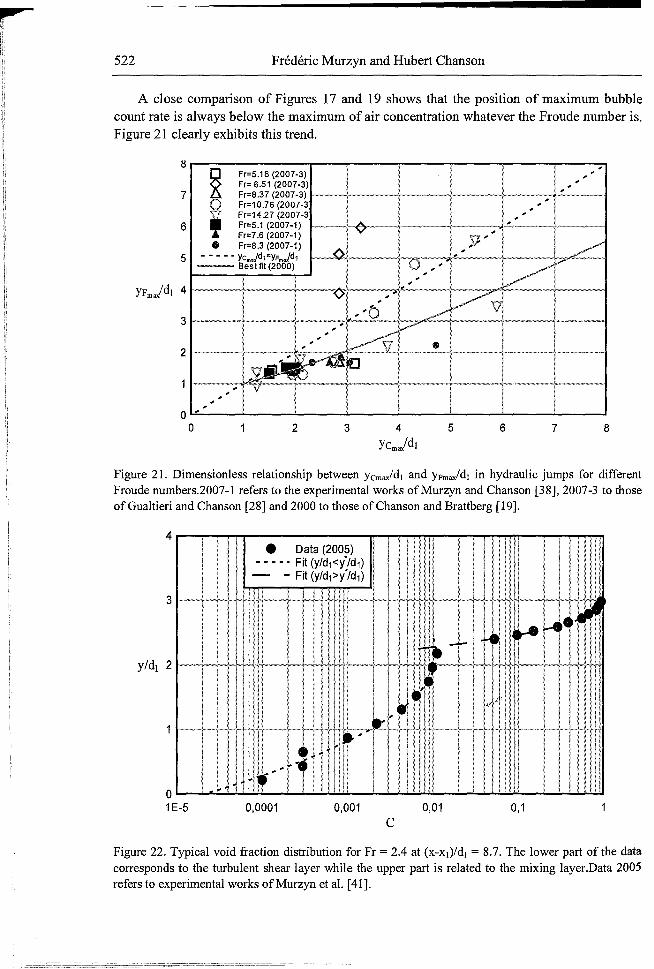
A close comparison of Figures 17 and 19 shows that the position of maximum bubblecount rate is always below the maximum of air concentration whatever the Froude number is.Figure 21 clearly exhibits this trend.
I:!r--------T""""-~---_r_--""""l"---""""l"--____r--~
876532
Fr=5.18 (2007-3)Fr= 6.51 (2007-3)Fr=8.37 (2007-3) 1--"'~0'~-~~-r---~-'+~~-"'~""-r-~~~~';"""-~~-~1Fr=10.76 (2007-3Fr=14.27 (2007-3Fr=5.1 (2007-1) I~-'~~~~'''-'-l'~-''~~Fr=7.6 (2007-1)
~,• Fr=8.3 (2007-1)
- - - - • ycm./d1=YFm./d1--- Bestfit(2000)
"">"""""~''',,''=«,
7
5
6
o 'o
Figure 21. Dimensionless relationship between Yemax/dl and YFmax/dl in hydraulic jumps for differentFroude numbers.2007-1 refers to the experimental works of Murzyn and Chanson [38], 2007-3 to thoseof Gualtieri and Chanson [28] and 2000 to those of Chanson and Brattberg [19].
4r--~-
oL...--"-_
1E-5
• Data (2005)- - - -. Fit (y/d1<y"/d1)
- - Fi~ (y/d1>y"/d1)
0,001
c0,01 0,1
Figure 22. Typical void fraction distribution for Fr = 2.4 at (x-xl)/d1 = 8.7. The lower part of the datacorresponds to the turbulent shear layer while the upper part is related to the mixing layer.Data 2005refers to experimental works of Murzyn et al. [41].
Two-Phase Gas-Liquid Flow Properties in the Hydraulic Jump 523
This fmding was first observed by Chanson and Brattberg [19]. In 2006, Chanson [12]argued that it could be due to a "double diffusion process where vorticity and air bubblesdiffuse at a different rate and in a different manner downstream of the impingement point".This situation would mean some dissymmetric turbulent shear stress. Indeed, at a given voidfraction, it is well-known the maximum bubble count rate is generally found in regions ofhigh shear and large velocity.
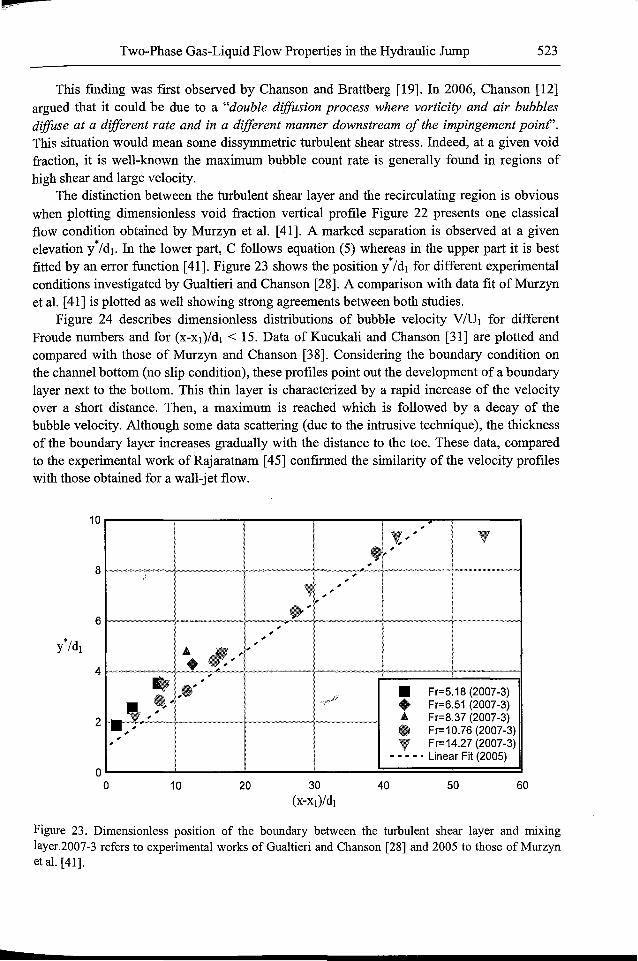
The distinction between the turbulent shear layer and the recirculating region is obviouswhen plotting dimensionless void fraction vertical profile Figure 22 presents one classicalflow condition obtained by Murzyn et al. [41]. A marked separation is observed at a givenelevation y*/d1• In the lower part, C follows equation (5) whereas in the upper part it is bestfitted by an error function [41]. Figure 23 shows the position y*/d1 for different experimentalconditions investigated by Gualtieri and Chanson [28]. A comparison with data fit of Murzynet al. [41] is plotted as well showing strong agreements between both studies.
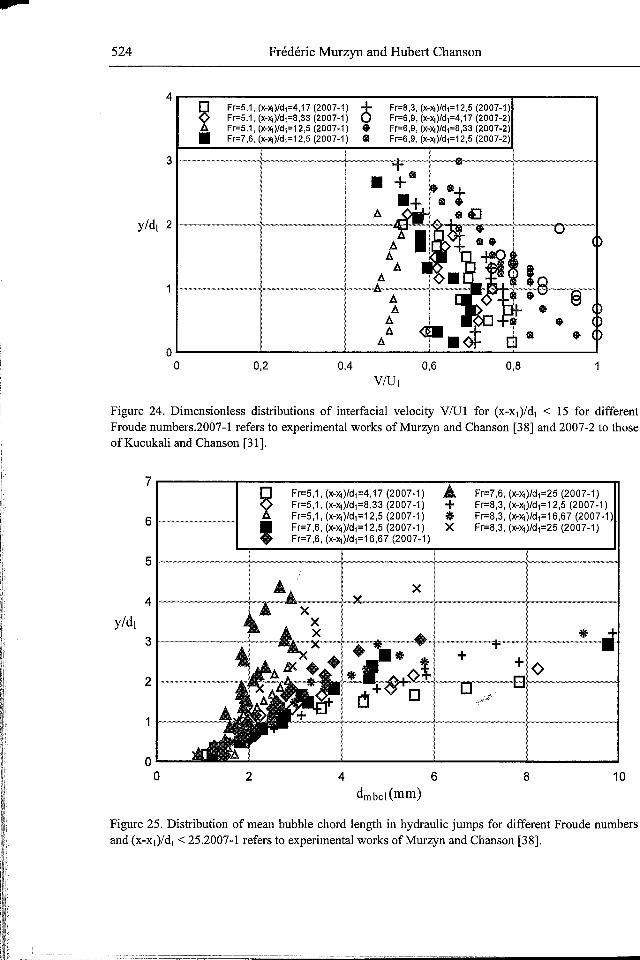
Figure 24 describes dimensionless distributions of bubble velocity VlU1 for differentFroude numbers and for (x-xl)/d1 < 15. Data of Kucukali and Chanson [31] are plotted andcompared with those of Murzyn and Chanson [38]. Considering the boundary condition onthe channel bottom (no slip condition), these profiles point out the development of a boundarylayer next to the bottom. This thin layer is characterized by a rapid increase of the velocityover a short distance. Then, a maximum is reached which is followed by a decay of thebubble velocity. Although some data scattering (due to the intrusive technique), the thicknessof the boundary layer increases gradually with the distance to the toe. These data, comparedto the experimental work of Rajaratnam [45] confirmed the similarity of the velocity profileswith those obtained for a wall-jet flow.
6050402010
,l;, ,
l',. ,
",,
..~,,,
,,,A .",' " I•,. ,lit • Fr=5.18 (2007-3)
-'- • Fr=6.51 (2007-3),,-A Fr=8.37 (2007-3).,.
Fr=10.76 (2007-3),,Fr=14.27 (2007-3),
- - - _. Linear Fit (2005)
oo
2
10
4
6
8
Figure 23. Dimensionless position of the boundary between the turbulent shear layer and mixinglayer.2007-3 refers to experimental works of Gualtieri and Chanson [28] and 2005 to those of Murzynet al. [41].
z
Fr=8,3, (x-Xj)/d1=12,5 (2007-1)Fr=6,9, (x-x1)/d1=4,17 (2007-2)Fr=6,9, (x-xl)/d1=8,33 (2007-2)Fr=6,9, (x-Xj)/d1=12,5 (2007-2)
524 Frederic Murzyn and Hubert Chanson
4r-------------------..,.-----..,
~Fr=5.1, (x-Xj)/d1=4,17 (2007-1) +Fr=5.1, (x-Xj)/d1=8,33 (2007-1) 0Fr=5.1, (x-Xj)/d1=12,5 (2007-1) •
• Fr=7,6, (X-Xi)/d1=12,5 (2007-1) 8
A
AA
AA
AA
AA 8
A I0,2 0,4 0,6 0,8
V/Uj
Figure 24. Dimensionless distributions of interfacial velocity V/U1 for (x-xl)/dj < 15 for differentFroude numbers.2007-1 refers to experimental works of Murzyn and Chanson [38] and 2007-2 to thoseofKucukali and Chanson [31].
Fr=5,1, (x-x1)/d1=4,17 (2007-1) ....Fr=5,1, (x-x1)/d1=8,33 (2007-1) +Fr=5,1, (x-x1)/d1=12,5 (2007-1) •Fr=7,6, (x-x1)/d1=12,5 (2007-1) XFr=7,6, (x-x1)/d1=16,67 (2007-1)
10
7
6
5
4
y/dl3
2
1 -
00 2 4 6
Fr=7,6, (x-x1)/d1=25 (2007-1)Fr=8,3, (x-x1)/d1=12,5 (2007-1)Fr=8,3, (X-X1)/d1=16,67 (2007-1)Fr=8,3, (x-x1)/d1=25 (2007-1)
8
Figure 25. Distribution of mean bubble chord length in hydraulic jumps for different Froude numbersand (x-xj)/d1 < 25.2007-1 refers to experimental works of Murzyn and Chanson [38].
-Two-Phase Gas-Liquid Flow Properties in the Hydraulic Jump 525
»
Figure 25 presents the mean bubble chord length for different Froude numbers and(x-xI)/d l < 25. Data are those of Murzyn and Chanson [38]. The data indicate thatmaximum mean bubble chord length do not exceed 10 mm in the turbulent shear layer.This is in agreement with photos, visual observations and videos made during theexperiments. Furthermore, the smallest bubbles are found to be closed to the bottom. At agiven position (x-xI)/dI, the smallest bubbles were found in the region of higher shearstress. The order of magnitude is in agreement with those observed in previous studies[31,41].
3. Free Surface, Sprays and Splashing
The free surface has been investigated using different experimental techniques. The mostsignificant contributions regarding its dynamics with acoustic displacement meters are due toKucukali and Chanson [31] and Murzyn and Chanson [38]. Other studies include Mouaze etal. [37] and Murzyn et al. [42] with wire gages and Chanson [6, 11, 12], Mossa and Tolve[36], Kucukali and Chanson [31] and Murzyn and Chanson [38] for flow visualizations.While acoustic displacement meters and flow visualizations are non invasive, wire gages areintrusive. Nevertheless, their size (wire diameter = 0.05 mm) ensures minimized disturbances.Photographic techniques and conductivity probes were also used to study the free surface [6,31, 38]. In this part, we aim to present some results that bring information on the air/waterinterface. This is an important point because its large amplitude (spatial) motions and rapid(temporal) variations affect the mixing.
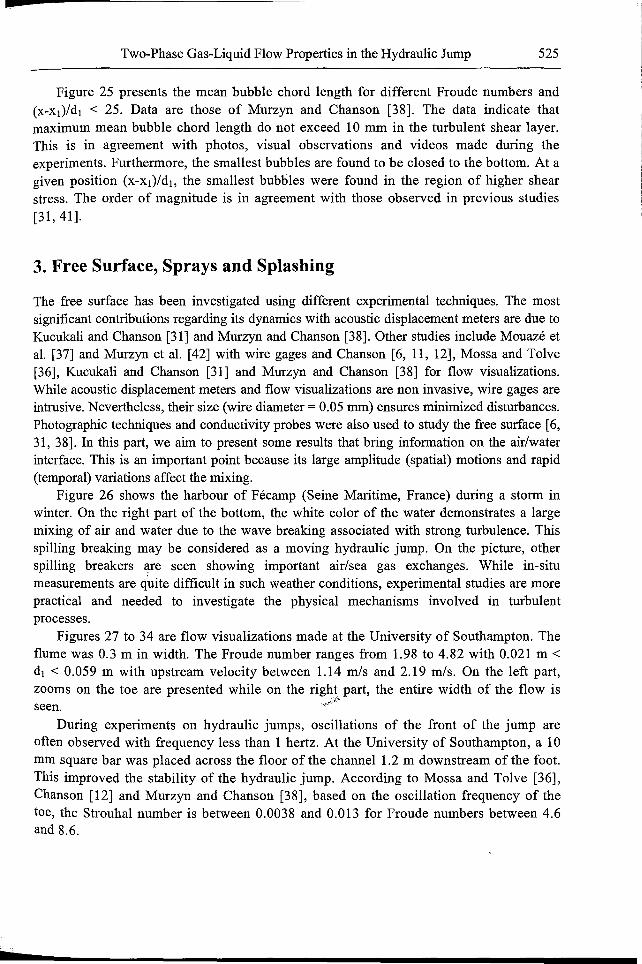
Figure 26 shows the harbour of Fecamp (Seine Maritime, France) during a storm inwinter. On the right part of the bottom, the white color of the water demonstrates a largemixing of air and water due to the wave breaking associated with strong turbulence. Thisspilling breaking may be considered as a moving hydraulic jump. On the picture, otherspilling breakers are seen showing important air/sea gas exchanges. While in-situmeasurements are quite difficult in such weather conditions, experimental studies are morepractical and needed to investigate the physical mechanisms involved in turbulentprocesses.
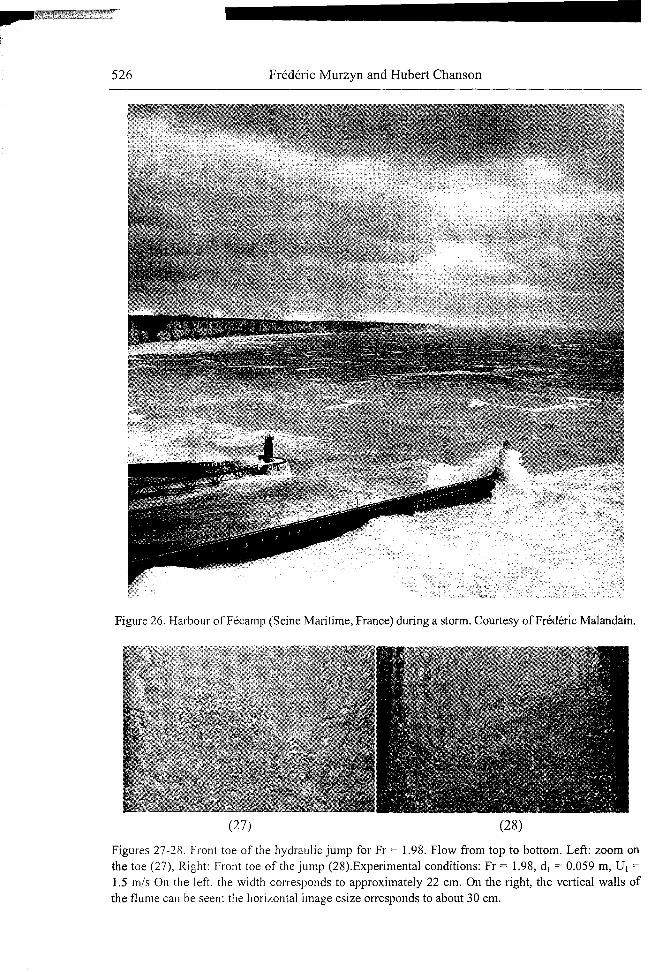
Figures 27 to 34 are flow visualizations made at the University of Southampton. Theflume was 0.3 m in width. The Froude number ranges from 1.98 to 4.82 with 0.021 m <dl < 0.059 m with upstream velocity between 1.14 m/s and 2.19 m/s. On the left part,zooms on the toe are presented while on the right part, the entire width of the flow is
j/
seen. "~
During experiments on hydraulic jumps, oscillations of the front of the jump areoften observed with frequency less than 1 hertz. At the University of Southampton, a 10mm square bar was placed across the floor of the channel 1.2 m downstream of the foot.This improved the stability of the hydraulic jump. According to Mossa and Tolve [36],Chanson [12] and Murzyn and Chanson [38], based on the oscillation frequency of thetoe, the Strouhal number is between 0.0038 and 0.013 for Froude numbers between 4.6and 8.6.
•irAlriat#,>:;i;~t4L:zflit€:b:~~t
-
526 Frederic Murzyn and Hubert Chanson
Figure 26. Harbour of Fecamp (Seine Maritime, France) during a storm. Courtesy of Frederic Malandain.
(27) (28)
Figures 27-28. Front toe of the hydraulic jump for Fr = 1.98. Flow from top to bottom. Left: zoom onthe toe (27), Right: Front toe of the jump (28).Experimental conditions: Fr = 1.98, d j = 0.059 m, VI =1.5 m/s On the left, the width corresponds to approximately 22 em. On the right, the vertical walls ofthe flume can be seen: the horizontal image csize orresponds to about 30 em.
p:::
Two-Phase Gas-Liquid Flow Properties in the Hydraulic Jump 527
(29) (30)
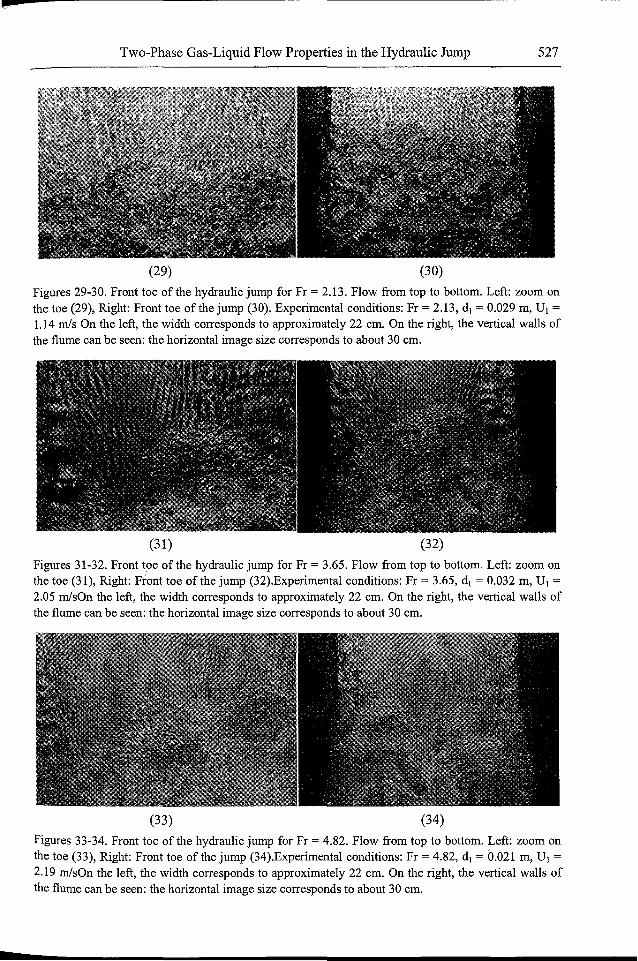
Figures 29-30. Front toe of the hydraulic jump for Fr = 2.13. Flow from top to bottom. Left: zoom onthe toe (29), Right: Front toe of the jump (30). Experimental conditions: Fr = 2.13, d l = 0.029 m, VI =1.14 mls On the left, the width corresponds to approximately 22 em. On the right, the vertical walls ofthe flume can be seen: the horizontal image size corresponds to about 30 em.
(31) (32)
Figures 31-32. Front toe of the hydraulic jump for Fr = 3.65. Flow from top to bottom. Left: zoom onthe toe (31), Right: Front toe of the jump (32).Experimental conditions: Fr = 3.65, dl = 0.032 m, VI =2.05 mlsOn the left, the width corresponds to approximately 22 em. On the right, the vertical walls ofthe flume can be seen: the horizontal image size corresponds to about 30 em.
(33) (34)
D
Figures 33-34. Front toe of the hydraulic jump for Fr = 4.82. Flow from top to bottom. Left: zoom onthe toe (33), Right: Front toe of the jump (34).Experimental conditions: Fr = 4.82, d l = 0.021 m, VI =2.19 mlsOn the left, the width corresponds to approximately 22 em. On the right, the vertical walls ofthe flume can be seen: the horizontal image size corresponds to about 30 em.
528 Frederic Murzyn and Hubert Chanson
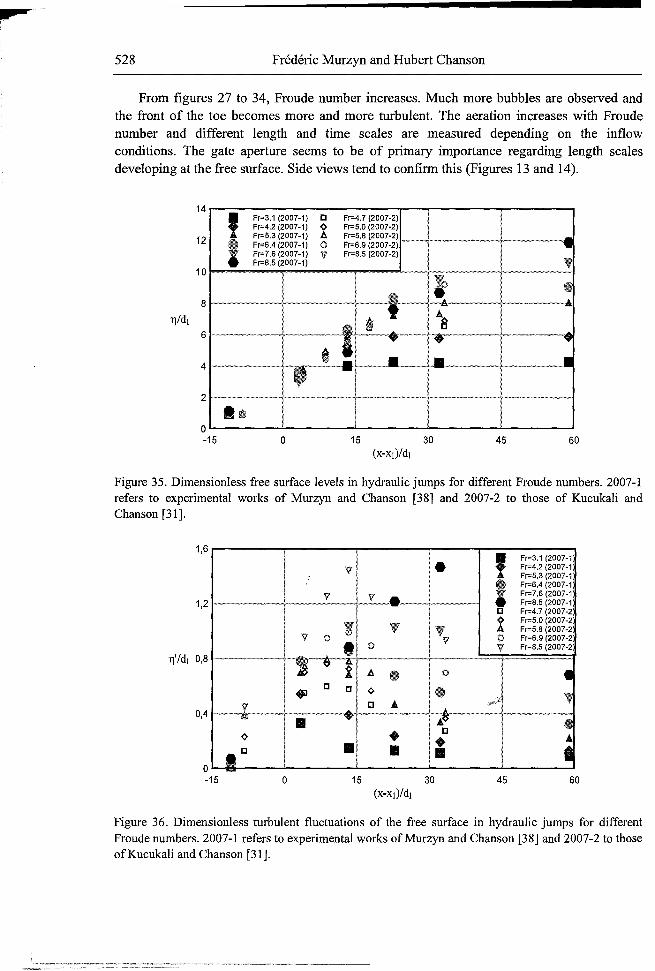
From figures 27 to 34, Froude number increases. Much more bubbles are observed andthe front of the toe becomes more and more turbulent. The aeration increases with Froudenumber and different length and time scales are measured depending on the inflowconditions. The gate aperture seems to be of primary importance regarding length scalesdeveloping at the free surface. Side views tend to confirm this (Figures 13 and 14).
14 , Fr-3.1 (2007-1) I]
Fr-4.2 (2007-1) ~
12 Fr-5.3 (2007-1) i:>• Fr-6.4 (2007-1) (}
I Fr-7.6 (2007-1) VFr-B.5 (2007-1)
10
8
Tj/dl6
4
2
• lID
0-15 0 15 30 45 60
(x-xj)/d}
Figure 35. Dimensionless free surface levels in hydraulic jumps for different Froude numbers. 2007-1refers to experimental works of Murzyn and Chanson [38] and 2007-2 to those of Kucukali andChanson [31].
! • ,Fr-3.1 (2007-1
V Fr-4.2 (2007-1Fr-5.3 (2007-1
i Fr-6.4 (2007-1
V V - Fr-7.6 (2007-1Fr-B.5 (2007-1
I] Fr-4.7 (2007-2
l' V-~ Fr-5.0 (2007-2
I V- i:> Fr-5.B (2007-2V 0 V 0 Fr-6.9 (2007-2
t 0 V Fr-B.5 (2007-2
1) 0 f i:> 0 ••.. I] I] ~ •y I] A ",,:l l
"'" • v A~~·~·~• I]
~ • ...II] • • • j
1,6
1,2
Tj'/dj 0,8
0,4
o-15 o 15 30 45 60
Figure 36. Dimensionless turbulent fluctuations of the free surface in hydraulic jumps for differentFroude numbers. 2007-1 refers to experimental works of Murzyn and Chanson [38] and 2007-2 to thoseofKucukali and Chanson [31].
•Two-Phase Gas-Liquid Flow Properties in the Hydraulic Jump 529
Figure 35 presents the longitudinal dimensionless free surface profiles for Froudenumbers up to 8.5. These experimental results correspond to measurements made at theUniversity of Queensland at Brisbane by Kucukali and Chanson [31] and Murzyn andChanson [38] using ultrasonic displacement meters. For (x-xj)/d j > 0, a regular increase ofthe free surface is observed. Then, a constant level is reached (which corresponds to thedissipation area). For the highest Froude numbers, a constant level is not always observed.Indeed, only six acoustic displacement meters were used which was not sufficient enough.Nevertheless, the profiles (shapes) are in agreement with flow observations made duringexperiments and previous studies [31,37,42].
On Figure 36, the turbulent fluctuations of the free surface are plotted for the sameexperimental conditions. The same shapes are depicted for all Froude numbers. A rapidincrease is noticed and a peak of turbulent fluctuations is reached in the first half of the roller.This corresponds to a turbulence production region. Then, a regular decrease is measuredindicating a dissipative area.
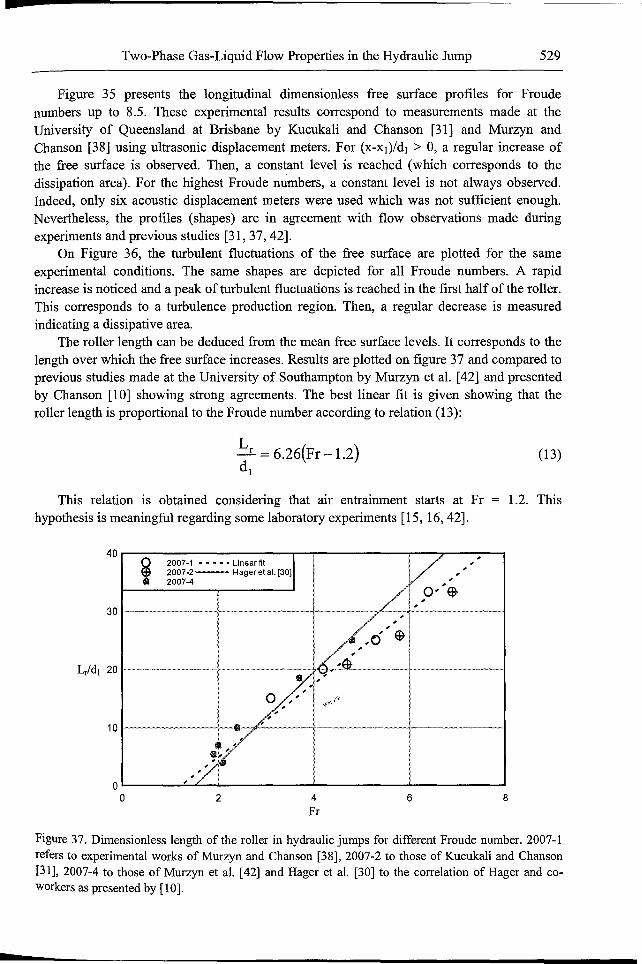
The roller length can be deduced from the mean free surface levels. It corresponds to thelength over which the free surface increases. Results are plotted on figure 37 and compared toprevious studies made at the University of Southampton by Murzyn et al. [42] and presentedby Chanson [10] showing strong agreements. The best linear fit is given showing that theroller length is proportional to the Froude number according to relation (13):
.!:l =6.26(Fr -1.2)dj
(13)
This relation is obtained considering that atr entrainment starts at Frhypothesis is meaningful regarding some laboratory experiments [15, 16,42].
1.2. This
2007-1 ••• _. Linearfit2007-2-- Hager et al. [30]2007-4
40 ..------------"T"""-,-------,-----:;,....---:--,
i
864Fr
2
, IIOL---__~::..._..l_ _'_ __i. _.l
o
Figure 37. Dimensionless length of the roller in hydraulic jumps for different Froude number. 2007-1refers to experimental works of Murzyn and Chanson [38], 2007-2 to those of Kucukali and Chanson[31], 2007-4 to those of Murzyn et al. [42] and Hager et al. [30] to the correlation of Hager and coworkers as presented by [10].
-
~-------------530 Frederic Murzyn and Hubert Chanson
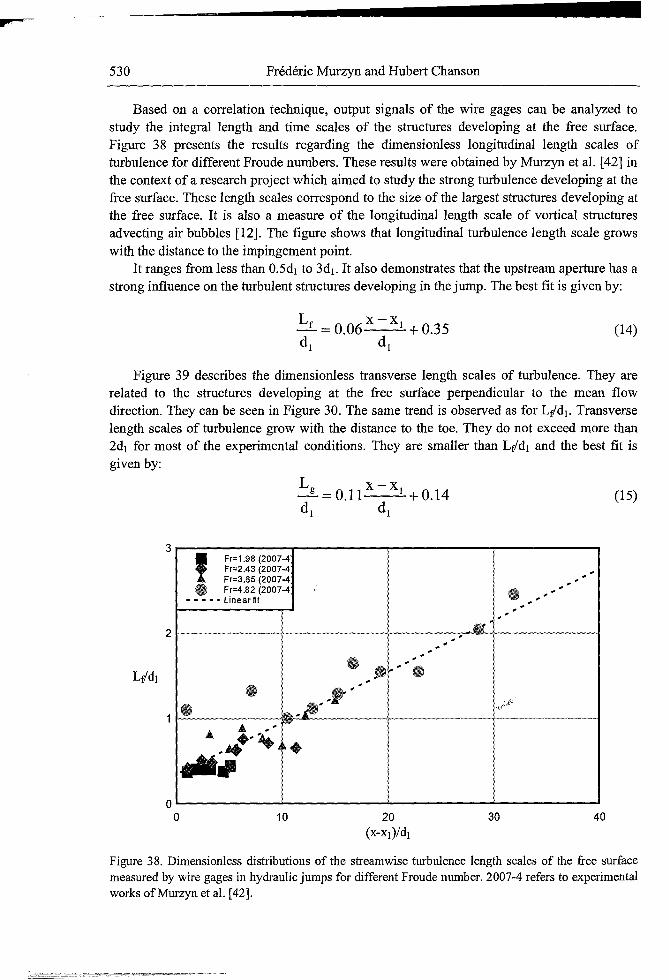
Based on a correlation technique, output signals of the wire gages can be analyzed tostudy the integral length and time scales of the structures developing at the free surface.Figure 38 presents the results regarding the dimensionless longitudinal length scales ofturbulence for different Froude numbers. These results were obtained by Murzyn et al. (42] inthe context of a research project which aimed to study the strong turbulence developing at thefree surface. These length scales correspond to the size of the largest structures developing atthe free surface. It is also a measure of the longitudinal length scale of vortical structuresadvecting air bubbles (12]. The figure shows that longitudinal turbulence length scale growswith the distance to the impingement point.
It ranges from less than 0.5d l to 3d l . It also demonstrates that the upstream aperture has astrong influence on the turbulent structures developing in the jump. The best fit is given by:
(14)
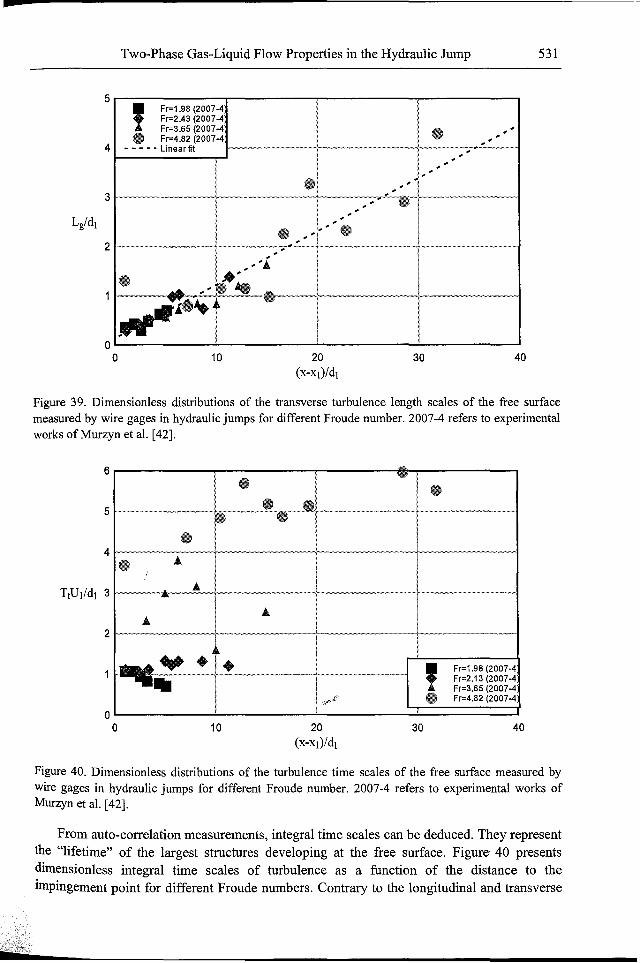
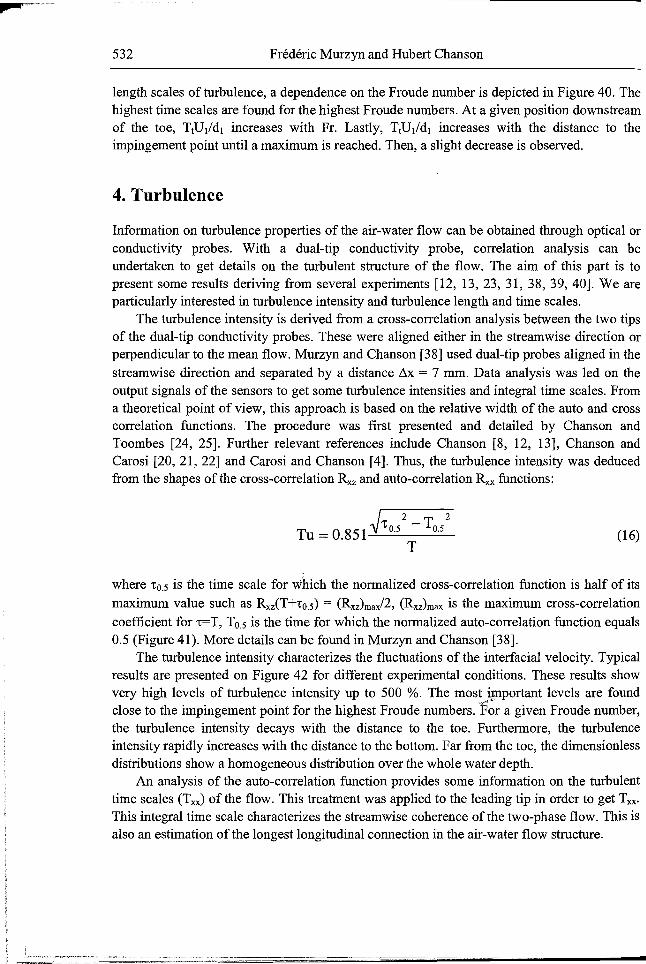
Figure 39 describes the dimensionless transverse length scales of turbulence. They arerelated to the structures developing at the free surface perpendicular to the mean flowdirection. They can be seen in Figure 30. The same trend is observed as for Lp'd l . Transverselength scales of turbulence grow with the distance to the toe. They do not exceed more than2d l for most of the experimental conditions. They are smaller than Lp'd l and the best fit isgiven by:
(15)
4030
3r--------..,.-----..,..-------,------...,, Fr=1.98 (2007-4 I
Fr=2.43 (2007-4 .Fr=3.65 (2007-4 I
• Fr=4.82 (2007-4 .- - - - • Linearfit
Figure 38. Dimensionless distributions of the streamwise turbulence length scales of the free surfacemeasured by wire gages in hydraulic jumps for different Froude number. 2007-4 refers to experimentalworks of Murzyn et al. [42].
>
Two-Phase Gas-Liquid Flow Properties in the Hydraulic Jump 531
403010
, Fr=1.98 (2007-4Fr=2.43 (2007-4Fr=3.65 (2007-4 • , ,
• Fr=4.82 (2007-4 , ,,
- - - - • Linearfit , --,, ,
, ,,
• , ,,
, , WI, ,, ,
• , •, ,-"~~."
,, ,
, " 'A.•.~.~~,*~" " """",..{.~
...,.
i
I
2
oo
3
5
4
Figure 39. Dimensionless distributions of the transverse turbulence length scales of the free surfacemeasured by wire gages in hydraulic jumps for different Froude number. 2007-4 refers to experimentalworks of Murzyn et al. [42].
6
• •5
4 •TtUj/dj 3 --'"'"'~
A.2 , Fr=1.98 (2007-4
Fr=2.13 (2007-4Fr=3.65 (2007-4• Fr=4.82 (2007-4
00 10 20 30 40
(x-xj)/dj
Figure 40. Dimensionless distributions of the turbulence time scales of the free surface measured bywire gages in hydraulic jumps for different Froude number. 2007-4 refers to experimental works ofMurzyn et al. [42].
From auto-correlation measurements, integral time scales can be deduced. They representthe "lifetime" of the largest structures developing at the free surface. Figure 40 presentsdimensionless integral time scales of turbulence as a function of the distance to theimpingement point for different Froude numbers. Contrary to the longitudinal and transverse
532 Frederic Murzyn and Hubert Chanson
length scales of turbulence, a dependence on the Froude number is depicted in Figure 40. Thehighest time scales are found for the highest Froude numbers. At a given position downstreamof the toe, TtUj/d j increases with Fr. Lastly, TtUj/dj increases with the distance to theimpingement point until a maximum is reached. Then, a slight decrease is observed.
4. Turbulence
Information on turbulence properties of the air-water flow can be obtained through optical orconductivity probes. With a dual-tip conductivity probe, correlation analysis can beundertaken to get details on the turbulent structure of the flow. The aim of this part is topresent some results deriving from several experiments (12, 13,23,31, 38, 39, 40]. We areparticularly interested in turbulence intensity and turbulence length and time scales.
The turbulence intensity is derived from a cross-correlation analysis between the two tipsof the dual-tip conductivity probes. These were aligned either in the streamwise direction orperpendicular to the mean flow. Murzyn and Chanson [38] used dual-tip probes aligned in the
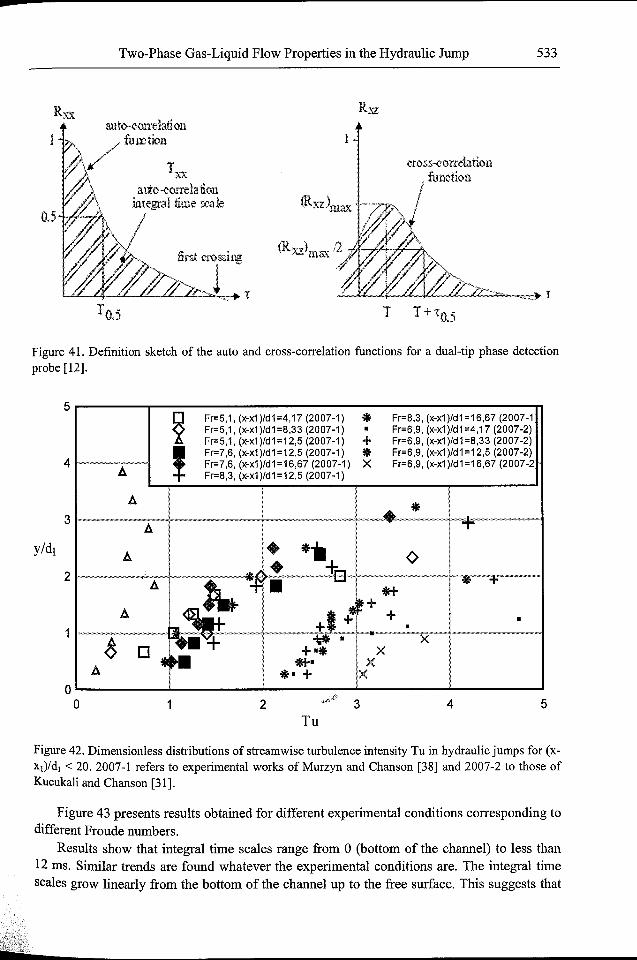
streamwise direction and separated by a distance ~x = 7 mm. Data analysis was led on theoutput signals of the sensors to get some turbulence intensities and integral time scales. Froma theoretical point of view, this approach is based on the relative width of the auto and crosscorrelation functions. The procedure was first presented and detailed by Chanson andToombes [24, 25]. Further relevant references include Chanson [8, 12, 13], Chanson andCarosi [20,21,22] and Carosi and Chanson [4]. Thus, the turbulence intensity was deducedfrom the shapes of the cross-correlation Rxz and auto-correlation Rxx functions:
~ 2 T 2Tu =0.851 't o.5 - 0.5
T(16)
where 'to.5 is the time scale for which the normalized cross-correlation function is half of its
maximum value such as RxzCT+'to.5) = (Rxz)maxl2, (Rxz)max is the maximum cross-correlation
coefficient for't=T, To.5 is the time for which the normalized auto-correlation function equals0.5 (Figure 41). More details can be found in Murzyn and Chanson [38].
The turbulence intensity characterizes the fluctuations of the interfacial velocity. Typicalresults are presented on Figure 42 for different experimental conditions. These results showvery high levels of turbulence intensity up to 500 %. The most important levels are found
.,,:.,-tf','V
close to the impingement point for the highest Froude numbers. For a given Froude number,the turbulence intensity decays with the distance to the toe. Furthermore, the turbulenceintensity rapidly increases with the distance to the bottom. Far from the toe, the dimensionlessdistributions show a homogeneous distribution over the whole water depth.
An analysis of the auto-correlation function provides some information on the turbulenttime scales (Txx) of the flow. This treatment was applied to the leading tip in order to get Txx.This integral time scale characterizes the streamwise coherence of the two-phase flow. This isalso an estimation of the longest longitudinal connection in the air-water flow structure.
-Two-Phase Gas-Liquid Flow Properties in the Hydraulic Jump 533
OJ
auto-correbtiQU'. / furetion
-:f\, J)'A
anto -correia noniategral time scale
cross-correlation/ function
---,.- ,_ I
;N
TO .) J J+TO.5
Figure 41. Definition sketch of the auto and cross-correlation functions for a dual-tip phase detectionprobe [12].
4
5
5432
~Fr=5,1, (x-x1)/d1=4,17 (2007-1) • Fr=8,3, (x-x1)/d1=16,67 (2007-1Fr=5,1, (x-x1)/d1=8,33 (2007-1) • Fr=6,9, (x-x1 )/d1 =4,17 (2007-2)Fr=5,1, (x-x1)/d1=12,5 (2007-1) + Fr=6,9, (x-x1 )/d1 =8,33 (2007-2)
! Fr=7,6, (x-x1)/d1=12,5 (2007-1) • Fr=6,9, (x-x1)/d1=12,5 (2007-2)~.~_._,~.~.~ Fr=7,6, (x-x1)/d1=16,67 (2007-1) X Fr=6,9, (x-x1 )/d1 =16,67 (2007-2
A Fr=8,3, (x-x1)/d1=12,5 (2007-1)
A •...A T
A • •• ¢.•. ,~-'" -+.:
A:..~ •
'+ :'lilt' '1"
+1 !A ~ ••-'---=-~ +:: . X
~ D •• T X.... XA l •. + X
I'!if"""
oo
2
3
y/dl
Tu
Figure 42. Dimensionless distributions of streamwise turbulence intensity Tu in hydraulic jumps for (xxI)/d l < 20. 2007-1 refers to experimental works of Murzyn and Chanson [38] and 2007-2 to those ofKucukali and Chanson [31].
Figure 43 presents results obtained for different experimental conditions corresponding todifferent Froude numbers.
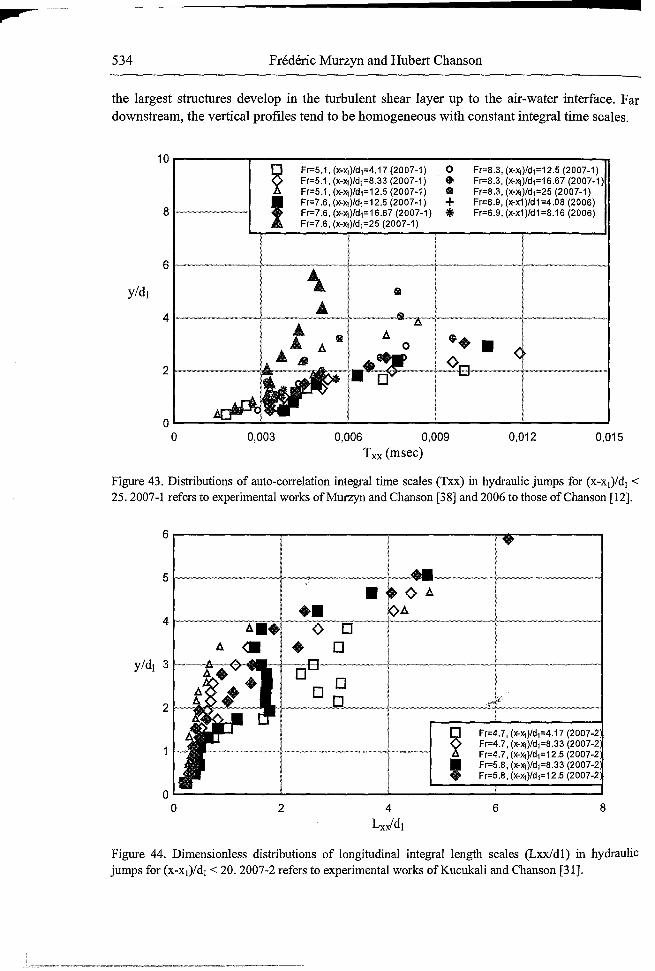
Results show that integral time scales range from 0 (bottom of the channel) to less than12 ms. Similar trends are found whatever the experimental conditions are. The integral timescales grow linearly from the bottom of the channel up to the free surface. This suggests that
534 Frederic Murzyn and Hubert Chanson
the largest structures develop in the turbulent shear layer up to the air-water interface. Fardownstream, the vertical profiles tend to be homogeneous with constant integral time scales.
10r-------r-----------------------..
0,0150,0120,006 0,009Txx (msec)
~Fr=5.1, (x-XJ)/d1=4.17 (2007-1) 0 Fr=8.3, (X-X1)/d1=12.5 (2007-1)Fr=5.1, (X-X1)/d1=8.33 (2007-1) • Fr=8.3, (X-Xl)/d1=16.67 (2007-1)Fr=5.1, (x-XJ)/d1=12.5 (2007-1) & Fr=8.3, (x-x1)/d1=25 (2007-1)
! Fr=7.6, (x-x1)/d1=12.5 (2007-1) + Fr=6.9, (x-x1)/d1=4.08 (2006)Fr=7.6, (x-XJ)/d1=16.67 (2007-1) * Fr=6.9, (x-x1 )/d1=8.16 (2006)Fr=7.6, (X-X1)/d1=25 (2007-1)
\..&
& A ••A 0 •0
0,00301..---=---'---------'-------........------'------'o
Figure 43. Distributions of auto-correlation integral time scales (Txx) in hydraulic jumps for (x-xr)/dr <25.2007-1 refers to experimental works of Murzyn and Chanson [38] and 2006 to those of Chanson [12].
6......---------r-------r-------"'l""':II~------,
2
2
Fr=4.7, (x-xl)/d1=4.17 (2007-2Fr=4.7, (x-XJ)/d1=8.33 (2007-2Fr=4.7, (x-XJ)/d1=12.5 (2007-2Fr=5.8, (x-XJ)/d1=8.33 (2007-2Fr=5.8, (x-xl)/d1=12.5 (2007-2
6 8
Figure 44. Dimensionless distributions of longitudinal integral length scales (Lxx/d1) in hydraulicjumps for (x-xr)/dr < 20.2007-2 refers to experimental works of Kucukali and Chanson [31].
p
Two-Phase Gas-Liquid Flow Properties in the Hydraulic Jump 535
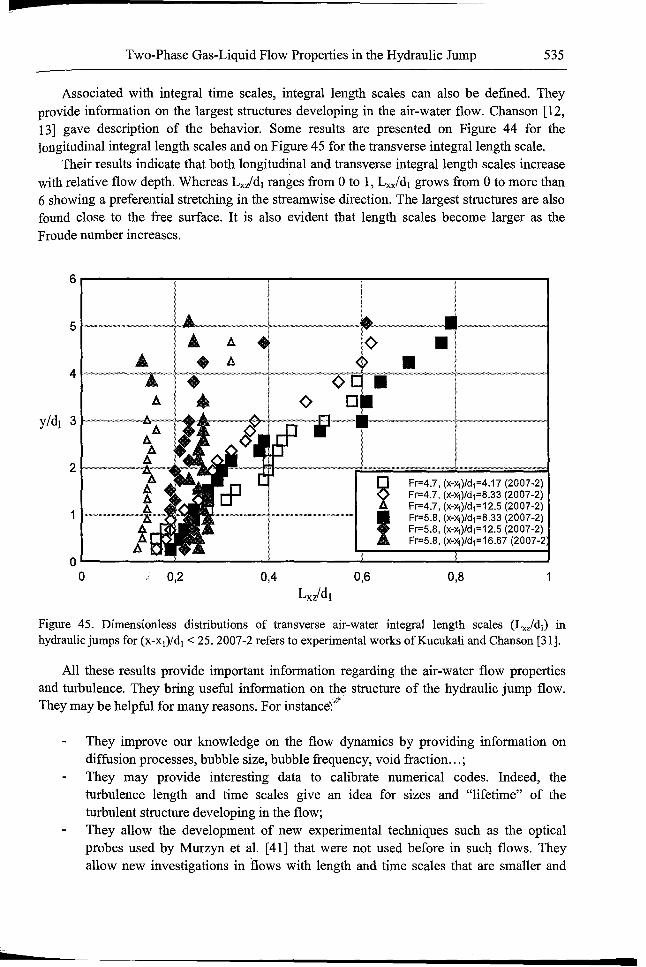
Associated with integral time scales, integral length scales can also be defined. Theyprovide information on the largest structures developing in the air-water flow. Chanson [12,13] gave description of the behavior. Some results are presented on Figure 44 for thelongitudinal integral length scales and on Figure 45 for the transverse integral length scale.
Their results indicate that both longitudinal and transverse integral length scales increasewith relative flow depth. Whereas Lxz/d1 ranges from 0 to 1, Lxxld1 grows from 0 to more than6 showing a preferential stretching in the streamwise direction. The largest structures are alsofound close to the free surface. It is also evident that length scales become larger as theFroude number increases.
6 ......-----...-----......-------,-----...,...-------.
0,8
•
Fr=4.7, {x-lGj)/d1=4.17 (2007-2)Fr=4.7, {x-lGj)/d1=8.33 (2007-2)Fr=4.7, {x-lGj)/d1=12.5 (2007-2)Fr=5.8, {x-lGj)/d1=8.33 (2007-2)Fr=5.8, {x-lGj)/d1=12.5 (2007-2)Fr=5.8, {x-lGj)/d1=16.67 {2007-2
•
0,60,40,2o'-------......-----......-----......-----....;'------~o
4 1".~--'--m.'m.(m'~+~'::O'-=d~~-W-+-.,,--''''__::O'¢'.,.=-O.
Figure 45. Dimensionless distributions of transverse air-water integral length scales (Ljd1) inhydraulic jumps for (x-xl)/d1 < 25. 2007-2 refers to experimental works ofKucukali and Chanson [31].
All these results provide important information regarding the air-water flow propertiesand turbulence. They bring useful information on the structure of the hydraulic jump flow.They may be helpful for many reasons. For instance:}c"
They improve our knowledge on the flow dynamics by providing information ondiffusion processes, bubble size, bubble frequency, void fraction ... ;They may provide interesting data to calibrate numerical codes. Indeed, theturbulence length and time scales give an idea for sizes and "lifetime" of theturbulent structure developing in the flow;They allow the development of new experimental techniques such as the opticalprobes used by Murzyn et al. [41] that were not used before in suc4 flows. Theyallow new investigations in flows with length and time scales that are smaller and
•
~r
536 Frederic Murzyn and Hubert Chanson
faster than before. Furthennore, the sensor dimensions decrease increasing thus theaccuracy of the results;They may contribute to improve and develop new methods for data analysis thatcould be used for other studies;They may give new insights on other problems such as spilling breaker on a beach,mixing and diffusion processes ...
Nevertheless, there is still an important lack of knowledge on the field that requiresfurther investigations. In the next part, we develop some examples of further research topicsto study in the future.
5. Conclusions and Perspectives
The two-phase gas-liquid flow properties have been investigated by many researchers usingdifferent experimental techniques. Basic results were clearly found in tenns of void fraction,bubble frequency and bubble velocity vertical profiles. A similitude with wall-jet flows wasdemonstrated. Some infonnation on a double diffusion process were suggested as well. Theturbulent flow structures were discussed in tenns of both the free surface and the two-phaseflow. Yet the huge amount of available data still needs further investigations and analyses.The present knowledge should be improved to assist the numericians to develop and calibratetheir codes. Furthennore, new research topics may be developed with a focus on fundamentalissues. Some developments have already started. The most promising research areas areprobably those on bubble clustering, assessment of scale effects, effect of water quality on theflow properties and the influence of bubbles on sediment transport (three-phase flow).
In tenns of bubble clustering, significant contributions were recently published forstepped cascades flows [25], dropshaft flows [9] and hydraulic jumps [12, 13]. By cluster, onemeans a groupment of two or more bubbles separated from other bubbles by a "significantdistance". In the cluster, bubbles are close together and surrounded by a "sizeable volume ofwater". In the context of this chapter, the basic relevant references are [12, 13]. In theseexperimental works, two complementary approaches were presented [12, 13]. First, aclustering analysis is based upon the study of water chord time between adjacent bubbles.Second, a study is led on the interparticle arrival time. The main conclusions were obtainedby analyzing the longitudinal flow structure [13]. These showed comparatively little bubbleclustering in the air-water shear layer region. However, an interpa~icle arrival time analysissuggested some preferential bubble clustering for bubble chord tiffies below 3 ms within theinvestigated flow conditions. Altogether both approaches are complementary but theinterparticle arrival time analyses give a greater insight into the range of particle classesaffected by non-random clustering. A further study was based on the analysis of the waterchord time statistics [26,27]. A cluster was recorded when a water chord time was less than10 % of the median water chord time. The results showed that the number of bubblesassociated with cluster in hydraulic jumps was around 21 % and this percentage decreaseswith increasing Froude number. They also showed that the average number of bubbles percluster was 2.3 with mostly 2 bubbles per detected cluster: 70 % to 95 % of the clusterscontain 2 bubbles [27]. These results may be helpful to assess vorticity production rate andbubble-turbulence interactions as well as new typical turbulent scales of the flow. Note that
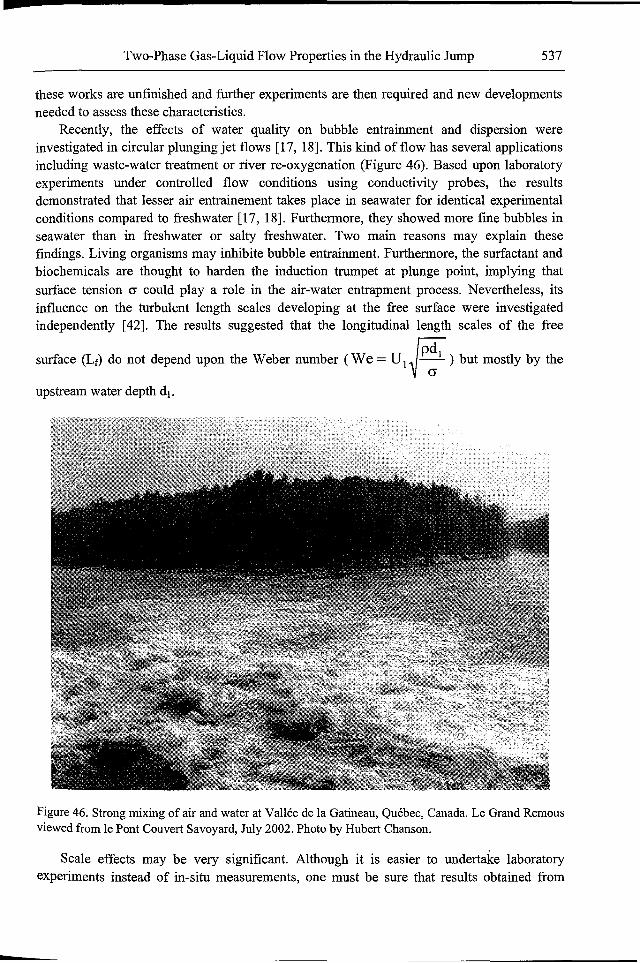
•Two-Phase Gas-Liquid Flow Properties in the Hydraulic Jump 537
-
these works are unfinished and further experiments are then required and new developmentsneeded to assess these characteristics.
Recently, the effects of water quality on bubble entrainment and dispersion wereinvestigated in circular plunging jet flows [17, 18]. This kind of flow has several applicationsincluding waste-water treatment or river re-oxygenation (Figure 46). Based upon laboratoryexperiments under controlled flow conditions using conductivity probes, the resultsdemonstrated that lesser air entrainement takes place in seawater for identical experimentalconditions compared to freshwater [17, 18]. Furthermore, they showed more fine bubbles inseawater than in freshwater or salty freshwater. Two main reasons may explain thesefindings. Living organisms may inhibite bubble entrainment. Furthermore, the surfactant andbiochemicals are thought to harden the induction trumpet at plunge point, implying thatsurface tension cr could playa role in the air-water entrapment process. Nevertheless, itsinfluence on the turbulent length scales developing at the free surface were investigatedindependently [42]. The results suggested that the longitudinal length scales of the free
~surface (Lf) do not depend upon the Weber number (We =UIV~) but mostly by the
upstream water depth d l .
Figure 46. Strong mixing of air and water at Vallee de la Gatineau, Quebec, Canada. Le Grand Remousviewed from Ie Pont Couvert Savoyard, July 2002. Photo by Hubert Chanson.
Scale effects may be very significant. Although it is easier to undertake laboratoryexperiments instead of in-situ measurements, one must be sure that results obtained from
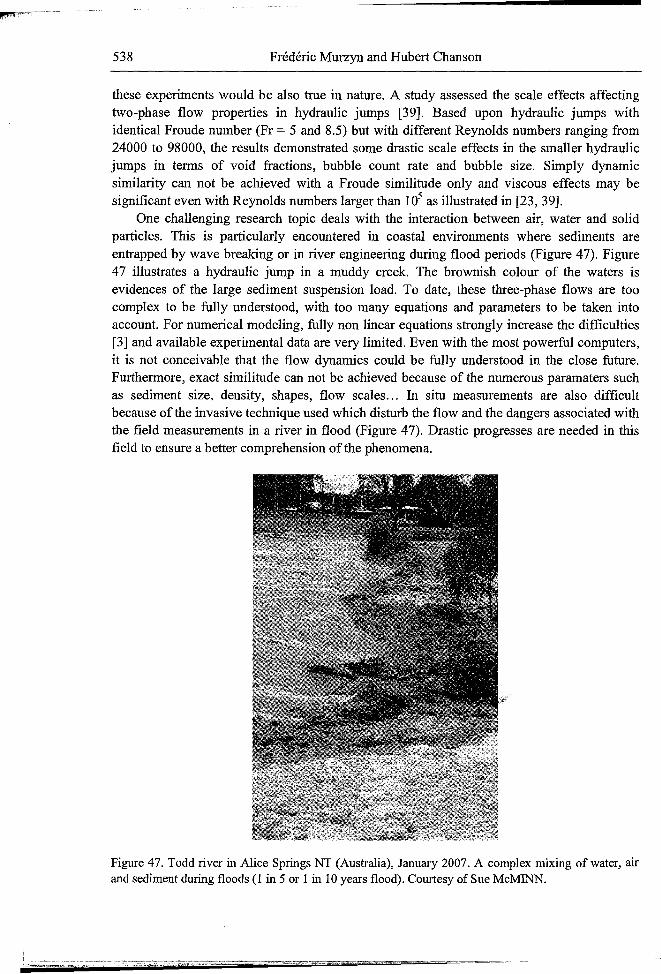
538 Frederic Murzyn and Hubert Chanson
these experiments would be also true in nature. A study assessed the scale effects affectingtwo-phase flow properties in hydraulic jumps [39]. Based upon hydraulic jumps withidentical Froude number (Fr = 5 and 8.5) but with different Reynolds numbers ranging from24000 to 98000, the results demonstrated some drastic scale effects in the smaller hydraulicjumps in terms of void fractions, bubble count rate and bubble size. Simply dynamicsimilarity can not be achieved with a Froude similitude only and viscous effects may besignificant even with Reynolds numbers larger than 105 as illustrated in [23, 39].
One challenging research topic deals with the interaction between air, water and solidparticles. This is particularly encountered in coastal environments where sediments areentrapped by wave breaking or in river engineering during flood periods (Figure 47). Figure47 illustrates a hydraulic jump in a muddy creek. The brownish colour of the waters isevidences of the large sediment suspension load. To date, these three-phase flows are toocomplex to be fully understood, with too many equations and parameters to be taken intoaccount. For numerical modeling, fully non linear equations strongly increase the difficulties[3] and available experimental data are very limited. Even with the most powerful computers,it is not conceivable that the flow dynamics could be fully understood in the close future.Furthermore, exact similitude can not be achieved because of the numerous paramaters suchas sediment size, density, shapes, flow scales ... In situ measurements are also difficultbecause of the invasive technique used which disturb the flow and the dangers associated withthe field measurements in a river in flood (Figure 47). Drastic progresses are needed in thisfield to ensure a better comprehension of the phenomena.
Figure 47. Todd river in Alice Springs NT (Australia), January 2007. A complex mixing of water, airand sediment during floods (1 in 5 or 1 in 10 years flood). Courtesy of Sue McMINN.
s
Two-Phase Gas-Liquid Flow Properties in the Hydraulic Jump
Acknowledgements
539
-
The first author thanks Franyois Stephan, head of department at ESTACA Paris (EcoleSuperieure des Techniques Aeronautiques et de la Construction Automobile,http://www.estaca.fr) for his support and Frederic Malandain (Cany-Barville, France,http://www.frederic-malandain.fr/) for providing nice pictures of Normandy's coastlines.
References
[1] Babb A.F., Aus H.C. Measurements of air in flowing water, Journal of HydraulicDivision, ASCE, 107 (HYI2), 1981, pp 1615-1630.
[2] Belanger J.B. Essai sur la solution numerique de quelques problemes relatifs aumouvement permanent des eaux courantes, Carialian-Goeury, Paris, France, 1828 (infrench).
[3] Brennen C.E. Fundamentals of multiphase flows, Cambridge University Press, 2005,345 pages.
[4] Carosi G. Chanson H. Air-water time and length scales in skimming flows on a steppedspillway. Application to the spray characterization, Research Report CH59/06,Department of Civil Engineering, The University of Queensland, Brisbane, Australia,July 2006,142 pages.
[5] Chanson H. Air entrainment in two dimensional turbulent shear flows with partiallydeveloped inflow conditions, International Journal ofMultiphase Flow, 31, 6, 1995, pp1107-1121.
[6] Chanson H. Air bubble entrainment in free surface turbulent shear flows, AcademicPress, London, UK, 1997, 401 pages.
[7] Chanson H. The hydraulics of open-channel flow: an introduction, Edward Arnold,London, UK, 1999,512 pages.
[8] Chanson H. Air-water flow measurements with intrusive phase-detection probes. Canwe improve their interpretation? Journal of Hydraulic Engineering, ASCE, 128, 3,2002, pp 252-255.
[9] Chanson H. An experimental study of Roman dropshaft operation: hydraulics, twophase flow, acoustics, Report CH 50/02, Department of Civil Engineering, TheUniversity of Queensland, Brisbane, Australia, 2002, 99 pages.
[10] Chanson H. The hydraulic of open-channel,flow: an introduction, ButterworthHeinemann, Oxford, UK, 2nd edition, 2004, 630 pages.
[11] Chanson H. Bubble entrainment, spray and splashing at hydraulic jumps, Journal ofZhejiang University Science A, 7, 8, 2006, pp 1396-1405.
[12] Chanson H. Air bubble entrainment in hydraulic jumps. Similitude and scale effects,Research Report CH57/05, Department of Civil Engineering, The University ofQueensland, Brisbane, Australia, January, 2006, 119 pages.
[13] Chanson H. Bubbly flow structure in hydraulic jump, European Journal ofMechanics,26,3,2007, pp 367-384.
[14] Chanson H. Dynamic similarity and scale effects affecting air bublle entrainment inhydraulic jumps, Proceedings of the (jh International Conference on Multiphase Flow
540 Frederic Murzyn and Hubert Chanson
ICMF 2007, Leipzig, Gennany, July 9-13, M. Sommerfeld Editor, Session 7, 2007,1]pages.
[15] Chanson H. Hydraulic jumps: bubbles and bores, 16th Australasian Fluid Mechanic!Conference AFMC, Crown Plaza, Gold Coast, Australia, December 2-7, P. Jacobs, TMcIntyre, M. Cleary, D. Buttsworth, D. Mee, R. Clemens, R. Morgan, C. LemckerEditors, 2007, Plenary Address, pp 39-53.
[16] Chanson H. Current knowledge in hydraulic jumps and related phenomena. A survey 0:
experimental results, European Journal ofMechanics B/Fluids, in press, 2008.[17] Chanson H., Aoki S.I., Hoque A. Scaling bubble entrainment and dispersion in vertica
circular plunging jet flows: freshwater versus seawater, Proceedings of the 51}
International Conference on Hydrodynamics, Tainan, Taiwan, 2002.[18] Chanson H., Aoki S.I., Hoque A. Bubble entrainment and dispersion in plunging je1
flows: freshwater versus seawater, Journal of Coastal Research, 22, 3, 2006, pp 664677.
[19] Chanson H., Brattberg T. Experimental study of the air-water shear flow in a hydraulicjump, International Journal ofMultiphase Flow, 26, 4, 2000, pp 583-607.
[20] Chanson H., Carosi G. Advanced post-processing and correlation analyses in highvelocity air-water flows. 1- Macroscopic properties, Proceedings of the InternationalJunior Researcher and Engineer Workshop on hydraulic structures (IJREWHS'06),Montemor-o-Novo, Jorge Matos and Hubert Chanson Eds, Report CH61106, Divisionof Civil Egineering, The University of Queensland, Brisbane, Australia, December2006, pp 139-148.
[21] Chanson H., Carosi G. Advanced post-processing and correlation analyses in highvelocity air-water flows. 1- Microscopic properties, Proceedings of the InternationalJunior Researcher and Engineer Workshop on hydraulic structures (IJREWHS'06),Montemor-o-Novo, Jorge Matos and Hubert Chanson Eds, Report CH61106, Divisionof Civil Egineering, The University of Queensland, Brisbane, Australia, December2006, pp 149-158. .
[22] Chanson H., Carosi G. Turbulent time and length scale measurements in high-velocityopen-channel flows. Experiments in Fluids, 42,3,2007, pp 385-401.
[23] Chanson H., Gualtieri C. Similitude and scale effects of air entrainment in hydraulicjumps, Journal ofHydraulic Research, 46, 1,2008, pp 35-44.
[24] Chanson H., Toombes L. Experimental investigations of air entrainment in transitionand skimming flows down a stepped chute. Application to embankment overflowstepped spillways, Research Report CE158, Department,,0f Civil Engineering, TheUniversity of Queensland, Brisbane, Australia, July, 2001, 74 pages.
[25] Chanson H., Toombes L. Air-water flows down stepped chutes: turbulence and flowstructure observations, International Journal of Multiphase Flow, 28, 11, 2002, pp1737-1761.
[26] Gualtieri C., Chanson H. Clustering process and interfaccial area analysis in a large-sizedropshaft, Advances in Fluid Mechanics V, A. Mendes, M. Rahman, C.A. BrebbiaEditors, WIT Press, 2004.
[27] Gualtieri C., Chanson H. Clustering process analysis in a large-size dropshaft and in ahydraulic jump, 32nd IAHR Biennial Congress, Venice, July 2007, 11 pages.
p
Two-Phase Gas-Liquid Flow Properties in the Hydraulic Jump 541
-
[28] Gualtieri C., Chanson H. Experimental analysis of Froude number effect on airentrainment in the hydraulic jump, Environmental Fluid Mechanics, 7, 2007, pp 217238.
[29] Hager W.H. Energy dissipators and hydraulic jump, Kluwer Academic Publisher,Water Science and Technology Library, Volume 8, Dordrecht, The Netherlands, 288pages.
[30] Hager W.H., Bremen R, Kawagoshi N. Classical hydraulic jump: length of roller,Journal ofHydraulic Research, IAHR, 28, 5, 1990, pp 591-608.
[31] Kucukali S., Chanson H. Turbulence in hydraulic jumps: experimental measurements,Report CH62107, Department of Civil Engineering, The University of Queensland,Brisbane, Australia, July 2007, 96 pages.
[32] Lennon J.M., Hill D.F. Particle Image Velocity measurements ofundular and hydraulicjumps, Journal ofHydraulic Engineering, 132, 12,2006, pp 1283-1294.
[33] Liu M., Zhu D.Z., Rajaratnam N. Evaluation of ADV measurements in bubbly twophase flows, Proceedings of the conference on Hydraulic Measurements andExperimental Methods, EWRl, Tony L. Wahl, Clifford A Pugh, Kevin A Oberg,Tracy B. Vermeyen (Editors), Estes Park, USA, 2002.
[34] Matos J., Frizell K.H., Andre S., Frizell K.W. On the performance of velocitymeasurement techniques in air-water flows, Proceedings of speciality conference"Hyraulic Measurements and Experimental Methods", EWRI, ASCE, IAHR, Estes Park,USA, August 2002, 11 pages.
[35] Mossa M. On the oscillating characteristics of hydraulic jumps, Journal ofHydraulicResearch, IAHR, 37, 4, 1999, pp 541-558.
[36] Mossa M. Tolve U. Flow visualization in bubbly two-phase hydraulic jump, Journal ofFluids Engineering, 120, 1998, pp 160-165.
[37] Mouaze D., Murzyn F., Chaplin lR Free surface length scale estimation in hydraulicjumps, Journal ofFluids Engineering, Transaction ofASME, 127,2005, pp 1191-1193.
[38] Murzyn F., Chanson H. Free surface, bubbly flow and turbulence measurements inhydraulic jumps, Report CH63/07, Division of Civil Engineering, The University ofQueensland, Brisbane, Australia, July, 2007, 113 pages.
[39] Murzyn F., Chanson H. Experimental assessment of scale effects affecting two-phaseflow properties in hydraulic jumps, Experiments in Fluids, in press (corrected proofs),2008, 9 pages.
[40] Murzyn F., Chanson H. Experimental investigation of bubbly flow and turbulence inhydraulic jumps, Environmental Fluid Mechanis;%s, in press (corrected proofs), 2008, 17
~.,..;
pages.[41] Murzyn F., Mouaze D., Chaplin lR Optical fibre probe measurements of bubbly flow
in hydraulic jumps, International Journal ofMultiphase Flow, 31, 1,2005, pp 141-154.[42] Murzyn F., Mouaze D., Chaplin lR Air-water interface dynamic and free surface
features in hydraulic jumps, Journal ofHydraulic Research 45, 5, 2007, pp 679-685.[43] Prosperetti A, Tryggvason G. Computational methods for multiphase flow, Cambridge
University Press, 2007, 470 pages.[44] Rajaratnam N. An experimental study of air entrainment characteristics of the hydraulic
jump, Journal ofInstrumental Engineering, The Institution of Enginners (India), 42, 7,1962, pp 247-273.
542
[45]
[46]
[47]
[48]
Frederic Murzyn and Hubert Chanson
Rajaratnam N. The hydraulic jump as a wall jet, Journal ofHydraulics Division, HY 5,1965, pp 107-132 (+ Discussion HY 3, pp 110-123, + Closure HY 1, pp 74-76).Resch F.J., Leutheusser H.J. Le ressaut hydraulique : mesure de turbulence dans laregion diphasique, La Houille Blanche, 4, 1972a, pp 279-293.Resch F.J. Leutheusser H.J. Reynolds stress measurements in hydraulic jumps, JournalofHydraulic Research, 10,4, 1972b, pp 409-429.Waniewski T.A., Hunter C., Brennen C.E. Bubble measurements downstream ofhydraulicjumps,International Journal ofMultiphase Flow, 27, 2001, pp 1271-1284.
Reviewed by Dominique MouazeLecturerMorphodynamique Continentale et C6tiereUniversity ofCaen - Basse Normandie, 24 rue des Tilleuls, 14000 Caen (France)E-mail address:[email protected]: +33.(0)2.31.56.57.11
a
,C-=~'========== _
MULTIPHASE FLOW RESEARCH
S.MARTIN
ANDJ.R. WILLIAMS
EDITORS
Nova Science Publishers, Inc.New York