Embed Size (px)
Citation preview
219
Chapter 8 SATELLITE TELEVISION IN EDUCATION
In the present information society, television is considered as a major source of entertainment and learning for people, especially the young generation or students. All television programmes, especially educational and generally commercials, news, documentaries and cartoons affect people of all ages in different ways. Students constitute one of the groups in society who spend a lot of time in watching television. In recent years, students are even named as active media users. To satisfy the people’s entertainment and information needs, television is a primary instrument that came in the market. The satellite channels age came in slowly. The growth of satellite channels has revolutionized people’s life. The growth of satellite channels also moved to the wonderful concept of D. T. H. Credit for the miraculous invention of television goes to Mr. John L. Baird, a scientist of Scotland. Television is a great means of recreation, entertainment and passing of time. besides, television plays a great role in informing and educating masses about family planning, health, sanitation, nutrition, agriculture, etc. Television has great potential as an instrument of education. Doordarshan, the Indian national television network, is one of the largest broadcasting organizations in the world. The experimental telecast started in Delhi in September 1959 with a small transmitter and made a shift to studio and regular daily transmission in 1965. The year 1982 witnessed the introduction of regular satellite link between Delhi and different transmitters started national programmes and Doordarshan switched to colour transmission. Doordarshan has three-tier primary programme service: the national, the regional and the local. In the national programme, the focus is on national integration, communal harmony and such programmes include news, current affairs, science & cultural magazines, serials, music, dance, drama and feature films. The regional programmes originating from the capitals of the states are relayed by all transmitters in the concerned states and also deal with similar programmes at the state level, but in the language and idiom of that particular region. The local programmes are specific and cover local issues featuring local people. At present, more than 85% of the over the 900 million population of the country can receive Doordarshan programmes through network of more than 700 terrestrial transmitters. Doordarshan programmes are mixed with education, information and entertainment. Doordarshan has also entered into an agreement with the cable news network and twenty-four-hour news and current affairs are available for viewers in the country. Cable has penetrated the Indian market in a big way with roughly 40 million C & S homes, the paid service of D. T. H. focused on a niche market would basically constitute the rich segment from urban as well as rural areas due to the primary reason of high initial costs for DTH and the associated psychology of people. Dish TV has started its operation from October 2003 with the power of digital signals being broadcast directly to households with programmes with true digital picture quality and awesome stereophonic sound. The chapter discusses the educational patterns of the satellite television/ dish TV such as access to, uses of, attitude towards and impact of satellite TV among rural and urban as well as male and female Muslim students studying in the higher educational institutions of Silchar town.
220
I THE SATELLITE TV ACCESS PATTERNS
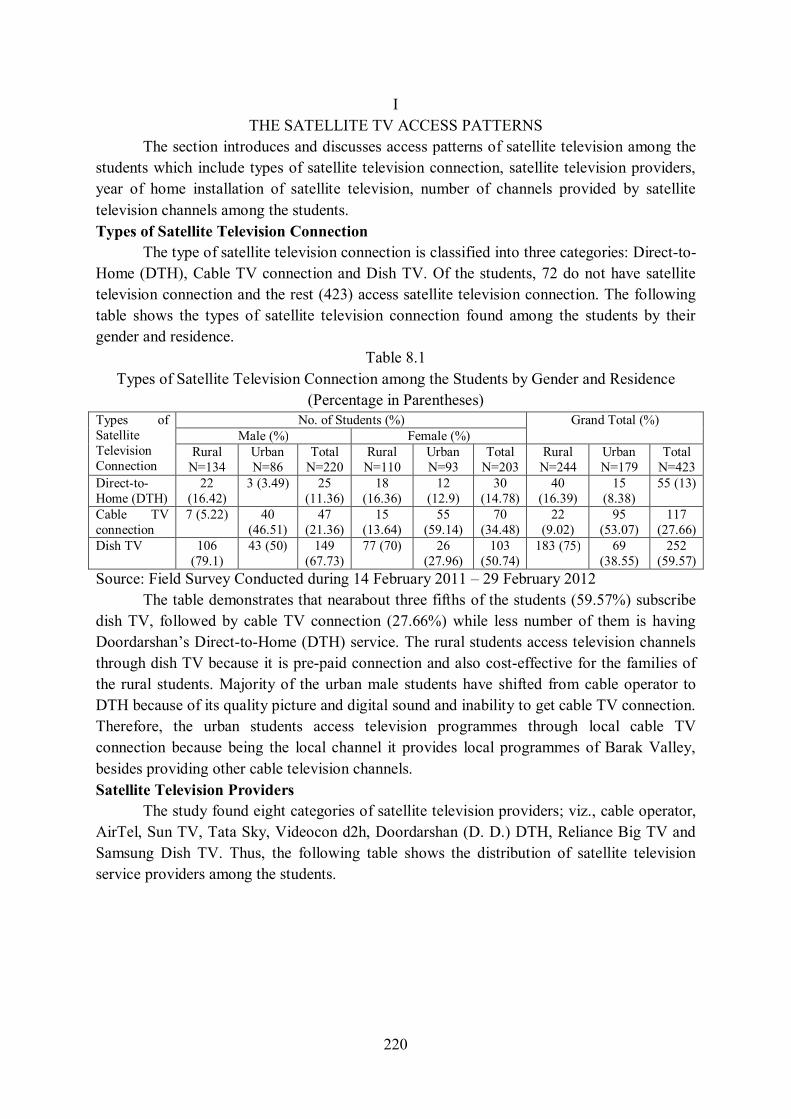
The section introduces and discusses access patterns of satellite television among the students which include types of satellite television connection, satellite television providers, year of home installation of satellite television, number of channels provided by satellite television channels among the students. Types of Satellite Television Connection The type of satellite television connection is classified into three categories: Direct-to-Home (DTH), Cable TV connection and Dish TV. Of the students, 72 do not have satellite television connection and the rest (423) access satellite television connection. The following table shows the types of satellite television connection found among the students by their gender and residence.
Table 8.1 Types of Satellite Television Connection among the Students by Gender and Residence
(Percentage in Parentheses) Types of Satellite Television Connection
No. of Students (%) Grand Total (%) Male (%) Female (%)
Rural N=134
Urban N=86
Total N=220
Rural N=110
Urban N=93
Total N=203
Rural N=244
Urban N=179
Total N=423
Direct-to-Home (DTH)
22 (16.42)
3 (3.49) 25 (11.36)
18 (16.36)
12 (12.9)
30 (14.78)
40 (16.39)
15 (8.38)
55 (13)
Cable TV connection
7 (5.22) 40 (46.51)
47 (21.36)
15 (13.64)
55 (59.14)
70 (34.48)
22 (9.02)
95 (53.07)
117 (27.66)
Dish TV 106 (79.1)
43 (50) 149 (67.73)
77 (70) 26 (27.96)
103 (50.74)
183 (75) 69 (38.55)
252 (59.57)
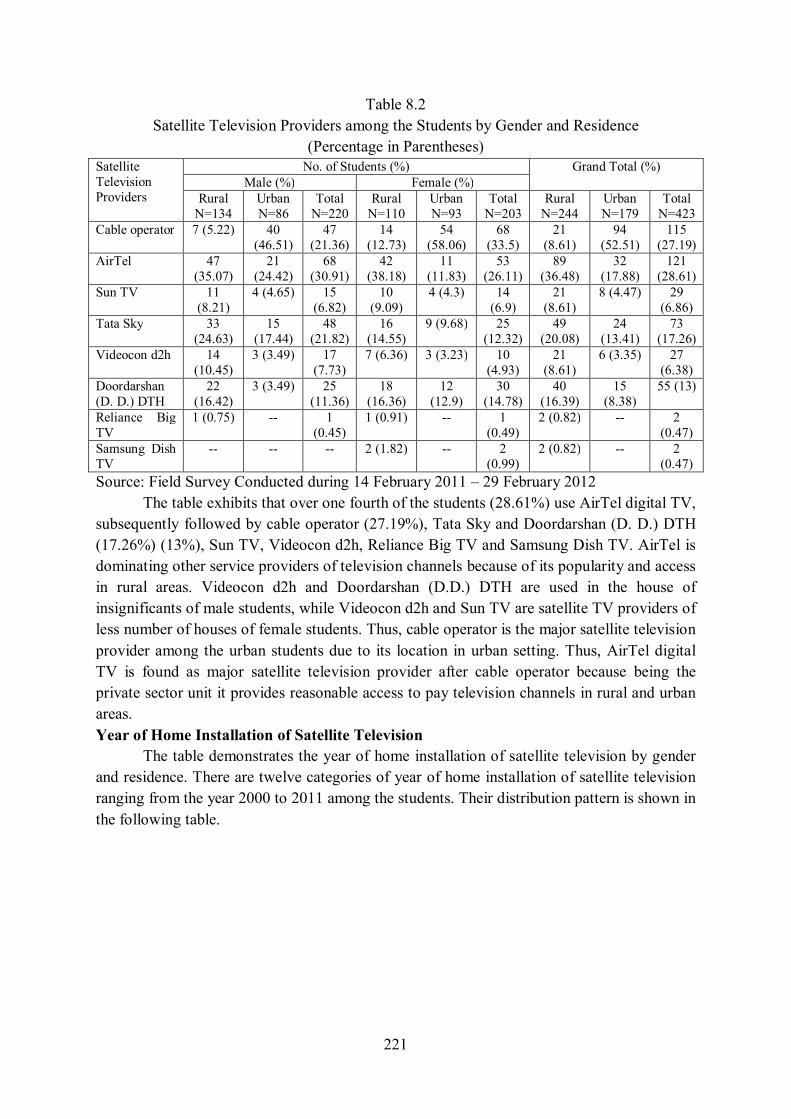
Source: Field Survey Conducted during 14 February 2011 – 29 February 2012 The table demonstrates that nearabout three fifths of the students (59.57%) subscribe dish TV, followed by cable TV connection (27.66%) while less number of them is having Doordarshan’s Direct-to-Home (DTH) service. The rural students access television channels through dish TV because it is pre-paid connection and also cost-effective for the families of the rural students. Majority of the urban male students have shifted from cable operator to DTH because of its quality picture and digital sound and inability to get cable TV connection. Therefore, the urban students access television programmes through local cable TV connection because being the local channel it provides local programmes of Barak Valley, besides providing other cable television channels. Satellite Television Providers The study found eight categories of satellite television providers; viz., cable operator, AirTel, Sun TV, Tata Sky, Videocon d2h, Doordarshan (D. D.) DTH, Reliance Big TV and Samsung Dish TV. Thus, the following table shows the distribution of satellite television service providers among the students.
221
Table 8.2 Satellite Television Providers among the Students by Gender and Residence
(Percentage in Parentheses) Satellite Television Providers
No. of Students (%) Grand Total (%) Male (%) Female (%)
Rural N=134
Urban N=86
Total N=220
Rural N=110
Urban N=93
Total N=203
Rural N=244
Urban N=179
Total N=423
Cable operator 7 (5.22) 40 (46.51)
47 (21.36)
14 (12.73)
54 (58.06)
68 (33.5)
21 (8.61)
94 (52.51)
115 (27.19)
AirTel 47 (35.07)
21 (24.42)
68 (30.91)
42 (38.18)
11 (11.83)
53 (26.11)
89 (36.48)
32 (17.88)
121 (28.61)
Sun TV 11 (8.21)
4 (4.65) 15 (6.82)
10 (9.09)
4 (4.3) 14 (6.9)
21 (8.61)
8 (4.47) 29 (6.86)
Tata Sky 33 (24.63)
15 (17.44)
48 (21.82)
16 (14.55)
9 (9.68) 25 (12.32)
49 (20.08)
24 (13.41)
73 (17.26)
Videocon d2h 14 (10.45)
3 (3.49) 17 (7.73)
7 (6.36) 3 (3.23) 10 (4.93)
21 (8.61)
6 (3.35) 27 (6.38)
Doordarshan (D. D.) DTH
22 (16.42)
3 (3.49) 25 (11.36)
18 (16.36)
12 (12.9)
30 (14.78)
40 (16.39)
15 (8.38)
55 (13)
Reliance Big TV
1 (0.75) -- 1 (0.45)
1 (0.91) -- 1 (0.49)
2 (0.82) -- 2 (0.47)
Samsung Dish TV
-- -- -- 2 (1.82) -- 2 (0.99)
2 (0.82) -- 2 (0.47)
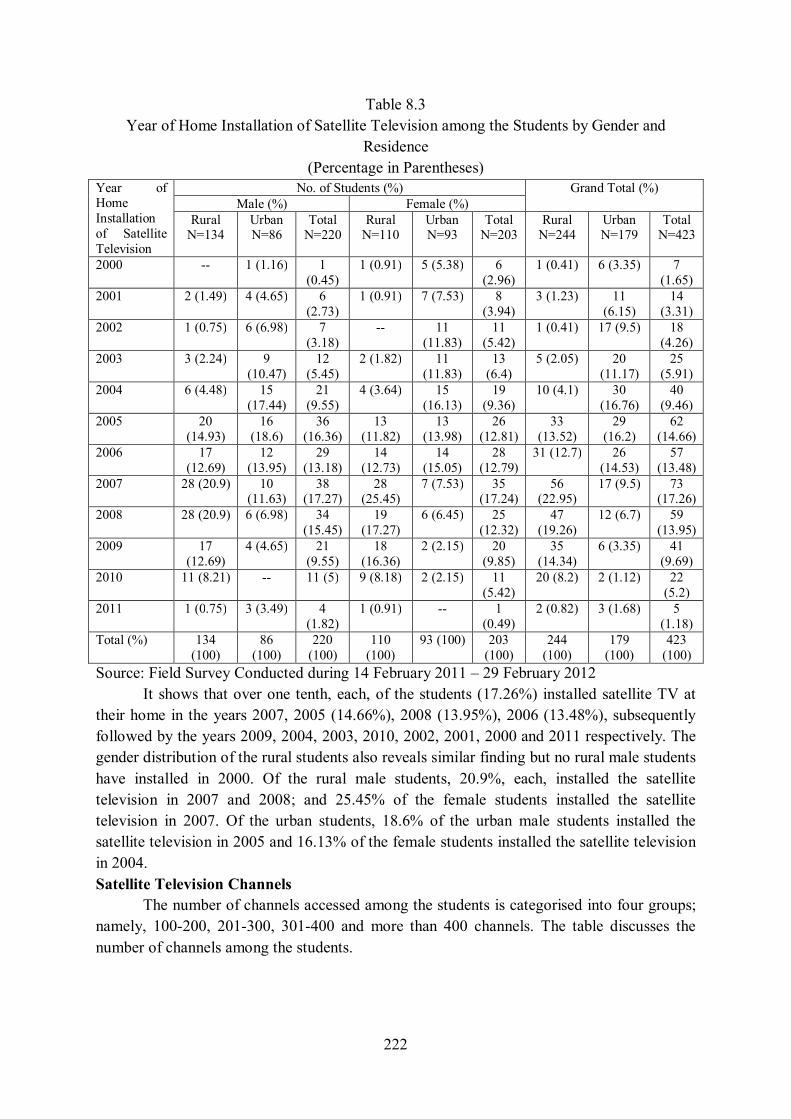
Source: Field Survey Conducted during 14 February 2011 – 29 February 2012 The table exhibits that over one fourth of the students (28.61%) use AirTel digital TV, subsequently followed by cable operator (27.19%), Tata Sky and Doordarshan (D. D.) DTH (17.26%) (13%), Sun TV, Videocon d2h, Reliance Big TV and Samsung Dish TV. AirTel is dominating other service providers of television channels because of its popularity and access in rural areas. Videocon d2h and Doordarshan (D.D.) DTH are used in the house of insignificants of male students, while Videocon d2h and Sun TV are satellite TV providers of less number of houses of female students. Thus, cable operator is the major satellite television provider among the urban students due to its location in urban setting. Thus, AirTel digital TV is found as major satellite television provider after cable operator because being the private sector unit it provides reasonable access to pay television channels in rural and urban areas. Year of Home Installation of Satellite Television The table demonstrates the year of home installation of satellite television by gender and residence. There are twelve categories of year of home installation of satellite television ranging from the year 2000 to 2011 among the students. Their distribution pattern is shown in the following table.
222
Table 8.3 Year of Home Installation of Satellite Television among the Students by Gender and
Residence (Percentage in Parentheses)
Year of Home Installation of Satellite Television
No. of Students (%) Grand Total (%) Male (%) Female (%)
Rural N=134
Urban N=86
Total N=220
Rural N=110
Urban N=93
Total N=203
Rural N=244
Urban N=179
Total N=423
2000 -- 1 (1.16) 1 (0.45)
1 (0.91) 5 (5.38) 6 (2.96)
1 (0.41) 6 (3.35) 7 (1.65)
2001 2 (1.49) 4 (4.65) 6 (2.73)
1 (0.91) 7 (7.53) 8 (3.94)
3 (1.23) 11 (6.15)
14 (3.31)
2002 1 (0.75) 6 (6.98) 7 (3.18)
-- 11 (11.83)
11 (5.42)
1 (0.41) 17 (9.5) 18 (4.26)
2003 3 (2.24) 9 (10.47)
12 (5.45)
2 (1.82) 11 (11.83)
13 (6.4)
5 (2.05) 20 (11.17)
25 (5.91)
2004 6 (4.48) 15 (17.44)
21 (9.55)
4 (3.64) 15 (16.13)
19 (9.36)
10 (4.1) 30 (16.76)
40 (9.46)
2005 20 (14.93)
16 (18.6)
36 (16.36)
13 (11.82)
13 (13.98)
26 (12.81)
33 (13.52)
29 (16.2)
62 (14.66)
2006 17 (12.69)
12 (13.95)
29 (13.18)
14 (12.73)
14 (15.05)
28 (12.79)
31 (12.7) 26 (14.53)
57 (13.48)
2007 28 (20.9) 10 (11.63)
38 (17.27)
28 (25.45)
7 (7.53) 35 (17.24)
56 (22.95)
17 (9.5) 73 (17.26)
2008 28 (20.9) 6 (6.98) 34 (15.45)
19 (17.27)
6 (6.45) 25 (12.32)
47 (19.26)
12 (6.7) 59 (13.95)
2009 17 (12.69)
4 (4.65) 21 (9.55)
18 (16.36)
2 (2.15) 20 (9.85)
35 (14.34)
6 (3.35) 41 (9.69)
2010 11 (8.21) -- 11 (5) 9 (8.18) 2 (2.15) 11 (5.42)
20 (8.2) 2 (1.12) 22 (5.2)
2011 1 (0.75) 3 (3.49) 4 (1.82)
1 (0.91) -- 1 (0.49)
2 (0.82) 3 (1.68) 5 (1.18)
Total (%) 134 (100)
86 (100)
220 (100)
110 (100)
93 (100) 203 (100)
244 (100)
179 (100)
423 (100)
Source: Field Survey Conducted during 14 February 2011 – 29 February 2012 It shows that over one tenth, each, of the students (17.26%) installed satellite TV at their home in the years 2007, 2005 (14.66%), 2008 (13.95%), 2006 (13.48%), subsequently followed by the years 2009, 2004, 2003, 2010, 2002, 2001, 2000 and 2011 respectively. The gender distribution of the rural students also reveals similar finding but no rural male students have installed in 2000. Of the rural male students, 20.9%, each, installed the satellite television in 2007 and 2008; and 25.45% of the female students installed the satellite television in 2007. Of the urban students, 18.6% of the urban male students installed the satellite television in 2005 and 16.13% of the female students installed the satellite television in 2004. Satellite Television Channels The number of channels accessed among the students is categorised into four groups; namely, 100-200, 201-300, 301-400 and more than 400 channels. The table discusses the number of channels among the students.

223
Table 8.4 Number of Channels Provided by Satellite Television Channels among the Students by
Gender and Residence (Percentage in Parentheses)
No. of Channels
No. of Students (%) Grand Total (%) Male (%) Female (%)
Rural N=134
Urban N=86
Total N=220
Rural N=110
Urban N=93
Total N=203
Rural N=244
Urban N=179
Total N=423
100-200 16 (11.94)
27 (31.4)
43 (19.55)
26 (23.64)
49 (52.69)
75 (36.95)
42 (17.21)
76 (42.46)
118 (27.9)
201-300 56 (41.79)
43 (50) 99 (45) 45 (40.91)
38 (40.86)
83 (40.89)
101 (41.39)
81 (45.25)
182 (43.03)
301-400 51 (38.06)
10 (11.63)
61 (27.73)
33 (30) 5 (5.38) 38 (18.72)
84 (34.43)
15 (8.38)
99 (23.4)
> 400 12 (8.96) 6 (6.98) 18 (8.18)
6 (5.45) 1 (1.08) 7 (3.45)
18 (7.38) 7 (3.91) 25 (5.91)
Source: Field Survey Conducted during 14 February 2011 – 29 February 2012 The table reveals that two fifths of the students (43.03%) have 201-300 channels, subsequently followed by 100-200 channels (27.9%) and 301-400 channels (23.4%). The similar pattern is observed across their categories of genders and residences. Hence, television channels among the students ranges from 201-300 channels because they do not need more TV channels and these are sufficient for them. Thus, the urban students have 201-300 channels because it is reasonable for them and accessing more television channels is not good and they do not get sufficient knowledge and entertainment to the students. The subscription of number of television channels depends on their family income. The students from higher income-group subscribe more pay TV channels than the lower income-group.
In sum, the students subscribe dish TV and cable TV connection most, use services of AirTel digital TV and cable operator, installed satellite television at home in 2007 and 2005, have 201-300 channels. It depends on their parents’ annual income level.
II THE USE PATTERNS OF SATLLITE TV
The section introduces and discusses use patterns of satellite television in education among the students which include sources of knowing about telecast schedule, preferred language for viewing programmes, most viewed TV programmes, most viewed educational satellite TV channels, frequency of watching educational programmes, medium of instruction in educational television programmes, language preference, content of programmes viewed, types of topics in educational television programmes, types of educational television programmes viewed and types of educational television problems. Sources of Knowing Telecast Schedule The study identified six sources of knowing telecast schedule of programmes; namely, television transmission, friends, newspaper, Internet, magazine and teachers. So the following table shows sources of knowing telecast schedule among the students.
224
Table 8.5 Sources of Knowing about Telecast Schedule among the Students by Gender and Residence
(Percentage in Parentheses) Source of Knowing Telecast Schedule
No. of Students (%) Grand Total (%) Male (%) Female (%)
Rural N=134
Urban N=86
Total N=220
Rural N=110
Urban N=93
Total N=203
Rural N=244
Urban N=179
Total N=423
Newspaper 18 (13.43)
22 (25.58)
40 (18.18)
17 (15.45)
25 (26.88)
42 (20.69)
35 (14.34)
47 (26.26)
82 (19.39)
Magazine 8 (5.97) 5 (5.81) 13 (5.91)
9 (8.18)
2 (2.15) 11 (5.42)
17 (6.97)
7 (3.91) 24 (5.67)
TV transmission 111 (82.84)
71 (82.56)
182 (82.73)
99 (90) 86 (92.47)
185 (91.13)
210 (86.07)
157 (87.71)
367 (86.76)
Teachers 8 (5.97) 4 (4.65) 12 (5.45)
3 (2.73)
2 (2.15) 5 (2.46)
11 (4.51)
6 (3.35) 17 (4.02)
Friends 35 (26.12)
12 (13.95)
47 (21.36)
27 (24.55)
10 (10.75)
37 (18.23)
62 (25.41)
22 (12.29)
84 (19.86)
Internet 17 (12.69)
8 (9.3) 25 (11.36)
8 (7.27)
4 (4.3) 12 (5.91)
25 (10.25)
12 (6.7) 37 (8.75)
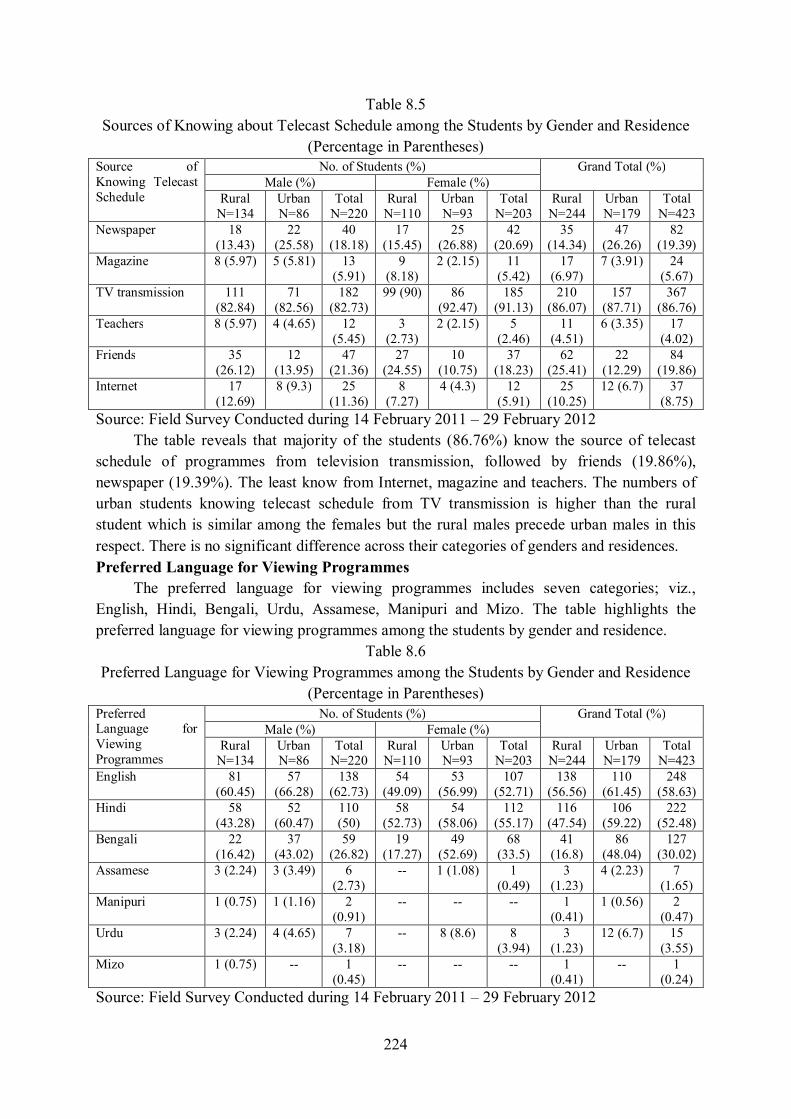
Source: Field Survey Conducted during 14 February 2011 – 29 February 2012 The table reveals that majority of the students (86.76%) know the source of telecast schedule of programmes from television transmission, followed by friends (19.86%), newspaper (19.39%). The least know from Internet, magazine and teachers. The numbers of urban students knowing telecast schedule from TV transmission is higher than the rural student which is similar among the females but the rural males precede urban males in this respect. There is no significant difference across their categories of genders and residences. Preferred Language for Viewing Programmes The preferred language for viewing programmes includes seven categories; viz., English, Hindi, Bengali, Urdu, Assamese, Manipuri and Mizo. The table highlights the preferred language for viewing programmes among the students by gender and residence.
Table 8.6 Preferred Language for Viewing Programmes among the Students by Gender and Residence
(Percentage in Parentheses) Preferred Language for Viewing Programmes
No. of Students (%) Grand Total (%) Male (%) Female (%)
Rural N=134
Urban N=86
Total N=220
Rural N=110
Urban N=93
Total N=203
Rural N=244
Urban N=179
Total N=423
English 81 (60.45)
57 (66.28)
138 (62.73)
54 (49.09)
53 (56.99)
107 (52.71)
138 (56.56)
110 (61.45)
248 (58.63)
Hindi 58 (43.28)
52 (60.47)
110 (50)
58 (52.73)
54 (58.06)
112 (55.17)
116 (47.54)
106 (59.22)
222 (52.48)
Bengali 22 (16.42)
37 (43.02)
59 (26.82)
19 (17.27)
49 (52.69)
68 (33.5)
41 (16.8)
86 (48.04)
127 (30.02)
Assamese 3 (2.24) 3 (3.49) 6 (2.73)
-- 1 (1.08) 1 (0.49)
3 (1.23)
4 (2.23) 7 (1.65)
Manipuri 1 (0.75) 1 (1.16) 2 (0.91)
-- -- -- 1 (0.41)
1 (0.56) 2 (0.47)
Urdu 3 (2.24) 4 (4.65) 7 (3.18)
-- 8 (8.6) 8 (3.94)
3 (1.23)
12 (6.7) 15 (3.55)
Mizo 1 (0.75) -- 1 (0.45)
-- -- -- 1 (0.41)
-- 1 (0.24)
Source: Field Survey Conducted during 14 February 2011 – 29 February 2012
225
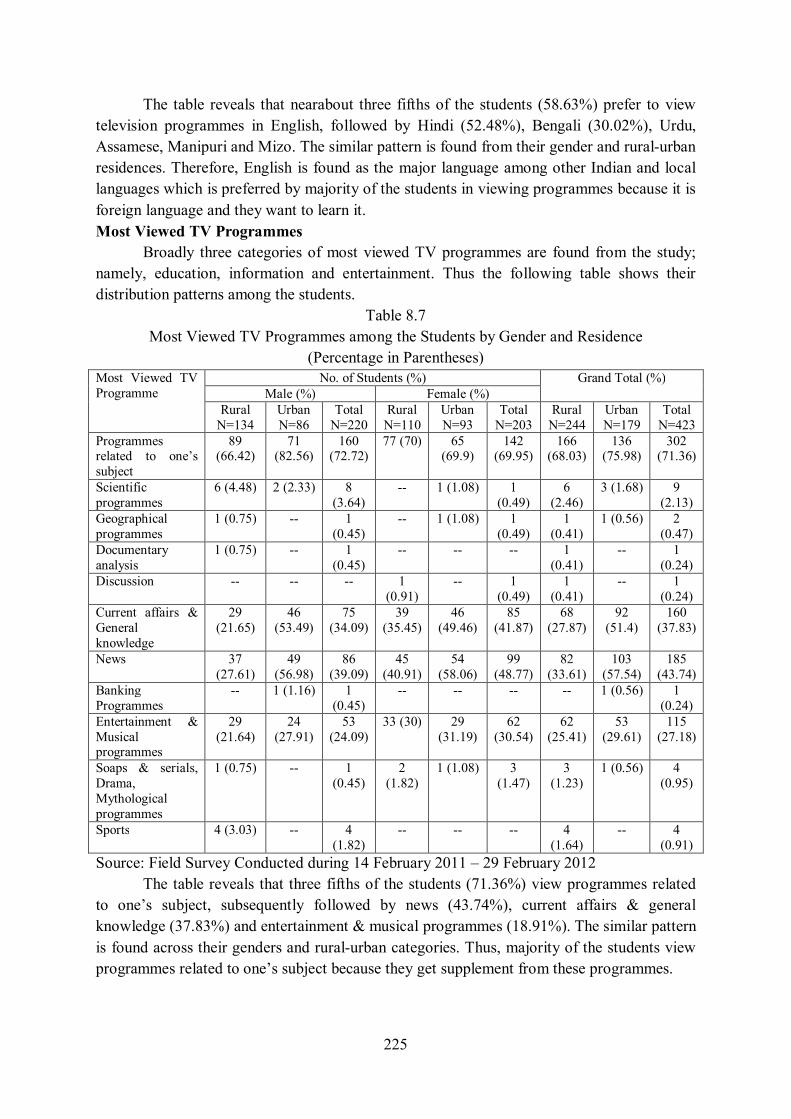
The table reveals that nearabout three fifths of the students (58.63%) prefer to view television programmes in English, followed by Hindi (52.48%), Bengali (30.02%), Urdu, Assamese, Manipuri and Mizo. The similar pattern is found from their gender and rural-urban residences. Therefore, English is found as the major language among other Indian and local languages which is preferred by majority of the students in viewing programmes because it is foreign language and they want to learn it. Most Viewed TV Programmes Broadly three categories of most viewed TV programmes are found from the study; namely, education, information and entertainment. Thus the following table shows their distribution patterns among the students.
Table 8.7 Most Viewed TV Programmes among the Students by Gender and Residence
(Percentage in Parentheses) Most Viewed TV Programme
No. of Students (%) Grand Total (%) Male (%) Female (%)
Rural N=134
Urban N=86
Total N=220
Rural N=110
Urban N=93
Total N=203
Rural N=244
Urban N=179
Total N=423
Programmes related to one’s subject
89 (66.42)
71 (82.56)
160 (72.72)
77 (70) 65 (69.9)
142 (69.95)
166 (68.03)
136 (75.98)
302 (71.36)
Scientific programmes
6 (4.48) 2 (2.33) 8 (3.64)
-- 1 (1.08) 1 (0.49)
6 (2.46)
3 (1.68) 9 (2.13)
Geographical programmes
1 (0.75) -- 1 (0.45)
-- 1 (1.08) 1 (0.49)
1 (0.41)
1 (0.56) 2 (0.47)
Documentary analysis
1 (0.75) -- 1 (0.45)
-- -- -- 1 (0.41)
-- 1 (0.24)
Discussion -- -- -- 1 (0.91)
-- 1 (0.49)
1 (0.41)
-- 1 (0.24)
Current affairs & General knowledge
29 (21.65)
46 (53.49)
75 (34.09)
39 (35.45)
46 (49.46)
85 (41.87)
68 (27.87)
92 (51.4)
160 (37.83)
News 37 (27.61)
49 (56.98)
86 (39.09)
45 (40.91)
54 (58.06)
99 (48.77)
82 (33.61)
103 (57.54)
185 (43.74)
Banking Programmes
-- 1 (1.16) 1 (0.45)
-- -- -- -- 1 (0.56) 1 (0.24)
Entertainment & Musical programmes
29 (21.64)
24 (27.91)
53 (24.09)
33 (30) 29 (31.19)
62 (30.54)
62 (25.41)
53 (29.61)
115 (27.18)
Soaps & serials, Drama, Mythological programmes
1 (0.75) -- 1 (0.45)
2 (1.82)
1 (1.08) 3 (1.47)
3 (1.23)
1 (0.56) 4 (0.95)
Sports 4 (3.03) -- 4 (1.82)
-- -- -- 4 (1.64)
-- 4 (0.91)
Source: Field Survey Conducted during 14 February 2011 – 29 February 2012 The table reveals that three fifths of the students (71.36%) view programmes related to one’s subject, subsequently followed by news (43.74%), current affairs & general knowledge (37.83%) and entertainment & musical programmes (18.91%). The similar pattern is found across their genders and rural-urban categories. Thus, majority of the students view programmes related to one’s subject because they get supplement from these programmes.
226
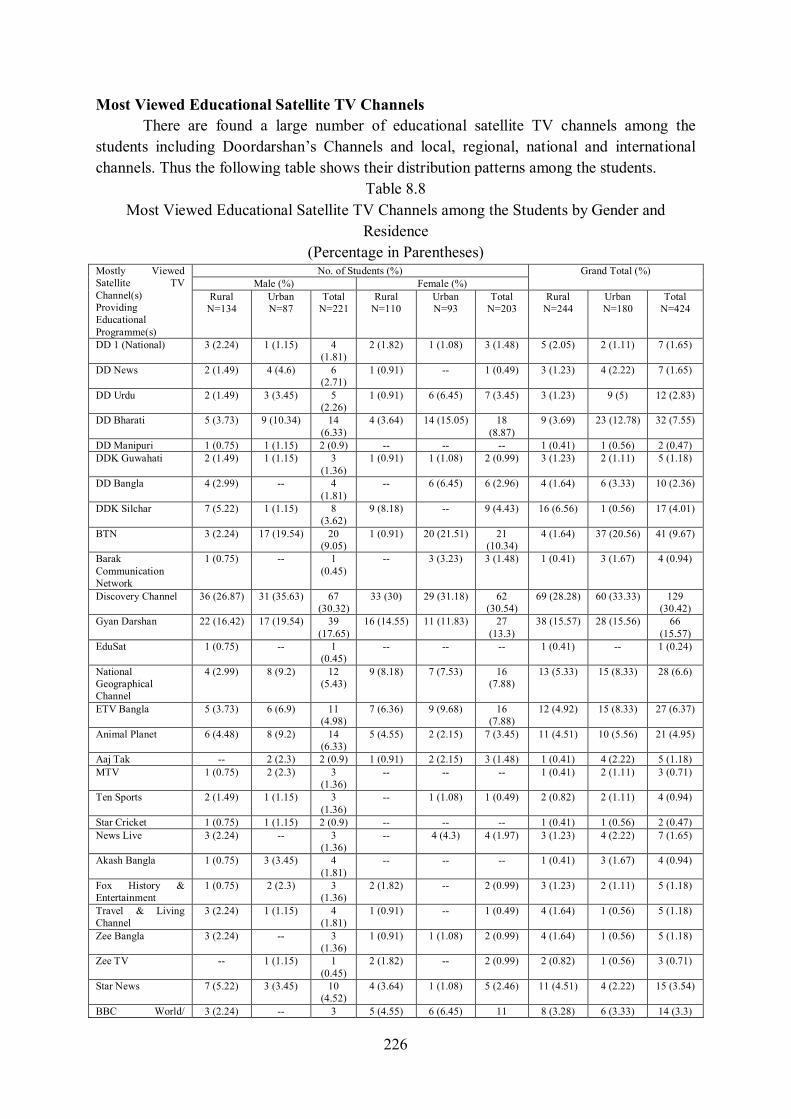
Most Viewed Educational Satellite TV Channels There are found a large number of educational satellite TV channels among the students including Doordarshan’s Channels and local, regional, national and international channels. Thus the following table shows their distribution patterns among the students.
Table 8.8 Most Viewed Educational Satellite TV Channels among the Students by Gender and
Residence (Percentage in Parentheses)
Mostly Viewed Satellite TV Channel(s) Providing Educational Programme(s)
No. of Students (%) Grand Total (%) Male (%) Female (%)
Rural N=134
Urban N=87
Total N=221
Rural N=110
Urban N=93
Total N=203
Rural N=244
Urban N=180
Total N=424
DD 1 (National) 3 (2.24) 1 (1.15) 4 (1.81)
2 (1.82) 1 (1.08) 3 (1.48) 5 (2.05) 2 (1.11) 7 (1.65)
DD News 2 (1.49) 4 (4.6) 6 (2.71)
1 (0.91) -- 1 (0.49) 3 (1.23) 4 (2.22) 7 (1.65)
DD Urdu 2 (1.49) 3 (3.45) 5 (2.26)
1 (0.91) 6 (6.45) 7 (3.45) 3 (1.23) 9 (5) 12 (2.83)
DD Bharati 5 (3.73) 9 (10.34) 14 (6.33)
4 (3.64) 14 (15.05) 18 (8.87)
9 (3.69) 23 (12.78) 32 (7.55)
DD Manipuri 1 (0.75) 1 (1.15) 2 (0.9) -- -- -- 1 (0.41) 1 (0.56) 2 (0.47) DDK Guwahati 2 (1.49) 1 (1.15) 3
(1.36) 1 (0.91) 1 (1.08) 2 (0.99) 3 (1.23) 2 (1.11) 5 (1.18)
DD Bangla 4 (2.99) -- 4 (1.81)
-- 6 (6.45) 6 (2.96) 4 (1.64) 6 (3.33) 10 (2.36)
DDK Silchar 7 (5.22) 1 (1.15) 8 (3.62)
9 (8.18) -- 9 (4.43) 16 (6.56) 1 (0.56) 17 (4.01)
BTN 3 (2.24) 17 (19.54) 20 (9.05)
1 (0.91) 20 (21.51) 21 (10.34)
4 (1.64) 37 (20.56) 41 (9.67)
Barak Communication Network
1 (0.75) -- 1 (0.45)
-- 3 (3.23) 3 (1.48) 1 (0.41) 3 (1.67) 4 (0.94)
Discovery Channel 36 (26.87) 31 (35.63) 67 (30.32)
33 (30) 29 (31.18) 62 (30.54)
69 (28.28) 60 (33.33) 129 (30.42)
Gyan Darshan 22 (16.42) 17 (19.54) 39 (17.65)
16 (14.55) 11 (11.83) 27 (13.3)
38 (15.57) 28 (15.56) 66 (15.57)
EduSat 1 (0.75) -- 1 (0.45)
-- -- -- 1 (0.41) -- 1 (0.24)
National Geographical Channel
4 (2.99) 8 (9.2) 12 (5.43)
9 (8.18) 7 (7.53) 16 (7.88)
13 (5.33) 15 (8.33) 28 (6.6)
ETV Bangla 5 (3.73) 6 (6.9) 11 (4.98)
7 (6.36) 9 (9.68) 16 (7.88)
12 (4.92) 15 (8.33) 27 (6.37)
Animal Planet 6 (4.48) 8 (9.2) 14 (6.33)
5 (4.55) 2 (2.15) 7 (3.45) 11 (4.51) 10 (5.56) 21 (4.95)
Aaj Tak -- 2 (2.3) 2 (0.9) 1 (0.91) 2 (2.15) 3 (1.48) 1 (0.41) 4 (2.22) 5 (1.18) MTV 1 (0.75) 2 (2.3) 3
(1.36) -- -- -- 1 (0.41) 2 (1.11) 3 (0.71)
Ten Sports 2 (1.49) 1 (1.15) 3 (1.36)
-- 1 (1.08) 1 (0.49) 2 (0.82) 2 (1.11) 4 (0.94)
Star Cricket 1 (0.75) 1 (1.15) 2 (0.9) -- -- -- 1 (0.41) 1 (0.56) 2 (0.47) News Live 3 (2.24) -- 3
(1.36) -- 4 (4.3) 4 (1.97) 3 (1.23) 4 (2.22) 7 (1.65)
Akash Bangla 1 (0.75) 3 (3.45) 4 (1.81)
-- -- -- 1 (0.41) 3 (1.67) 4 (0.94)
Fox History & Entertainment
1 (0.75) 2 (2.3) 3 (1.36)
2 (1.82) -- 2 (0.99) 3 (1.23) 2 (1.11) 5 (1.18)
Travel & Living Channel
3 (2.24) 1 (1.15) 4 (1.81)
1 (0.91) -- 1 (0.49) 4 (1.64) 1 (0.56) 5 (1.18)
Zee Bangla 3 (2.24) -- 3 (1.36)
1 (0.91) 1 (1.08) 2 (0.99) 4 (1.64) 1 (0.56) 5 (1.18)
Zee TV -- 1 (1.15) 1 (0.45)
2 (1.82) -- 2 (0.99) 2 (0.82) 1 (0.56) 3 (0.71)
Star News 7 (5.22) 3 (3.45) 10 (4.52)
4 (3.64) 1 (1.08) 5 (2.46) 11 (4.51) 4 (2.22) 15 (3.54)
BBC World/ 3 (2.24) -- 3 5 (4.55) 6 (6.45) 11 8 (3.28) 6 (3.33) 14 (3.3)
227
Broadcast (1.36) (5.42) Sony Max 2 (1.49) -- 2 (0.9) -- 2 (2.15) 2 (0.99) 2 (0.82) 2 (1.11) 4 (0.94) Zee News 2 (1.49) 1 (1.15) 3
(1.36) 1 (0.91) 1 (1.08) 2 (0.99) 3 (1.23) 2 (1.11) 5 (1.18)
Star Plus 3 (2.24) 2 (2.3) 5 (2.26)
5 (4.55) 8 (8.6) 13 (6.4) 8 (3.28) 10 (5.56) 18 (4.25)
Sanskar 2 (1.49) -- 2 (0.9) 1 (0.91) 3 (3.23) 4 (1.97) 3 (1.23) 3 (1.67) 6 (1.42) ATN Bangla 2 (1.49) -- 2 (0.9) -- 1 (1.08) 1 (0.49) 2 (0.82) 1 (0.56) 3 (0.71) Taara -- -- -- 3 (2.73) 2 (2.15) 5 (2.46) 3 (1.23) 2 (1.11) 5 (1.18) Peace TV 1 (0.75) 1 (1.15) 2 (0.9) -- -- -- 1 (0.41) 1 (0.56) 2 (0.47) Zee Business 2 (1.49) 1 (1.15) 3
(1.36) -- -- -- 2 (0.82) 1 (0.56) 3 (0.71)
Star Jalsha 3 (2.24) -- 3 (1.36)
4 (3.64) 1 (1.08) 5 (2.46) 7 (2.87) 1 (0.56) 8 (1.89)
Bengali TV Channels
3 (2.24) 1 (1.15) 4 (1.81)
5 (4.55) -- 5 (2.46) 8 (3.28) 1 (0.56) 9 (2.12)
IGNOU 1 (0.75) 1 (1.15) 2 (0.9) 3 (2.73) -- 3 (1.48) 4 (1.64) 1 (0.56) 5 (1.18) Ten Cricket 3 (2.24) 1 (1.15) 4
(1.81) -- -- -- 3 (1.23) 1 (0.56) 4 (0.94)
Zee Cinema 4 (2.99) 1 (1.15) 5 (2.26)
3 (2.73) 2 (2.15) 5 (2.46) 3 (1.23) 7 (3.89) 10 (2.36)
Star One 5 (3.73) 2 (2.3) 7 (3.17)
4 (3.64) 2 (2.15) 6 (2.96) 9 (3.69) 4 (2.22) 13 (3.07)
Sahara TV 2 (1.49) -- 2 (0.9) 3 (2.73) 1 (1.08) 4 (1.97) 5 (2.05) 1 (0.56) 6 (1.42) Star Gold 4 (2.99) -- 4
(1.81) 5 (4.55) 1 (1.08) 6 (2.96) 9 (3.69) 1 (0.56) 10 (2.36)
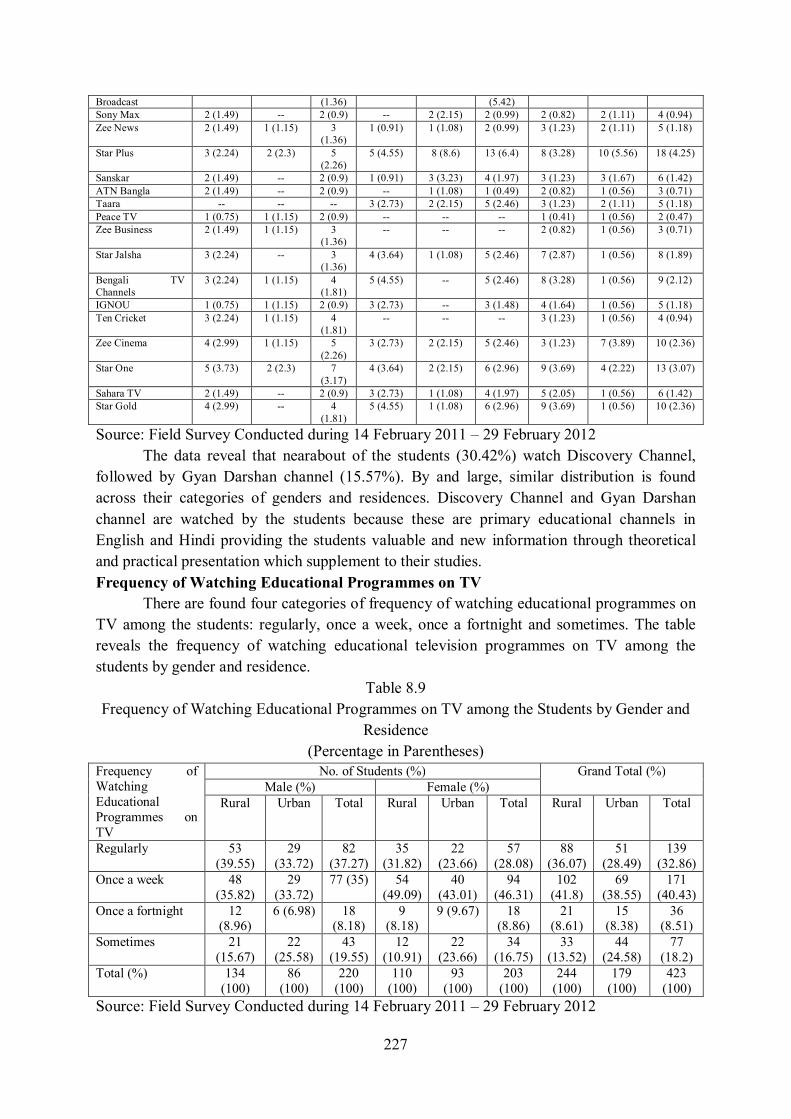
Source: Field Survey Conducted during 14 February 2011 – 29 February 2012 The data reveal that nearabout of the students (30.42%) watch Discovery Channel, followed by Gyan Darshan channel (15.57%). By and large, similar distribution is found across their categories of genders and residences. Discovery Channel and Gyan Darshan channel are watched by the students because these are primary educational channels in English and Hindi providing the students valuable and new information through theoretical and practical presentation which supplement to their studies. Frequency of Watching Educational Programmes on TV There are found four categories of frequency of watching educational programmes on TV among the students: regularly, once a week, once a fortnight and sometimes. The table reveals the frequency of watching educational television programmes on TV among the students by gender and residence.
Table 8.9 Frequency of Watching Educational Programmes on TV among the Students by Gender and
Residence (Percentage in Parentheses)
Frequency of Watching Educational Programmes on TV
No. of Students (%) Grand Total (%) Male (%) Female (%)
Rural Urban Total Rural Urban Total Rural Urban Total
Regularly 53 (39.55)
29 (33.72)
82 (37.27)
35 (31.82)
22 (23.66)
57 (28.08)
88 (36.07)
51 (28.49)
139 (32.86)
Once a week 48 (35.82)
29 (33.72)
77 (35) 54 (49.09)
40 (43.01)
94 (46.31)
102 (41.8)
69 (38.55)
171 (40.43)
Once a fortnight 12 (8.96)
6 (6.98) 18 (8.18)
9 (8.18)
9 (9.67) 18 (8.86)
21 (8.61)
15 (8.38)
36 (8.51)
Sometimes 21 (15.67)
22 (25.58)
43 (19.55)
12 (10.91)
22 (23.66)
34 (16.75)
33 (13.52)
44 (24.58)
77 (18.2)
Total (%) 134 (100)
86 (100)
220 (100)
110 (100)
93 (100)
203 (100)
244 (100)
179 (100)
423 (100)
Source: Field Survey Conducted during 14 February 2011 – 29 February 2012
228
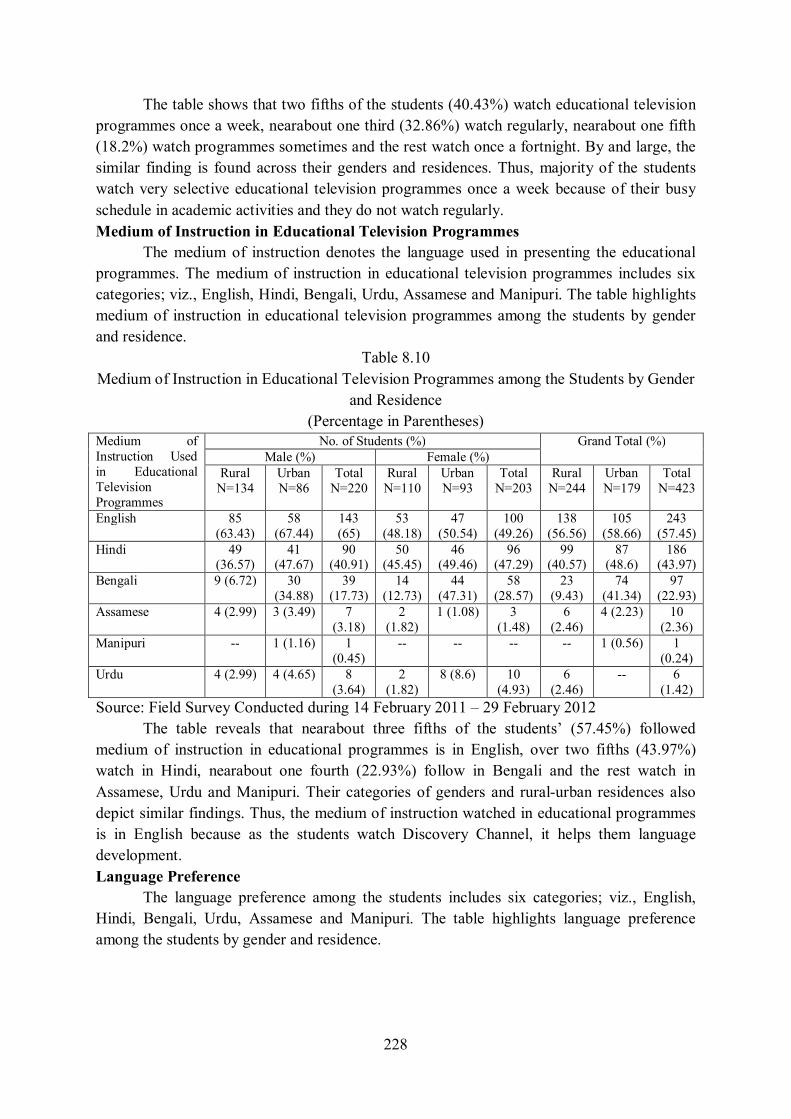
The table shows that two fifths of the students (40.43%) watch educational television programmes once a week, nearabout one third (32.86%) watch regularly, nearabout one fifth (18.2%) watch programmes sometimes and the rest watch once a fortnight. By and large, the similar finding is found across their genders and residences. Thus, majority of the students watch very selective educational television programmes once a week because of their busy schedule in academic activities and they do not watch regularly. Medium of Instruction in Educational Television Programmes The medium of instruction denotes the language used in presenting the educational programmes. The medium of instruction in educational television programmes includes six categories; viz., English, Hindi, Bengali, Urdu, Assamese and Manipuri. The table highlights medium of instruction in educational television programmes among the students by gender and residence.
Table 8.10 Medium of Instruction in Educational Television Programmes among the Students by Gender
and Residence (Percentage in Parentheses)
Medium of Instruction Used in Educational Television Programmes
No. of Students (%) Grand Total (%) Male (%) Female (%)
Rural N=134
Urban N=86
Total N=220
Rural N=110
Urban N=93
Total N=203
Rural N=244
Urban N=179
Total N=423
English 85 (63.43)
58 (67.44)
143 (65)
53 (48.18)
47 (50.54)
100 (49.26)
138 (56.56)
105 (58.66)
243 (57.45)
Hindi 49 (36.57)
41 (47.67)
90 (40.91)
50 (45.45)
46 (49.46)
96 (47.29)
99 (40.57)
87 (48.6)
186 (43.97)
Bengali 9 (6.72) 30 (34.88)
39 (17.73)
14 (12.73)
44 (47.31)
58 (28.57)
23 (9.43)
74 (41.34)
97 (22.93)
Assamese 4 (2.99) 3 (3.49) 7 (3.18)
2 (1.82)
1 (1.08) 3 (1.48)
6 (2.46)
4 (2.23) 10 (2.36)
Manipuri -- 1 (1.16) 1 (0.45)
-- -- -- -- 1 (0.56) 1 (0.24)
Urdu 4 (2.99) 4 (4.65) 8 (3.64)
2 (1.82)
8 (8.6) 10 (4.93)
6 (2.46)
-- 6 (1.42)
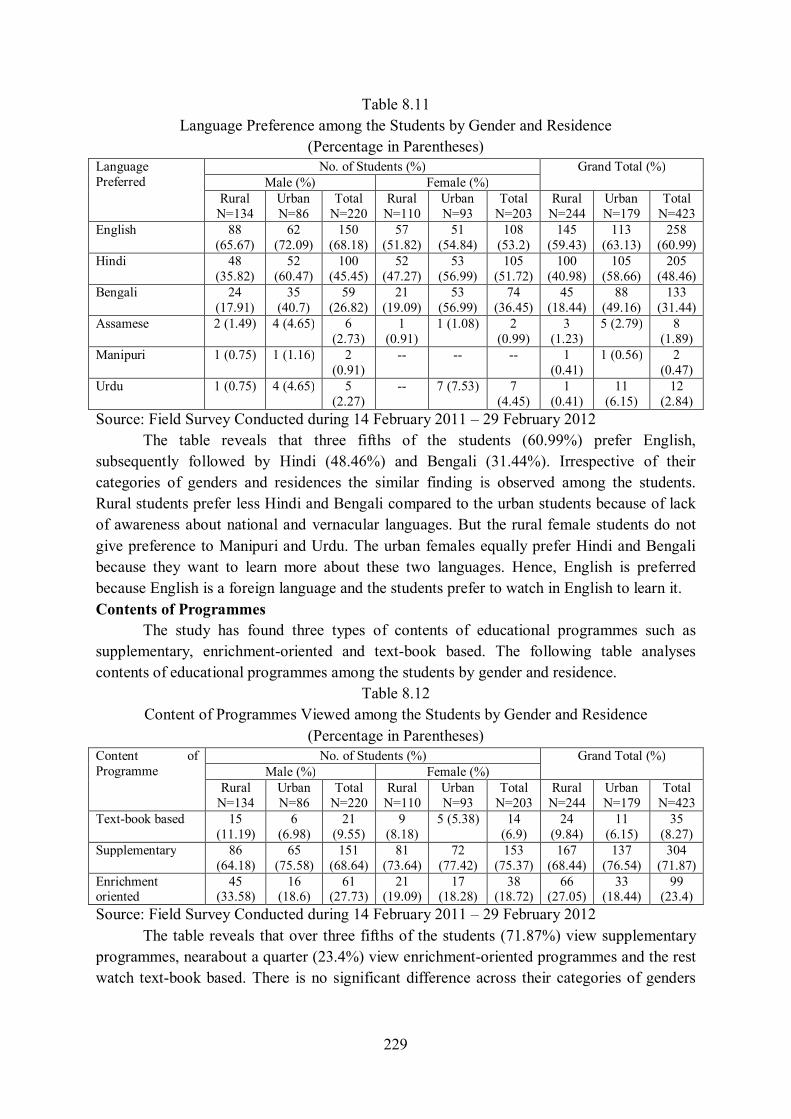
Source: Field Survey Conducted during 14 February 2011 – 29 February 2012 The table reveals that nearabout three fifths of the students’ (57.45%) followed medium of instruction in educational programmes is in English, over two fifths (43.97%) watch in Hindi, nearabout one fourth (22.93%) follow in Bengali and the rest watch in Assamese, Urdu and Manipuri. Their categories of genders and rural-urban residences also depict similar findings. Thus, the medium of instruction watched in educational programmes is in English because as the students watch Discovery Channel, it helps them language development. Language Preference The language preference among the students includes six categories; viz., English, Hindi, Bengali, Urdu, Assamese and Manipuri. The table highlights language preference among the students by gender and residence.
229
Table 8.11 Language Preference among the Students by Gender and Residence
(Percentage in Parentheses) Language Preferred
No. of Students (%) Grand Total (%) Male (%) Female (%)
Rural N=134
Urban N=86
Total N=220
Rural N=110
Urban N=93
Total N=203
Rural N=244
Urban N=179
Total N=423
English 88 (65.67)
62 (72.09)
150 (68.18)
57 (51.82)
51 (54.84)
108 (53.2)
145 (59.43)
113 (63.13)
258 (60.99)
Hindi 48 (35.82)
52 (60.47)
100 (45.45)
52 (47.27)
53 (56.99)
105 (51.72)
100 (40.98)
105 (58.66)
205 (48.46)
Bengali 24 (17.91)
35 (40.7)
59 (26.82)
21 (19.09)
53 (56.99)
74 (36.45)
45 (18.44)
88 (49.16)
133 (31.44)
Assamese 2 (1.49) 4 (4.65) 6 (2.73)
1 (0.91)
1 (1.08) 2 (0.99)
3 (1.23)
5 (2.79) 8 (1.89)
Manipuri 1 (0.75) 1 (1.16) 2 (0.91)
-- -- -- 1 (0.41)
1 (0.56) 2 (0.47)
Urdu 1 (0.75) 4 (4.65) 5 (2.27)
-- 7 (7.53) 7 (4.45)
1 (0.41)
11 (6.15)
12 (2.84)
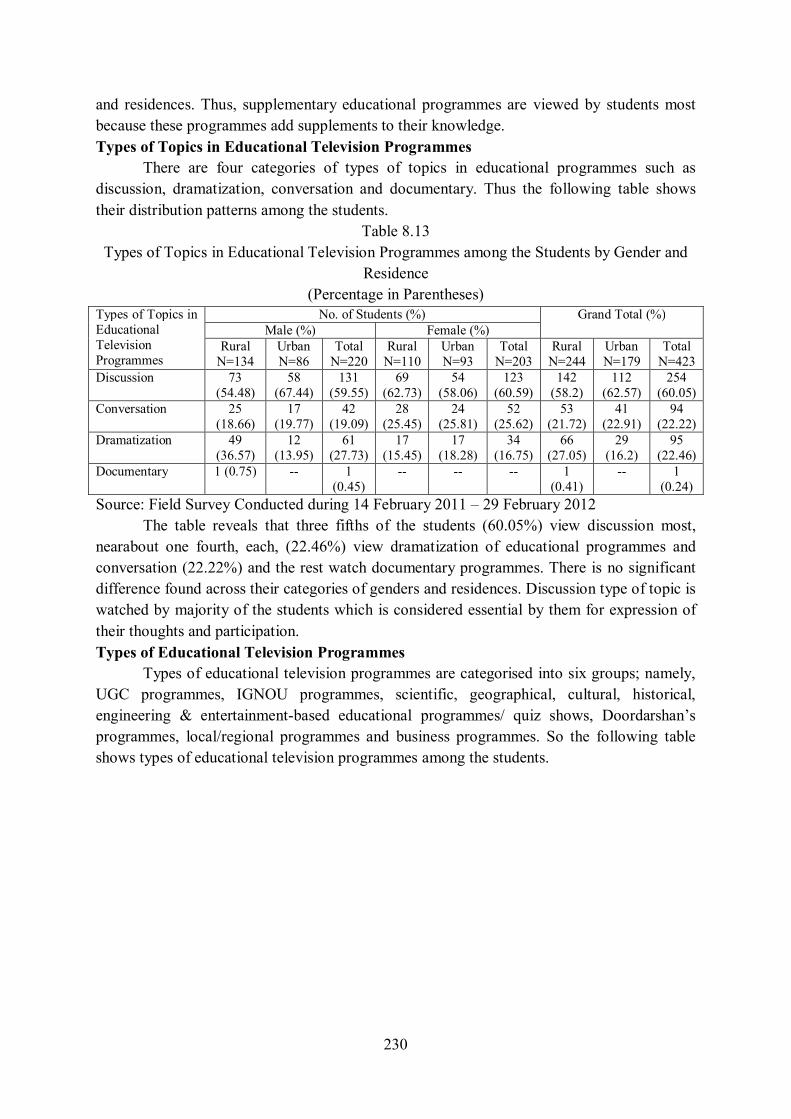
Source: Field Survey Conducted during 14 February 2011 – 29 February 2012 The table reveals that three fifths of the students (60.99%) prefer English, subsequently followed by Hindi (48.46%) and Bengali (31.44%). Irrespective of their categories of genders and residences the similar finding is observed among the students. Rural students prefer less Hindi and Bengali compared to the urban students because of lack of awareness about national and vernacular languages. But the rural female students do not give preference to Manipuri and Urdu. The urban females equally prefer Hindi and Bengali because they want to learn more about these two languages. Hence, English is preferred because English is a foreign language and the students prefer to watch in English to learn it. Contents of Programmes The study has found three types of contents of educational programmes such as supplementary, enrichment-oriented and text-book based. The following table analyses contents of educational programmes among the students by gender and residence.
Table 8.12 Content of Programmes Viewed among the Students by Gender and Residence
(Percentage in Parentheses) Content of Programme
No. of Students (%) Grand Total (%) Male (%) Female (%)
Rural N=134
Urban N=86
Total N=220
Rural N=110
Urban N=93
Total N=203
Rural N=244
Urban N=179
Total N=423
Text-book based 15 (11.19)
6 (6.98)
21 (9.55)
9 (8.18)
5 (5.38) 14 (6.9)
24 (9.84)
11 (6.15)
35 (8.27)
Supplementary 86 (64.18)
65 (75.58)
151 (68.64)
81 (73.64)
72 (77.42)
153 (75.37)
167 (68.44)
137 (76.54)
304 (71.87)
Enrichment oriented
45 (33.58)
16 (18.6)
61 (27.73)
21 (19.09)
17 (18.28)
38 (18.72)
66 (27.05)
33 (18.44)
99 (23.4)
Source: Field Survey Conducted during 14 February 2011 – 29 February 2012 The table reveals that over three fifths of the students (71.87%) view supplementary programmes, nearabout a quarter (23.4%) view enrichment-oriented programmes and the rest watch text-book based. There is no significant difference across their categories of genders
230
and residences. Thus, supplementary educational programmes are viewed by students most because these programmes add supplements to their knowledge. Types of Topics in Educational Television Programmes There are four categories of types of topics in educational programmes such as discussion, dramatization, conversation and documentary. Thus the following table shows their distribution patterns among the students.
Table 8.13 Types of Topics in Educational Television Programmes among the Students by Gender and
Residence (Percentage in Parentheses)
Types of Topics in Educational Television Programmes
No. of Students (%) Grand Total (%) Male (%) Female (%)
Rural N=134
Urban N=86
Total N=220
Rural N=110
Urban N=93
Total N=203
Rural N=244
Urban N=179
Total N=423
Discussion 73 (54.48)
58 (67.44)
131 (59.55)
69 (62.73)
54 (58.06)
123 (60.59)
142 (58.2)
112 (62.57)
254 (60.05)
Conversation 25 (18.66)
17 (19.77)
42 (19.09)
28 (25.45)
24 (25.81)
52 (25.62)
53 (21.72)
41 (22.91)
94 (22.22)
Dramatization 49 (36.57)
12 (13.95)
61 (27.73)
17 (15.45)
17 (18.28)
34 (16.75)
66 (27.05)
29 (16.2)
95 (22.46)
Documentary 1 (0.75) -- 1 (0.45)
-- -- -- 1 (0.41)
-- 1 (0.24)
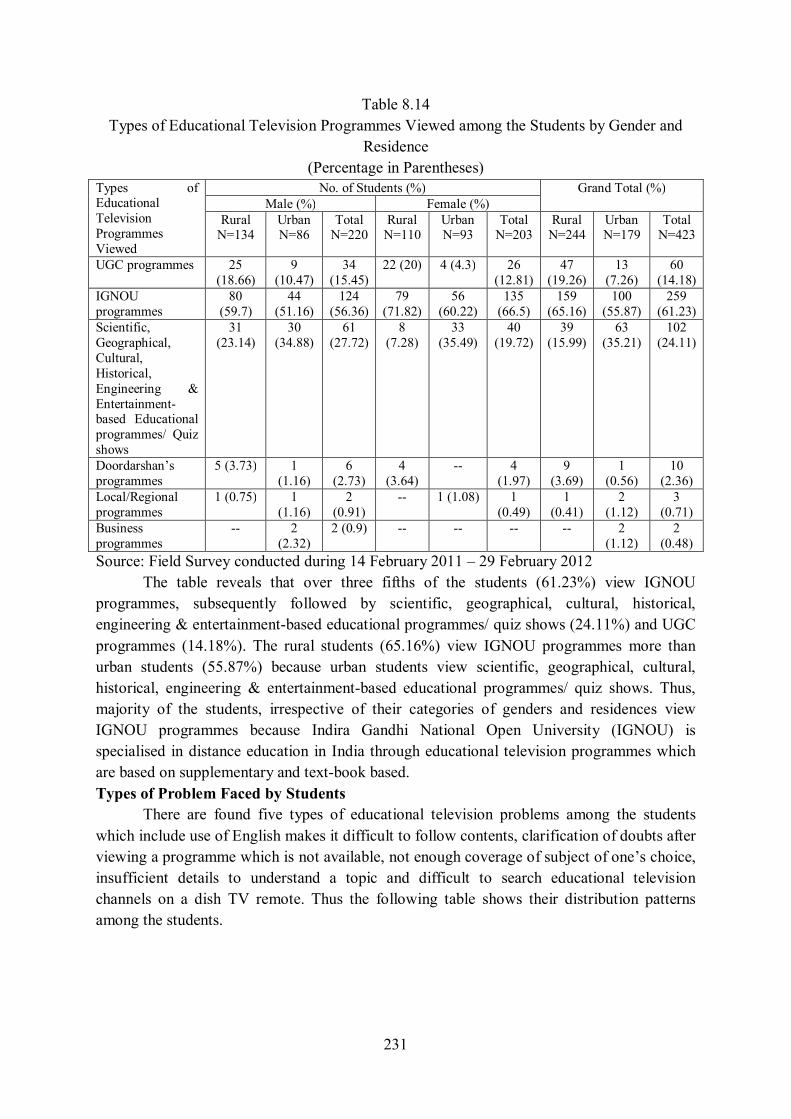
Source: Field Survey Conducted during 14 February 2011 – 29 February 2012 The table reveals that three fifths of the students (60.05%) view discussion most, nearabout one fourth, each, (22.46%) view dramatization of educational programmes and conversation (22.22%) and the rest watch documentary programmes. There is no significant difference found across their categories of genders and residences. Discussion type of topic is watched by majority of the students which is considered essential by them for expression of their thoughts and participation. Types of Educational Television Programmes Types of educational television programmes are categorised into six groups; namely, UGC programmes, IGNOU programmes, scientific, geographical, cultural, historical, engineering & entertainment-based educational programmes/ quiz shows, Doordarshan’s programmes, local/regional programmes and business programmes. So the following table shows types of educational television programmes among the students.
231
Table 8.14 Types of Educational Television Programmes Viewed among the Students by Gender and
Residence (Percentage in Parentheses)
Types of Educational Television Programmes Viewed
No. of Students (%) Grand Total (%) Male (%) Female (%)
Rural N=134
Urban N=86
Total N=220
Rural N=110
Urban N=93
Total N=203
Rural N=244
Urban N=179
Total N=423
UGC programmes 25 (18.66)
9 (10.47)
34 (15.45)
22 (20) 4 (4.3) 26 (12.81)
47 (19.26)
13 (7.26)
60 (14.18)
IGNOU programmes
80 (59.7)
44 (51.16)
124 (56.36)
79 (71.82)
56 (60.22)
135 (66.5)
159 (65.16)
100 (55.87)
259 (61.23)
Scientific, Geographical, Cultural, Historical, Engineering & Entertainment-based Educational programmes/ Quiz shows
31 (23.14)
30 (34.88)
61 (27.72)
8 (7.28)
33 (35.49)
40 (19.72)
39 (15.99)
63 (35.21)
102 (24.11)
Doordarshan’s programmes
5 (3.73) 1 (1.16)
6 (2.73)
4 (3.64)
-- 4 (1.97)
9 (3.69)
1 (0.56)
10 (2.36)
Local/Regional programmes
1 (0.75) 1 (1.16)
2 (0.91)
-- 1 (1.08) 1 (0.49)
1 (0.41)
2 (1.12)
3 (0.71)
Business programmes
-- 2 (2.32)
2 (0.9) -- -- -- -- 2 (1.12)
2 (0.48)
Source: Field Survey conducted during 14 February 2011 – 29 February 2012 The table reveals that over three fifths of the students (61.23%) view IGNOU programmes, subsequently followed by scientific, geographical, cultural, historical, engineering & entertainment-based educational programmes/ quiz shows (24.11%) and UGC programmes (14.18%). The rural students (65.16%) view IGNOU programmes more than urban students (55.87%) because urban students view scientific, geographical, cultural, historical, engineering & entertainment-based educational programmes/ quiz shows. Thus, majority of the students, irrespective of their categories of genders and residences view IGNOU programmes because Indira Gandhi National Open University (IGNOU) is specialised in distance education in India through educational television programmes which are based on supplementary and text-book based. Types of Problem Faced by Students There are found five types of educational television problems among the students which include use of English makes it difficult to follow contents, clarification of doubts after viewing a programme which is not available, not enough coverage of subject of one’s choice, insufficient details to understand a topic and difficult to search educational television channels on a dish TV remote. Thus the following table shows their distribution patterns among the students.

232
Table 8.15 Types of Educational Television Problems among the Students by Gender and Residence
(Percentage in Parentheses) Types of Educational Television Problems
No. of Students (%) Grand Total (%) Male (%) Female (%)
Rural N=134
Urban N=86
Total N=220
Rural N=110
Urban N=93
Total N=203
Rural N=244
Urban N=179
Total N=423
Use of English makes it difficult to follow contents
9 (6.72) 8 (9.3) 17 (7.73)
10 (9.09)
19 (20.43)
29 (14.29)
19 (7.79)
27 (15.08)
46 (10.87)
Clarification of doubts after viewing a programme is not available
66 (49.25)
49 (56.98)
115 (52.27)
45 (40.91)
45 (48.39)
90 (44.33)
111 (45.49)
94 (52.51)
205 (48.46)
Not enough coverage of subject of one’s choice
38 (28.36)
20 (23.26)
58 (26.36)
37 (33.64)
23 (24.73)
60 (29.56)
75 (30.74)
43 (24.02)
118 (27.9)
Insufficient details to understand a topic
27 (20.15)
12 (13.95)
39 (17.73)
21 (19.09)
11 (11.83)
32 (15.76)
48 (19.67)
23 (12.85)
71 (16.78)
Difficult to search educational television channels on a dish TV remote
5 (3.73) 3 (3.49) 8 (3.64)
8 (7.27)
1 (1.08) 9 (4.43)
13 (5.33)
4 (2.23) 17 (4.02)
Source: Field Survey Conducted during 14 February 2011 – 29 February 2012 The table exhibits that nearabout a half of the students (48.46%) face clarification of doubts after viewing a programme which is not available, over one fourth (27.9%) face the problem of not enough coverage of subject of one’s choice, over one tenth (16.78%) face insufficient details to understand a topic, one tenth (10.87%) face using English making it difficult to follow contents and the rest face difficulty to search educational television channels on a dish TV remote. Clarification of doubts after viewing a programme is not available because once the students view programmes, unable to interact with teachers and instructors who are on TV shows.
In sum, the students know the source of telecast schedule of programmes from television transmission, prefer to view TV programmes in English and follow it as medium of instruction, view programmes related to one’s subject, watch Discovery Channel once a week, view supplementary programmes on discussion and face clarification of doubts after viewing programmes.
III THE ATTITUDE PATTERNS OF SATELLITE/ DISH TV IN EDUCATION The students vary in their attitude towards satellite/ dish or cable TV. They generally
have a positive attitude towards satellite/ dish TV or cable television channel and consider it as a means for increasing knowledge and education alongwith recreation or time-passing. The general views of the respondents about satellite/ dish TV are shown in the section as follows. Extent of Satellite/ Dish TV Likeness
The extent of satellite/ dish TV likeness is categorized into four categories showing particularly the three levels of extent about expressing likeness such as low, medium and high
233
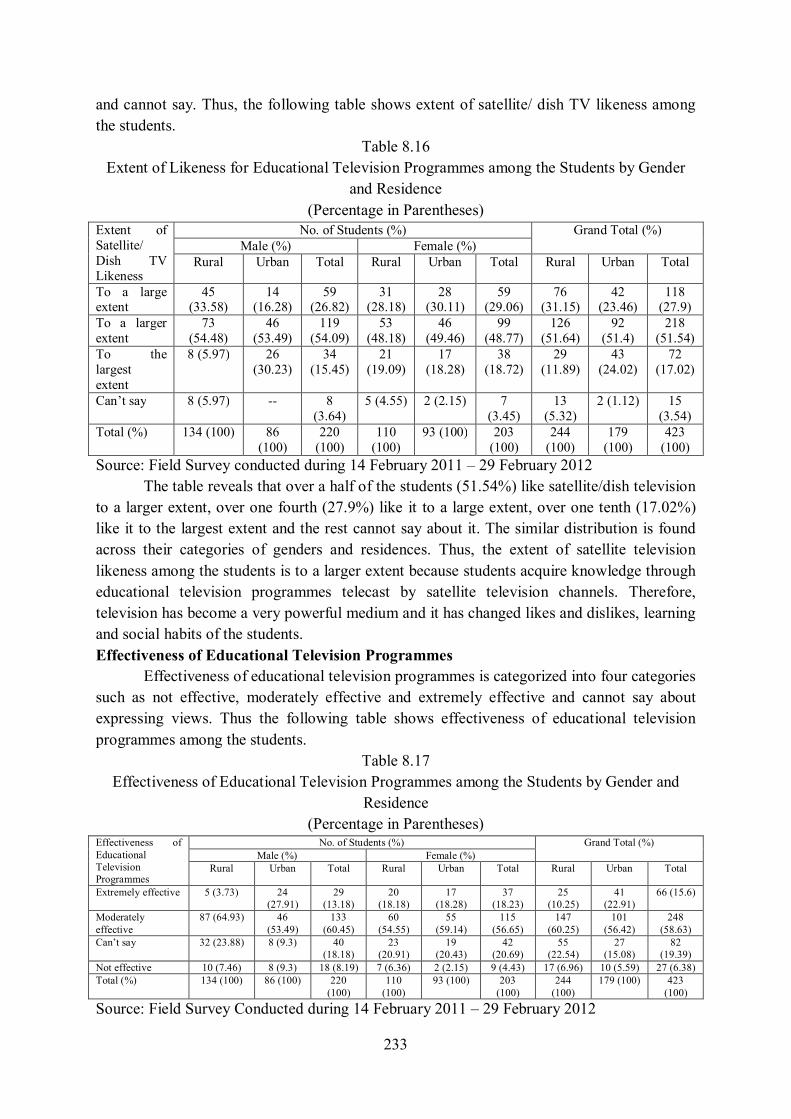
and cannot say. Thus, the following table shows extent of satellite/ dish TV likeness among the students.
Table 8.16 Extent of Likeness for Educational Television Programmes among the Students by Gender
and Residence (Percentage in Parentheses)
Extent of Satellite/ Dish TV Likeness
No. of Students (%) Grand Total (%) Male (%) Female (%)
Rural Urban Total Rural Urban Total Rural Urban Total
To a large extent
45 (33.58)
14 (16.28)
59 (26.82)
31 (28.18)
28 (30.11)
59 (29.06)
76 (31.15)
42 (23.46)
118 (27.9)
To a larger extent
73 (54.48)
46 (53.49)
119 (54.09)
53 (48.18)
46 (49.46)
99 (48.77)
126 (51.64)
92 (51.4)
218 (51.54)
To the largest extent
8 (5.97) 26 (30.23)
34 (15.45)
21 (19.09)
17 (18.28)
38 (18.72)
29 (11.89)
43 (24.02)
72 (17.02)
Can’t say 8 (5.97) -- 8 (3.64)
5 (4.55) 2 (2.15) 7 (3.45)
13 (5.32)
2 (1.12) 15 (3.54)
Total (%) 134 (100) 86 (100)
220 (100)
110 (100)
93 (100) 203 (100)
244 (100)
179 (100)
423 (100)
Source: Field Survey conducted during 14 February 2011 – 29 February 2012 The table reveals that over a half of the students (51.54%) like satellite/dish television to a larger extent, over one fourth (27.9%) like it to a large extent, over one tenth (17.02%) like it to the largest extent and the rest cannot say about it. The similar distribution is found across their categories of genders and residences. Thus, the extent of satellite television likeness among the students is to a larger extent because students acquire knowledge through educational television programmes telecast by satellite television channels. Therefore, television has become a very powerful medium and it has changed likes and dislikes, learning and social habits of the students. Effectiveness of Educational Television Programmes
Effectiveness of educational television programmes is categorized into four categories such as not effective, moderately effective and extremely effective and cannot say about expressing views. Thus the following table shows effectiveness of educational television programmes among the students.
Table 8.17 Effectiveness of Educational Television Programmes among the Students by Gender and
Residence (Percentage in Parentheses)
Effectiveness of Educational Television Programmes
No. of Students (%) Grand Total (%) Male (%) Female (%)
Rural Urban Total Rural Urban Total Rural Urban Total
Extremely effective 5 (3.73) 24 (27.91)
29 (13.18)
20 (18.18)
17 (18.28)
37 (18.23)
25 (10.25)
41 (22.91)
66 (15.6)
Moderately effective
87 (64.93) 46 (53.49)
133 (60.45)
60 (54.55)
55 (59.14)
115 (56.65)
147 (60.25)
101 (56.42)
248 (58.63)
Can’t say 32 (23.88) 8 (9.3) 40 (18.18)
23 (20.91)
19 (20.43)
42 (20.69)
55 (22.54)
27 (15.08)
82 (19.39)
Not effective 10 (7.46) 8 (9.3) 18 (8.19) 7 (6.36) 2 (2.15) 9 (4.43) 17 (6.96) 10 (5.59) 27 (6.38) Total (%) 134 (100) 86 (100) 220
(100) 110
(100) 93 (100) 203
(100) 244
(100) 179 (100) 423
(100)
Source: Field Survey Conducted during 14 February 2011 – 29 February 2012
234
The table shows that satellite TV is moderately effective in education among nearly three fifths of the students (58.63%), subsequently followed by cannot say (19.39%) and extremely effective (15.6%). It is moderately effective among the rural students than urban students because rural students find interesting to view educational programmes on satellite TV but urban students use Internet for study purpose. Similarly, it is moderately effective among males than females due to the fact that females watch entertainment women’s programmes on TV. It is extremely not effective because there is no direct contact among the students and instructors of educational television programmes due to which they find problems in understanding contents of these programmes. Level of Comfortability with Satellite/ Dish TV
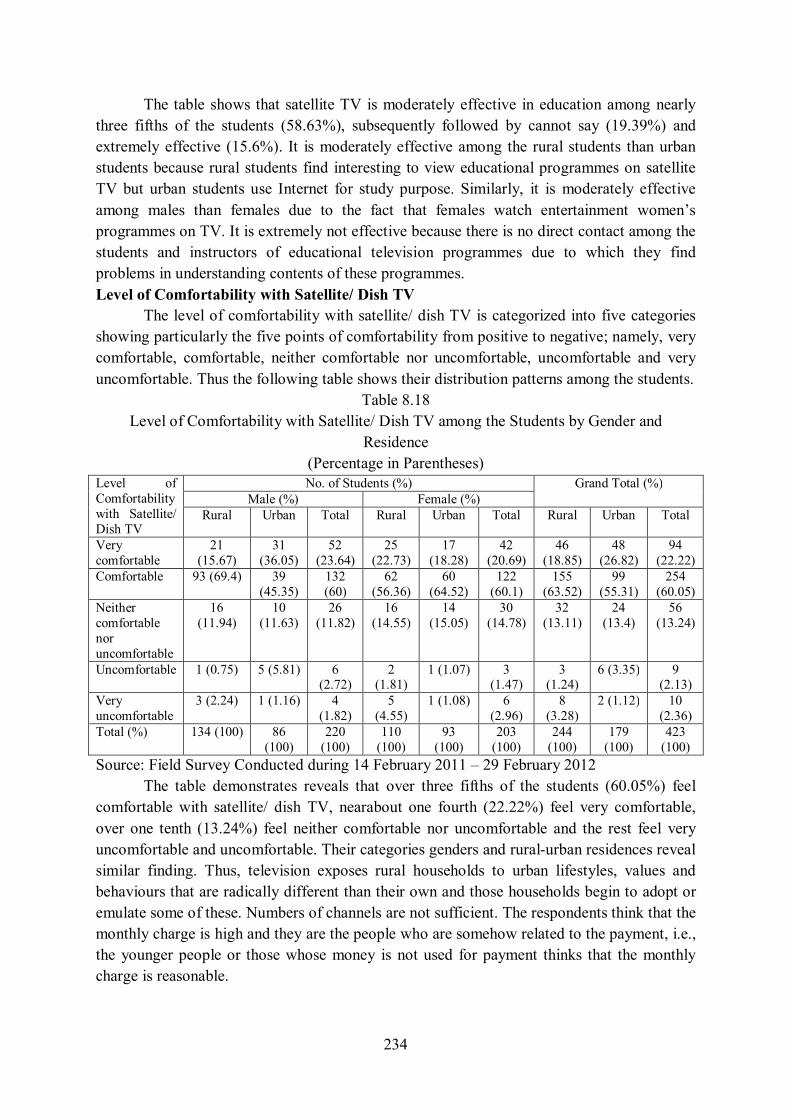
The level of comfortability with satellite/ dish TV is categorized into five categories showing particularly the five points of comfortability from positive to negative; namely, very comfortable, comfortable, neither comfortable nor uncomfortable, uncomfortable and very uncomfortable. Thus the following table shows their distribution patterns among the students.
Table 8.18 Level of Comfortability with Satellite/ Dish TV among the Students by Gender and
Residence (Percentage in Parentheses)
Level of Comfortability with Satellite/ Dish TV
No. of Students (%) Grand Total (%) Male (%) Female (%)
Rural Urban Total Rural Urban Total Rural Urban Total
Very comfortable
21 (15.67)
31 (36.05)
52 (23.64)
25 (22.73)
17 (18.28)
42 (20.69)
46 (18.85)
48 (26.82)
94 (22.22)
Comfortable 93 (69.4) 39 (45.35)
132 (60)
62 (56.36)
60 (64.52)
122 (60.1)
155 (63.52)
99 (55.31)
254 (60.05)
Neither comfortable nor uncomfortable
16 (11.94)
10 (11.63)
26 (11.82)
16 (14.55)
14 (15.05)
30 (14.78)
32 (13.11)
24 (13.4)
56 (13.24)
Uncomfortable 1 (0.75) 5 (5.81) 6 (2.72)
2 (1.81)
1 (1.07) 3 (1.47)
3 (1.24)
6 (3.35) 9 (2.13)
Very uncomfortable
3 (2.24) 1 (1.16) 4 (1.82)
5 (4.55)
1 (1.08) 6 (2.96)
8 (3.28)
2 (1.12) 10 (2.36)
Total (%) 134 (100) 86 (100)
220 (100)
110 (100)
93 (100)
203 (100)
244 (100)
179 (100)
423 (100)
Source: Field Survey Conducted during 14 February 2011 – 29 February 2012 The table demonstrates reveals that over three fifths of the students (60.05%) feel comfortable with satellite/ dish TV, nearabout one fourth (22.22%) feel very comfortable, over one tenth (13.24%) feel neither comfortable nor uncomfortable and the rest feel very uncomfortable and uncomfortable. Their categories genders and rural-urban residences reveal similar finding. Thus, television exposes rural households to urban lifestyles, values and behaviours that are radically different than their own and those households begin to adopt or emulate some of these. Numbers of channels are not sufficient. The respondents think that the monthly charge is high and they are the people who are somehow related to the payment, i.e., the younger people or those whose money is not used for payment thinks that the monthly charge is reasonable.
235
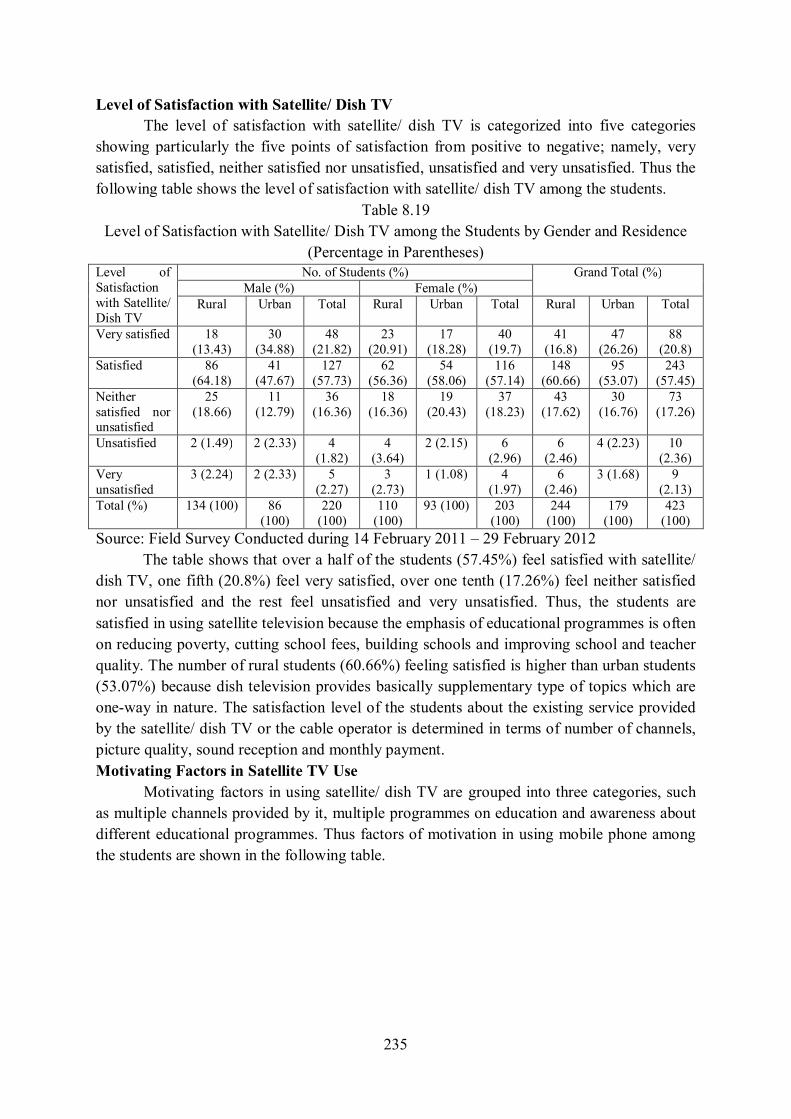
Level of Satisfaction with Satellite/ Dish TV The level of satisfaction with satellite/ dish TV is categorized into five categories
showing particularly the five points of satisfaction from positive to negative; namely, very satisfied, satisfied, neither satisfied nor unsatisfied, unsatisfied and very unsatisfied. Thus the following table shows the level of satisfaction with satellite/ dish TV among the students.
Table 8.19 Level of Satisfaction with Satellite/ Dish TV among the Students by Gender and Residence
(Percentage in Parentheses) Level of Satisfaction with Satellite/ Dish TV
No. of Students (%) Grand Total (%) Male (%) Female (%)
Rural Urban Total Rural Urban Total Rural Urban Total
Very satisfied 18 (13.43)
30 (34.88)
48 (21.82)
23 (20.91)
17 (18.28)
40 (19.7)
41 (16.8)
47 (26.26)
88 (20.8)
Satisfied 86 (64.18)
41 (47.67)
127 (57.73)
62 (56.36)
54 (58.06)
116 (57.14)
148 (60.66)
95 (53.07)
243 (57.45)
Neither satisfied nor unsatisfied
25 (18.66)
11 (12.79)
36 (16.36)
18 (16.36)
19 (20.43)
37 (18.23)
43 (17.62)
30 (16.76)
73 (17.26)
Unsatisfied 2 (1.49) 2 (2.33) 4 (1.82)
4 (3.64)
2 (2.15) 6 (2.96)
6 (2.46)
4 (2.23) 10 (2.36)
Very unsatisfied
3 (2.24) 2 (2.33) 5 (2.27)
3 (2.73)
1 (1.08) 4 (1.97)
6 (2.46)
3 (1.68) 9 (2.13)
Total (%) 134 (100) 86 (100)
220 (100)
110 (100)
93 (100) 203 (100)
244 (100)
179 (100)
423 (100)
Source: Field Survey Conducted during 14 February 2011 – 29 February 2012 The table shows that over a half of the students (57.45%) feel satisfied with satellite/ dish TV, one fifth (20.8%) feel very satisfied, over one tenth (17.26%) feel neither satisfied nor unsatisfied and the rest feel unsatisfied and very unsatisfied. Thus, the students are satisfied in using satellite television because the emphasis of educational programmes is often on reducing poverty, cutting school fees, building schools and improving school and teacher quality. The number of rural students (60.66%) feeling satisfied is higher than urban students (53.07%) because dish television provides basically supplementary type of topics which are one-way in nature. The satisfaction level of the students about the existing service provided by the satellite/ dish TV or the cable operator is determined in terms of number of channels, picture quality, sound reception and monthly payment. Motivating Factors in Satellite TV Use
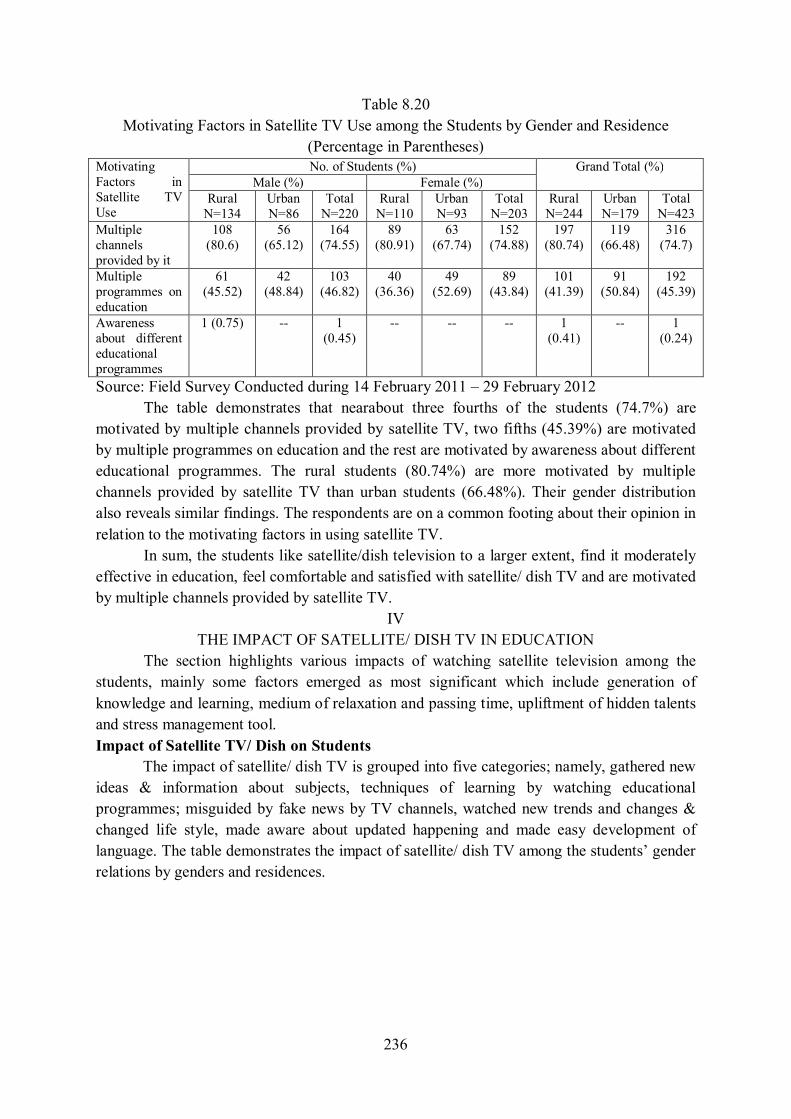
Motivating factors in using satellite/ dish TV are grouped into three categories, such as multiple channels provided by it, multiple programmes on education and awareness about different educational programmes. Thus factors of motivation in using mobile phone among the students are shown in the following table.
236
Table 8.20 Motivating Factors in Satellite TV Use among the Students by Gender and Residence
(Percentage in Parentheses) Motivating Factors in Satellite TV Use
No. of Students (%) Grand Total (%) Male (%) Female (%)
Rural N=134
Urban N=86
Total N=220
Rural N=110
Urban N=93
Total N=203
Rural N=244
Urban N=179
Total N=423
Multiple channels provided by it
108 (80.6)
56 (65.12)
164 (74.55)
89 (80.91)
63 (67.74)
152 (74.88)
197 (80.74)
119 (66.48)
316 (74.7)
Multiple programmes on education
61 (45.52)
42 (48.84)
103 (46.82)
40 (36.36)
49 (52.69)
89 (43.84)
101 (41.39)
91 (50.84)
192 (45.39)
Awareness about different educational programmes
1 (0.75) -- 1 (0.45)
-- -- -- 1 (0.41)
-- 1 (0.24)
Source: Field Survey Conducted during 14 February 2011 – 29 February 2012 The table demonstrates that nearabout three fourths of the students (74.7%) are
motivated by multiple channels provided by satellite TV, two fifths (45.39%) are motivated by multiple programmes on education and the rest are motivated by awareness about different educational programmes. The rural students (80.74%) are more motivated by multiple channels provided by satellite TV than urban students (66.48%). Their gender distribution also reveals similar findings. The respondents are on a common footing about their opinion in relation to the motivating factors in using satellite TV.
In sum, the students like satellite/dish television to a larger extent, find it moderately effective in education, feel comfortable and satisfied with satellite/ dish TV and are motivated by multiple channels provided by satellite TV.
IV THE IMPACT OF SATELLITE/ DISH TV IN EDUCATION
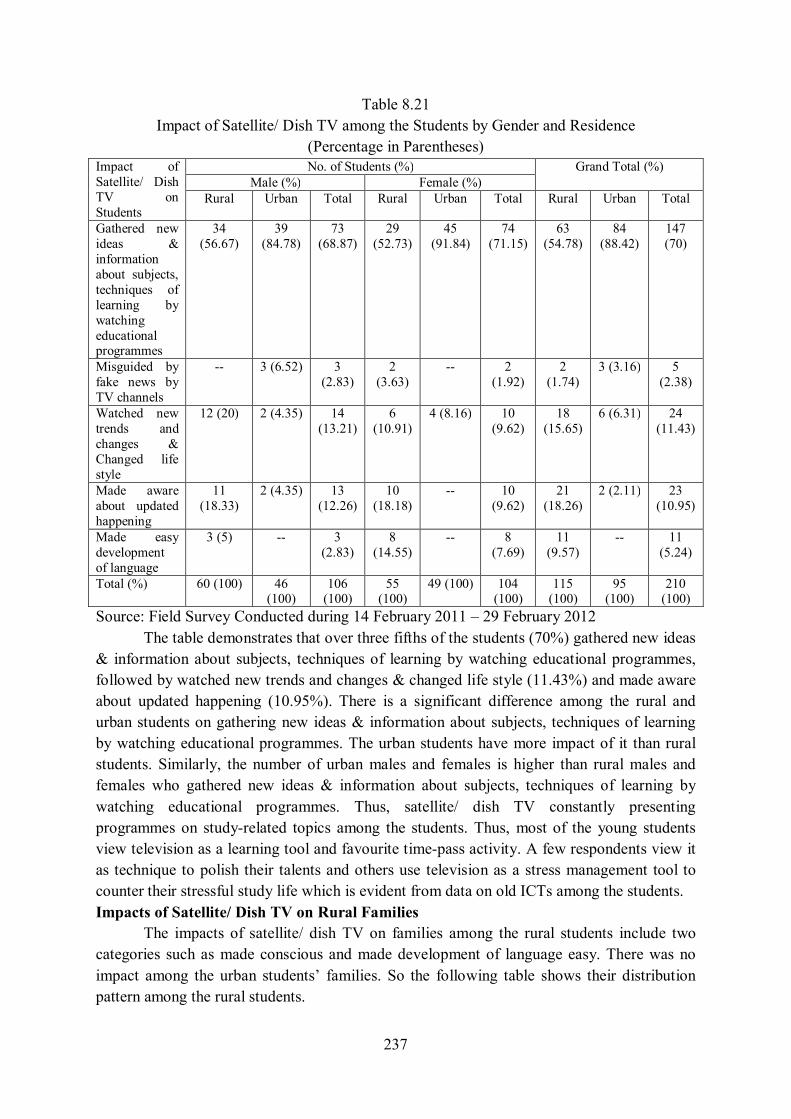
The section highlights various impacts of watching satellite television among the students, mainly some factors emerged as most significant which include generation of knowledge and learning, medium of relaxation and passing time, upliftment of hidden talents and stress management tool. Impact of Satellite TV/ Dish on Students The impact of satellite/ dish TV is grouped into five categories; namely, gathered new ideas & information about subjects, techniques of learning by watching educational programmes; misguided by fake news by TV channels, watched new trends and changes & changed life style, made aware about updated happening and made easy development of language. The table demonstrates the impact of satellite/ dish TV among the students’ gender relations by genders and residences.
237
Table 8.21 Impact of Satellite/ Dish TV among the Students by Gender and Residence
(Percentage in Parentheses) Impact of Satellite/ Dish TV on Students
No. of Students (%) Grand Total (%) Male (%) Female (%)
Rural Urban Total Rural Urban Total Rural Urban Total
Gathered new ideas & information about subjects, techniques of learning by watching educational programmes
34 (56.67)
39 (84.78)
73 (68.87)
29 (52.73)
45 (91.84)
74 (71.15)
63 (54.78)
84 (88.42)
147 (70)
Misguided by fake news by TV channels
-- 3 (6.52) 3 (2.83)
2 (3.63)
-- 2 (1.92)
2 (1.74)
3 (3.16) 5 (2.38)
Watched new trends and changes & Changed life style
12 (20) 2 (4.35) 14 (13.21)
6 (10.91)
4 (8.16) 10 (9.62)
18 (15.65)
6 (6.31) 24 (11.43)
Made aware about updated happening
11 (18.33)
2 (4.35) 13 (12.26)
10 (18.18)
-- 10 (9.62)
21 (18.26)
2 (2.11) 23 (10.95)
Made easy development of language
3 (5) -- 3 (2.83)
8 (14.55)
-- 8 (7.69)
11 (9.57)
-- 11 (5.24)
Total (%) 60 (100) 46 (100)
106 (100)
55 (100)
49 (100) 104 (100)
115 (100)
95 (100)
210 (100)
Source: Field Survey Conducted during 14 February 2011 – 29 February 2012 The table demonstrates that over three fifths of the students (70%) gathered new ideas & information about subjects, techniques of learning by watching educational programmes, followed by watched new trends and changes & changed life style (11.43%) and made aware about updated happening (10.95%). There is a significant difference among the rural and urban students on gathering new ideas & information about subjects, techniques of learning by watching educational programmes. The urban students have more impact of it than rural students. Similarly, the number of urban males and females is higher than rural males and females who gathered new ideas & information about subjects, techniques of learning by watching educational programmes. Thus, satellite/ dish TV constantly presenting programmes on study-related topics among the students. Thus, most of the young students view television as a learning tool and favourite time-pass activity. A few respondents view it as technique to polish their talents and others use television as a stress management tool to counter their stressful study life which is evident from data on old ICTs among the students. Impacts of Satellite/ Dish TV on Rural Families
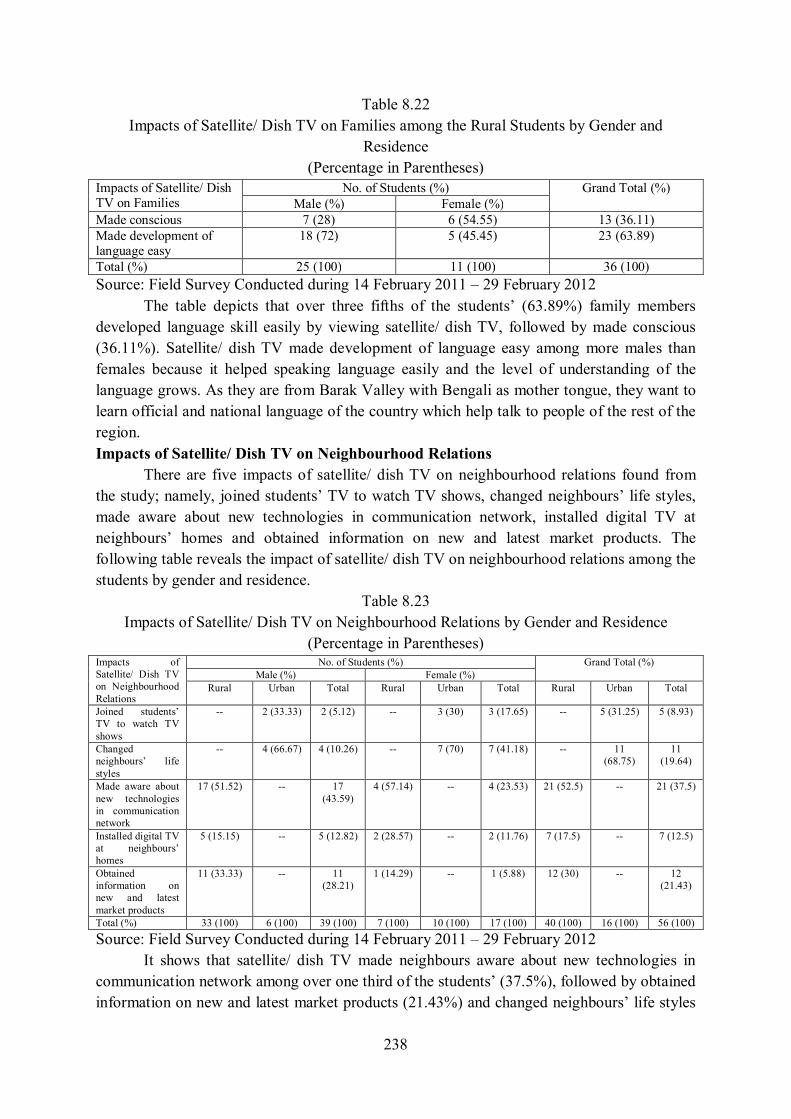
The impacts of satellite/ dish TV on families among the rural students include two categories such as made conscious and made development of language easy. There was no impact among the urban students’ families. So the following table shows their distribution pattern among the rural students.
238
Table 8.22 Impacts of Satellite/ Dish TV on Families among the Rural Students by Gender and
Residence (Percentage in Parentheses)
Impacts of Satellite/ Dish TV on Families
No. of Students (%) Grand Total (%) Male (%) Female (%)
Made conscious 7 (28) 6 (54.55) 13 (36.11) Made development of language easy
18 (72) 5 (45.45) 23 (63.89)
Total (%) 25 (100) 11 (100) 36 (100) Source: Field Survey Conducted during 14 February 2011 – 29 February 2012 The table depicts that over three fifths of the students’ (63.89%) family members developed language skill easily by viewing satellite/ dish TV, followed by made conscious (36.11%). Satellite/ dish TV made development of language easy among more males than females because it helped speaking language easily and the level of understanding of the language grows. As they are from Barak Valley with Bengali as mother tongue, they want to learn official and national language of the country which help talk to people of the rest of the region. Impacts of Satellite/ Dish TV on Neighbourhood Relations
There are five impacts of satellite/ dish TV on neighbourhood relations found from the study; namely, joined students’ TV to watch TV shows, changed neighbours’ life styles, made aware about new technologies in communication network, installed digital TV at neighbours’ homes and obtained information on new and latest market products. The following table reveals the impact of satellite/ dish TV on neighbourhood relations among the students by gender and residence.
Table 8.23 Impacts of Satellite/ Dish TV on Neighbourhood Relations by Gender and Residence
(Percentage in Parentheses) Impacts of Satellite/ Dish TV on Neighbourhood Relations
No. of Students (%) Grand Total (%) Male (%) Female (%)
Rural Urban Total Rural Urban Total Rural Urban Total
Joined students’ TV to watch TV shows
-- 2 (33.33) 2 (5.12) -- 3 (30) 3 (17.65) -- 5 (31.25) 5 (8.93)
Changed neighbours’ life styles
-- 4 (66.67) 4 (10.26) -- 7 (70) 7 (41.18) -- 11 (68.75)
11 (19.64)
Made aware about new technologies in communication network
17 (51.52) -- 17 (43.59)
4 (57.14) -- 4 (23.53) 21 (52.5) -- 21 (37.5)
Installed digital TV at neighbours’ homes
5 (15.15) -- 5 (12.82) 2 (28.57) -- 2 (11.76) 7 (17.5) -- 7 (12.5)
Obtained information on new and latest market products
11 (33.33) -- 11 (28.21)
1 (14.29) -- 1 (5.88) 12 (30) -- 12 (21.43)
Total (%) 33 (100) 6 (100) 39 (100) 7 (100) 10 (100) 17 (100) 40 (100) 16 (100) 56 (100)
Source: Field Survey Conducted during 14 February 2011 – 29 February 2012 It shows that satellite/ dish TV made neighbours aware about new technologies in
communication network among over one third of the students’ (37.5%), followed by obtained information on new and latest market products (21.43%) and changed neighbours’ life styles
239
(19.64%). Satellite/ dish TV made neighbours aware about new technologies in communication network among the urban students (68.75%) more than the rural students. The males’ (43.59%) neighbours are made aware about new technologies in communication network but females’ (41.18%) neighbours changed life styles. Television viewing is seen as a major source of stress relieving activity. Primarily, the satellite/dish television evolved as a medium of entertainment and hence, the students watch television for learning. Majority of the students watch television for pleasure-seeking and TV viewing is one of the most common leisure activities among them. Impacts of Satellite/ Dish TV on Gender Relations
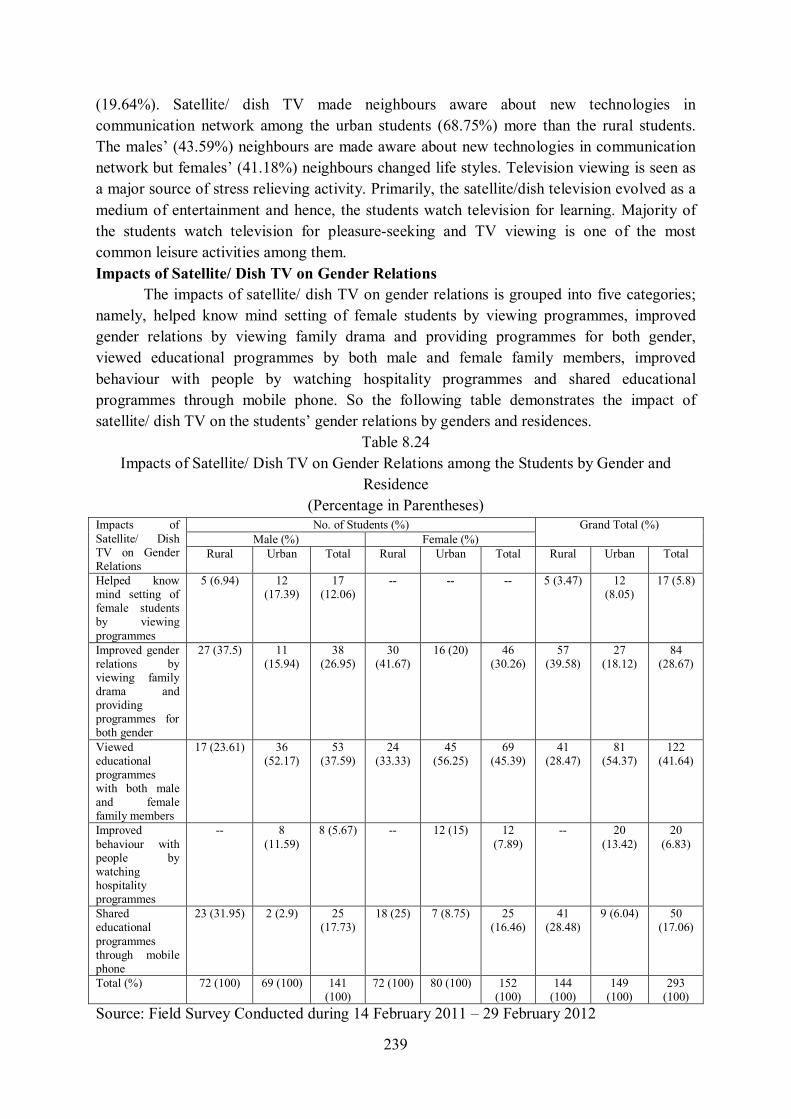
The impacts of satellite/ dish TV on gender relations is grouped into five categories; namely, helped know mind setting of female students by viewing programmes, improved gender relations by viewing family drama and providing programmes for both gender, viewed educational programmes by both male and female family members, improved behaviour with people by watching hospitality programmes and shared educational programmes through mobile phone. So the following table demonstrates the impact of satellite/ dish TV on the students’ gender relations by genders and residences.
Table 8.24 Impacts of Satellite/ Dish TV on Gender Relations among the Students by Gender and
Residence (Percentage in Parentheses)
Impacts of Satellite/ Dish TV on Gender Relations
No. of Students (%) Grand Total (%) Male (%) Female (%)
Rural Urban Total Rural Urban Total Rural Urban Total
Helped know mind setting of female students by viewing programmes
5 (6.94) 12 (17.39)
17 (12.06)
-- -- -- 5 (3.47) 12 (8.05)
17 (5.8)
Improved gender relations by viewing family drama and providing programmes for both gender
27 (37.5) 11 (15.94)
38 (26.95)
30 (41.67)
16 (20) 46 (30.26)
57 (39.58)
27 (18.12)
84 (28.67)
Viewed educational programmes with both male and female family members
17 (23.61) 36 (52.17)
53 (37.59)
24 (33.33)
45 (56.25)
69 (45.39)
41 (28.47)
81 (54.37)
122 (41.64)
Improved behaviour with people by watching hospitality programmes
-- 8 (11.59)
8 (5.67) -- 12 (15) 12 (7.89)
-- 20 (13.42)
20 (6.83)
Shared educational programmes through mobile phone
23 (31.95) 2 (2.9) 25 (17.73)
18 (25) 7 (8.75) 25 (16.46)
41 (28.48)
9 (6.04) 50 (17.06)
Total (%) 72 (100) 69 (100) 141 (100)
72 (100) 80 (100) 152 (100)
144 (100)
149 (100)
293 (100)
Source: Field Survey Conducted during 14 February 2011 – 29 February 2012
240
The table depicts that over two fifths of the students (41.64%) viewed educational programmes with both male and female family members in their families, followed by improved gender relations by viewing family drama and providing programmes for both gender (28.67%) and shared educational programmes through mobile phone (17.06%). By and large, similar finding is found across their categories of genders and residences. Usefulness of Satellite/ Dish TV in Education
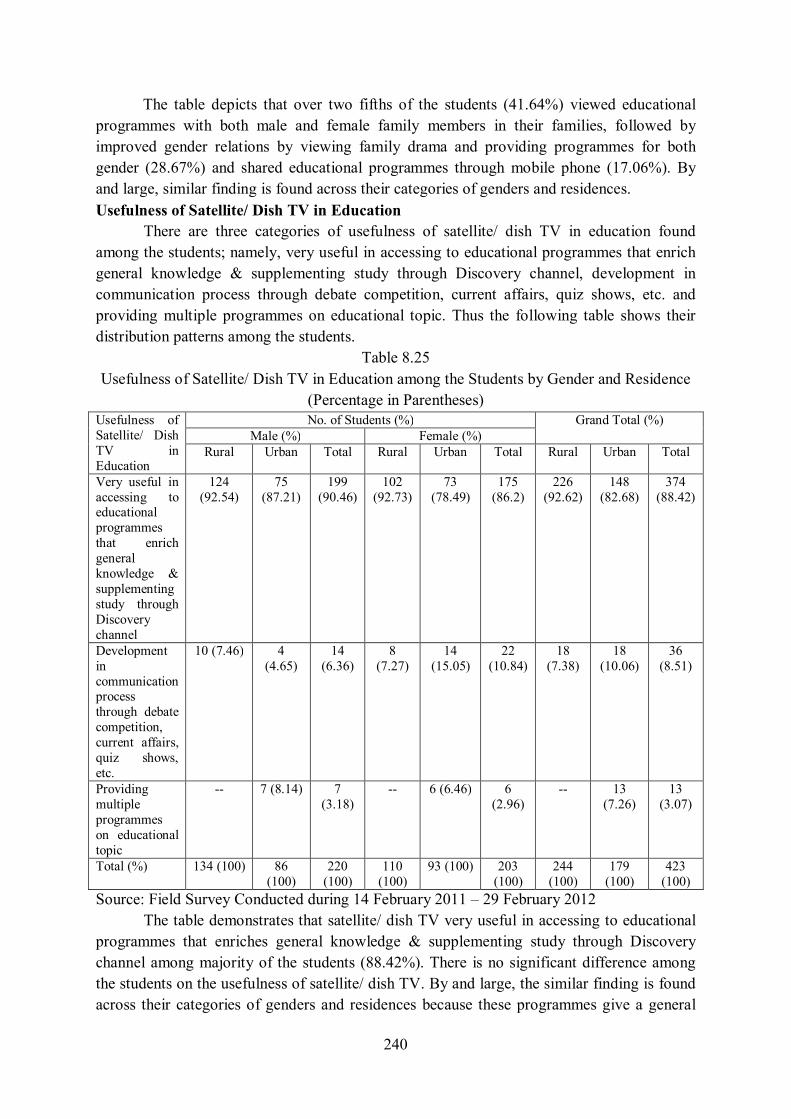
There are three categories of usefulness of satellite/ dish TV in education found among the students; namely, very useful in accessing to educational programmes that enrich general knowledge & supplementing study through Discovery channel, development in communication process through debate competition, current affairs, quiz shows, etc. and providing multiple programmes on educational topic. Thus the following table shows their distribution patterns among the students.
Table 8.25 Usefulness of Satellite/ Dish TV in Education among the Students by Gender and Residence
(Percentage in Parentheses) Usefulness of Satellite/ Dish TV in Education
No. of Students (%) Grand Total (%) Male (%) Female (%)
Rural Urban Total Rural Urban Total Rural Urban Total
Very useful in accessing to educational programmes that enrich general knowledge & supplementing study through Discovery channel
124 (92.54)
75 (87.21)
199 (90.46)
102 (92.73)
73 (78.49)
175 (86.2)
226 (92.62)
148 (82.68)
374 (88.42)
Development in communication process through debate competition, current affairs, quiz shows, etc.
10 (7.46) 4 (4.65)
14 (6.36)
8 (7.27)
14 (15.05)
22 (10.84)
18 (7.38)
18 (10.06)
36 (8.51)
Providing multiple programmes on educational topic
-- 7 (8.14) 7 (3.18)
-- 6 (6.46) 6 (2.96)
-- 13 (7.26)
13 (3.07)
Total (%) 134 (100) 86 (100)
220 (100)
110 (100)
93 (100) 203 (100)
244 (100)
179 (100)
423 (100)
Source: Field Survey Conducted during 14 February 2011 – 29 February 2012 The table demonstrates that satellite/ dish TV very useful in accessing to educational programmes that enriches general knowledge & supplementing study through Discovery channel among majority of the students (88.42%). There is no significant difference among the students on the usefulness of satellite/ dish TV. By and large, the similar finding is found across their categories of genders and residences because these programmes give a general
241
understanding of topics of study to the students. Doordarshan’s channels provide limited number of educational programmes but satellite television provides multiple TV channels and the students find options to choose a particular topic on the basis of their class-routine and manage time to view programmes. Views for Increasing Satellite/ Dish TV Uses
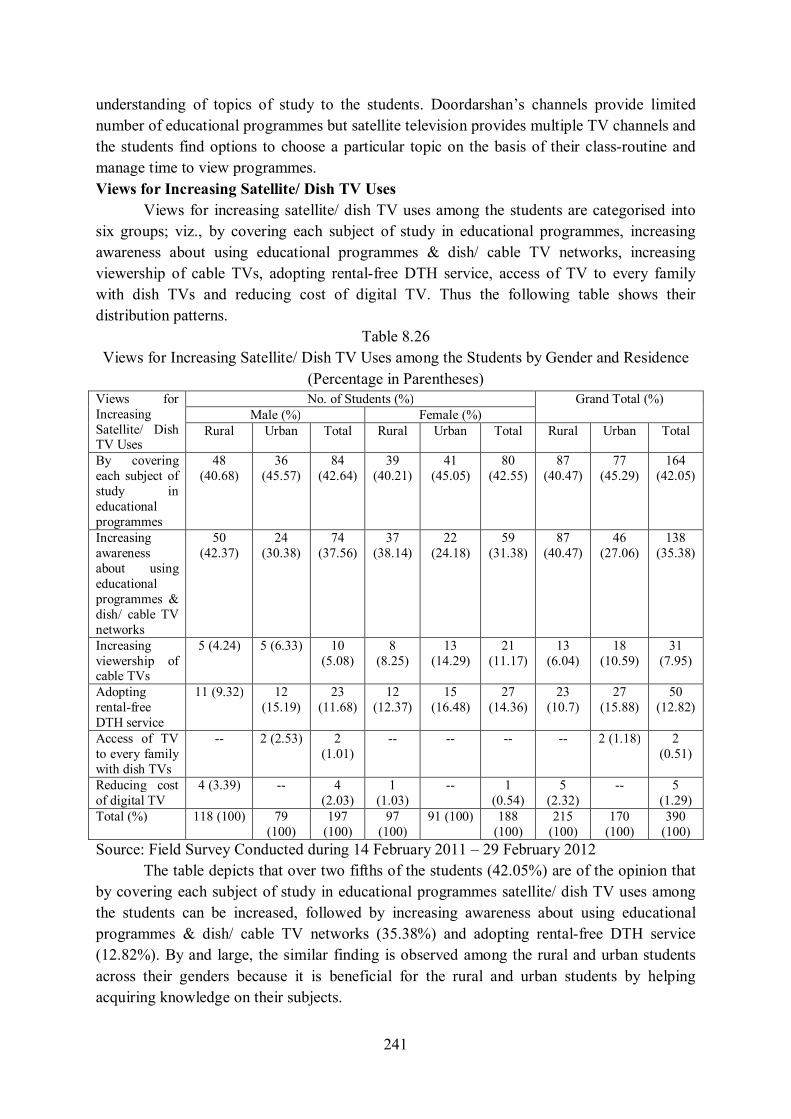
Views for increasing satellite/ dish TV uses among the students are categorised into six groups; viz., by covering each subject of study in educational programmes, increasing awareness about using educational programmes & dish/ cable TV networks, increasing viewership of cable TVs, adopting rental-free DTH service, access of TV to every family with dish TVs and reducing cost of digital TV. Thus the following table shows their distribution patterns.
Table 8.26 Views for Increasing Satellite/ Dish TV Uses among the Students by Gender and Residence
(Percentage in Parentheses) Views for Increasing Satellite/ Dish TV Uses
No. of Students (%) Grand Total (%) Male (%) Female (%)
Rural Urban Total Rural Urban Total Rural Urban Total
By covering each subject of study in educational programmes
48 (40.68)
36 (45.57)
84 (42.64)
39 (40.21)
41 (45.05)
80 (42.55)
87 (40.47)
77 (45.29)
164 (42.05)
Increasing awareness about using educational programmes & dish/ cable TV networks
50 (42.37)
24 (30.38)
74 (37.56)
37 (38.14)
22 (24.18)
59 (31.38)
87 (40.47)
46 (27.06)
138 (35.38)
Increasing viewership of cable TVs
5 (4.24) 5 (6.33) 10 (5.08)
8 (8.25)
13 (14.29)
21 (11.17)
13 (6.04)
18 (10.59)
31 (7.95)
Adopting rental-free DTH service
11 (9.32) 12 (15.19)
23 (11.68)
12 (12.37)
15 (16.48)
27 (14.36)
23 (10.7)
27 (15.88)
50 (12.82)
Access of TV to every family with dish TVs
-- 2 (2.53) 2 (1.01)
-- -- -- -- 2 (1.18) 2 (0.51)
Reducing cost of digital TV
4 (3.39) -- 4 (2.03)
1 (1.03)
-- 1 (0.54)
5 (2.32)
-- 5 (1.29)
Total (%) 118 (100) 79 (100)
197 (100)
97 (100)
91 (100) 188 (100)
215 (100)
170 (100)
390 (100)
Source: Field Survey Conducted during 14 February 2011 – 29 February 2012 The table depicts that over two fifths of the students (42.05%) are of the opinion that
by covering each subject of study in educational programmes satellite/ dish TV uses among the students can be increased, followed by increasing awareness about using educational programmes & dish/ cable TV networks (35.38%) and adopting rental-free DTH service (12.82%). By and large, the similar finding is observed among the rural and urban students across their genders because it is beneficial for the rural and urban students by helping acquiring knowledge on their subjects.
242
In sum, the students gathered new ideas & information about subjects, their family members developed language easily by viewing satellite/ dish TV, neighbours became aware about new technologies in communication network, viewed educational programmes by both male and female family members in families and find satellite/ dish TV very useful in accessing to educational programmes. There are major patterns of satellite television in education among the students found from the study. The major findings of the chapter are summarised on the basis of following major patterns:
1. Nearabout three fifths of the students (59.57%) subscribe dish TV. 2. Over one fourth of the students (28.61%) use AirTel digital TV. 3. Majority of the students (86.76%) know the source of telecast schedule of
programmes from television transmission. 4. Nearabout three fifths of the students (58.63%) prefer to view television programmes
in English. 5. Three fifths of the students (71.36%) view programmes related to one’s subject. 6. Nearabout of the students (30.42%) watch Discovery Channel. 7. Two fifths of the students (40.43%) watch educational television programmes once a
week. 8. Nearabout three fifths of the students (57.45%) watch educational programmes in
English. 9. Over three fifths of the students (71.87%) view supplementary programmes. 10. Three fifths of the students (60.05%) view most discussion. 11. Nearabout a half of the students (48.46%) face clarification of doubts after viewing a
programme is not available. 12. Satellite TV is moderately effective in education among nearly three fifths of the
students (58.63%). 13. Nearabout three fourths of the students (74.7%) are motivated by multiple channels
provided by satellite TV. 14. Over three fifths of the students (70%) gathered new ideas & information about
subjects, techniques of learning by watching educational programmes. 15. Over two fifths of the students (41.64%) viewed educational programmes by both
male and female family members. 16. Satellite/ dish TV very useful in accessing to educational programmes that enrich
general knowledge & supplementing study through Discovery channel majority of the students among majority of the students.
In conclusion, it can be said that satellite TV has also become an important ICT tool for study among students. The Muslim students view educational programmes in English, Hindi and vernacular languages. These programmes supplement their studies. They are also in favour of increasing viewership of such programmes which will increase their knowledge. Different educational programmes such as family serials improve gender relations because of that they are able to share experience with their family members, friends and teachers.