Embed Size (px)
Citation preview

Chapter 8Public Safety:Safer Than Other Places?

Public Safety in Northwest ArkansasA critical dimension of a communityʼs quality of life is public safety - the extent to which residents are protected from significant threats of harm to persons and property. Public safety is achieved through the the services of community members and governmental entities. Neighborhood residents keep an eye on each otherʼs homes and supervise each otherʼs children while police, fire, and emergency medical personnel respond to a variety of emergencies.
It is difficult to underestimate the importance of public safety for shaping the quality of life in local communities. Public safety is a fundamental pre-requisite for creating a healthy community. It fosters a sense of personal security and well-being that, in turn, helps to build community cohesiveness and, eventually, neighborhood stability. A safe, cohesive, and stable community then serves as the foundation for economic development and growth. Given all that public safety makes possible, it is not surprising to find out that when asked to identify the issues most important to them, citizens consistently rank public safety near the top.
0
10
20
30
40
50
60
70
80
Yes No
20002008
Figure 8.1Afraid To Walk Alone At Night Near Home
Sources: Northwest Arkansas Community Survey, 2000; Northwest Arkansas Omnibus Survey, 2008.
Perc
ent o
f NW
Ark
ansa
s Re
side
nts
What People Are Saying About...
Neighborhood Safety
Frequently, rapid changes in a community produce fear and anxiety among residents. Survey data collected by the Community and Family Institute at the University of Arkansas suggest that the dramatic changes occurring in Northwest Arkansas have not produced an atmosphere of insecurity among its residents.
To put it simply: Northwest Arkansas residents feel safer today than they did in the recent past. The percentage of Northwest Arkansans who reported that they would be afraid to walk alone at night near their home actually decreased from 28 percent in 2000 to 22 percent in 2008.
The increased feeling of personal security expressed by those who live in Northwest Arkansas can be contrasted with the most recent Gallup Poll results, which show that Americans have grown steadily more fearful of crime in their neighborhoods since 2001.
★ In 2000, 28 percent of Northwest Arkansas residents reported fear of walking alone at night near their home.
★ By 2008, the percentage of Northwest Arkansans who were fearful of walking alone at night dropped to 22 percent.
“Crime and the fear of crime have permeated the fabric of American life."
Warren E. BurgerChief Justice, U.S. Supreme Court

Crime in Northwest ArkansasThe primary source of crime statistics in the United States is the Federal Bureau of Investigationʼs Uniform Crime Reports. Each year, state and local police agencies tabulate the total number of crimes reported to have occurred in their jurisdictions and pass this information on to the FBI. One of the chief benefits of the UCR program is that it enables local communities to examine crime trends - that is look at the volume of crime over time.
Crime information gathered as part of the UCR program is presented in Figure 8.2 and 8.3. The data are for Part I crimes measured annually by the FBI since 1977.
Figure 8.2 depicts the trend for all Part I crimes combined: murder/non-negligent homicide; forcible rape; aggravated assault; robbery; burglary; larceny; and motor vehicle theft (arson is excluded). Figure 8.3 is limited to Part I property crimes. For each figure, information provided by local police agencies has been aggregated to the county level.
★ Overall, Northwest Arkansas has experienced a slight increase in the volume of serious crime between 1977 and 2005.
★ Since the 1990ʼs, crime rates have undergone a substantial decline in Northwest Arkansas.
★ Crime rates in Washington County have been consistently higher than Arkansas as a whole, as well as the other three Northwest Arkansas counties.
★ Crime rates in Madison County are consistently far below the state average.
★ Most serious crimes involve offenses against property, not persons. Comparing Figure 8.2 and 8.3, one can see that the bulk of all serious crimes known to police consist of burglaries, larcenies, and motor vehicle thefts. Put another way, compared to property
50
107
164
221
278
335
392
449
506
563
620
77 79 81 83 85 87 89 91 93 95 97 99 01 03 05Source: Federal Bureau of InvestigationNote: 1993 Crime Data Unavailable at time of writing.
Tota
l Crim
es p
er 1
0,00
0 Re
side
nts
Figure 8.2Total Crime Index, 1977-2005
Washington Co.Benton Co.
Carroll Co.
Madison Co.
Arkansas
United States
50
100
150
200
250
300
350
400
450
500
550
77 79 81 83 85 87 89 91 93 95 97 99 01 03 05Source: Federal Bureau of InvestigationNote: 1993 Crime Data Unavailable at time of writing.
Prop
erty
Crim
es p
er 1
0,00
0 Re
side
nts
Figure 8.3Property Crime Rates, 1977-2005
Washington Co.
Benton Co.
Carroll Co.
Madison Co.
Arkansas
United States

Indicator in the Spotlight:Violent Crime in Northwest Arkansas
Figure 8.5Violent Crimes per 10,000 Residents
2005
Source: Federal Bureau of Investigation
Despite their rarity, violent crime rates are a particularly important index of public safety and overall quality of life because of the physical, emotional, and financial costs they impose, as well as the level of fear and insecurity they generate among community members.
Figure 8.4 presents composite rates for Part I violent crimes - murder/non-negligent homicide; forcible rape; aggravated assault; and robbery - for each of the four Northwest Arkansas counties for the period 1977 thru 2005.
★ Whereas the violent crime rate for the United States as a whole has been declining since 1991, Northwest Arkansas has experienced a steady increase in the volume of violent crime, going all the way back to 1977.
★ In one recent two-year period, the violent crime rate of Northwest Arkansas exceeded the national average.
★ Violent crime rates in Washington County have been somewhat higher than the other three Northwest Arkansas counties over time. Notably, however, this violent crime gap between Washington County on the one hand, and Benton, Carroll, and Madison Counties on the other, is much smaller than for property crimes.
★ Northwest Arkansas has some of the lowest violent crime rates in the state of Arkansas. As recently as 2005, three of the four NWA counties had violent crime rates significantly lower than the state average.
★ Violent crime rates in Northwest Arkansas are approaching the national average.
Source: Federal Bureau of InvestigationNote: 1993 Crime Data Unavailable at time of writing.
Figure 8.4Violent Crime Rates, 1977-2005
Viol
ent C
rimes
per
10,
000
Resi
dent
s
0
10
20
30
40
50
60
70
80
77 79 81 83 85 87 89 91 93 95 97 99 01 03 05
Washington Co.
Benton Co.
Carroll Co.
Madison Co.
Arkansas
United States
“The real significance of crime is in its being a breach of faith with the community of mankind."
Joseph Conrad

0
15
30
45
60
75
90
105
120
135
150
88 89 90 91 92 93 94 95 96 97 98 99 00 01 02 03 04 05
DUI A
rres
ts p
er 1
0,00
0 Re
side
nts Washington Co.
Benton Co.Carroll Co.
Madison Co.
Arkansas
Source: Federal Bureau of Investigation
Figure 8.7DUI Arrest Rates, 1988-2005
0
7
14
21
28
35
42
49
56
63
70
88 89 90 91 92 93 94 95 96 97 98 99 00 01 02 03 04 05
Drug
Pos
sess
ion
Arre
sts
per 1
0,00
0
Source: Federal Bureau of Investigation
Figure 8.6Drug Possession Arrest Rates, 1988-2005
Washington Co.
Benton Co.
Carroll Co.
Madison Co.
Arkansas
The Intersection of Alcohol, Drugs, and Crime
★ Arrest rates for illegal drug possession have increased steadily between 1988 and 2005. particularly in Washington and Benton Counties.
★ Over time, drug possession arrest rates have been highest in Washington County.
★ Recently, drug arrest rates in Benton County have converged with those in Washington County.
★ Different from the trend in Benton and Washington Counties, drug arrest rates in Carroll and Madison Counties are declining.
★ Overall, Northwest Arkansasʼ arrest rates for driving under the influence of alcohol/drugs have held steady between 1988 and 2005. A closer look, however, reveals some notably divergent patterns. Consider:
1) DUI arrest rates have risen markedly in Washington County.
2) Benton County has witnessed a small increase in DUI arrest rates.
3) Carroll and Madison Counties have experienced steady declines in DUI arrest rates that coincide with an overall decline in DUI arrest rates for the state as a whole.
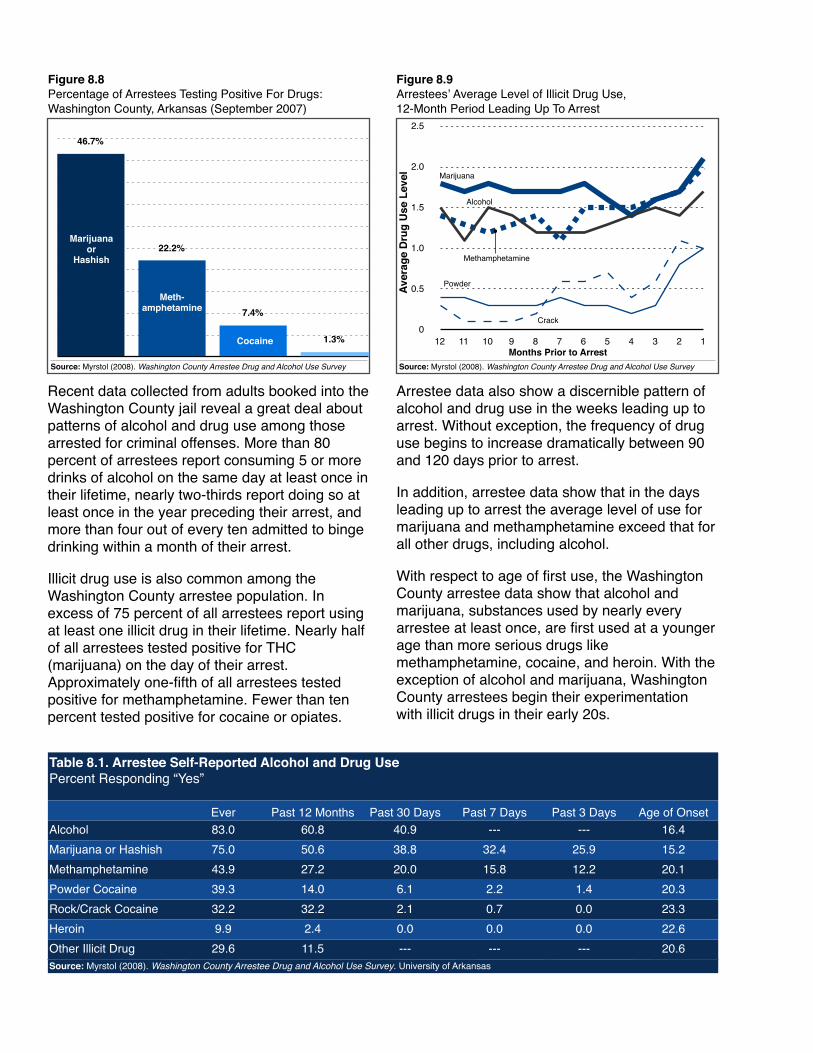
Table 8.1. Arrestee Self-Reported Alcohol and Drug UsePercent Responding “Yes”
Ever Past 12 Months Past 30 Days Past 7 Days Past 3 Days Age of Onset Alcohol 83.0 60.8 40.9 --- --- 16.4Marijuana or Hashish 75.0 50.6 38.8 32.4 25.9 15.2Methamphetamine 43.9 27.2 20.0 15.8 12.2 20.1Powder Cocaine 39.3 14.0 6.1 2.2 1.4 20.3Rock/Crack Cocaine 32.2 32.2 2.1 0.7 0.0 23.3Heroin 9.9 2.4 0.0 0.0 0.0 22.6Other Illicit Drug 29.6 11.5 --- --- --- 20.6Source: Myrstol (2008). Washington County Arrestee Drug and Alcohol Use Survey. University of Arkansas
0
0.5
1.0
1.5
2.0
2.5
12 11 10 9 8 7 6 5 4 3 2 1
Marijuana
Methamphetamine
Alcohol
Powder
Crack
Months Prior to ArrestSource: Myrstol (2008). Washington County Arrestee Drug and Alcohol Use Survey
Figure 8.9Arresteesʼ Average Level of Illicit Drug Use,12-Month Period Leading Up To Arrest
Aver
age
Drug
Use
Lev
el
1.3%
7.4%
22.2%
46.7%
Marijuana or
Hashish
Meth-amphetamine
Cocaine
Source: Myrstol (2008). Washington County Arrestee Drug and Alcohol Use Survey
Figure 8.8Percentage of Arrestees Testing Positive For Drugs:Washington County, Arkansas (September 2007)
Recent data collected from adults booked into the Washington County jail reveal a great deal about patterns of alcohol and drug use among those arrested for criminal offenses. More than 80 percent of arrestees report consuming 5 or more drinks of alcohol on the same day at least once in their lifetime, nearly two-thirds report doing so at least once in the year preceding their arrest, and more than four out of every ten admitted to binge drinking within a month of their arrest.
Illicit drug use is also common among the Washington County arrestee population. In excess of 75 percent of all arrestees report using at least one illicit drug in their lifetime. Nearly half of all arrestees tested positive for THC (marijuana) on the day of their arrest. Approximately one-fifth of all arrestees tested positive for methamphetamine. Fewer than ten percent tested positive for cocaine or opiates.
Arrestee data also show a discernible pattern of alcohol and drug use in the weeks leading up to arrest. Without exception, the frequency of drug use begins to increase dramatically between 90 and 120 days prior to arrest.
In addition, arrestee data show that in the days leading up to arrest the average level of use for marijuana and methamphetamine exceed that for all other drugs, including alcohol.
With respect to age of first use, the Washington County arrestee data show that alcohol and marijuana, substances used by nearly every arrestee at least once, are first used at a younger age than more serious drugs like methamphetamine, cocaine, and heroin. With the exception of alcohol and marijuana, Washington County arrestees begin their experimentation with illicit drugs in their early 20s.
0
6
12
18
24
30
36
42
48
54
60
88 89 90 91 92 93 94 95 96 97 98 99 00 01 02 03 04 05
Juve
nile
Arr
ests
per
10,
000
Source: Federal Bureau of Investigation
Figure 8.10Juvenile Arrest Rates, Part I Offenses: 1988-2005
Washington Co.
Benton Co.
Carroll Co.
Madison Co.
Arkansas
★ After peaking in the mid-to-late 1990ʼs, juvenile arrest rates have fallen dramatically in Northwest Arkansas.
★ In 2005, Benton and Washington Counties had identical juvenile arrest rates, which were very near the state average.
★ Juvenile arrest rates have been consistently lower in Madison County than any of the other Northwest Arkansas counties and the state average.
Public Safety Capacity
0
10
20
30
40
50
60
70
80
90
100
Benton Washington Carroll MadisonSource: United States Fire Administration. National Fire Department Census
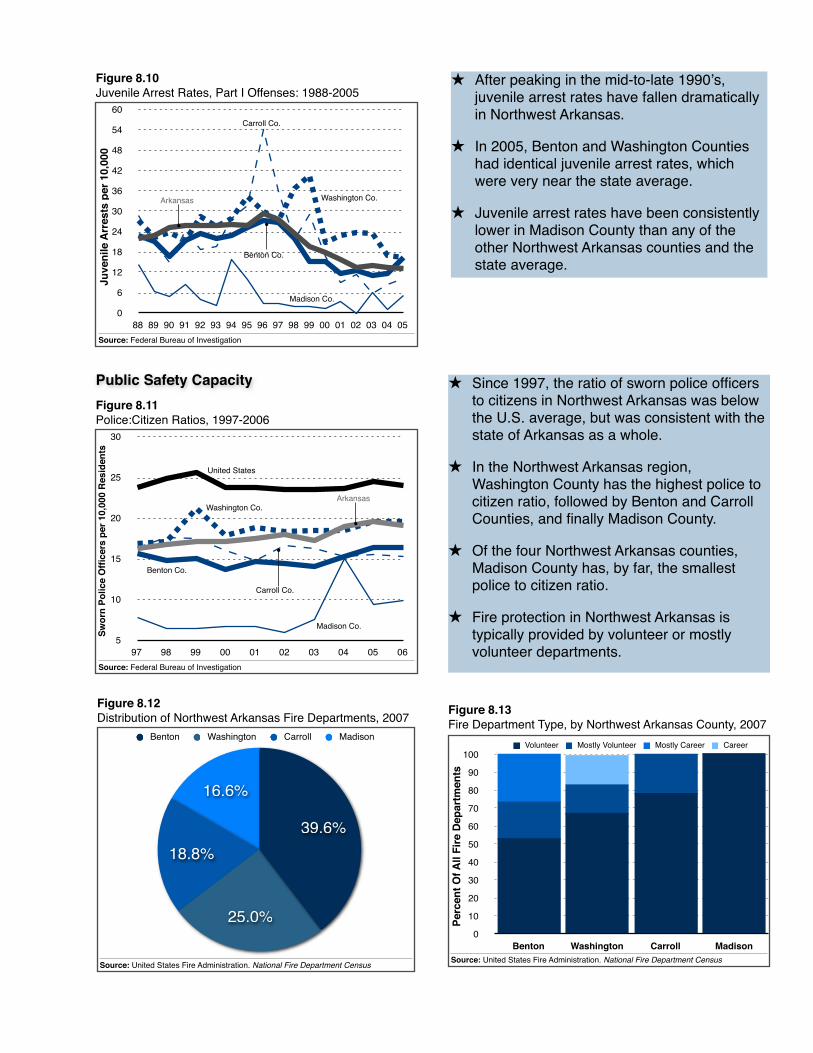
Figure 8.13Fire Department Type, by Northwest Arkansas County, 2007
Perc
ent O
f All
Fire
Dep
artm
ents
Volunteer Mostly Volunteer Mostly Career Career
5
10
15
20
25
30
97 98 99 00 01 02 03 04 05 06
Swor
n Po
lice
Offi
cers
per
10,
000
Resi
dent
s
Source: Federal Bureau of Investigation
Figure 8.11Police:Citizen Ratios, 1997-2006
Washington Co.
Benton Co.
Carroll Co.
Madison Co.
Arkansas
United States
16.6%
18.8%
25.0%
39.6%
Source: United States Fire Administration. National Fire Department Census
Figure 8.12Distribution of Northwest Arkansas Fire Departments, 2007
Benton Washington Carroll Madison
★ Since 1997, the ratio of sworn police officers to citizens in Northwest Arkansas was below the U.S. average, but was consistent with the state of Arkansas as a whole.
★ In the Northwest Arkansas region, Washington County has the highest police to citizen ratio, followed by Benton and Carroll Counties, and finally Madison County.
★ Of the four Northwest Arkansas counties, Madison County has, by far, the smallest police to citizen ratio.
★ Fire protection in Northwest Arkansas is typically provided by volunteer or mostly volunteer departments.

Whatʼs It All Mean?Despite all of the changes taking place in the region, the residents of Northwest Arkansas do not appear to be experiencing heightened levels of fear and anxiety as a result. This may be in part due to the fact that Northwest Arkansas is generally safer than other places. Property crime rates have been declining steadily since the early 1990s, and both violent and property crime rates remain below the national average. Data also suggest that there have been important improvements when it comes to driving under the influence, one of the most pressing public safety issues in communities across the country: DUI arrest rates have declined over the past decade in nearly every Northwest Arkansas county. In addition, juvenile arrest rates have declined in every Northwest Arkansas county since the mid-1990s. And finally, the level of police protection enjoyed by Northwest Arkansas residents has actually increased in the last decade.
Keeping in mind all of the public safety gains just mentioned, Northwest Arkansas communities must also take note of several growing public
safety concerns. First, although the rate of violent crime in Northwest Arkansas remains below the national average, the regionʼs violent crime rate has increased steadily since 1977. If current trends continue, the violent crime rate of Northwest Arkansas will exceed the national average. Second, while the rate of DUI arrests has declined markedly in recent years, arrests for drug-related offenses appear to be increasing. Although arrest statistics are typically a better measure of police priorities than underlying levels of criminal behavior, the increase in drug-related arrests since 1988 demand close attention. Added to this are the data collected from Washington County arrestees showing a level of methamphetamine use exceeding that in nearby jurisdictions like Tulsa and Oklahoma City.
Taken together, these data suggest that while there is reason for the residents of Northwest Arkansas to celebrate at the present time, there are several public safety challenges that must be addressed if future generations are to enjoy the same levels of safety and personal well-being.