Embed Size (px)
Citation preview
93
CHAPTER 8
MODELING OF WIRELESS SENSOR NETWORKS FOR
LPG PLANT MONITORING USING CUCKOO SEARCH
8.1 INTRODUCTION
Wireless Sensor Network is a significant field across the globe for
monitoring the proper utilization of resources including water, oil refineries,
petrochemical plants, natural gas, etc (Jawhar et al 2008) . As oil and gas are
highly hazardous, maintaining the economic progress of a country depends on
aiding of these resources and facilities. The increase in demand of energy
efficiency in oil and gas industry paves way for the development and
investment in Wireless Sensor Network technologies. There are numerous
technologies to monitor the resource exploration, production and
transportation. Network services like localization, tracking, data aggregation
and energy-efficient multihop routing are used for monitoring the resources
with appropriate control mechanism. Considering the above characteristics
and prominent features of monitoring, a mesh model is developed to monitor
the effective functioning of Liquefied Petroleum Gas (LPG) Plant.
LPG is an eco-friendly fuel and hazardous chemical which may
result in mass destruction if not handled with care and safety. There are many
safety precautions to be followed in a LPG bottling plant and they are non-
negotiable. The manual effort alone cannot support in practicing the safety
operations, in addition to aid manual work, some sophisticated and automated
systems are essential to preclude accidents. Hence in this research the use of
94
WSN technology is investigated to monitor LPG plant. Mesh topology is
considered and the performance of the network is analyzed by ZigBee and
Wireless Hart protocol.
8.2 LIQUIFIED PETROLEUM GAS PLANT OPERATION
LPG bottling plant is a plant where LPG is filled into cylinders for
storage and distribution through various LPG distributors. The schematic
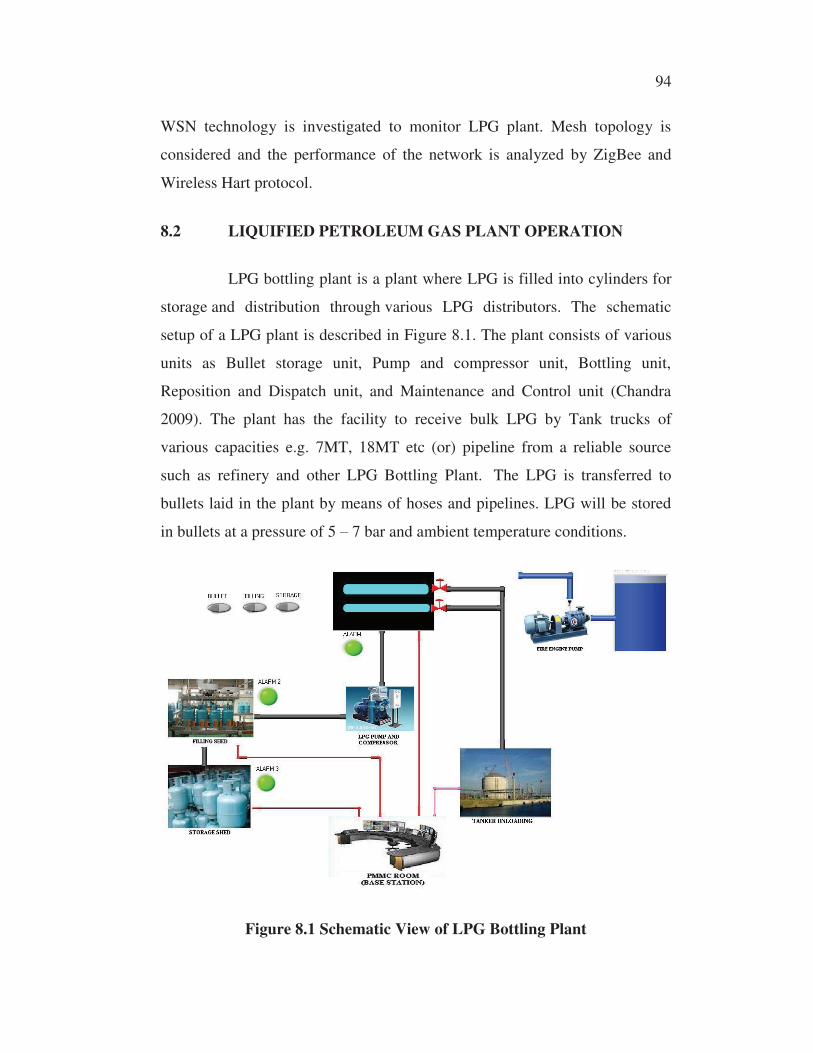
setup of a LPG plant is described in Figure 8.1. The plant consists of various
units as Bullet storage unit, Pump and compressor unit, Bottling unit,
Reposition and Dispatch unit, and Maintenance and Control unit (Chandra
2009). The plant has the facility to receive bulk LPG by Tank trucks of
various capacities e.g. 7MT, 18MT etc (or) pipeline from a reliable source
such as refinery and other LPG Bottling Plant. The LPG is transferred to
bullets laid in the plant by means of hoses and pipelines. LPG will be stored
in bullets at a pressure of 5 7 bar and ambient temperature conditions.
Figure 8.1 Schematic View of LPG Bottling Plant
95
Then the LPG is channelized to cylinders by means of pipelines
positioned inside the plant. The primary operation in a bottling plant is
associated with proper filling of LPG cylinders. The sequence of activities for
bottling include receipt of cylinders, visual inspection and segregation,
cylinder filling, tare weight marking, tightness test etc. Once the cylinders are
received, it is thoroughly checked under two classifications namely new
cylinders from manufacturers and old cylinders from customers. All new
cylinders received should be supported by Test Certificate for ISI (Indian
Standards Institute) inspection and approval from CCE (Chief Controller of
Explosives) before they are put into use. Based on the visual inspection the
cylinders are segregated as under filled, leaky/defective, spurious, etc. In-
depth examination of each and every cylinder is performed and appropriate
remarks are put on the relevant transfer documents.
The liquid LPG at a differential pressure of 8 bar is filled into the
cylinders. Then the cylinders are verified for correct weight to prevent under-
filling and over-filling. The corrections are carried out if required. The self-
closing valve is checked for leakage and any other defects. Then the cylinders
are immersed in test bath of water, to identify bung leak or body leak and if
leaky cylinders are identified it is evacuated and scrapped immediately. The
good cylinders are sealed and stored in the repository unit. Then the cylinders
are dispatched on the basis of requirements to the needy areas. The overall
control of the plant is monitored from the control room. Any obstruction in
these activities will shackle the entire operation of the plant.
8.3 NEED FOR PLANT MONITORING
Monitoring resource plants relies first and foremost on sensory data
information about its surroundings as well as about its internal working .
This sensory data represent the next evolutionary development step in plant
96
as follows (LPG specifications 2012);
1. The level of LPG stored in the bullets as well as bottled in the
cylinders should not exceed 85% of its capacity to ensure
thermal expansion and safety norm as pressure should not
raise above 11 bar.
2. The gas flow from the outlet of the reservoir bullet should not
exceed 40 Gallons/minute.
3. The temperature of the plant should be ambient and should not
exceed 410 degree Celsius.
4. LPG has an explosive range of 1.8% to 9.5% volume of gas in
air. This is considerably narrower than other common gaseous
fuels. LPG liquid is lighter than water while LPG vapor is
heavier than air. This gives an indication of hazard of LPG
vapor accumulated in low lying area in the eventuality of the
leakage or spillage.
If these constraints are violated, then the infrastructure of the plant
will be ruined. Small amount of gas leakage seems to be a minor issue but
eventually it leads to fire blaze and explosions if unattended. The lack of basic
safety features will ultimately cause loss of life and destruction to property.
Therefore continuous monitoring is pivotal for a crucial infrastructure which
causes financial losses to the industry. There are number of technologies to
monitor and protect the resource plants. Most of the technologies are
specifically designed to detect, locate and report pipeline leakages as pipeline
gement plan.
The solutions rely on the availability of a wired or fiber optic network to
transfer the information to the base station. The wired networks are usually

97
connected to regular sensor devices that measure specific attributes such as
flow rate, pressure, temperature, etc.
There are a number of problems using wired networks with regular
sensors for plant monitoring. Mohamed and Jawhar (2008) states that if there
is any damage for any part of the wires of the network, the whole pipeline
monitoring system will be compromised. It is easy for unauthorized people
to disable the monitoring system by cutting the network wires. Different types
of information are reported through the network. Some of this information is
considered more important to be delivered to the control station than others.
For example information reporting a fire is more important than information
about pressure measurement. In addition, Duplicate and unwanted
information can be transferred on the network causing significant delay for
other more important information. This is due to the lack of quality of Service
(QoS) support in these existing networks.
Jawhar et al (2007) explains the advent of technology in computing
and electronics pioneered the wired networks by Wireless Sensor Networks
with its immediate physical environment allows each sensor to provide
localized measurements and detailed information. The ability to
communicate not only allows sensor data and control information to be
communicated across the network of nodes, but nodes to cooperate in
performing more complex tasks such as statistical sampling, data
aggregation, system health and status monitoring. In this research work, the
pipeline monitoring is revised and extended for LPG plant application
considering overall functioning of the plant. A reliable sensor network model
is developed with Cluster based routing methodology for resilient network
communication. Sensor nodes are placed in and around various units of the
98
plant. The nodes at each unit are clustered by cuckoo search algorithm. The
sensed information is transmitted to the base station by wireless HART
protocol. Various test conditions are considered and the performance of the
plant is evaluated to meet the real time scenario.
8.4 DESIGN OF CUCKOO BASED HART PROTOCOL
The developed mesh network model aims to implement an energy
efficient plant in leakage detection and monitoring of events. The LPG plant
system comprises of uniform distribution for sensor placement. The sensor
nodes are deployed in and around the five major units in the plant namely,
Tanker Unloading Section; Bullet storage unit; Pump and compressor unit;
Bottling unit; and Reposition and Dispatch unit. Ten numbers of sensors are
placed around each unit. To avoid redundancy and to provide collaborative
data processing, clustered architecture is employed. The cuckoo search
algorithm is applied for cluster formation.
As detailed in chapter six of section 6.3.1, the cluster formation is
carried out by considering node eccentricity, distance constraints and energy
level of the nodes. The energy function (8.1) is related to the minimization of
energy and maximization of lifetime of the nodes.
1
1
*100)(n
i
ididff
(8.1)
The dynamic clustering architecture helps to suppress redundant
data and offers consistency in cluster formation. After the clusters are formed,
the Cluster Heads (CHs) fuse or aggregate the information before forwarding it
to the base station. The transmission of data to the base station or control room
is carried out by HART protocol.

99
8.4.1 Wireless HART
Highway Addressable Remote Transducer (HART) communication
protocol is established for process monitoring and control in industrial
automation. The protocol developed in 1989. The wired HART devices have
certain constraints like cost, unreliable data delivery to the end user. So the
wired HART technologies are modified to the next level of implementation.
i.e., Wireless HART. The sophisticated communication protocol was
developed in 2007 to provide simple, cost-effective and reliable way to
deploy new points of measurement and control without the wiring costs. It is
designed for wireless sensing and actuation, where wired sensing is prone to
hazards. Hart Foundation (2011) states that the Wireless HART standard
supports multiple messaging modes including one-way publishing of process
and control values, spontaneous notification by exception, ad-hoc
request/response, and auto-segmented block transfers of large data sets. As
per the requirements, these capabilities allow communications to be tailored
and aids in power reduction and overhead.
Wireless HART operates with IEEE 802.15.4-2006 compliant
radio model and uses Time Division Multiple Access (TDMA) and
channel hopping to communicate between devices. The communication
protocol differs from 802.15.4 MAC in Time-synchronized Mesh structure
employing Direct Sequence Spread Spectrum. The frequency management is
done as per packet basis and the communication protocol operates in 2.4 GHz.
The three main components of HART network are wireless field devices,
network manager and gateways. Each device in the mesh network can serve
as a router for messages from other devices. Thus it helps in inter
communication within the devices to increase the scalability of the network
(Leander et al 2011).
100
The main advantage of employing Time-synchronized Mesh
prototype is to avoid Radio Frequency Interference from other wireless
systems such as Wi-Fi networks and cordless phones, RF noise from
machinery, physical obstruction of radio paths between devices, multipath
effects between sources and receivers, and node losses due to depleted battery
supplies and environmentally unfriendly operating conditions (Wagner 2010).
The time synchronization among the nodes helps to maintain the information
among the nodes by self-made acknowledgement and reception of packets in
respective time slots. Clear channel assess tests are available and blacklisting
avoids the frequently used channels.
8.4.2 Algorithm for Plant Monitoring
The proposed protocol design is detailed as follows,
1. Initialize the number of nodes, cuckoo nests, eggs in nests,
number of cuckoo, step size, location of base station, location
of nodes, and energy of nodes.
2. Establish the network, by deploying the nodes around the
units.
3. Perform cuckoo search by choosing a node at random from
every unit.
4. Check whether the energy function of node is greater than the
threshold?
5. If yes, rank the solution as cluster head; else update the
solution.
6. Cluster head broadcasts advertisement to abandon nests in the
unit.
7. The Worse nodes join the cluster head as cluster members.
101
8. Nodes sense information.
9. CH creates TDMA schedule for each node to transmit the
sensed data.
10. CH receives data from members.
a) Normal Functioning Yes /No
b) Area of Detection pipelines/ Bullet/ storage/filling/
Tanker unloading
c) Type of Fault Leak/ Increase in flow/ thermal
expansion/ Fire
d) Level of Leakage
11. CH aggregates the data.
12. CH sends signal to actuates the alarm if a) =2.
13. Transmit the data to the base station using Wireless HART
mechanism.
14. Switch on fire water engine if c) =4.
15. Trip the equipments and halt the plant within 3 minutes.
8.5 EXPERIMENTAL RESULTS AND DISCUSSION
The proposed Cuckoo clustering with HART protocol is analyzed
by experimental results in order to indicate the quality of decisions the cuckoo
search makes on clustering of nodes and efficient data communication to the
base station by HART mechanism. The network is developed by analyzing
the graph routing algorithm proposed by Liao and Ge (2010) for wireless
mesh networks. The network model is simulated using MATLAB . The
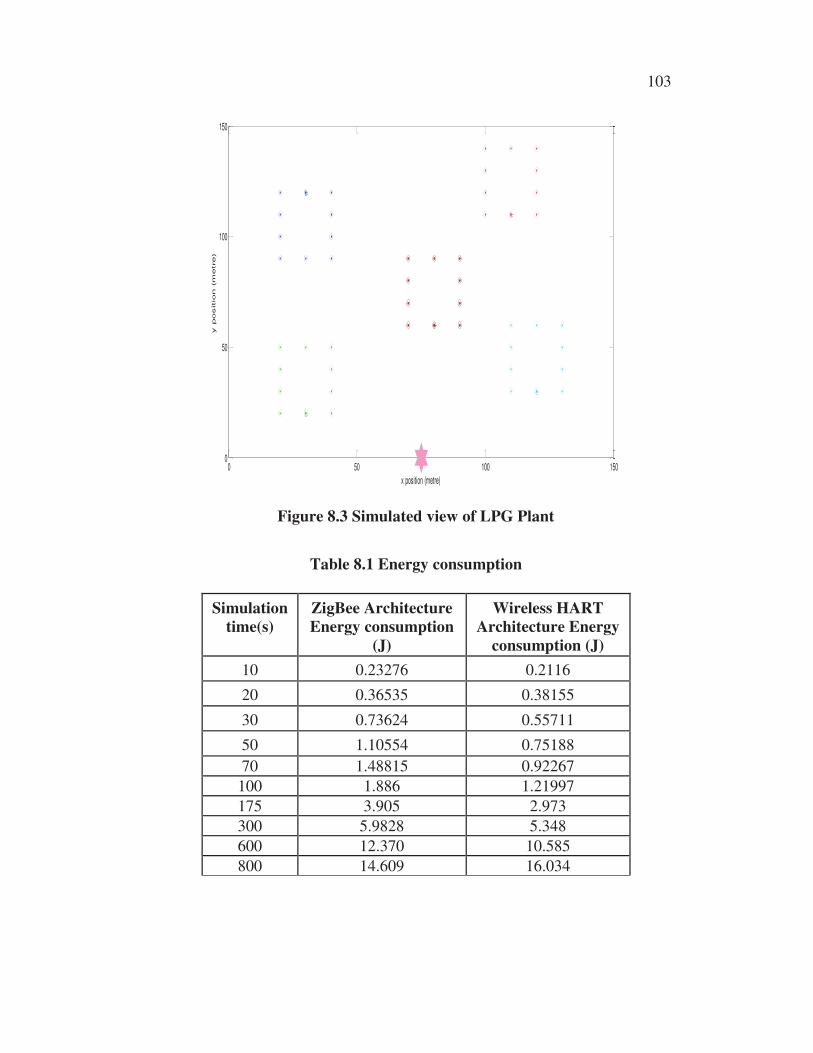
schematic view of LPG Plant of SHV energy private limited is given in
Figure 8. 2. The simulated view of the plant is given in Figure 8.3.
102
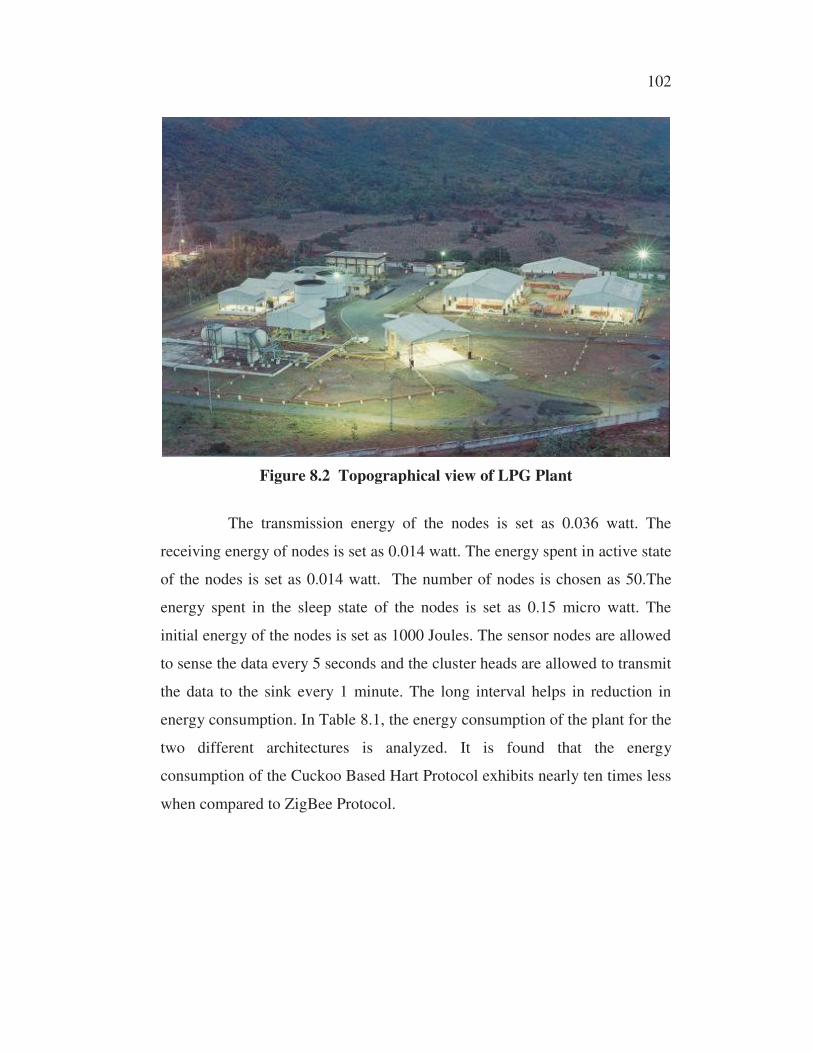
Figure 8.2 Topographical view of LPG Plant
The transmission energy of the nodes is set as 0.036 watt. The
receiving energy of nodes is set as 0.014 watt. The energy spent in active state
of the nodes is set as 0.014 watt. The number of nodes is chosen as 50.The
energy spent in the sleep state of the nodes is set as 0.15 micro watt. The
initial energy of the nodes is set as 1000 Joules. The sensor nodes are allowed
to sense the data every 5 seconds and the cluster heads are allowed to transmit
the data to the sink every 1 minute. The long interval helps in reduction in
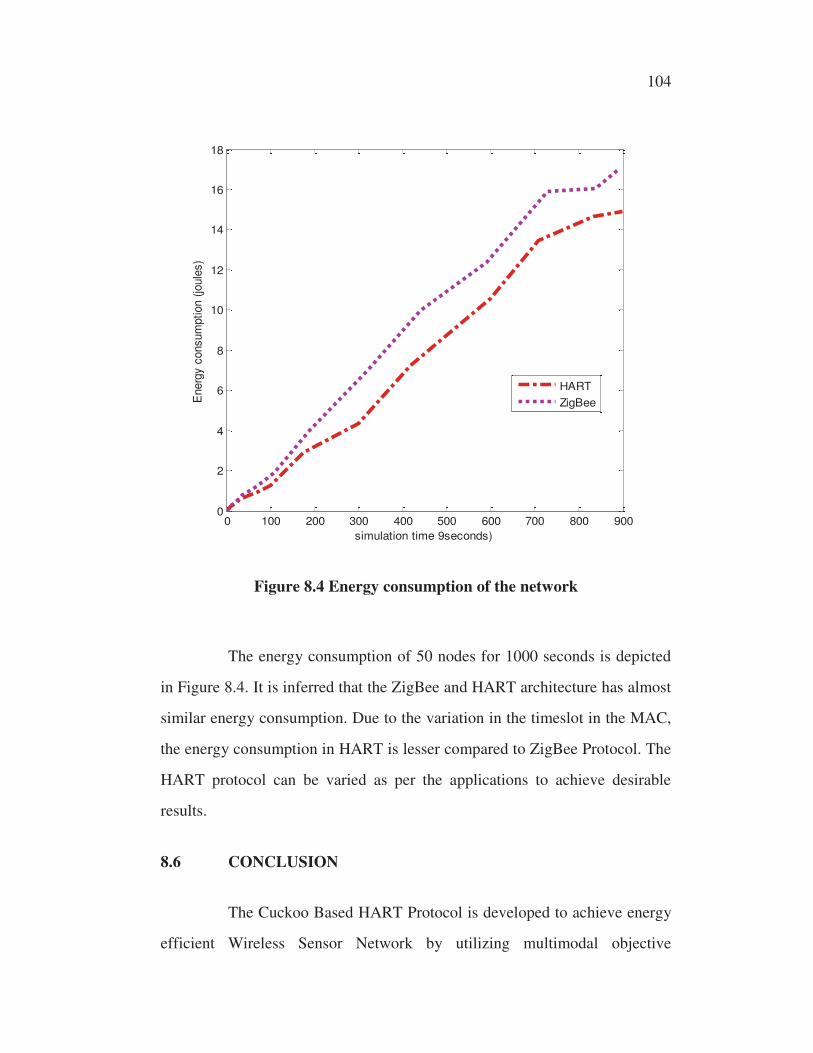
energy consumption. In Table 8.1, the energy consumption of the plant for the
two different architectures is analyzed. It is found that the energy
consumption of the Cuckoo Based Hart Protocol exhibits nearly ten times less
when compared to ZigBee Protocol.
103
0 50 100 1500
50
100
150
x position (metre)
y positio
n (m
etre)
Figure 8.3 Simulated view of LPG Plant
Table 8.1 Energy consumption
Simulation
time(s)
ZigBee Architecture
Energy consumption
(J)
Wireless HART
Architecture Energy
consumption (J)
10 0.23276 0.2116
20 0.36535 0.38155
30 0.73624 0.55711
50 1.10554 0.75188
70 1.48815 0.92267
100 1.886 1.21997
175 3.905 2.973
300 5.9828 5.348
600 12.370 10.585
800 14.609 16.034
104
0 100 200 300 400 500 600 700 800 9000
2
4
6
8
10
12
14
16
18
simulation time 9seconds)
Energ
y c
onsum
ption (
joule
s)
HART
ZigBee
Figure 8.4 Energy consumption of the network
The energy consumption of 50 nodes for 1000 seconds is depicted
in Figure 8.4. It is inferred that the ZigBee and HART architecture has almost
similar energy consumption. Due to the variation in the timeslot in the MAC,
the energy consumption in HART is lesser compared to ZigBee Protocol. The
HART protocol can be varied as per the applications to achieve desirable
results.
8.6 CONCLUSION
The Cuckoo Based HART Protocol is developed to achieve energy
efficient Wireless Sensor Network by utilizing multimodal objective
105
functions. Cuckoo search is applied for cluster head selection and formation
of clusters among the Sensor nodes. The proposed protocol is compared with
the standard ZigBee protocol. The simulation results exhibits that the
proposed protocol produces comparable results mainly due to optimal search
process in cluster formation and allocation of appropriate paths in
transmission of sensed data. The developed optimal algorithm reduces
complexity in chain formation and the test case conditions are verified. The
results are obtained by running more number of simulations. The plant
modeled with 50 nodes deployed at various units around the plant and the
different stages of leakage are analyzed.