Embed Size (px)
Citation preview

130
CHAPTER 8
MINIMUM IGNITION ENERGY MEASUREMENT
In this experiment, flash powder mixtures which are sensitive
nature to electro static discharge is tested using Hartmann apparatus.Here,
wire exploded nano aluminium powder is also mixed with the flash powder
and tested for comparison.
The methodology for this experimentation is described in the
flowchart (Figure 8.1).
Figure 8.1 Methodologyfor MIE measurement
Nano aluminium powder (Ball
milled)
Measurement of MIE with varying electrode gap / material /
dust concentration
Measurement of MIE using Hartmann apparatus
Preparation of micron and nano flash power mixture
Nano aluminium powder (wire
exploded)

131
8.1 PREPARATION OF FLASH POWDER COMPOSITION
8.1.1 Sample preparation for micron flash powder
Table 8.1 shows the basic formulation of the pyrotechnic mixtures
with chemicals for MIE measurement. Various compositions were prepared
by using the chemicals of KNO3, S and Al powders of particle size in 75 µm
(samples S51-S60). The sieves used for this mixing met the ASTM standard.
The number of mixtures required for an analysis was calculated with the help
of Design of Experiment software (Make: Stat-Ease, Inc., Minneapolis). The
complete specifications of the samples are refereed as in the Annexure A1.3,
Set III.
Table 8.1Compositions of micron flash powder
Sample No. Potassium nitrate,% Sulphur, % Aluminium, %
S51 50.0 5.0 45.0 S52 65.0 5.0 30.0 S53 50.0 20.0 30.0 S54 50.0 12.5 37.5 S55 57.5 12.5 30.0 S56 57.5 5.0 37.5 S57 60.0 7.5 32.5 S58 52.5 7.5 40.0 S59 52.5 15.0 32.5 S60 55.0 10.0 35.0
8.1.2 Sample preparation for micron flash powder for different
particle sizes
Samples were prepared from micron sized KNO3, S and Al
powders withdifferentparticle sizes of -100+200, -200+225, -225+325,

132
-325+400, -400meshes. The composition for all the sample was KNO3: S: Al
on the ratio of 57: 20: 23 (samples S98-S102). The complete specifications of
samples are described in Annexure A1.6.
8.1.3 Sample preparation for nano flash powder
Nano flash powder composition was prepared by using the
chemicals of nKNO3, nSand nAlpowders, which are prepared as per the
section 4.1. The composition had KNO3: S: Al in the ratio of 57:20:23. Then,
10 samples (S21-S30) were prepared from 10 % nano flash powder to 100 %
nano flash powder by retaining the rest as micron size flash powder as
prescribed in section 4.2 (refer Table 4.1).
8.1.4 Sample preparation with wire exploded nano aluminium
powder
Wire exploded aluminium powder was procured as such from M/s.
Neo-Ecosystems and Software (P) Ltd., Uttarkhand, India, with particle size
367 nm and the purity of this powder in argon atmosphere is 99.99 % (refer
Figure 8.2).This powder is mixed and milled with nano potassium nitrate and
nano sulphur to prepare nano flash powder mixture. Here, the preparation was
done in two methods to check the purity. Glove box in inert condition was
used for preparing flash powder mixtures and also in open
atmosphere.Samples were also prepared from this nano flash powder by the
same procedure and represented as samples S103 S112. The complete
details of these samples are described in Annexure A1.7.

133
Figure 8.2 Particle size of wire exploded aluminium
Figure 8.3(a) is the SEM image of wire exploded nAl magnified at
10,000X which is clustered and agglomerated and thus larger in size.
Figure 8.3(b) is the SEM image of nano flash powder with the mixture of
nanopotassium nitrate, nanosulphur and wire explodednAl and is magnified at
3,000X.
In order to check the presence of functional elements of potassium
nitrate, sulphur and aluminium in the composition, the FTIR analysis has been
made. This is shown in Figures 8.4(a-c). Figure 8.4(a) is the FTIR graph of
the nano flash powder made by mechanical milling. Figure 8.4(b) is the FTIR
graph of the nano flash powder consists of the wire exploded nAl and the
composition prepared in normal atmosphere. Figure8.4(c) is the FTIR image
of the nano flash powder consists of nAl made by wire explosion, but the
composition prepared in inert atmosphere. All the graphs show the presence
of potassium sulphate and aluminium oxide.

134
Figure 8.3 SEM images for (a) wire explodednAl (b) nano flash powder
consists of nAl by wire explosion
(b)
(a)

135
Figure 8.4 (a-c) FTIR curves for nano flash powder consists of (a) Mechanical milled nAl (b) wire exploded nAl, prepared in open atmosphere (c) wire exploded nAl, prepared in inert atmosphere
(a)
(b)
(c)

136
From Figure 8.4 (a-b), it is clear that the chemicals have two peaks;
one is in the range of 491-451 cm-1 and another in 447.9 - 439.2 cm-1 which
clearly indicates that these chemicals have aluminium oxide (Al2O3) in the
-modification (Range 491-451 cm-1) and SO4 group (K2SO4 and KHSO4,
Range 447.9 - 439.2 cm-1) as asymmetric bond. From Figure8.4(c), it is
evident that the chemical has only Al2O3 and absence of SO4peak
(447.9 - 439.2 cm-1)and this is because of the manufacturing of powder in
inert atmosphere without Oxygen. It is noticed that, whatever the process of
preparing the mixture, formation of Al2O3 cannot be prevented and Al2O3
forms at the end, due to the manual material handling. Al2O3 is the
passivation coating on pure aluminium metal which reduces the sensitivity of
firework flash powder.
8.2 MIE MEASUREMENT
The variables taken in this study are electrode material, electrode
gap, chemical composition, particle size and dust concentration to estimate
the variations of MIE. The MIE measurement can be conducted by using
Hartmann apparatus.
8.2.1 Hartmann apparatus
Figure 8.5 shows the experimental setup of Hartmann apparatus to
measure Minimum Ignition Energy (MIE). The fundamental setup and
procedures of the MIE tests are similar to the ASTM E2019-03 (2007). It
consists of 1.2 litre vertical tube in which dust was dispersed by air blast. Two
electrodes made of Brass or Stainless Steel (SS) of grade AISI 304 was kept
inside the glass tube at some distance apart. Electrodes were connected with
spark ignitor and serves as ignition source. Spark ignition system was

137
supplied by high voltage DC power. Flame propagation was observed as a
function of dust particle size, dust concentration, DC voltage, etc. The
experimental setup consists of high voltage, dust dispersion, spark ignition
and Hartmann glass apparatus. The DC power supply required for this work is
0 to 7 kV. The dust dispersion system was used to form a uniform dust cloud
in the Hartmann glass. The spark generation circuit is shown in Figure 8.5.
Figure 8.5Hartmann apparatus (a) Skeleton (b) Spark generation unit
(a)
(b)

138
The high voltage capacitor with the rating of 0.1 µF was used to
store the energy required for ignition of dust sample and used electrolytic
capacitor with heavy insulation. In order to make an ignition test, the high
voltage electrode was grounded and the required mass of the prepared dust
was placed in the dispersion cup. The dust was dispersed byopening a valve
and emptying 50 cc pressurised air reservoir at 0.7MPa. Sparks were
generated between the electrodes by using a high voltage pulse to charge a
discharge capacitor, which is subsequently discharged when the breakdown
voltage of the electrode gap is reached. When the dust particles passing
through the spark gap with a preset static high voltage; breakdown may be
triggered with a subsequent spark discharge. The flame may propagate after
the ignition of powder by applying the DC voltage.
The electrode separation and the voltage were then adjusted by trial
and error until sparks of the stored energy on the capacitor reaches 0.5CV2 at
the electrodes, where V is the voltage at which the spark occurs; C is the total
capacitance at the high voltage electrode. The first test usually was performed
with a high spark energy typically 500 mJ. The voltage was then reduced in
steps until no ignitions occurred for ten ignition trials, or until it could not be
reduced any further. During the experiment, visual inspection is required to
determine whether or not the ignition spark has successfully induced a dust
cloud explosion. The electrode material used was Stainless Steel / Brass of
2 mm diameter with round tip. The optimum space between the electrodes for
experimentation was 2 and 4 mm. The nominal dust concentration was also
varied, offering the opportunity to find the ideal conditions for spark ignition
of the dust cloud.
In addition, an investigation of MIE for coal and aluminium
powder using the spark generator has been performed; enabling calibration of
the spark generator by comparison of MIE data with literature values(The

139
Aluminium Association Inc., US, Canadian Centre for Occupational Health
and Safety, 2011 Stephan, 2011) and the results are tabulated in Table 8.2. In
most of the tests the dust was placed in a dust reservoir downstream of the air
reservoir, forcing the particles in the tube, thus reducing agglomeration.
However, some of the dusts have to be placed at the bottom of the Hartmann
tube because of clogging.
Table 8.2 Calibration of results
S.No. Material MIE, mJ
Literature Experimental
1. Aluminium 17 µm 28.0 27.6
2. Aluminium 10 µm 10.0 9.7
3. Coal 30.0 30.7
8.2.2 MIE for different micron flash powder compositions
MIE test is conducted for the various samples as prescribed in the
Table 8.1with the concentration of flash powder 0.3 g/l, electrodes gap 6 mm
and electrode material of brass. The results are shown in Table 8.3, for the
particle size of 75 µm.
From Table 8.3, it is found that the addition of sulphur leads to the
decrease of MIE drastically. As sulphur is a low melting point (110°C)
material and has very low MIE compared to other two materials in the flash
powder composition, it quickly initiates the ignition. For example in sample
S52, Sulphur has 5 %, the MIE is 62.7 mJ despite MIE of sample S53 is
26.7 mJ in which sulphur is 20%. But KNO3 and aluminium powder addition
shows little impact in MIE.

140
Table 8.3 MIE of different micron flash powder compositions
Sample No. DC voltage, kV MIE, mJ S51 1.16 67.3 S52 1.12 62.7 S53 0.73 26.7 S54 1.22 74.4 S55 1.14 65.0 S56 1.15 66.1 S57 1.14 65.0 S58 1.16 67.3 S59 0.78 30.4 S60 1.00 50.4
8.2.3 MIE for micron flash powders with different dust
concentration and particle size
MIE of flash powder with the standard composition as per the
Petroleum and Explosive Safety Organisation, Government of India, consists
of Potassium nitrate (57 %), Sulphur (20 %) and Aluminium (23 %) is found
out for the various particle with brass electrode along 2 mm gap. The results
are shown in Table 8.4. Here, the various dust concentrations (0.3 0.5 g/l)
were taken for this study.
Table 8.4 MIE for different dust concentration for various particle sizes
Concentration, g /l 0.3 0.4 0.5
Sample No. DC voltage, kV
MIE, mJ
DC voltage, kV
MIE, mJ
DC voltage, kV
MIE, mJ
S98 1.28 82.0 1.18 69.6 1.12 62.7 S99 1.21 76.3 1.15 66.1 1.08 58.3
S100 1.18 69.6 1.12 60.7 1.01 52.0 S101 1.12 62.7 1.01 53.0 0.95 45.1 S102 1.05 55.1 0.95 45.1 0.88 38.7
141
Figure 8.6 MIE for various dust concentrations
Table 8.4 and Figure 8.6, shows that when the particle size reduces from -150+75 to -37 µm, MIE is also reduced by 35 % for the dust concentration of 0.4 g/l. This shows that ignition hazard increases when the particle size of flash powder reduces. Table 8.4further infers that MIE is reduced by 23 % for the same particlesize (-150+75), by varying the dust concentration from 0.3 to 0.5 g/l. This is because of the fuel rich mixture is readily available in the Hartmann tube. But in this experiment no steps have been taken to find out lower and upper explosive concentration (LEC and UEC) for safety consideration of the test centre. As all the samples are ignited in the range of 0.3 to 0.5 g/l, it is concluded that this range should be lies within LEC and UEC.
8.2.4 MIE for micron flash powders with different electrode material and gap
MIE test is conducted for the composition of various particle sizes with
different electrode material like Brass, Stainless Steel (SS) and gap of
20
40
60
80
100
S98
S99
S100
S101
S102
MIE
, mJ
Samples
0.3 g/l 0.4 g/l 0.5 g/l
Electrode Material: Brass Electrode gap : 2 mm Dust Concentration:

142
2 and 4 mm with the dust concentration of 0.4 g/l. The results are shown in
Table 8.5.
Table 8.5 MIE for different electrode gap and material for various
particle sizes
Electrode gap /
material 4 mm gap 2 mm gap
Brass SS Brass SS
Sample No. DC, kV
MIE, mJ
DC, kV
MIE, mJ
DC, kV
MIE, mJ
DC, kV
MIE, mJ
S98 1.71 146.2 1.61 154.6 1.18 69.6 1.34 89.8 S99 1.68 141.0 1.71 149.2 1.15 66.1 1.31 85.8
S100 1.64 134.5 1.77 145.6 1.12 62.7 1.18 69.6 S101 1.61 129.6 1.54 139.6 1.01 53.0 1.15 66.1 S102 1.54 121.6 1.66 135.7 0.95 45.1 1.08 58.3
Figure 8.7 MIE for various electrode gap
0
30
60
90
120
150
S98
S99
S100
S101
S102
MIE
, mJ
Samples
2 mm 4 mm
Electrode material : Brass Dust concentration : 0.4 g/l Electrode gap :

143
Figure 8.8 MIE for various electrode materials
Table 8.5 and Figure 8.7, indicate that the value of MIE increases
when the gap between the electrode increases. The MIE yielding ignition
decreases upto 50 %, if the gap between the electrodes decreases from 4 to 2
mm irrespective of particle sizes. From the safety point of view, this
represents a quite conservative method to find the safe energy limits of
potential electrostatic sparks in an industrial plant and to design the safe
handling of the flash powders. In addition, this information will be useful to
maintain the gap between the projecting conductors in silos / hoppers which
acts as electrodes.
As shown in Figure 8.8, the electrode material also influences the
MIE of the flash powder. There is a significant change in the results between
brass and SS electrode material. Stainless steel material is the safest one
during powder handling
system.
100
120
140
160
S98
S99
S100
S101
S102
MIE
, m
J
Samples
BrassStainless steel
Dust concentration : 0.4 g/l Electrode gap : 4 mm Electrode material :
144
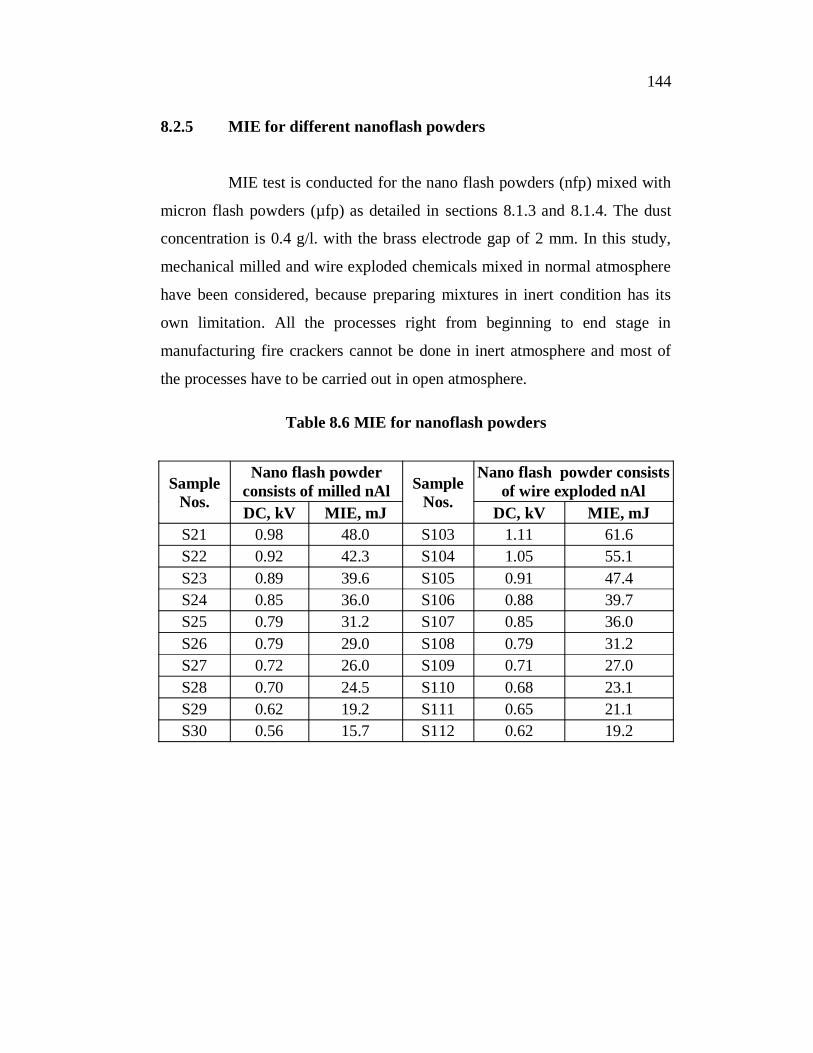
8.2.5 MIE for different nanoflash powders
MIE test is conducted for the nano flash powders (nfp) mixed with
micron flash powders (µfp) as detailed in sections 8.1.3 and 8.1.4. The dust
concentration is 0.4 g/l. with the brass electrode gap of 2 mm. In this study,
mechanical milled and wire exploded chemicals mixed in normal atmosphere
have been considered, because preparing mixtures in inert condition has its
own limitation. All the processes right from beginning to end stage in
manufacturing fire crackers cannot be done in inert atmosphere and most of
the processes have to be carried out in open atmosphere.
Table 8.6 MIE for nanoflash powders
Sample Nos.
Nano flash powder consists of milled nAl Sample
Nos.
Nano flash powder consists of wire exploded nAl
DC, kV MIE, mJ DC, kV MIE, mJ S21 0.98 48.0 S103 1.11 61.6 S22 0.92 42.3 S104 1.05 55.1 S23 0.89 39.6 S105 0.91 47.4 S24 0.85 36.0 S106 0.88 39.7 S25 0.79 31.2 S107 0.85 36.0 S26 0.79 29.0 S108 0.79 31.2 S27 0.72 26.0 S109 0.71 27.0 S28 0.70 24.5 S110 0.68 23.1 S29 0.62 19.2 S111 0.65 21.1 S30 0.56 15.7 S112 0.62 19.2

145
* 1-10 refers the set of samples S21 S30 and S103 S112
Figure 8.9 MIE for nano powders
From Table 8.6 and Figure 8.9, it is clear that if the nano flash
powder is added with micron powders, MIE has been greatly reduced. The
complete replacement of micron with nano powder (mechanically milled
aluminium) leads to decrease of MIE from 48.0 mJ (sample S21) to 15.7 mJ
(sample S30). However, if the nano flash powder consists of wire exploded
aluminium powder, MIE has reduced from 61.6 (sample S103) to 19.2 mJ
(sample 112). This reveals that handling of nano powders will bear risk and so
utmost care is to be taken. Hence, nAl powders of both mechanical milled and
wire exploded methods provide unsafe handling in fireworks industry.
SUMMARY
The summary of this chapter as below:
The Minimum Ignition Energy measurement shows that MIE
reduces by 65 % when decreasing the particles to nano level. This shows that
the sensitivity to static charge increases.
0
15
30
45
60
75
1 2 3 4 5 6 7 8 9 10
MIE
, mJ
Samples *
Mechanical millWire explosion
Dust concentration : 0.4 g/l Electrode gap : 2 mm Elrctrode material : Brass nAl. making process:


![MINIMUM 6 75.[36] VW MINIMUM...Au dos de la bote fusibles Under the steeing column Sous la colonne de direction (-) TRUNK RELEASE (MU)LOCK/ UNLOCK BRAKE CONTROL 1 Ignition 6 ()CAN2](https://img.pdfslide.us/doc/110x75/61044ee6f4dc7a3aea5dc7d8/minimum-6-7536-vw-minimum-au-dos-de-la-bote-fusibles-under-the-steeing-column.jpg)