Embed Size (px)
Citation preview
Chapter 8
Circular-Dichroism and Synchrotron-RadiationCircular-Dichroism Spectroscopy as Tools to MonitorProtein Structure in a Lipid Environment
Koichi Matsuo and Kunihiko Gekko
Abstract
Circular-dichroism (CD) spectroscopy is a powerful tool for the secondary-structure analysis of proteins.The structural information obtained by CD does not have atomic-level resolution (unlike X-ray crystallog-raphy and NMR spectroscopy), but it has the great advantage of being applicable to both nonnative andnative proteins in a wide range of solution conditions containing lipids and detergents. The development ofsynchrotron-radiation CD (SRCD) instruments has greatly expanded the utility of this method by extend-ing the spectra to the vacuum-ultraviolet region below 190 nm and producing information that isunobtainable by conventional CD instruments. Combining SRCD data with bioinformatics provides newinsight into the conformational changes of proteins in a membrane environment.
Key words: Circular-dichroism spectroscopy, Conformational change, Lipid environment,Membrane protein, Neural network, Secondary-structure analysis, Sequence-based prediction,Synchrotron radiation, Vacuum-ultraviolet circular dichroism
1. Introduction
Knowledge of the structures of membrane proteins is essential tounderstanding their biological functions such as in intracellularcommunication and stimulation responses of cells. However, thereremain a huge number of membrane proteins whose tertiary struc-tures are unknown due to (1) the technical difficulties of having tocrystallize proteins in the membrane environment (or detergentmicelle) for X-ray crystallography and (2) only small proteinsbeing analyzable by NMR spectroscopy. Circular-dichroism (CD)spectroscopy, which is a well-established technique in structuralbiology, does not provide atomic resolution (unlike X-ray crystal-lography and NMR spectroscopy), but it has been widely used foranalyzing the structure and conformational changes of membrane
Jorg H. Kleinschmidt (ed.), Lipid-Protein Interactions: Methods and Protocols, Methods in Molecular Biology, vol. 974,DOI 10.1007/978-1-62703-275-9_8, # Springer Science+Business Media New York 2013
151
proteins (1–6) because CD spectra are very sensitive to localstructures and are measurable for any proteins at low concentrationunder various solvent conditions or in a lipid environment. Proteinsexhibit characteristic CD spectra in the visible to vacuum-ultraviolet(VUV) regions. Most folded proteins exhibit significant opticalactivity in the near-ultraviolet (UV) region (250–300 nm), owingprimarily to the presence of aromatic residues and disulfide bondsthat sensitively reflect the tertiary structure. In the far-UV region(<250 nm), these spectral characteristics are determined primarilyby the secondary structures of protein. The principles, techniques,and applications of CD spectroscopy have been comprehensivelyreviewed in many books (7–9).
The secondary-structure analysis of proteins by CD spectros-copy has been markedly improved by (1) the development ofprograms (e.g., DSSP and Xtlsstr) for assigning the secondarystructures from atomic coordinates (10, 11), (2) the advancementsin software (e.g., CONTIN, SELCON3, and CDSSTR) for analyz-ing CD spectra (12), and (3) the extension of CDmeasurements tothe VUV region (13). The short-wavelength limit of CD spectros-copy can be extended down to ~160 nm by using synchrotronradiation (SR) as a high-flux source of photons, which yieldsmuch more detailed information that cannot be obtained with aconventional CD spectrophotometer (14–16). VUV CD spectros-copy using SR (SRCD) is a powerful tool for estimating not onlythe contents but also the numbers of a-helix and b-strand segmentswith high accuracy (17, 18). Furthermore, combining SRCD datawith bioinformatics (e.g., neural-network (NN) algorithms) canconsiderably improve the sequence-based prediction of secondarystructures (19), which can also be used to test the predictedtertiary-structure model of a protein. This chapter addresses recentdevelopments in CD and SRCD spectroscopy as tools to monitorprotein secondary structures in a lipid environment, focusing onnonintegral membrane proteins.
1.1. Basic Principles CD is defined as the difference (DA) between the absorbance ofleft- and right-handed circularly polarized light, each of whichfollows the Beer–Lambert law at a given wavelength AL ¼ eLlCand AR ¼ eRlC
A ¼ AL �AR ¼ ðeL � eRÞlC ¼ elC (1)
where eL and eR are the molar absorptions of the sample for left- andright-handed circularly polarized light, respectively, C is the molarconcentration of the sample, and l is the path length of the opticalcell (in cm). CD instruments usually represent the CD in De or amolar ellipticity, [y], with the latter being widely used for proteinsand polypeptides. [y] is related to De by
e ¼ ½y�=3; 298 (2)
152 K. Matsuo and K. Gekko

and is obtained by normalizing the raw ellipticity, y, with thesample concentration and the path length of the cell:
½y� ¼ 100y=lC (3)
For proteins (or other polymers), the molar concentration unitis based on the mean residue weight (MRW), which is the molecu-lar weight of the protein divided by the number of amino acidresidues per molecule. Thus, [y] can be obtained in the unit ofdegrees cm2 dmol–1 by
½y� ¼ y� ðMRW Þ=10cl (4)
where c is the concentration of the sample in mg/ml.Consider the hen-egg lysozyme protein, which has a molecular
weight of 14,314 and 129 residues—its MRW value is 111 (i.e.,14,314/129). When y is 100� at 222 nm, c is 0.1 mg/ml, and l is1 cm, the value of [y]222 nm is calculated to be 11,100 (i.e., 100 �111/(10 � 0.1 � 1)) degrees cm2 dmol–1 from Eq. 4, whichcorresponds to De222 nm ¼ 3.37 (i.e., 11,100/3,298) from Eq. 2.
2. Materials
2.1. Preparation
of Protein Solution
The sample preparation methods are essentially the same in CD andSRCD measurements, although the protein concentration must beadjusted according to the path length of the cell. The most impor-tant factor is the protein purity because the presence of impurities inthe protein solution will affect the CD spectrum, inevitably leadingto incorrect data on the secondary structure. The purity should beat least 95% as judged by mass spectroscopy or sodium dodecylsulfate– polyacrylamide gel electrophoresis. The protein solutionshould also be free from aggregates that cause light scatteringand abnormal absorption. Aggregates can be removed by centrifu-gation (at 14,000 rpm (20,400 G) for 20 min) and/or by filtration(0.2 mm Millipore filter).
The use of a solvent with a high absorbance should be avoided,especially when CD spectra are measured down to the VUV region.Chloride and carboxylate ions exhibit strong absorption in theVUV region. Phosphate, acetate, and Tris–HCl buffers are availableat high concentrations below 50 mM. HEPES buffer can be usedonly at concentrations below 5 mM. Chloride ions may be replacedby fluoride or sulfate ions. If the use of chloride ions is unavoidablefor a reason such as protein stability or solubility, their concentra-tion should be below 5 mM. Organic solvents such as acetonitrile,ethanol, methanol, and trifluoroethanol, which may be useful forincreasing the solubility of membrane proteins, can be used atmoderate concentrations in the VUV region. The absorption bybuffer or solvent should be confirmed as being sufficiently low by
8 Circular-Dichroism and Synchrotron-Radiation Circular-Dichroism. . . 153
checking the high-tension voltage of the CD instrument beforepreparing protein solutions.
2.2. Preparation
of Liposomes
While the liposome preparation varies with the type of lipid, thefollowing methods are typically used (6, 20–23):
1. Lipid is dissolved in chloroform (or a chloroform/methanolmixture with a volume ratio of 3:1) and the solvent is evapo-rated under a stream of nitrogen gas and in a vacuum for at least3 h. The obtained lipid film is dispersed in buffer and furtherhydrated by vibrating on a vortex to produce multilamellarvesicles (MLVs).
2. Sonic-disintegration and extrusion methods are often used toprepare small unilamellar vesicles (SUVs) from MLVs. In thesonic-disintegration method, SUVs are prepared by sonicatingan MLV solution with a probe sonicator to near optical trans-parency, and the residual MLVs and the titanium particlesreleased from the probe are removed by centrifugation at14,000 rpm (20,400 G) for 20 min. The average diameter ofthe obtained SUVs can be estimated by measuring light scatter-ing (e.g., using the DynaPro device). In the extrusion method,SUVs are prepared by filtering an MLV solution throughpolycarbonate membrane. The liposome size can be adjustedby using membranes with pore sizes from 1.0 to 0.03 mm(Avanti Polar Lipids). The uniformity of the liposomes can beimproved by performing three freeze–thaw cycles.
3. The SUV liposome is mixed with protein in the buffer at agiven mole ratio of protein and lipid by vibrating on a vortex,and the mixture is then incubated at room temperature over-night before performing CD measurements.
2.3. Determination
of Protein
Concentration
Accurate knowledge of the protein concentration is necessary forobtaining reliable CD spectra (Eq. 4) and secondary-structure dataof proteins. Amino acid analysis is the preferred method for deter-mining the concentration of proteins with a known sequence. Inthis method, the protein is completely hydrolyzed into amino acidsby heating at 110�C for 24 h in a 6-NHCl solution, and the proteinconcentration is determined from the amount of abundant aminoacids. Unfortunately, this method requires special techniques and isexpensive and generally cannot be applied to membrane proteinsamples containing detergents and phospholipids.
The Bradford (24), Lowry (25), and bicinchoninic acid (26)methods, which are based on the chromogenic reactions of ligandsor dyes bound to proteins, are more convenient for determiningprotein concentrations. However, these methods might not besufficiently accurate because the response is dependent on theproteins involved and is affected by the coexistence of substancessuch as phospholipids.
154 K. Matsuo and K. Gekko

The most convenient and practical method is to measure theprotein absorbance at 280 nm (A280), which is attributed toabsorptions by Trp, Tyr, and Cys residues (27, 28) (see Note 1).This method calculates a protein concentration based on its extinc-tion coefficient (absorbance at l ¼ 1 cm and c ¼ 1 mg/ml), whichis predetermined by standardizing the absorption of a proteinsolution whose concentration has been determined precisely byanother methods such as a dry-weight method. When this value isunknown, the molar extinction coefficient of the protein (eprotein)can be estimated from those of Trp, Tyr, and Cys as follows:
eprotein ¼ ðeTrp �NTrpÞ þ ðeTyr �NTyrÞ þ ðeCys �NCysÞ; (5)
where eTrp, eTyr, and eCys are the molar extinction coefficients ofTrp, Tyr, and Cys at 280 nm, respectively, andNTrp,NTyr, andNCys
are the numbers of corresponding amino acid residues per proteinmolecule. Since the values of eTrp, eTyr, and eCys are known (27), wecan calculate eprotein and the protein concentration (cprotein) usingthe following equations:
eprotein ¼ 5; 690NTrp þ 1; 280NTyr þ 120NCys (6)
and
cproteinðmg=mlÞ ¼ ðmolecular � weightÞ � ðA280=eproteinÞ: (7)
For example, hen-egg lysozyme contains six Trp, three Tyr, andeight Cys residues per molecule (the molecular weight is 14,314).Then, elysozyme ¼ 5;690� 6þ 1; 280� 3þ 120� 8 ¼ 38; 940. IfA280 is 0.500, clysozyme ¼ð0:500=38;940Þ�14;314¼0:183mg=ml.This absorption method cannot be applied to proteins that do notcontain Trp and Tyr residues because the calculated extinctioncoefficients contain significant errors, as expected from Eq. 6. Anydisturbance to the absorbance at 280 nm such as by cofactors andlight scattering also introduces large errors into the calculatedprotein concentration. The contribution of light scattering to theprotein absorbance may be estimated by plotting the logarithm ofthe absorbance against the logarithm of the wavelength above310 nm and then extrapolating the line down to 280 nm (29).
3. Methods
3.1. CD Instruments Two types of CD instruments are in use today: (1) conventional CDinstruments use a laboratory-based light source and work in the far-UV region down to about 190 nm and (2) SRCD instruments useSR as an intense light source and work in the VUV region down toabout 120 nm, and they are designed individually using commer-cially available components and are set up in the beam lines of SR
8 Circular-Dichroism and Synchrotron-Radiation Circular-Dichroism. . . 155
facilities. CD instruments using H2 discharge as the conventionalsource—which were constructed by someCD experts (30, 31)—areno longer in use.
3.1.1. Conventional CD
Instruments
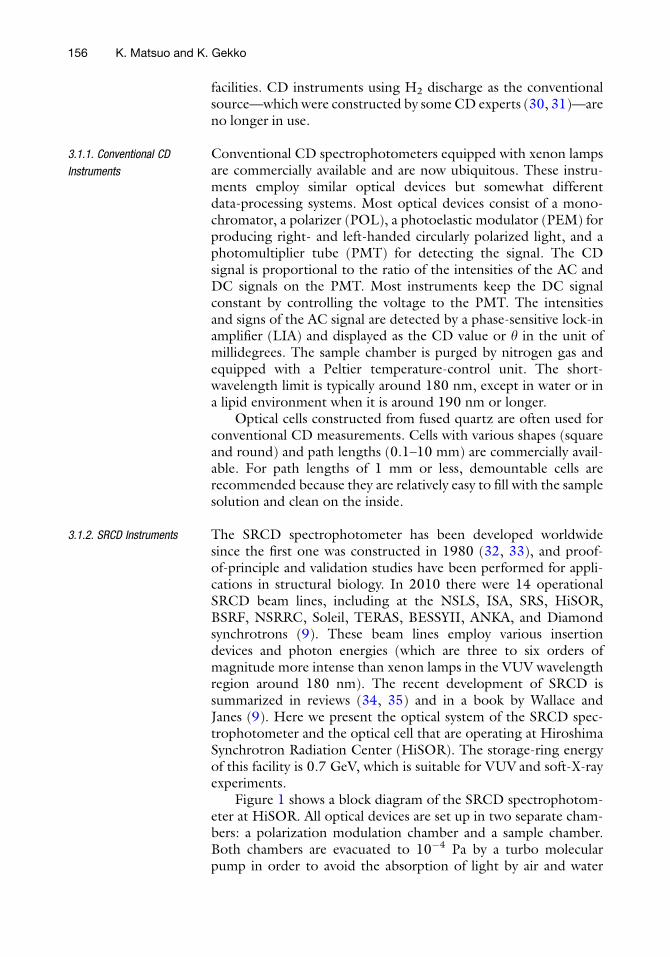
Conventional CD spectrophotometers equipped with xenon lampsare commercially available and are now ubiquitous. These instru-ments employ similar optical devices but somewhat differentdata-processing systems. Most optical devices consist of a mono-chromator, a polarizer (POL), a photoelastic modulator (PEM) forproducing right- and left-handed circularly polarized light, and aphotomultiplier tube (PMT) for detecting the signal. The CDsignal is proportional to the ratio of the intensities of the AC andDC signals on the PMT. Most instruments keep the DC signalconstant by controlling the voltage to the PMT. The intensitiesand signs of the AC signal are detected by a phase-sensitive lock-inamplifier (LIA) and displayed as the CD value or y in the unit ofmillidegrees. The sample chamber is purged by nitrogen gas andequipped with a Peltier temperature-control unit. The short-wavelength limit is typically around 180 nm, except in water or ina lipid environment when it is around 190 nm or longer.
Optical cells constructed from fused quartz are often used forconventional CD measurements. Cells with various shapes (squareand round) and path lengths (0.1–10 mm) are commercially avail-able. For path lengths of 1 mm or less, demountable cells arerecommended because they are relatively easy to fill with the samplesolution and clean on the inside.
3.1.2. SRCD Instruments The SRCD spectrophotometer has been developed worldwidesince the first one was constructed in 1980 (32, 33), and proof-of-principle and validation studies have been performed for appli-cations in structural biology. In 2010 there were 14 operationalSRCD beam lines, including at the NSLS, ISA, SRS, HiSOR,BSRF, NSRRC, Soleil, TERAS, BESSYII, ANKA, and Diamondsynchrotrons (9). These beam lines employ various insertiondevices and photon energies (which are three to six orders ofmagnitude more intense than xenon lamps in the VUV wavelengthregion around 180 nm). The recent development of SRCD issummarized in reviews (34, 35) and in a book by Wallace andJanes (9). Here we present the optical system of the SRCD spec-trophotometer and the optical cell that are operating at HiroshimaSynchrotron Radiation Center (HiSOR). The storage-ring energyof this facility is 0.7 GeV, which is suitable for VUV and soft-X-rayexperiments.
Figure 1 shows a block diagram of the SRCD spectrophotom-eter at HiSOR. All optical devices are set up in two separate cham-bers: a polarization modulation chamber and a sample chamber.Both chambers are evacuated to 10�4 Pa by a turbo molecularpump in order to avoid the absorption of light by air and water
156 K. Matsuo and K. Gekko

vapor; this contrasts with most other SRCD instruments beingpurged with nitrogen gas. The sample chamber is separated fromthe polarization modulation chamber by a gate valve, which allowsthe sample to be exchanged while maintaining a high vacuum in themodulation chamber. The incident light from a monochromator isseparated into two orthogonal linearly polarized light beams by anMgF2 polarizer. Both linearly polarized light beams are modulatedinto circularly polarized light at 50 kHz by an LiF PEM. The mainlight beam is directed to the sample cell, and the CD signal isdetected using the main PMT, which is covered by an MgF2 win-dow. The CD signal is rectified and amplified by the LIA and finallyrecorded on a personal computer. Another light beam, which isdetected by a reference PMT, is used as a reference signal toaccurately control the PEM and stabilize the LIA. Although it isgenerally difficult to obtain optimal driving voltages for the PEMdue to refractive-index dispersion, this double-beam system—aso-called servo-control system (16, 36, 37)—achieves achromaticmodulation and compensation for the thermal drift of the PEM inthe VUV region. The offset signal due to the strain birefringenceof the MgF2 window on the main PMT can be minimized byrotating the PMT using a differentially pumping rotary feed-through apparatus. Damage to the sample by the SR irradiationcan be avoided, when necessary, using a shutter that opens auto-matically only when signals are being accumulated.
Figure 2 shows a schematic of the optical cell for SRCD mea-surements, which consists of a stainless-steel container with a cylin-drical screw and two CaF2 (or MgF2) windows that are 20 mm indiameter and 1 mm thick (see Note 2). The optical path length canbe adjusted over the range from 1.3 mm (without a spacer) to100 mm (with donut-shaped Teflon spacers) (see Note 3). Thesample solution in the cell is sealed with three fluoride-rubber O-rings (38) (see Note 4). The optical cell is assembled by first settingup two O-rings and a CaF2 disc on a stainless-steel bottom block.
Fig. 1. Block diagram of an SRCD spectrophotometer. A preamplifier, Amp amplifier, ANA analyzer, GV gate valve, HVhigh-voltage supply,MRmirror, PEM photoelastic modulator, PMT photomultiplier tube, POL polarizer, S shutter, TMP turbomolecular pump (Adapted from Ref. 16).
8 Circular-Dichroism and Synchrotron-Radiation Circular-Dichroism. . . 157
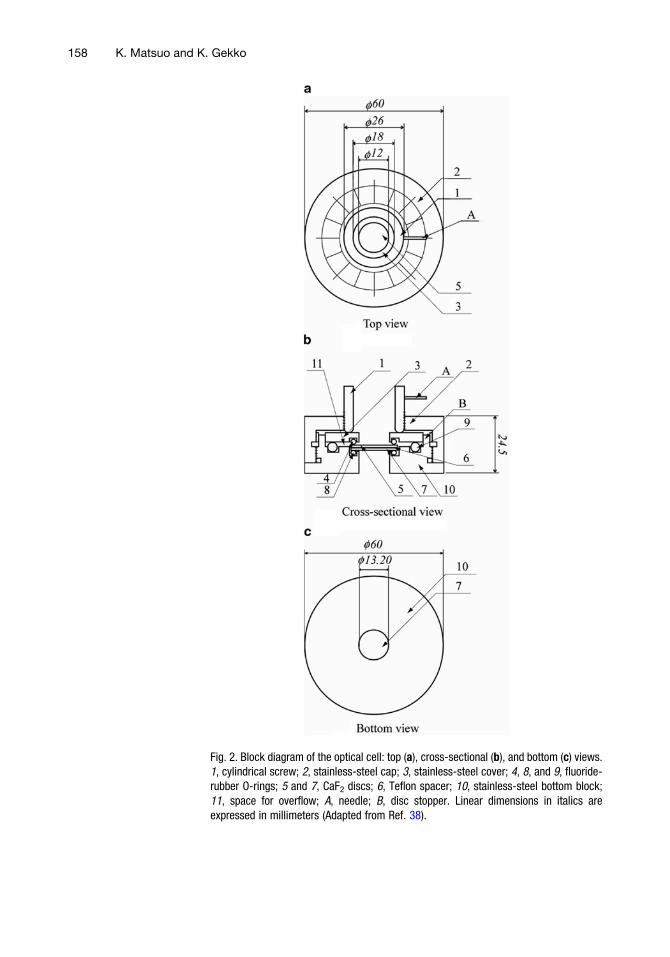
Fig. 2. Block diagram of the optical cell: top (a), cross-sectional (b), and bottom (c) views.1, cylindrical screw; 2, stainless-steel cap; 3, stainless-steel cover; 4, 8, and 9, fluoride-rubber O-rings; 5 and 7, CaF2 discs; 6, Teflon spacer; 10, stainless-steel bottom block;11, space for overflow; A, needle; B, disc stopper. Linear dimensions in italics areexpressed in millimeters (Adapted from Ref. 38).
158 K. Matsuo and K. Gekko
A spacer to produce the required path length is then placed on theCaF2 disc, and the sample solution is mounted at the center of thisdisc. The sample solution is then covered by another CaF2 disc andsealed by a stainless-steel cover with an O-ring (see Note 5). Any ofthe sample that overflows through the spacer is trapped in a separatespace. Finally, these assembled components are tightly fixed by astainless-steel cap and the cell windows are pressed uniformly byturning the needle of a cylindrical screw to a position indicated onthe steel cap. The CaF2 discs and the spacer are fixed by a stopperon the bottom block. These accessories are useful for reassemblingthe cell with good reproducibility (see Note 6). Before assemblingthe cell, the CaF2 discs and the spacer are cleaned with distilledwater and ethanol (38). This sample cell is designed so that it canalso be used in a conventional CD instrument to enable easycalibration of the path length and the sample concentration. Thetemperature of the sample is regulated between �20 and 70�C bythe Peltier thermoelectric element (see Note 7).
3.1.3. Calibration of CD
Instruments
The wavelength and intensity of the spectra must be calibrated inconventional CD and SRCD spectrophotometers using standardmaterials (see Note 8). For accuracy, calibration should be per-formed at more than one wavelength in order to confirm the linearwavelength dependence of the intensity over the full wavelengthrange of a measured protein spectrum. D-(+)-10-camphorsulfonicacid and ammonium camphorsulfonate are typically used as thestandards because they have two characteristic CD peaks at290.5 nm (De ¼ +2.36) and 192.5 nm (De ¼ �4.72) (39).
3.2. CD Measurements CD measurements can be made using a conventional instrumentfollowing the attached manual describing the adjustable para-meters, such as the scan speed, time constant, bandwidth, andaccumulation time. The scan speed and time constant are impor-tant because the resolution of the CD spectrum is dominantlyaffected by the combination of these two parameters. A samplewith strong absorption often produces a large amount of noise inthe CD spectrum. The signal-to-noise (S/N) ratio can be improvedby increasing the time constant and accumulation time within alimited range. When the sample solution scatters light, its contri-bution to the CD spectrum may be reduced by using a short-path-length cell and by positioning the sample cell near the detector ofthe CD instrument. The CD spectrum of the solvent needs to bemeasured before performing the sample measurements since evenwater (which has no chirality) generally exhibits small baselinesignals over a wide wavelength range due to the inevitable opticalconstraints of CD instruments. The true CD spectrum of thesample is then obtained by subtracting the solvent spectrum fromthe observed sample spectrum.
8 Circular-Dichroism and Synchrotron-Radiation Circular-Dichroism. . . 159
SRCDmeasurements are basically the same as conventional CDmeasurements. Since a short-path-length cell (<50 mm) is used inSRCDmeasurements to reduce the absorption of the solvent in theVUV region (see Note 9), SRCD measurements require a higherprotein concentration than conventional CD measurements. Theeffects of increased light scattering in the VUV region might bereduced by ensuring that the sample cell and detector (i.e., thePMT) are as close as possible. The S/N ratio can also be improvedby performing repeated scans (e.g., 16 accumulations), althoughlong-time data acquisition should be avoided in order to protectthe sample from damage induced by SR irradiation when usinghigh-flux beam lines (greater than 2 GeV) (see Note 10).
Accurate knowledge of both the path length of the cell and theprotein concentration is needed to obtain reliable CD spectra.Although the path lengths of commercially available cells are indi-cated by their manufacturers, it is desirable to check their pathlengths using the standard sample of known concentration andabsorption (or ellipticity) at a given wavelength. When usingshort-path-length cells (<50 mm) for SRCD measurements, theinterference-fringe method using a UV spectrophotometer is use-ful, although it is only applicable to an empty cell. An alternativemethod employs confocal laser microscopy to determine the gapbetween the windows with an accuracy of 0.1 mm for the solution-mounted cell, but this is expensive and requires a high degree oftechnical skill. A more convenient method is to normalize the CDspectra measured using a short-path-length cell (<50 mm) withthose measured using a longer-path-length cell (e.g., 1 mm) ofknown accuracy in the wavelength region where their spectra over-lap. This method is available for very-short-path-length cells,including those without spacers.
3.3. Secondary-
Structure Analysis
of Proteins
CD spectra of a protein in the far-UV and VUV regions sensitivelyreflect secondary structures such as a-helices, b-sheets, turns, andunordered structures. Therefore, we can estimate the contents andthe numbers of segments of these secondary structures of anunknown protein from its CD spectra using some analytical pro-grams. These secondary-structure data can be further combinedwith bioinformatics to improve the sequence and tertiary-structurepredictions. These advancements in CD spectroscopy are due todevelopments in analytical programs and the extension of CDmeasurements to the VUV region. As demonstrated in Fig. 3, theSRCD spectra of proteins and the secondary-structure components(a-helix, b-sheet, turn, and unordered structures) exhibit charac-teristic peaks below 195 nm, thereby providing much more infor-mation on the secondary structures compared with conventionalfar-UV CD spectra. The secondary-structure analysis by CD spec-troscopy mainly consists of the following steps (as depicted by theprotocol in Fig. 3):
160 K. Matsuo and K. Gekko

1. Assign the secondary structures from atomic coordinates usingvarious programs (e.g.,DSSP, STRIDE, andXtlsstr) (10, 11, 40).
2. Estimate the secondary-structure contents using analyticalsoftware (e.g., CONTIN, SELCON3, and CDSSTR) (12).
3. Estimate the number of secondary-structure segments (41).
4. Predict the secondary-structure sequences based on bioinfor-matics (e.g., using an NN) (19).
5. Test the tertiary-structure models predicted by homologymodeling or ab initio calculations (22).
Each analytical step is described in more detail in Subhead-ings 3.3.1–3.3.6.
3.3.1. Secondary-Structure
Assignment from Atomic
Coordinates of Proteins
Estimating the secondary structures of an unknown proteinrequires their component spectra to be extracted from a set of CDspectra of reference proteins with known secondary structures. Thesecondary structures are assigned from the atomic coordinates ofproteins determined by X-ray crystallography or NMR spectros-copy, which are registered in the Protein Data Bank (PDB). DSSP,which is the most widely used assignment program (10), defines thesecondary structures based on the pattern of hydrogen-bondedgeometrical features and the solvent exposure and thus can assignthe a-, 310-, and p-helices, b-strands, turns, bends, and b-bridges atthe residue level (see Note 11). Another general-purpose program
Fig. 3. Scheme for the secondary-structure analysis of proteins by CD spectroscopy.
8 Circular-Dichroism and Synchrotron-Radiation Circular-Dichroism. . . 161

is STRIDE, which assigns the protein secondary structures bycombining the hydrogen-bond energy and statistically derivedbackbone torsion angle (40). This program can determine thesame types of secondary structures as determined by the DSSPprogram, except for bend structures. Both programs are adoptedas general assignment methods for protein secondary structures inthe PDB. Xtlsstr is a program that determines the secondary struc-tures visually based on two dihedral angles (z and t) and threedistances (two hydrogen bonds and one nonhydrogen bond) inamide–amide interactions. This program (unlike STRIDE andDSSP) can assign secondary structures without hydrogen bondsthat are outside the normal dihedral angles of the secondary struc-tures in a Ramachandran plot (11), thus providing informationabout a- and 310-helices, b-strands, hydrogen-bonded turns,nonhydrogen-bonded turns, and PPII (polyproline type II) helices.Xtlsstr might be useful for CD-spectroscopy-based secondary-structure analysis because CD recognizes not only the pattern ofhydrogen bonds but also the dihedral angles of amide groups (11).
3.3.2. Database of Protein
CD Spectra
A database of protein CD spectra needs to be available in order toanalyze the secondary-structure contents and numbers of seg-ments. Many databases containing a wide range of secondary struc-tures are available on the Internet (e.g., CDPro (http://lamar.colostate.edu/~sreeram/CDPro/) and DichroWeb (http://dichroweb.cryst.bbk.ac.uk/html/home.shtml)) (12, 42), butmost of them comprise the CD spectra of soluble proteins, andtheir utility in analyzing the CD spectra of membrane proteins hasbeen questioned. Park et al. suggested that membrane proteins areimmersed in a medium that has a much lower dielectric constantthan are soluble proteins, which affects the p–p* and n–p* transi-tions (43). Furthermore, the average chain length of a-helicesintegrated in plasma membrane (i.e., 22–28 residues) is abouttwice that of a-helices in soluble proteins. Wallace et al. revealedthat soluble and membrane proteins exhibit somewhat differentspectral characteristics by comparing the CD spectra of two solubleproteins (myoglobin and concanavalin A) and two membrane pro-teins (a mechanosensitive channel and a ferric enterobactin recep-tor) (44). On the other hand, Sreerama and Woody (whodeveloped the CDPro software including seven protein CD data-bases) found no evidence for wavelength shifts between the CDspectra of soluble and membrane proteins in a comparison of theCD spectra of 30 membrane proteins reported by Park et al. (43)with the SP43 soluble protein reference set in CDPro (45). Thus,while CD spectra might not differ significantly between membraneand soluble proteins, it is known that combining their data setsimproves the predictive accuracy of secondary-structure contentsand numbers of segments in both protein types (42, 45).
162 K. Matsuo and K. Gekko

3.3.3. Calculation
of Secondary-Structure
Contents
Many programs for analyzing secondary-structure contents use areference CD data set comprising many proteins with knownatomic coordinates (46). Typical programs are CONTIN (47),SELCON3 (48), CDSSTR (49), CCA (50), and K2D (51),which employ analytical techniques such as ridge regression(47), variable selection (49), singular value decomposition (48),convex constraint analysis (50), and NN methods (51). Theseprograms generally use the following matrix equation:
F ¼ XC (8)
where F and C are matrices consisting of the secondary-structurecontents and the CD spectra of n reference proteins, respectively.Transformation matrix X is solved using a least-squares method,and then the secondary-structure contents of an unknown proteincan be estimated from its CD spectrum. CONTIN, SELCON3,and CDSSTR are freeware programs (http://lamar.colostate.edu/~sreeram/CDPro/) that can provide the secondary-structure frac-tions under some general restrictions: the sum of the fractions isbetween 95 and 105%, each fraction is greater than –2.5%, and theroot-mean-square deviation between the reconstructed and experi-mental CD is less than 0.25 De. The accuracy of this method can beimproved by (1) increasing the number of reference proteins, (2)selecting an appropriate reference set from the large available set ofreference proteins, (3) stabilizing the least-squares analysis of X forthe large set of reference proteins, and (4) extending the short-wavelength limit of the CD spectra. It is the last one of these factorsthat an SRCD instrument addresses.
The improvement of the secondary-structure estimation wasevaluated using the root-mean-square deviation (RMSD) (d) andPearson correlation coefficient (r) between X-ray and CD esti-mates of a-helix, b-strand, turn, and unordered-structure con-tents. As the short-wavelength limit of CD spectra decreasesfrom 200 to 160 nm, the d values for a-helices, b-strands, andoverall performance decrease and the r values increase up to 0.937and 0.826 for a-helices and b-strands, respectively, indicating animproved estimation of secondary-structure contents (17, 18).The good performance of SRCD spectroscopy increases the num-ber of secondary-structure components to eight (52), whichare useful for estimating the numbers of a-helix and b-strandsegments.
3.3.4. Estimation
of Numbers of
Secondary-Structure
Segments
The numbers of a-helix and b-strand segments have been esti-mated from the CD spectra using two methods. Pancoska et al.used a matrix descriptor of secondary-structure segments for theNN-based analysis of proteins (53). Sreerama et al. estimatedthese numbers from the distorted residues in a-helices andb-strands, assuming that on average there are four and two dis-torted residues per a-helix and b-strand, respectively (41). In this
8 Circular-Dichroism and Synchrotron-Radiation Circular-Dichroism. . . 163

method, the secondary structures are classified into six types:regular a-helix (aR), distorted a-helix (aD), regular b-strand(bR), distorted b-strand (bD), turn, and unordered structure; inthis case matrix F in Eq. 8 involves six secondary-structure vectorsof n reference proteins. The numbers of a-helix and b-strandsegments calculated from the contents of aD and bD of 31 refer-ence proteins agree well with those obtained from X-ray struc-tures: the r values between the SRCD and X-ray estimates for thenumbers of a-helix and b-strand segments are 0.954 and 0.849,respectively, which correspond to root-mean-square differences of2.6 and 4.0. Thus, SRCD spectroscopy provides superior perfor-mance compared with conventional CD spectroscopy in estimat-ing not only the secondary-structure contents but also thenumbers of secondary-structure segments of proteins (17, 18).
3.3.5. Prediction
of Secondary-Structure
Sequences
CD spectroscopy in principle yields no information on thesequences of the secondary structures, but sequence-based predic-tion of a-helices, b-strands, and other structures is possible byexploiting the correlations between the X-ray structures andaminoacid sequences of many proteins without having to performother experiments. Various types of algorithm (Chou–Fasman,GOR, and Lim methods) have been developed for this purpose(54–56), and their predictive accuracy has been greatly improved byemploying various computational techniques, including NNs (57,58), Profile Network from HeiDelberg (59), discrimination ofsecondary-structure class (60), Predator (61), and Jpred (62).However, the accuracy of these computational predictions of thesecondary-structure contents and numbers of segments is lowerthan that of SRCD spectroscopy—the accuracy of these sequence-based algorithms should be improved by combining them with theSRCD data. Based on this idea, we developed a method for incor-porating SRCD data into the NN algorithm developed by Jones(63) to improve sequence-based prediction (VUVCD–NNmethod) (19).
The computational protocol for the VUVCD–NN method isshown in Fig. 4. The a-helix and b-strand weights (Wa and Wb) of20 amino acids are first calculated by the NNmethod (step 1 in thefigure) (see Note 12), and the positions of a-helices and b-strandsare then assigned based on the amino acid sequence in descendingorder of their weights until the determined numbers of a-helix andb-strand residues converge to those estimated in SRCD analysis.Those residues that are assigned as neither a-helices nor b-strandsare considered to be other structures (step 2). Overlapping of a-helix and b-strand segments is avoided using the following selectionrules: Overlapping regions (residues) are assigned to a-helices fortarget proteins that have more than twice as many a-helix residuesas b-strand residues, while they are assigned to b-strands for targetproteins that have more than twice as many b-strand residues as
164 K. Matsuo and K. Gekko

a-helix residues. For other target proteins, overlapping regions areassigned to either a-helices or b-strands by directly comparing theweights of the overlapping residues. Furthermore, short stretchescomprising less than four a-helix residues and less than twob-strand residues are classified as other structures since theseshort-peptide-length limits are used as the cutoff parameters ofsecondary structures in the DSSP program (10) (step 3). Theprocedures in steps 2 and 3 are repeated until the predicted num-bers of a-helix and b-strand residues (contents) agree with thoseestimated in SRCD analysis (step 4). The assignment is complete ifthe two estimates are consistent or if the sequence alignment mini-mizes the difference between the two estimates (step 5). Next, thenumbers of a-helix and b-strand segments estimated in SRCDanalysis are used in the NN calculation (step 6). If the predictednumbers of a-helix and b-strand segments do not agree with thoseestimated in SRCD analysis, the weights (Wa) of 20 amino acids for
Fig. 4. Computational protocol for combining SRCD data with the NN algorithm(VUVCD–NN method). Details are provided in the text (Adapted from Ref. 19).
8 Circular-Dichroism and Synchrotron-Radiation Circular-Dichroism. . . 165

a-helices are multiplied by factors from 0.1 to 2.0 until the pre-dicted numbers of segments converge to those obtained in theSRCD estimates (step 7). The assignment is complete if the twoestimates are consistent or if the sequence alignment minimizes thedifference between the two estimates (step 8).
The accuracy of predicting sequence-based secondarystructures using the VUVCD–NN method can be tested withthree indices: Q3, Csr, and the segment overlap value (SOV). Q3 isthe overall percentage of correctly predicted residues for a-helices,b-strands, and other structures (10); Csr is the correlation coeffi-cient between the success rates of different secondary structures,thereby reflecting a higher-ordered predictive accuracy (64); andthe SOV is a more meaningful measure of the secondary-structurepredictive accuracy since it is related to the types and positions ofsecondary-structure segments, in contrast to a per-residue assign-ment such as Q3 (65). These three indices evidently increase byintroducing the contents and numbers of segments and by selectingthe reference data set obtained from the SRCD spectra down to160 nm; for example, the Q3 value of the NN algorithm increasedfrom 70.9 to 74.9%. When combined with the currently bestsequence-prediction algorithms, the predictive accuracy could beenhanced to over 80%.
3.3.6. Testing
Tertiary-Structure Models
Secondary-structure information can be used to test the tertiary-structure models predicted by homology modeling or ab initiocalculations. There are many model-prediction methods, such asthe Modeler package (66–68), but it is generally difficult to selectthe most appropriate model to use. Secondary-structure informa-tion obtained by SRCD spectroscopy cannot prove which model iscorrect, but it can provide a novel criterion for eliminating certainmodels. Thus, SRCD spectroscopy and VUVCD–NN methods areindispensable tools for analyzing the structure of proteins that aredifficult targets in X-ray crystallography and NMR spectroscopy.
3.4. Application
to Nonintegral
Membrane Proteins
3.4.1. a-AmyloidPeptide bAP
a-Amyloid peptide bAP (residues 1–40) is a major component ofAlzheimer’s amyloid deposits and presumably exerts its neurotoxicaction via interactions with neuronal membranes. Terzi et al.measured the CD spectra of bAP in the absence and presenceof 1-palmitoyl-2-oleoyl-sn-glycero-3-phosphoglycerol (POPG) atbAP/POPG molar ratios of 1:11, 1:22, 1:55, and 1:110 andobserved distinct changes in the spectra, which suggest the presenceof an equilibrium conformation between coil and b-structuredaggregate at low bAP/POPG ratios and the transition from ab-structure to an a-helix at bAP/POPG ratios higher than 1:55(1). Bokvist et al. measured the CD spectra of bAP interacting withvesicles for different molar ratios of L-a-dimyristoylphosphatidyl-choline (DMPC) to DMPG (L-a-dimyristoylphosphatidylglycerol)(4). Based on the contents of a-helices, b-strands, and unordered
166 K. Matsuo and K. Gekko

structures, they suggested that there are two different membrane-binding mechanisms of bAP to hinder and accelerate aggregations.Yagi-Utsumi et al. measured the SRCD spectra of bAP down to175 nm in the absence and presence of monosialotetrahexosylgan-glioside (GM1) at bAP/GM1 ratios of 1:15 and 1:30 and foundthat the contents of a-helix, b-strand, turn, and unordered struc-tures depend on this ratio (23). Combining these data with NMRspectroscopy, they suggested that GM1 clusters promote specificbAP–bAP interactions that vary with the sizes and curvatures of theclusters.
3.4.2. a-Synuclein a-Synuclein (a-syn) plays an important role in lipid transport andsynaptic membrane biogenesis. Jo et al. measured the CD spectra ofa-syn in various membrane environments: 1-palmitoyl 2-oleoylphosphatidylcholine (POPC), 1-palmitoyl 2-oleoyl phosphatidyl-serine (POPS), phosphatidylcholine (PC), phosphatidylethanol-amine (PE), phosphatidic acid (PA), phosphatidylinositol, andphosphatidylserine (PS) (2). From the dependence of a-helix con-tent on the type of membranes, they showed that a-syn binds toacidic phospholipid vesicles (PS and PA), with this being signifi-cantly augmented by the presence of PE (neutral phospholipid).This result suggests that the interaction of a-syn with cellular mem-branes in vivo sensitively depends on the lipid compositions of themembranes. Perrin et al. measured the CD spectra of a-syn invarious vesicles (PS/PA, PS/PC, POPC/1-palmitoyl 2-oleoylphosphatidic acid, and POPC/POPS) and found a general correla-tion between the lipid-induced a-helix contents and the degree ofbinding to vesicles, which was applied to searching the lipid-bindingcapacity of the mutants associated with Parkinson’s disease (3).
3.4.3. a1-Acid Glycoprotein Human a1-acid glycoprotein (AGP) exhibits characteristic bindingabilities to numerous drugs as well as to steroid hormones. Thedrug-binding capacity of AGP is known to decrease upon interac-tion with biomembranes, indicating a large conformational changeof AGP (20). AGP is a glycoprotein containing five glycan chainscomprising about 40% of its total mass (36 kDa), and this has madeit a difficult target in X-ray crystallography and NMR spectroscopy.SRCD spectroscopy is highly advantageous for such glycoproteinsbecause it can detect the CD spectra of sugar moieties in the VUVregion below 200 nm.
Matsuo et al. measured the SRCD spectra of AGP down to160 nm in the absence and presence of liposomes of L-a-phosphati-dyl-DL-glycerol (PG) (22). As shown in Fig. 5, a liposome environ-ment induces a large change in the CD spectra corresponding to theconformational transition of AGP from a b-strand-rich to a-helix-rich structure, although these spectra are affected by the presence ofthe glycan moiety. To eliminate this affect, Matsuo et al. measuredthe SRCD spectra of the constituent sugars—L-fucose, D-mannose,
8 Circular-Dichroism and Synchrotron-Radiation Circular-Dichroism. . . 167

D-galactose, N-acetylglucosamine, and N-acetylneuraminic acid—and constructed the SRCD spectrum of the glycan moiety by com-bining these constituent spectra while considering the sugar compo-sitions in the glycan chains (Fig. 6). The SRCD spectra of the proteinmoiety of AGP, which were obtained by subtracting the glycan
160 180 200 220 240 260
-20
-10
0
10
20
30
40
–Liposome
Wavelength/nm
[q
] ×
10-3/ de
g c
m2
dmol
-1
+Liposome
Fig. 5. SRCD spectra of AGP in the absence and presence of liposomes at 25�C. Dottedlines show spectra of the protein moiety obtained by subtracting the spectra of the glycanmoiety (inset of Fig. 8.6) from the observed AGP spectra (Adapted from Ref. 22).
160 180 200 220 240 260-40
-30
-20
-10
0
10
20
Wavelength / nm
160 180 200 220 240 260-4
-2
0
2
4
6
Wavelength / nm
[q
] ×
10-3/ de
g c
m2
dmol
-1
[q
] ×
10-3/ de
g c
m2
dmol
-1
Fig. 6. SRCD spectra of the constituent sugars of AGP in water at 25�C: mannose(black line), fucose (green), galactose (pink), N-acetylglucosamine (red), and N-acetyl-neuraminic acid (blue). The inset shows the SRCD spectrum of the glycan moietycalculated from those of the constituent sugars (Adapted from Ref. 22).
168 K. Matsuo and K. Gekko
spectrum from the observed AGP spectra, are shown by dotted linesin Fig. 5, which indicates that the contributions of the glycan chainsare small but not negligible in secondary-structure analysis.
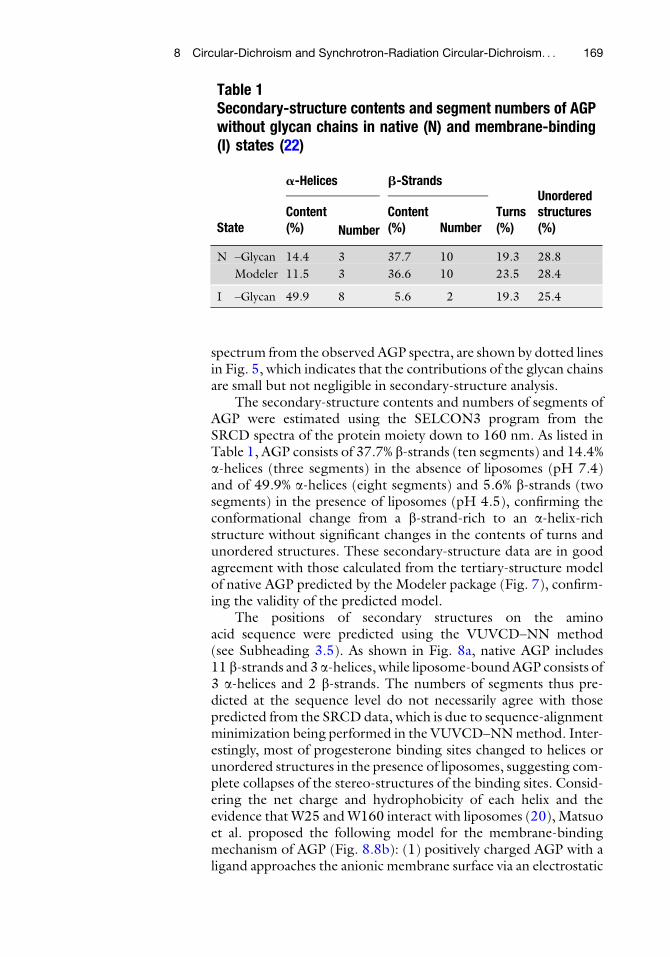
The secondary-structure contents and numbers of segments ofAGP were estimated using the SELCON3 program from theSRCD spectra of the protein moiety down to 160 nm. As listed inTable 1, AGP consists of 37.7% b-strands (ten segments) and 14.4%a-helices (three segments) in the absence of liposomes (pH 7.4)and of 49.9% a-helices (eight segments) and 5.6% b-strands (twosegments) in the presence of liposomes (pH 4.5), confirming theconformational change from a b-strand-rich to an a-helix-richstructure without significant changes in the contents of turns andunordered structures. These secondary-structure data are in goodagreement with those calculated from the tertiary-structure modelof native AGP predicted by the Modeler package (Fig. 7), confirm-ing the validity of the predicted model.
The positions of secondary structures on the aminoacid sequence were predicted using the VUVCD–NN method(see Subheading 3.5). As shown in Fig. 8a, native AGP includes11 b-strands and 3 a-helices, while liposome-boundAGP consists of3 a-helices and 2 b-strands. The numbers of segments thus pre-dicted at the sequence level do not necessarily agree with thosepredicted from the SRCD data, which is due to sequence-alignmentminimization being performed in the VUVCD–NNmethod. Inter-estingly, most of progesterone binding sites changed to helices orunordered structures in the presence of liposomes, suggesting com-plete collapses of the stereo-structures of the binding sites. Consid-ering the net charge and hydrophobicity of each helix and theevidence that W25 andW160 interact with liposomes (20), Matsuoet al. proposed the following model for the membrane-bindingmechanism of AGP (Fig. 8.8b): (1) positively charged AGP with aligand approaches the anionic membrane surface via an electrostatic
Table 1Secondary-structure contents and segment numbers of AGPwithout glycan chains in native (N) and membrane-binding(I) states (22)
State
a-Helices b-Strands
Turns(%)
Unorderedstructures(%)
Content(%) Number
Content(%) Number
N –Glycan 14.4 3 37.7 10 19.3 28.8
Modeler 11.5 3 36.6 10 23.5 28.4
I –Glycan 49.9 8 5.6 2 19.3 25.4
8 Circular-Dichroism and Synchrotron-Radiation Circular-Dichroism. . . 169
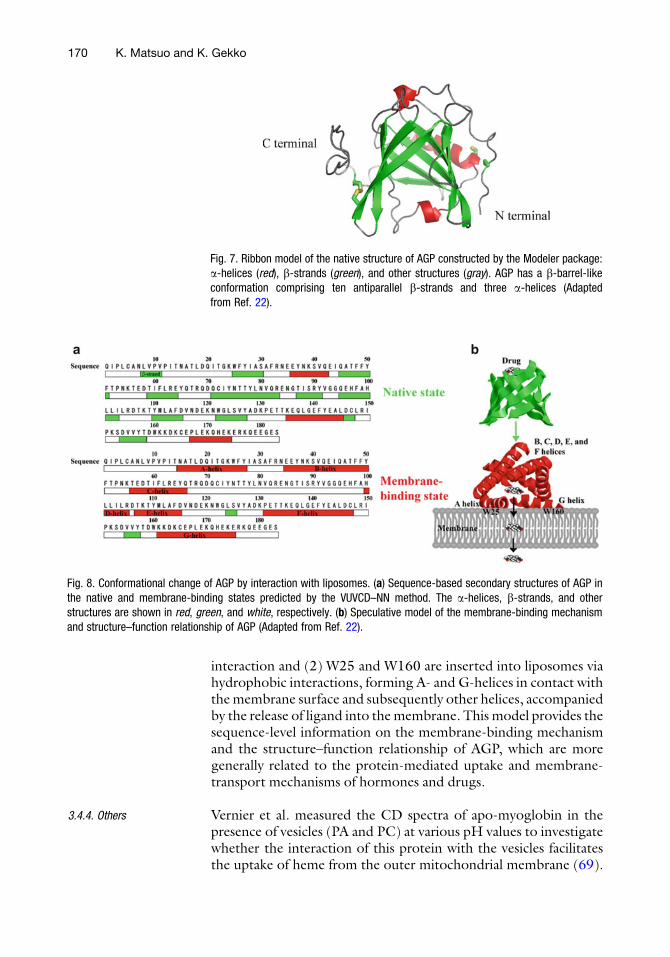
interaction and (2) W25 and W160 are inserted into liposomes viahydrophobic interactions, forming A- and G-helices in contact withthemembrane surface and subsequently other helices, accompaniedby the release of ligand into themembrane. This model provides thesequence-level information on the membrane-binding mechanismand the structure–function relationship of AGP, which are moregenerally related to the protein-mediated uptake and membrane-transport mechanisms of hormones and drugs.
3.4.4. Others Vernier et al. measured the CD spectra of apo-myoglobin in thepresence of vesicles (PA and PC) at various pH values to investigatewhether the interaction of this protein with the vesicles facilitatesthe uptake of heme from the outer mitochondrial membrane (69).
Fig. 8. Conformational change of AGP by interaction with liposomes. (a) Sequence-based secondary structures of AGP inthe native and membrane-binding states predicted by the VUVCD–NN method. The a-helices, b-strands, and otherstructures are shown in red, green, and white, respectively. (b) Speculative model of the membrane-binding mechanismand structure–function relationship of AGP (Adapted from Ref. 22).
Fig. 7. Ribbon model of the native structure of AGP constructed by the Modeler package:a-helices (red), b-strands (green), and other structures (gray). AGP has a b-barrel-likeconformation comprising ten antiparallel b-strands and three a-helices (Adaptedfrom Ref. 22).
170 K. Matsuo and K. Gekko
On the other hand, Zhang and Keiderling (70) and Zhang et al.(71) measured the CD spectra of b-lactoglobulin at various PGconcentrations to reveal a general mechanism of protein–mem-brane interactions. Arnulphi et al. examined the a-helix contentsof human apolipoprotein A-I bound to POPC in the presence ofsphingomyelin (SM) and cholesterol (Chol) (72) and found thatraft-like lipid domains composed of POPC, SM, and Chol reducefolding of this protein compared with Chol-free model membranes.
3.5. Application
to Integral
Membrane Proteins
3.5.1. Photoreceptor
Cyclic-Nucleotide-Gated
Channels
Photoreceptor cyclic-nucleotide-gated (CNG) channels are nonse-lective cation channels located in the plasma membrane of the outersegments, where certain transmembrane proteins function asimportant components of the visual transduction system. Matveevet al. applied CD spectroscopy to examine the influence of twomutations (R377W and F488L) of the CNGA3 subunit on thestructure and function of the channels (5). These mutationsdecreased the a-helicity of the protein, while the allosteric transi-tions by 8-pCPT-cGMP, cGMP, and cAMP were diminished in thetwo mutants. From these results they suggested that the observedalterations in the local secondary structure exert adverse effects onthe channel’s activity and cellular processing.
3.5.2. Protein-Dependent
Manganese Transporter
MntH (Escherichia coliprotein-dependentmanganese transporter) isan integral transmembrane protein comprising 11 transmembranesegments.Nunukova et al. synthesized three peptides correspondingto the sixth segment among them and measured the CD spectra ofthese peptides in the presence of MnCl2 and lipid membrane com-posed of 1,2-diphytanoyl-sn-glycero-3- phosphatidylcholine and1,2-diphytanoyl-sn-glycero-3-[phospho-rac-(1-glycerol)] at a molarratio of 3:1 (6). They found that these peptides interact with the lipidmembrane to induce a-helices and that their helicities are furtherincreased by adding MnCl2. They also measured the CD spectra ofthe peptides in trifluoroethanol solution and assessed their abilities toform manganese-conducting channels.
3.5.3. Equinatoxin II Equinatoxin II (EqtII) is a member of the actinoporin family of sea-anemone toxins that function by forming pores in cell membranes viaa multistep mechanism. Miles et al. measured the SRCD spectra ofEqtII down to 180 nm in the absence and presence of SUVs withdifferent lipid compositions (dioleoylphosphatidylcholine (DOPC),SM, and Chol) (21). All of the SRCD spectra were similar in the far-UV region, but they exhibited large differences in the peak positionsand intensities in the VUV region, depending on the lipid composi-tion. The secondary-structure contents of EqtII estimated by SRCDrevealed that EqtII is in the “bound” state of high lytic activity in thepresenceofDOPC/SMvesicles and in the “free” state in the presenceof DOPC or DOPC/Chol vesicles, indicating the lipid specificity forstructural rearrangements of EqtII associated with toxicity and lysisfunctions.
8 Circular-Dichroism and Synchrotron-Radiation Circular-Dichroism. . . 171

3.5.4. Others SRCD spectroscopy has often been used to monitor structuralchanges of other integral membrane proteins (73–75). Miles et al.measured the SRCD spectra of pig Na, K-ATPase down to 175 nmin the membrane-bound state at various temperatures and showedthat the loss of enzymatic activity is correlated with changes in theprotein secondary structures (73). Cronin et al. investigatedthe effects of deglycosylation of sodium channels on the secondarystructures using an SRCD spectrophotometer (74). Furthermore,McKibbin et al. used SRCD spectroscopy to monitor structuralchanges of rhodopsin and opsin aged for 1–6 h in DMPC/DHPC (L-a-1,2-dihexanoyl-sn-glycero-3-phosphocholine) vesiclesat room temperature (75).
3.6. Future Prospects We have demonstrated that CD spectroscopy is a powerful tech-nique for monitoring the conformational changes of nonintegraland integral membrane proteins. Developments in SRCD instru-ments and in programs for analyzing CD spectra have yieldeddetailed secondary-structure information—in terms of the contentsand numbers of segments, and the amino acid sequences—thatcannot be obtained by conventional CD instruments, therebyproviding new insight into the structure–function relationships ofproteins in a membrane environment. The structures of a hugenumber of membrane proteins have barely been analyzed by X-raycrystallography or NMR spectroscopy, and hence CD and SRCDspectroscopy will play important roles in the structural biology ofmembrane proteins.
4. Notes
1. Since a high protein concentration is used in CD measure-ments, the protein solution must be diluted with solvent tothe concentration at which A280 ¼ 0.5 ~ 1.0. The proteinconcentration is calculated from the A280 value multiplied bythe dilution factor determined using the volume or weight ofthe protein solution and the solvent.
2. Optical crystal discs of CaF2 and MgF2 are commercially avail-able. However, the c-axis-cut disc should be customized forMgF2 to eliminate the birefringence effects of the cell, whichaffect the baseline and CD signal in the VUV region.
3. A homemade die can be used to cut the donut-shaped spacerfrom a Teflon sheet of the desired thickness (5–100 mm).
4. The O-rings, 4, 8, and 9 in Fig. 2 might be coated with ahigh-vacuum grease to completely seal the sample solution.
172 K. Matsuo and K. Gekko

5. The formation of air bubbles in the sample cell can be avoidedby using tweezers to carefully and slowly place the cover disc onthe surface of the sample solution.
6. Reproducible CD data can be obtained in separate measure-ments by always fixing the discs at the same position marked ontheir edge when assembling the optical cell.
7. The temperature of sample solution can be determined with anaccuracy of �1�C from the calibrated temperature differencebetween the heat conductor and the cell windows. Waterwithin a sufficiently narrow space does not freeze at subzerotemperatures, and hence the sample solution can be cooleddown to �17 and �10�C without freezing by using cells withpath lengths of 25 and 50 mm, respectively. No frost is formedon the cell windows because the cell is kept under vacuum.
8. It is desirable to routinely calibrate the instrument.
9. A 50-mm path length is available for measurements down to175 nm, but measurements below 175 nm must be carried outwithout a spacer in order to reduce the effect of light absorp-tion by water.
10. Damage to the sample can be detected by monitoring spectralchanges during the measurements (1–3 h).
11. The structures denoted as “H” and “E” in DSSP are desig-nated as a-helices and b-strands, respectively, and 310-helices(“G”), p-helices (“I”), turns (“T”), bends (“S”), b-bridges(“B”), and blanks (“”) are grouped into “others” in theVUVCD–NN method.
12. The training data set is prepared from the protein structures inthe PDB using a resolution cutoff of 2.0 A for X-ray structuresand by selecting the subsets of residues with an RMSD for theCa–Ca distance of less than 1.0 A for NMR structures. Smallproteins comprising less than 30 amino acid residues and pro-teins containing more than 5% unidentified sequences are notused. Proteins with sequence similarities greater than 25% areeliminated using Hobohm algorithm #1 (76). Finally, a data setof 607 chains is obtained as a training set for the NN algorithmby manually eliminating any chain breaks. The secondary struc-tures of these training proteins and their amino acid sequenceinformation are determined by the PSSM (position-specificscoring matrices) program (63) and used to calculate theweights and biases of 20 amino acids for a-helices and b-strandswith 15 window positions and no hidden layer using the publicfree simulation package Stuttgart Neural Network Simulator(version 4.2) (77) with a momentum term of 0.5 and a learningrate of 0.0001. The threshold criterion for assigning a-helicesand b-strands is 0.37.
8 Circular-Dichroism and Synchrotron-Radiation Circular-Dichroism. . . 173

References
1. Terzi E, Holzemann G, Seelig J (1997) Inter-action of Alzheimer b-amyloid peptide (1–40)with lipid membranes. Biochemistry36:14845–14852
2. Jo E, McLaurin J, Yip CM, St G-HP, Fraser PE(2000) alpha-Synuclein membrane interactionsand lipid specificity. J Biol Chem275:34328–34334
3. Perrin RJ, Woods WS, Clayton DF, George JM(2000) Interaction of human alpha-synucleinand Parkinson’s disease variants with phospho-lipids. Structural analysis using site-directedmutagenesis. J Biol Chem 275:34393–34398
4. Bokvist M, Lindstrom F, Watts A, Grobner G(2004) Two types of Alzheimer’s beta-amyloid(1–40) peptide membrane interactions: aggre-gation preventing transmembrane anchoringversus accelerated surface fibril formation.J Mol Biol 335:1039–1049
5. Matveev AV, Fitzgerald JB, Xu J, MalykhinaAP, Rodgers KK, Ding XQ (2010) Thedisease-causing mutations in the carboxyl ter-minus of cone cyclic nucleotide-gated channelCNGA3 subunit alter the local secondarystructure and interfere with the channel activeconformational change. Biochemistry49:1628–1639
6. Nunukova V, Urbankova E, Jelokhani-NiarakiM, Chaloupka R (2010) Ion channel activity oftransmembrane segment 6 of Escherichia coliproton-dependent manganese transporter.Biopolymers 93:718–726
7. Fasman GR (1996) Circular dichroism and theconformational analysis of biomolecules. Ple-num, New York
8. Berova N, Nakanishi K, Woody RW (2000)Circular dichroism: principles and applications,2nd edn. Wiley-VCH, New York
9. Wallace BA, Janes RW (2009) Modern techni-ques for circular dichroism and synchrotronradiation circular dichroism spectroscopy.IOS, Amsterdam
10. Kabsch W, Sander C (1983) Dictionary of pro-tein secondary structure: pattern recognitionof hydrogen-bonded and geometric features.Biopolymers 22:2577–2637
11. King SM, Johnson WC (1999) Assigning sec-ondary structure from protein coordinate data.Proteins 35:313–320
12. Sreerama N, Woody RW (2000) Estimation ofprotein secondary structure from circulardichroism spectra: comparison of CONTIN,SELCON, and CDSSTR methods with anexpanded reference set. Anal Biochem287:252–260
13. Toumadje A, Alcorn SW, Johnson WC Jr(1992) Extending CD spectra of proteins to168 nm improves the analysis for secondarystructures. Anal Biochem 200:321–331
14. Sutherland JC, Emrick A, France LL, Monte-leone DC, Trunk J (1992) Circular dichroismuser facility at the National Synchrotron LightSource: estimation of protein secondary struc-ture. Biotechniques 13:588–590
15. Wallace BA (2000) Conformational changes bysynchrotron radiation circular dichroism spec-troscopy. Nat Struct Biol 7:708–709
16. Ojima N, Sakai K, Fukazawa T, Gekko K(2000) Vacuum-ultraviolet circular dichroismspectrophotometer using synchrotron radia-tion: optical system and off-line performance.Chem Lett 29:832–833
17. Matsuo K, Yonehara R, Gekko K (2004)Secondary-structure analysis of proteins byvacuum-ultraviolet circular dichroism spectros-copy. J Biochem 135:405–411
18. Matsuo K, Yonehara R, Gekko K (2005)Improved estimation of the secondary struc-tures of proteins by vacuum-ultraviolet circulardichroism spectroscopy. J Biochem 138:79–88
19. Matsuo K, Watanabe H, Gekko K (2008)Improved sequence-based prediction of pro-tein secondary structures by combiningvacuum-ultraviolet circular dichroism spectros-copy with neural network. Proteins73:104–112
20. Nishi K, Maruyama T, Halsall HB, Handa T,Otagiri M (2004) Binding of alpha1-acid gly-coprotein to membrane results in a uniquestructural change and ligand release. Biochem-istry 43:10513–10519
21. Miles AJ, Drechsler A, Kristan K, Anderluh G,Norton RS, Wallace BA, Separovic F (2008)The effects of lipids on the structure of theeukaryotic cytolysin equinatoxin II: a synchro-tron radiation circular dichroism spectroscopicstudy. Biochim Biophys Acta 1778:2091–2096
22. Matsuo K, Namatame H, Taniguchi M, GekkoK (2009) Membrane-induced conformationalchange of alpha1-acid glycoprotein character-ized by vacuum-ultraviolet circular dichroismspectroscopy. Biochemistry 48:9103–9111
23. Yahi-Utsumi M, Matsuo K, Yanagisawa K,Gekko K, Kato K (2011) Spectroscopic charac-terization of intermolecular interaction of amy-loid beta promoted on GM1 micelles. Int JAlzheimers Dis. doi:10.4061/2011/925073
24. Bradford MM (1976) A rapid and sensitivemethod for the quantitation of microgramquantities of protein utilizing the principle of
174 K. Matsuo and K. Gekko

protein-dye binding. Anal Biochem72:248–254
25. Lowry OH, Rosebrough NJ, Farr AL, RandallRJ (1951) Protein measurement with the folinphenol reagent. J Biol Chem 193:265–275
26. Smith PK, Krohn RI, Hermanson GT, MalliaAK, Gartner FH, Provenzano MD, FujimotoEK, Goeke NM, Olson BJ, Klenk DC (1985)Measurement of protein using bicinchoninicacid. Anal Biochem 150:76–85
27. Edelhoch H (1967) Spectroscopic determina-tion of tryptophan and tyrosine in proteins.Biochemistry 6:1948–1954
28. Gill SC, von Hippel PH (1989) Calculation ofprotein extinction coefficients from amino acidsequence data. Anal Biochem 182:319–326
29. Wallace BA, Mao D (1984) Circular dichroismanalyses of membrane proteins: an examinationof differential light scattering and absorptionflattening effects in large membrane vesiclesand membrane sheets. Anal Biochem142:317–328
30. Johnson CW Jr (1978) Circular dichroismspectroscopy and the vacuum ultravioletregion. Annu Rev Phys Chem 29:93–114
31. Pysh ES (1976) Optical activity in the vacuumultraviolet. Annu Rev Biophys Bioeng 5:63–75
32. Snyder PA, Rowe EM (1980) The first use ofsynchrotron radiation for vacuum ultravioletcircular dichroism measurements. NuclInstrum Methods 172:345–349
33. Sutherland JC, Keck PC, Griffin KP, Takacs PZ(1982) Simultaneous measurement of absorp-tion and circular dichroism in a synchrotronspectrometer. Nucl Instrum Methods195:375–379
34. Wallace BA (2009) Protein characterisation bysynchrotron radiation circular dichroism spec-troscopy. Q Rev Biophys 42:317–370
35. Wallace BA, Gekko K, Hoffmann SV, Lin YH,Sutherland JC, Tao J, Wien F, Janes RW(2010) Synchrotron radiation circular dichro-ism (SRCD) spectroscopy: an emergingmethod in structural biology for examiningprotein conformations and protein interac-tions. Nucl Instr Methods Phys Res A649:177–178
36. Matsuo K, Matsushima Y, Fukuyama T, SenbaS, Gekko K (2002) Vacuum-ultraviolet circulardichroism of amino acids as revealed by syn-chrotron radiation spectrophotometer. ChemLett 31:826–827
37. Matsuo K, Fukuyama T, Yonehara R,Namatame H, Taniguchi M, Gekko K (2005)Vacuum-ultraviolet circular dichroism spectro-photometer using synchrotron radiation.
J Electron Spectrosc Relat Phenom144–147:1023–1025
38. Matsuo K, Sakai K, Matsushima Y, FukuyamaT, Gekko K (2003) Optical cell with atemperature-control unit for a vacuum-ultraviolet circular dichroism spectrophotome-ter. Anal Sci 19:129–132
39. Takakuwa T, Konno T, Meguro H (1985)A new standard substance for calibration ofcircular dichroism: ammonium d-10-camphor-sulfonate. Anal Sci 1:215–218
40. Frishman D, Argos P (1995) Knowledge-basedprotein secondary structure assignment. Pro-teins 23:566–579
41. Sreerama N, Venyaminov SY, Woody RW(1999) Estimation of the number of alpha-helical and beta-strand segments in proteinsusing circular dichroism spectroscopy. ProteinSci 8:370–380
42. Abdul-Gader A,Miles AJ, Wallace BA (2011) Areference dataset for the analyses of membraneprotein secondary structures and transmem-brane residues using circular dichroism spec-troscopy. Bioinformatics 27:1630–1636
43. Park K, Perczel A, Fasman GD (1992) Differ-entiation between transmembrane helices andperipheral helices by the deconvolution of cir-cular dichroism spectra of membrane proteins.Protein Sci 1:1032–1049
44. Wallace BA, Lees JG, Orry AJ, Lobley A, JanesRW (2003) Analyses of circular dichroism spec-tra of membrane proteins. Protein Sci12:875–884
45. Sreerama N, Woody RW (2004) On the analy-sis of membrane protein circular dichroismspectra. Protein Sci 13:100–112
46. Woody RW (1995) Circular dichroism. Meth-ods Enzymol 246:34–71
47. Provencher SW, Glockner J (1981) Estimationof globular protein secondary structure fromcircular dichroism. Biochemistry 20:33–37
48. Sreerama N, Woody RW (1993) Aself-consistent method for the analysis of pro-tein secondary structure from circular dichro-ism. Anal Biochem 209:32–44
49. Johnson WC (1999) Analyzing protein circulardichroism spectra for accurate secondary struc-tures. Proteins 35:307–312
50. Perczel A, Hollosi M, Tusnady G, Fasman GD(1991) Convex constraint analysis: a naturaldeconvolution of circular dichroism curves ofproteins. Protein Eng 4:669–679
51. Bohm G, Muhr R, Jaenicke R (1992)Quantitative analysis of protein far UV circulardichroism spectra by neural networks. ProteinEng 5:191–195
8 Circular-Dichroism and Synchrotron-Radiation Circular-Dichroism. . . 175

52. Klose DP, Wallace BA, Janes RW (2010)2Struc: the secondary structure server.Bioinformatics 26:2624–2625
53. Pancoska P, Janota V, Keiderling TA (1999)Novel matrix descriptor for secondary struc-ture segments in proteins: demonstration ofpredictability from circular dichroism spectra.Anal Biochem 267:72–83
54. Chou PY, Fasman GD (1974) Conformationalparameters for amino acids in helical, beta-sheet, and random coil regions calculatedfrom proteins. Biochemistry 13:211–222
55. Garnier J, Osguthorpe DJ, Robson B (1978)Analysis of the accuracy and implications ofsimple methods for predicting the secondarystructure of globular proteins. J Mol Biol120:97–120
56. Lim VI (1974) Structural principles of theglobular organization of protein chains. A ste-reochemical theory of globular protein second-ary structure. J Mol Biol 88:857–872
57. Qian N, Sejnowski TJ (1988) Predicting thesecondary structure of globular proteins usingneural network models. J Mol Biol202:865–884
58. Holley LH, Karplus M (1989) Protein second-ary structure prediction with a neural network.Proc Natl Acad Sci U S A 86:152–156
59. Rost B, Sander C (1993) Prediction of proteinsecondary structure at better than 70% accu-racy. J Mol Biol 232:584–599
60. King RD, Sternberg MJ (1996) Identificationand application of the concepts important foraccurate and reliable protein secondary struc-ture prediction. Protein Sci 5:2298–2310
61. Frishman D, Argos P (1996) Incorporation ofnon-local interactions in protein secondarystructure prediction from the amino acidsequence. Protein Eng 9:133–142
62. Cuff JA, Barton GJ (1999) Evaluation andimprovement of multiple sequence methodsfor protein secondary structure prediction.Proteins 34:508–519
63. Jones DT (1999) Protein secondary structureprediction based on position-specific scoringmatrices. J Mol Biol 292:195–202
64. Matthews BW (1975) Comparison of the pre-dicted and observed secondary structure of T4phage lysozyme. Biochim Biophys Acta405:442–451
65. Zemla A, Venclovas C, Fidelis K, Rost B (1999)A modified definition of Sov, a segment-basedmeasure for protein secondary structureprediction assessment. Proteins 34:220–223
66. Martı-RenomMA, Stuart AC, Fiser A, SanchezR, Melo F, Sali A (2000) Comparative proteinstructure modeling of genes and genomes.Annu Rev Biophys Biomol Struct 29:291–325
67. Simons KT, Bonneau R, Ruczinski I, Baker D(1999) Ab initio protein structure predictionof CASP III targets using ROSETTA. Proteins37:171–176
68. Takada S (2001) Protein folding simulationwith solvent-induced force field: folding path-way ensemble of three-helix-bundle proteins.Proteins 42:85–98
69. Vernier G, Chenal A, Vitrac H, Barumand-zadhe R, Montagner C, Forge V (2007) Inter-actions of apomyoglobin with membranes:Mechanisms and effects on heme uptake. Pro-tein Sci 16:391–400
70. Zhang X, Keiderling TA (2006) Lipid-inducedconformational transitions of beta-lactoglobulin. Biochemistry 45:8444–8452
71. Zhang X, Ge N, Keiderling TA (2007) Electro-static and hydrophobic interactions governingthe interaction and binding of beta-lactoglobulin to membranes. Biochemistry46:5252–5260
72. Arnulphi C, Sanchez SA, Tricerri MA, GrattonE, Jonas A (2005) Interaction of human apoli-poprotein A-I with model membranes exhibit-ing lipid domains. Biophys J 89:285–295
73. Miles AJ, Wallace BA, Esmann M (2011) Cor-relation of structural and functional thermalstability of the integral membrane protein Na,K-ATPase. Biochim Biophys Acta1808:2573–2580
74. Cronin NB, O’Reilly A, Duclohier H, WallaceBA (2005) Effects of deglycosylation ofsodium channels on their structure and func-tion. Biochemistry 44:441–449
75. McKibbin C, Farmer NA, Jeans C, Reeves PJ,Khorana GH, Wallace BA, Edwards PC, VillaC, Booth PJ (2007) Opsin stability and fold-ing: modulation by phospholipid bicelles.J Mol Biol 374:1319–1332
76. Hobohm U, Scharf M, Schneider R, Sander C(1992) Selection of representative protein datasets. Protein Sci 1:409–417
77. Zell A, Mamier G, Vogt M, Mache N, HubnerR, Doring S, Herrmann KW, Soyez T, SchmalzlM, Sommer T, Hatzigeorgiou A, Posselt D,Schreiner T, Kett B, Clemente G, Wieland J(1995) Stuttgart Neural Network Simulator,Version 4.2. University of Stuttgart, Stuttgart,Germany. http://www.ra.cs.uni-tuebingen.de/downloads/SNNS/
176 K. Matsuo and K. Gekko